


1. Introduction
Basal channels are incised troughs found beneath ice shelves in Antarctica and beneath floating ice tongues in Greenland (Alley and others, Reference Alley, Scambos and Alley2023). Basal channels develop through positive feedbacks between melt and channel depth. Buoyant plumes of relatively warm water are concentrated in the high points of the basal channels, and the warm water causes enhanced melt relative to the surrounding shelf (Alley and others, Reference Alley, Scambos, Siegfried and Fricker2016). Channels have been observed directly by sending autonomous underwater vehicles beneath ice shelves (Dutrieux and others, Reference Dutrieux2014; Wåhlin and others, Reference Wåhlin2024) and using ice-penetrating radar (Stanton, Reference Stanton2013; Langley and others, Reference Langley2014). Since larger channels cause depressions at the surface due to floatation, they can also be observed using altimetry or even imagery (e.g. Gourmelen and others, Reference Gourmelen2017; Shean and others, Reference Shean, Joughin, Dutrieux, Smith and Berthier2019; Zinck and others, Reference Zinck, Wouters, Lambert and Lhermitte2023). This surface expression has allowed channels to be observed almost pervasively across Antarctic ice shelves (Alley and others, Reference Alley, Scambos, Siegfried and Fricker2016) and at several floating tongues in Greenland (Rignot and Steffen, Reference Rignot and Steffen2008; Washam and others, Reference Washam, Nicholls, Münchow and Padman2019; Zeising, Reference Zeising2024). Channels up to several kilometers wide and up to ∼275 m deep have been observed (Alley and others, Reference Alley, Scambos, Siegfried and Fricker2016). Here, and throughout this work, depth is defined by the total difference between ice-shelf thickness outside and inside the channel, of which approximately 90% accounts for the basal channel and 10% its surface expression. Detection of channels narrower than 1km or shallower than 50 m is limited by their small surface expression and the relative scarcity of sub-shelf measurements, though smaller channels have been observed using autonomous underwater vehicles (Dutrieux and others, Reference Dutrieux2014) and ice-penetrating radar (Langley and other, Reference Langley2014).
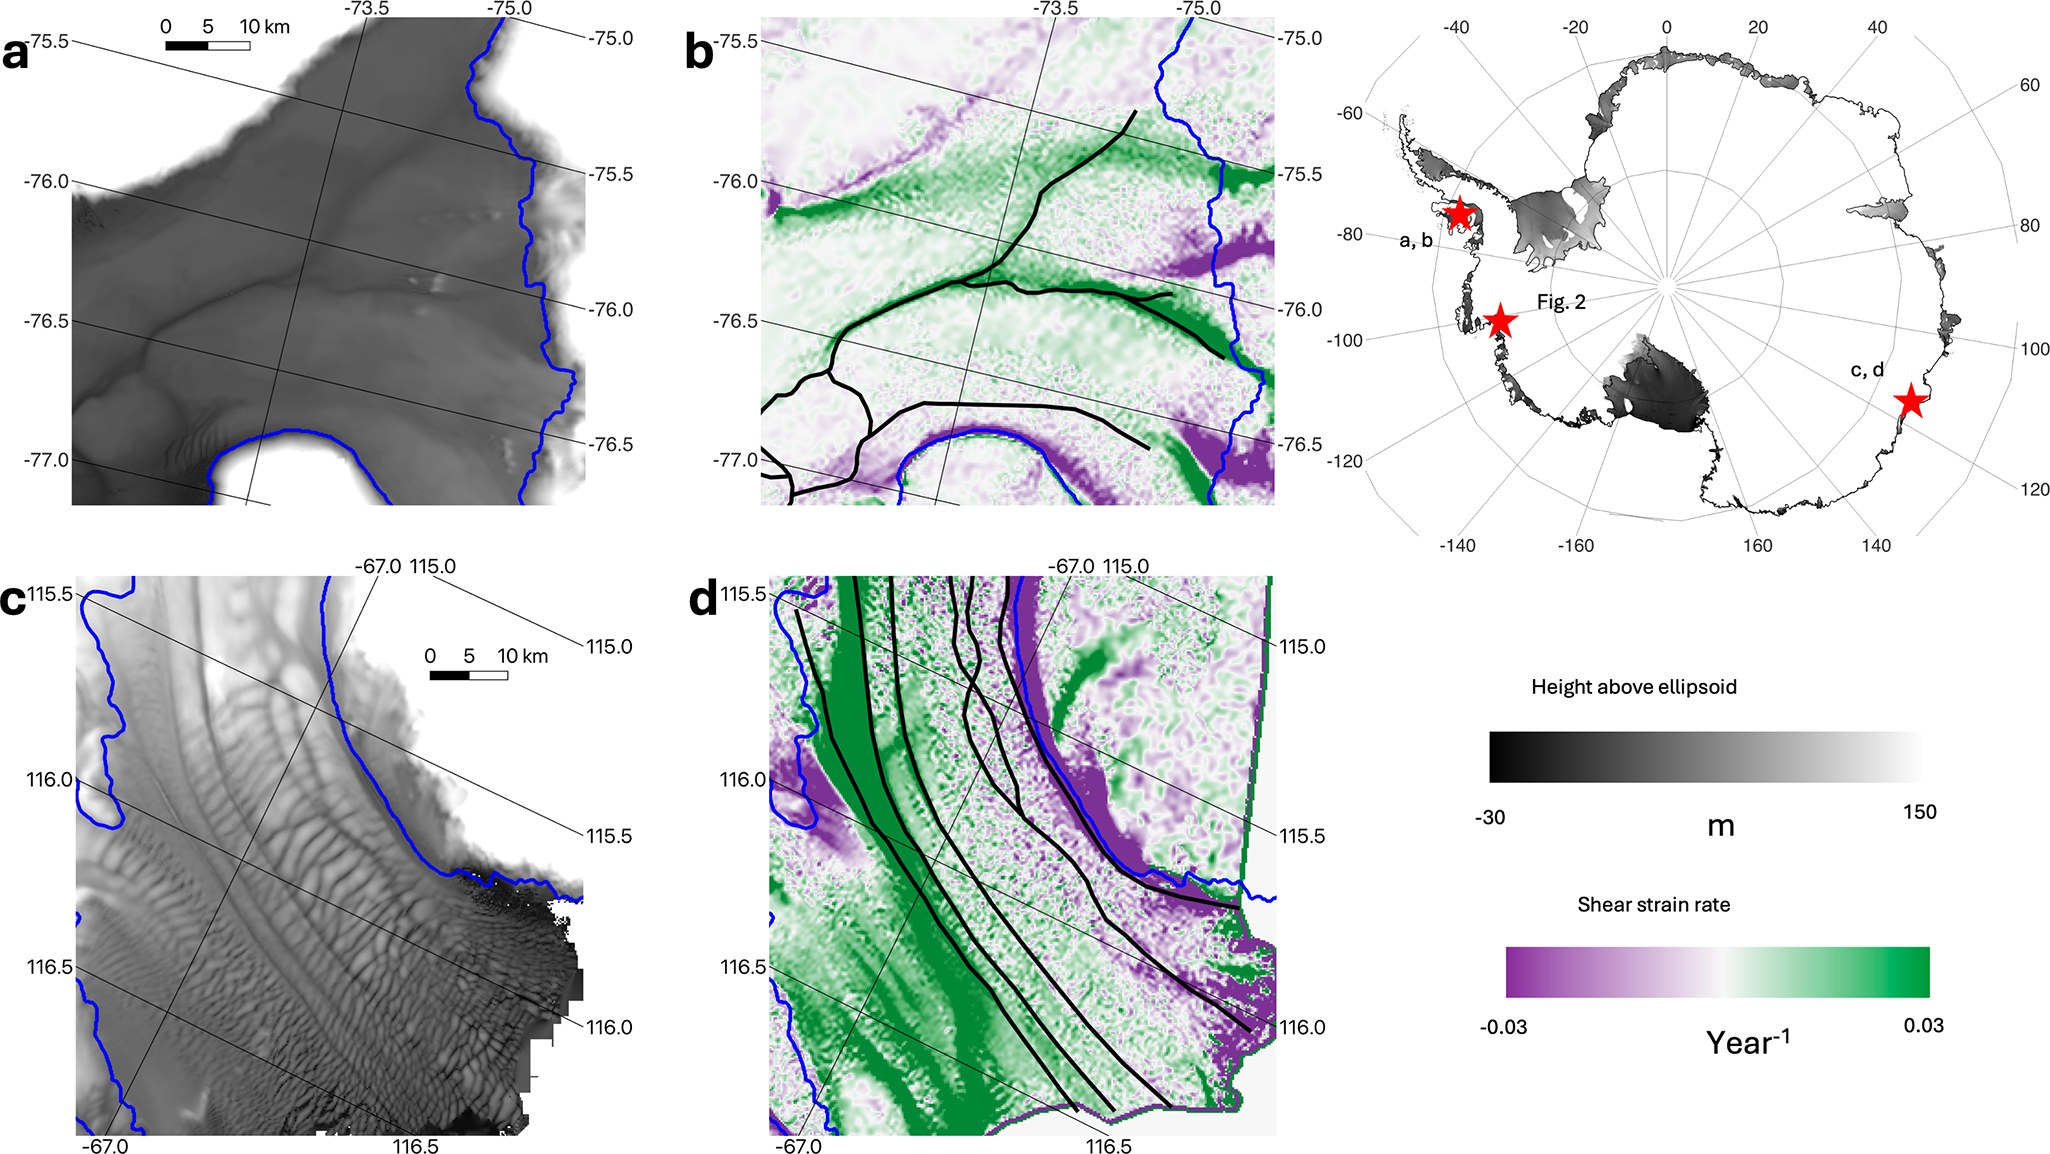
Channels have often been observed to coincide with ice-shelf shear margins (see Fig. 1 for examples at Stange and Totten ice shelves). Troughs form in shear margins, whether grounded (Fahnestock and others, Reference Fahnestock, Joughin, Scambos, Kwok, Krabill and Gogineni2001; Meyer and others, Reference Meyer, Yehya, Minchew and Rice2018) or floating (Alley and others, Reference Alley, Scambos, Alley and Holschuh2019), due to divergent flow. Beneath grounded ice, the lower overburden of the trough is favorable for subglacial water, so grounded shear margins are underlain by subglacial conduits at some locations (Christianson and others, Reference Christianson2014). The outflow of those conduits may entrain warm water and lead to basal channels beneath shear margins on ice shelves (Le Brocq and others, Reference Le Brocq2013). Even if subglacial outflow is absent, it is hypothesized that troughs formed by shear of grounded ice might concentrate buoyant warm water and lead to further channel development (Wei and others, Reference Wei2020). Channels with heads separated from the grounding line have also been observed beneath shear margins (Alley and others, Reference Alley, Scambos and Alley2023). These channels are more puzzling; while feedbacks explain how shear margins and channels co-develop once formed, whether channel formation precedes shear-margin development or vice-versa is unclear.
Examples of channels beneath Antarctic shear margins. (a) Surface elevation (Howat and others, Reference Howat, Porter, Smith, Noh and Morin2019) of Stange Ice Shelf, with several channels visible. (b) Surface shear strain rates of Stange Ice Shelf derived from ITS_LIVE velocities (Gardner and others, Reference Gardner, Fahnestock and Scambos2022). Blue line shows the grounding line (Scambos and others, Reference Scambos, Haran, Fahnestock, Painter and Bohlander2007), black approximates the channels visible in (a). (c–d) as in (a–b), for Totten Ice Shelf. Map in upper right shows locations of other panels and Figure 2 in Antarctica.
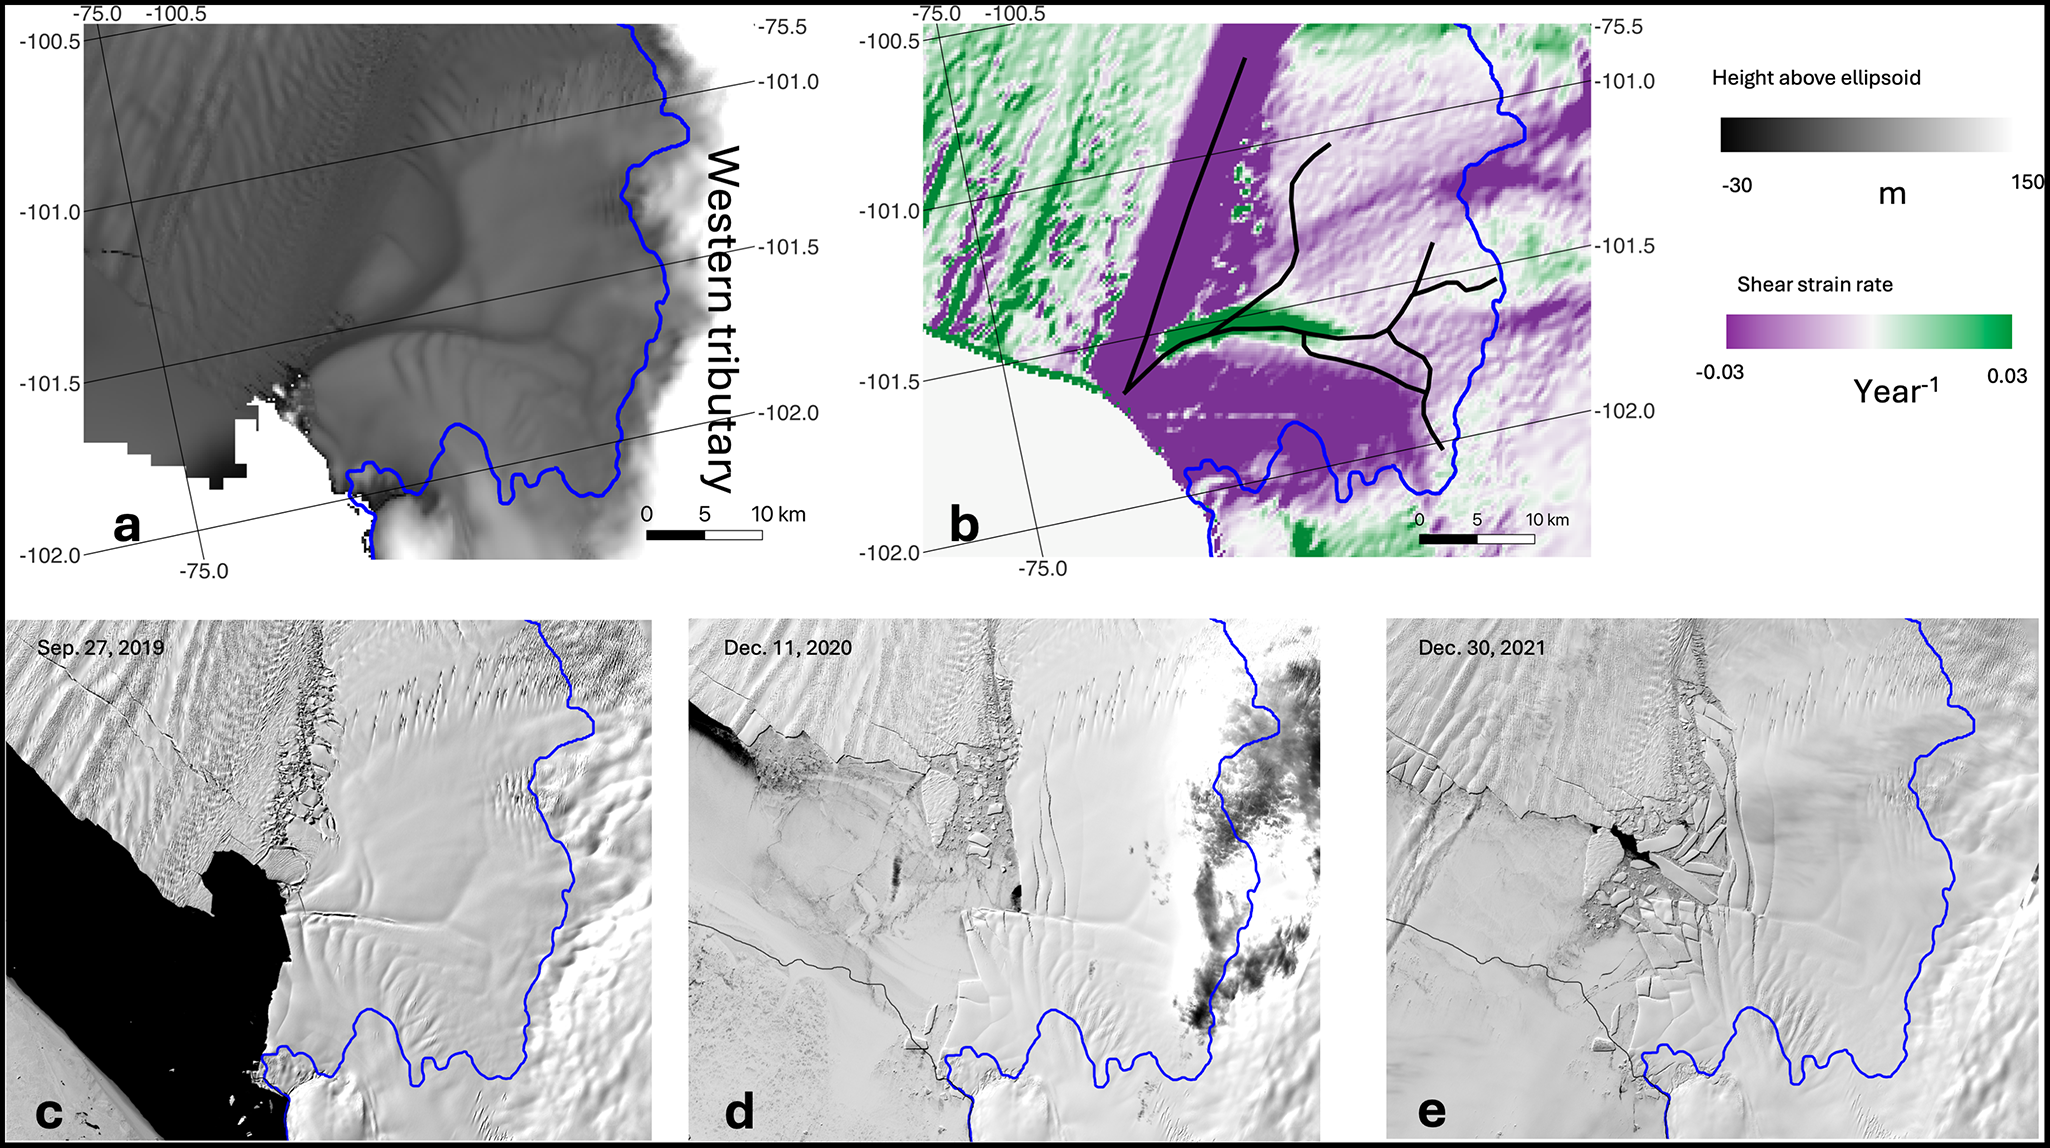
Channels are generally thought to destabilize ice flow. The ice above the basal channel is thinner than the surrounding ice shelf, so its depth-integrated ability to transmit stress is reduced and thus channel development is likely to cause ice-shelf speedup (e.g. Alley and others, Reference Alley, Scambos and Alley2023). Channels can further destabilize ice shelves by leading to extensive crevassing or rifting, thus causing weakening and/or calving (Vaughan and others, Reference Vaughan2012; Dow, Reference Dow2018; Alley and others, Reference Alley, Scambos, Alley and Holschuh2019). One notable example of such rifting and retreat was seen on Pine Island Glacier’s ice shelf between 2019 and 2021 (Fig. 2). The main ice shelf calved off a large tabular iceberg during that time (compare Fig. 2c and d), which then left a western tributary of the ice shelf unbuttressed at its margin (label in Fig. 2a). Over the subsequent year, that tributary retreated significantly as it calved many small icebergs along a shear margin underlain by a basal channel (Fig. 2e and f). Similarly, failure along a marginal basal channel contributed to calving of the Larsen B ice shelf (Wang and others, Reference Wang2023; see their Fig. 9), playing an important role in the subsequent surface-melt-driven catastrophic breakup (e.g. Banwell and others, Reference Banwell, MacAyeal and Sergienko2013). Modeling indicates that while ice flow can adjust to mitigate channel incision, this ability to adjust is limited, particularly on thin ice shelves, and there is even potential for channels to ‘break through’, incising through the full ice-shelf thickness (Wearing and others, Reference Wearing, Stevens, Dutrieux and Kingslake2021). Channels can have additional, shelf-geometry-specific effects on ice-shelf stability (Alley and others, Reference Alley, Scambos and Alley2023). Despite the potential for destabilization, channels that have remained approximately constant in position and shape over decades suggest that in certain contexts creep closure and advection can balance melt, leading to persistent or even steady-state channels (Alley and others, Reference Alley2024). Basal channels may stabilize ice shelves by concentrating melt, preventing some warm water from reaching the ice-shelf base and decreasing shelf-averaged melt rates (Gladish and others, Reference Gladish, Holland, Holland and Price2012; Millgate and others, Reference Millgate, Holland, Jenkins and Johnson2013). However, even steady state channels are likely to affect ice flow and may affect the response of ice shelves to external forcing.
Basal channels on Pine Island Glacier’s Ice Shelf. (a–b) Surface elevation and shear strain, as in Figure 1. (c–e) Landsat imagery showing progressive breakup in the main shear margin at the northwest corner of the ice shelf (Earth Resources Observation And Science (EROS) Center, 2020). Note, breakup largely follows channels visible in (a).
Though basal channels often coincide with shear margins on ice shelves, not all channels are associated with high shear, nor are all shear margins underlain by channels. For example, one of the right-lateral shear margins that crosses the grounding line onto Stange Ice Shelf is not associated with any surface depression or basal channel (topmost band of positive shear strain in Fig. 1b). Conversely, there are channels on Totten Ice Shelf that are as deep as some associated with large shear strains that do not coincide with increased strain (Fig. 1d). Such examples imply that the relationship between basal channels and shear margins is complex and suggest that sometimes channels are unimportant for ice-shelf flow. The effect that channels have on buttressing of upstream, grounded ice, the key parameter for how ice-shelves modulate sea-level rise (e.g. Fürst and others, Reference Fürst2016), likely has similar complexity, though it has not been explored in detail.
Modeling indicates that melt in shear margins, or in a channel-like geometry outside of high-shear areas, causes faster ice flow. Lhermitte and others (Reference Lhermitte2020) modeled how co-evolution of basal channels and crevassing leads to varying ice-shelf profiles after 100 years, finding that feedbacks between damage and channel incision led to substantial ice loss. Feldmann and others (Reference Feldmann, Reese, Winkelmann and Levermann2022) modeled how the location of melt (at the grounding line versus in the shear margins) led to differing transient responses of an ice shelf, finding that melt in the shear margins had a stronger effect than melt at the center of the ice shelf. These studies provide convincing evidence that basal channels can destabilize ice shelves but did not systematically explore the range of effects that channels might have on ice-shelf flow.
Here, we consider how channels in a variety of locations and with different widths and depths may affect ice flow. We first examine direct effects of channels, i.e. those that result from the change in ice-shelf geometry. We then consider indirect effects that channels may have on flow by altering rift patterns. Through this systematic approach, we isolate where channels are most important to ice-shelf flow and how flow responds to varying channel sizes.
2. Methods
We use an idealized model to simulate the effects of basal channels in various configurations upon ice flow.
2.1. Model physics
Ice is thought to deform following the incompressible Stokes equations,
 \begin{equation*}\nabla \cdot {\boldsymbol{\sigma }} + {\rho _i}{\boldsymbol{g}} = 0\end{equation*}
and
 \begin{equation*}\nabla \cdot {\boldsymbol{u}} = 0,\end{equation*}
 where  ${\boldsymbol{\sigma }}$ is the Cauchy stress tensor, ${\rho _i}$ is the density of ice, ${\boldsymbol{g}}$ is the gravity vector and ${\boldsymbol{u}}$ is the velocity. These equations are closed using Glen’s Flow law
 \begin{equation*}\dot{\boldsymbol\epsilon}=A\left(T\right)\tau_E^{n-1}{\boldsymbol\tau},\end{equation*}
 where  $\dot{\boldsymbol{\epsilon}}=1/2\left(\nabla\boldsymbol u+\left(\nabla\boldsymbol u\right)^\top\right)$ is the strain rate, $A\left( T \right)$ is a temperature-dependent prefactor, ${\boldsymbol{\tau }} = {\boldsymbol{\sigma }} - p{\boldsymbol{I}}$ is the deviatoric stress with $p = - {\text{tr}}\left( {\boldsymbol{\sigma }} \right)/3$ the pressure and ${\boldsymbol{I}}$ the identity matrix, ${\tau _E}$ is the second invariant of ${\boldsymbol{\tau }}$ and n is the Glen exponent (taken to be 3). We use a higher order approximation to the Stokes equations (Blatter, Reference Blatter1995; Pattyn, Reference Pattyn2003) that drops terms of order 2 and greater in the aspect ratio (ratio of vertical to horizontal extent). This approximation is suitable in locations where bridging stresses are small and allows the equations of motion to be formulated without vertical velocity or pressure terms (e.g. Rückamp and others, Reference Rückamp, Kleiner and Humbert2022). While previous work has shown that bridging stresses must be considered to determine the surface expression of basal channels (Drews, Reference Drews2015; Chartrand and Howat, Reference Chartrand and Howat2023), we are concerned not with the vertical profile of flow but with horizontal velocity. Though the model would be unsuitable for determining the surface expression of basal channels or the vertical flow in their immediate vicinity, it is still an appropriate approximation to determine the large-scale horizontal flow of ice shelves with channels.
We use a regularized Coulomb friction law to describe motion at the ice–bed interface (Schoof, Reference Schoof2005; Gagliardini and others, Reference Gagliardini, Cohen, Råback and Zwinger2007). This sliding law transitions between Weertman-type behavior inland and Coulomb behavior near the grounding line. That is, it transitions from basal shear stress being proportional to some power of the sliding speed inland to being independent of the sliding speed near the grounding line. In our modeling, the basal shear stress,  ${{\boldsymbol{\tau }}_b}$, is set to
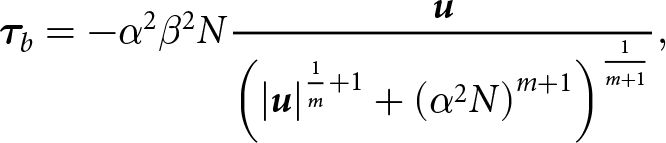 \begin{equation*}{\boldsymbol\tau}_b=-\alpha^2\beta^2N\frac{\boldsymbol u}{\left(\left|\boldsymbol u\right|^{\frac1m+1}+\left(\alpha^2N\right)^{m+1}\right)^\frac1{m+1}},\end{equation*}
 where  $\alpha $ and $\beta $ are adjustable parameters (here ${\alpha ^2} = 0.2$ and ${\beta ^2}$ varies), ${u_0}$ is a constant value, $m$ is the sliding law exponent (taken to be 3) and $N$ is the effective pressure. The effective pressure, defined as the difference between ice and water pressures, is assumed to follow $N = {\rho _i}\left| {\boldsymbol{g}} \right|H + {\rho _w}\left| {\boldsymbol{g}} \right|b$ where ${\rho _w}$ is the water density, $H$ is the ice thickness and $b$ is the elevation of the bottom of the ice. This expression for $N$ effectively assumes that the entire glacier bed is hydrologically connected to the ocean, likely useful up to ∼10 km upstream but less so elsewhere (Leguy and others, Reference Leguy, Asay-Davis and Lipscomb2014). This formulation is like that found in the Marine Ice Sheet Model Intercomparison Project third phase (MISMIP+) (Asay-Davis and others, Reference Asay-Davis2016), but modified slightly to ease computation (Joughin and others, Reference Joughin, Shapero and Dutrieux2024); differences in drag at equal effective pressure and velocity are <5% (Fig. S1). The model is hydrostatic, so the surface elevations for floating ice are determined by floatation using the density of ice and sea water (917 kg m−3 and 1028 kg m−3 respectively). The prefactor $A$ is assumed to be constant, with value corresponding to $T = - 10$ °C.
2.2. Model setup
All simulations use the bed topography from MISMIP+ (Asay-Davis and others, Reference Asay-Davis2016). Upon this bed topography, we initialize two steady states (Fig. 3). The first, which we refer to as ‘MISMIP+’, exactly follows the MISMIP+ default setup, which uses no basal melt and positions the grounding line on the retrograde slope ∼440 km into the domain. This setup uses a constant 0.3 m yr−1 of accumulation across the domain and  ${\beta ^2} = {10^{ - 2}}$ MPa m−1/3 yr1/3. The MISMIP+ setup provides a rough analogy to ice-stream/ice-shelf systems like Pine Island and Totten glaciers, and Moscow University and Crosson ice shelves, in which a confined ice shelf is primarily fed by a large, single ice stream at the apex of a U-shaped grounding line.
Steady-state model setups and locations where channels are subsequently incised. (a) Ice thickness using MISMIP+. (b) Ice-flow speed (rightward component) for MISMIP+. (c) horizontal shear–strain rate for MISMIP+. (d–f) As in (a–c), but for the partial stream setup. (g) Location of channels incised for simulations. Shown here as 3 km wide, though width varied from 0.5 to 5 km, with additional 1 km taper on either side. Black and light gray lines in all panels show grounding lines for MISMIP+ and partial stream setups, respectively. Dark gray contour in f shows where the von Mises stress exceeds 265 kPa, a threshold for failure (Grinsted and others, Reference Grinsted, Rathmann, Mottram, Solgaard, Mathiesen and Hvidberg2024); no area exceeds this threshold for the MISMIP+ setup.
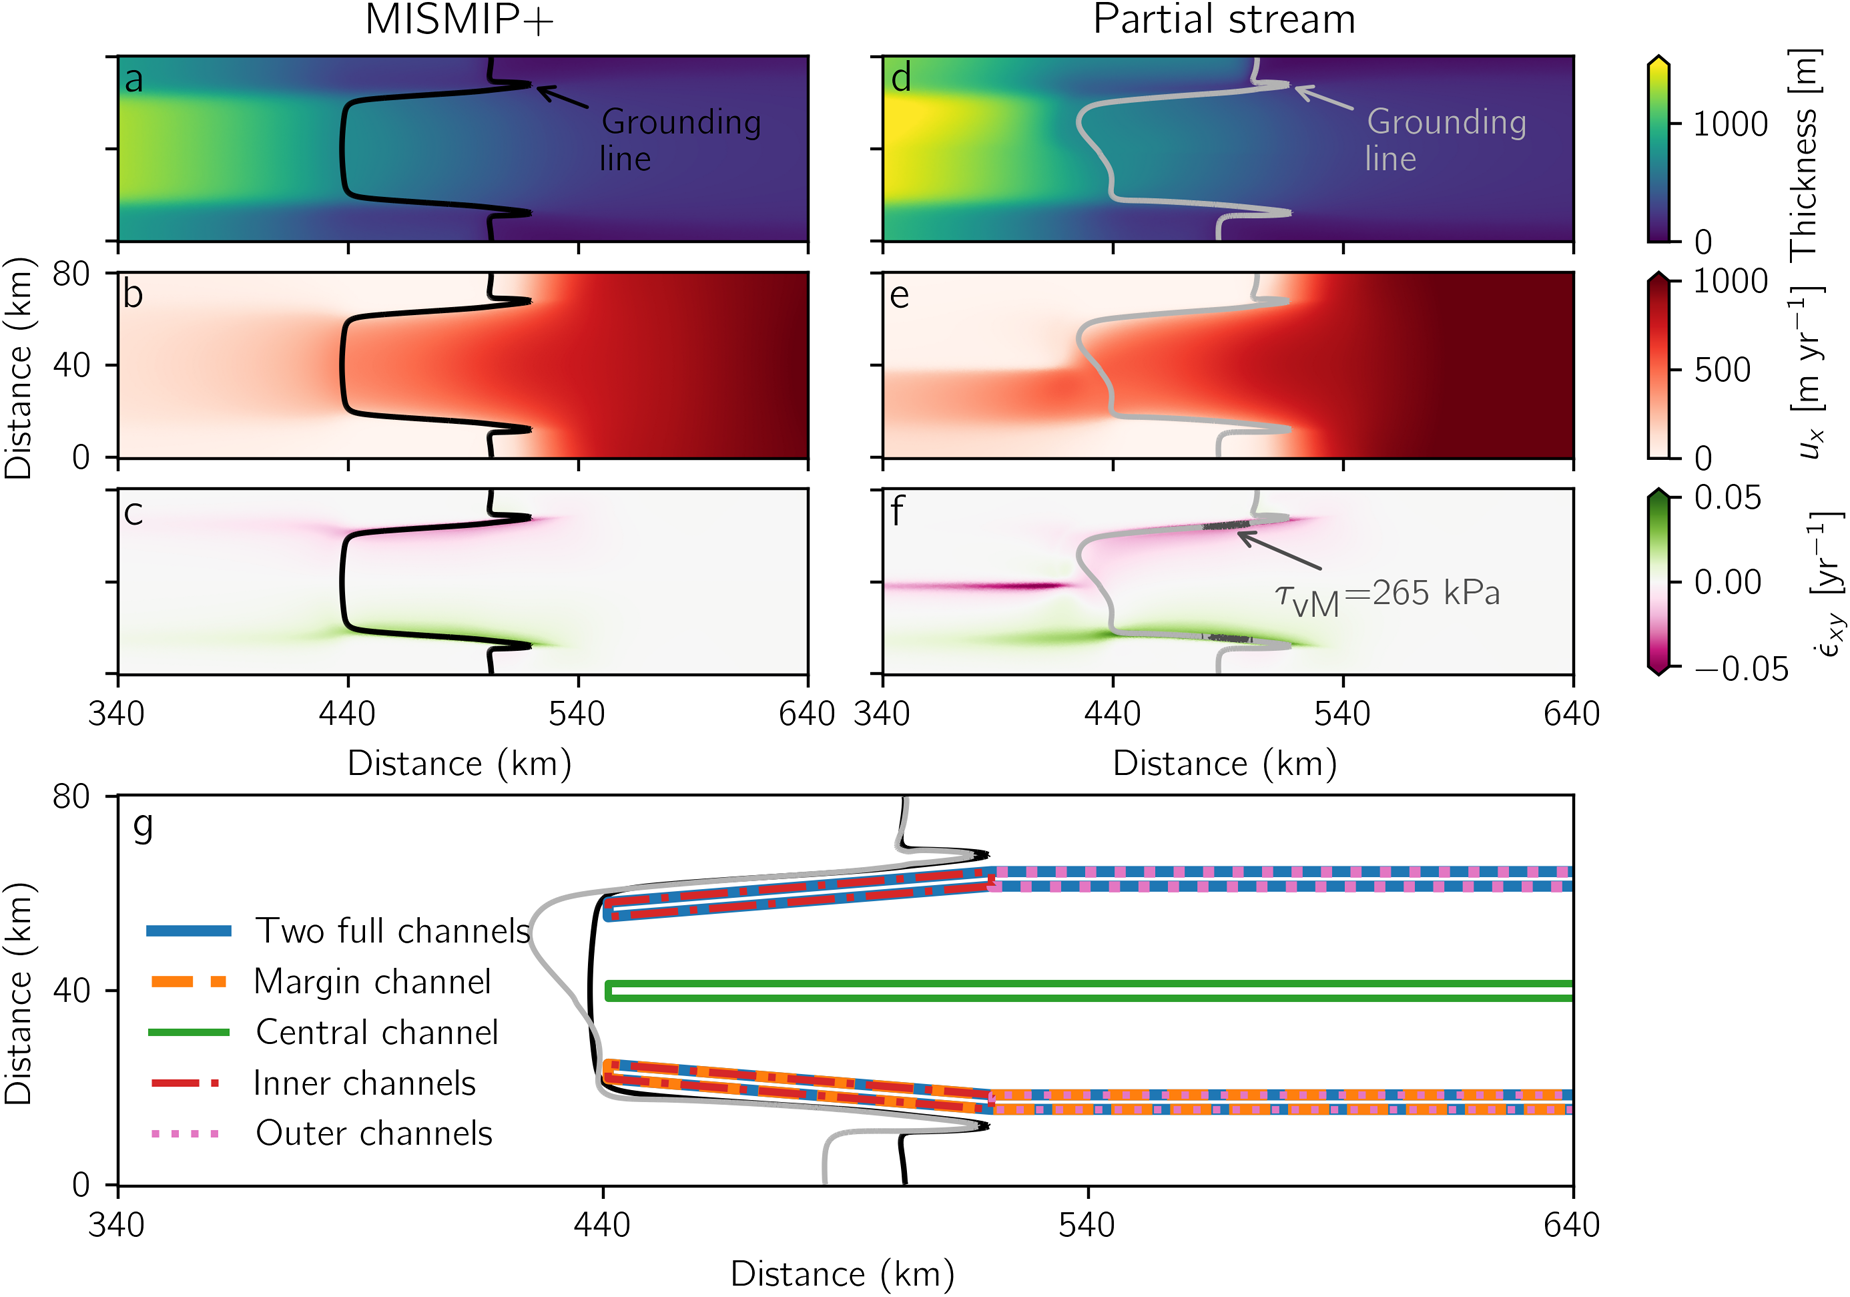
The second, which we refer to as ‘partial stream’, uses the same topography but only has an ice stream in the right half of the domain (right in flow coordinates). In the left half, ice transitions from slow, internal deformation to the ice shelf. To achieve this setup,  ${\beta ^2}$ transitions from ${10^{ - 2}}$ MPa m−1/3 yr1/3 to ${10^{ - 1}}$ MPa m−1/3 yr1/3 over a 5 km zone in the middle of the domain, and accumulation was manually adjusted by ∼10 cm yr−1 to keep the grounding line in approximately the same position as the MISMIP+ setup while maintaining the same total accumulation. This ‘partial stream’ setup is roughly analogous to ice shelves that are fed by ice streams with different speeds, such as Filchner-Ronne or Venable ice shelves, or spread widely from a small inlet, such as Getz and Dotson ice shelves.
The steady states were spun up until elevation changes throughout the domain were <1 mm yr−1 (achieved after 17.5–25 ka of adjustment from a constant initial thickness). After initialization, the thickness of the ice shelf in each setup varies from ∼250–1000 m, and the velocity varies from nearly 0 to over 1000 m yr−1 (Fig. 3).
2.3. Model implementation
The model is implemented in icepack (Shapero and others, Reference Shapero, Badgeley, Hoffman and Joughin2021), an open-source ice-flow modeling package built upon the finite-element library Firedrake (Rathgeber and others, Reference Rathgeber2016). The model front end is written in Python for ease of use, while computations rely primarily on PETSc (Balay and others, Reference Balay2019), which uses compiled libraries for better performance. The simulations used variable grid resolution, ranging from 350 to 2000 m horizontally, and used a single vertical layer with second-order basis functions to capture vertical flow variability (Shapero and others, Reference Shapero, Badgeley, Hoffman and Joughin2021).
2.4. Simulations
We ran simulations exploring the instantaneous effect of incising channels on ice-flow speeds. Instantaneous incision allows us to isolate the effect that channels have on flow and to consider how channels of various shapes and sizes affect flow. This instantaneous incision should not be misinterpreted as a physical claim. Physically, channels cannot be instantaneously incised, so we are only testing the effect of channel geometries on flow. There is not necessarily a finite melt rate that would exactly produce these geometries, though they are similar in depth and width to channels observed in nature.
Channels were incised in five different positions (Fig. 3g). For each channel position, simulations were run using the MISMIP+ setup and using the ‘partial stream’ setup, with identical channel positions and lengths in each. Simulations varied channel depth (from 50 to 250 m in 50 m increments) and channel width (0 to 5 km in 500 m increments). All channels were trapezoidal in cross section, and the triangular ‘ramp’ extended for 1 km in each direction from the dimensions above (so the 0 km wide channels were triangles 2 km in total width). In all cases, the channel depth refers to the total amount of ice removed at the center of the trapezoidal channel, of which ∼90% is expressed at the base and 10% at the surface. Besides reducing numerical artifacts, the trapezoidal shape is a reasonable approximation of observed channel profiles (Rignot and Steffen, Reference Rignot and Steffen2008; Dutrieux and others, Reference Dutrieux2013). The five channel positions were (1) Two marginal channels, using channels from the grounding line to the shelf edge just inboard of the U-shaped alcove of the grounding line (blue in Fig. 3g). (2) Single-margin channels, with a single channel on shelf-right in the same position as 1 (just inboard of the grounding line; orange in Fig. 3g). For the asymmetrical partial stream setup, we also ran a simulation using a single channel in the left margin. (3) Central channel, with a single channel running up the middle of the shelf (green in Fig. 3g). (4) Inner-shelf channels, running on both sides of the shelf but only extending to the outermost point of the grounding line (red in Fig. 3g). (5) Outer-shelf channels, running from downstream of the grounding line to the shelf edge in the same lateral position as other margin channels (purple in Fig. 3g). Thus, in total, we ran 55 simulations for each channel position, for each of two setups (MISMIP+ and partial stream, with one extra position in the partial stream setup because of asymmetry), to consider a total of 605 different scenarios.
To isolate the effect of channels, simulations with channels were paired with simulations that removed the same volume of ice evenly from across the shelf. These corresponding simulations approximate the effect of an equal amount of melt, but not channelized, and hereafter are referred to as ‘even melt’ simulations. Without removing this volume, the change in the net pulling force (integrated difference between glaciostatic and hydrostatic pressures) from the reduction in shelf volume caused by the channels can cause a slowdown in shelf flow speeds that complicates interpretation of the effect of channelized melt. In essence, this approach isolates the effect of melt distribution from melt volume on ice-shelf flow. Although this correction is useful to isolate the effect of channel geometry, the results are not particularly sensitive to this choice (speeds are <30% different everywhere), since variations in flow speed with the evenly distributed melt are small compared to the variation between simulations with channels.
Direct effects from channels on flow are likely to be enhanced by feedbacks relating to changes in geometry and stress resulting from channel incision. Over a timescale of years to decades, temperature profiles and ice-crystal fabric are likely to adjust in response to channels, potentially causing further speedup; our diagnostic model is unequipped to evaluate these possibilities. The difference in the stress state also has the potential to cause areas to exceed the yield strength of ice almost instantaneously, thus causing fracture and reduced resistance to flow (Lhermitte and others, Reference Lhermitte2020; Watkins and others, Reference Watkins, Bassis, Thouless and Luckman2024). To assess whether this feedback is likely to be active with various channel geometries, we compare the stress state of our results to a recent empirical estimate of yield strength. Analysis of crevasse locations and ice-flow velocities suggests that the onset of failure (crevassing) in Greenland is well-described by when the von Mises stress,  ${\tau _{{\text{vM}}}} = \sqrt {3/2{\tau _{ij}}{\tau _{ij}}} $, exceeds 265 ± 73 kPa (Grinsted and others, Reference Grinsted, Rathmann, Mottram, Solgaard, Mathiesen and Hvidberg2024). After model spin up, no areas exceed this threshold in the MISMIP+ setup and only isolated areas along the grounding line exceed it in the partial stream setup (Fig. 3f), suggesting that crevassing and rifting are limited.
3. Results
3.1. MISMIP+ setup
Channels beneath both margins cause faster flow of the central portion of an ice shelf (Fig. 4). The speed difference can reach 1275 m yr−1 (129% of previous flow speeds) for 250 m deep, 5 km wide channels. Ice at the grounding line, inboard of the channels, also flows faster in response to faster flow downstream. This difference in speed at the grounding line can reach 340 m yr−1 (86% of previous flow speeds) for 250 m deep, 5 km wide channels. Unless channels penetrate nearly the full ice thickness (leaving only ∼10 m or less), the lateral edges of the shelf flow faster than they would without channels due to being dragged along by the fast-flowing center of the shelf (Figs 4 and S2). Small areas near the grounding line, outboard of the channels (near horizontal distance 520 km in Fig. 4), flow more slowly in the presence of marginal channels of any size, since the channels isolate these areas from the stress gradients caused by fast flow. The difference in speed at the grounding line suggests that channelized melt leads to loss of grounded ice compared to evenly distributed melt.
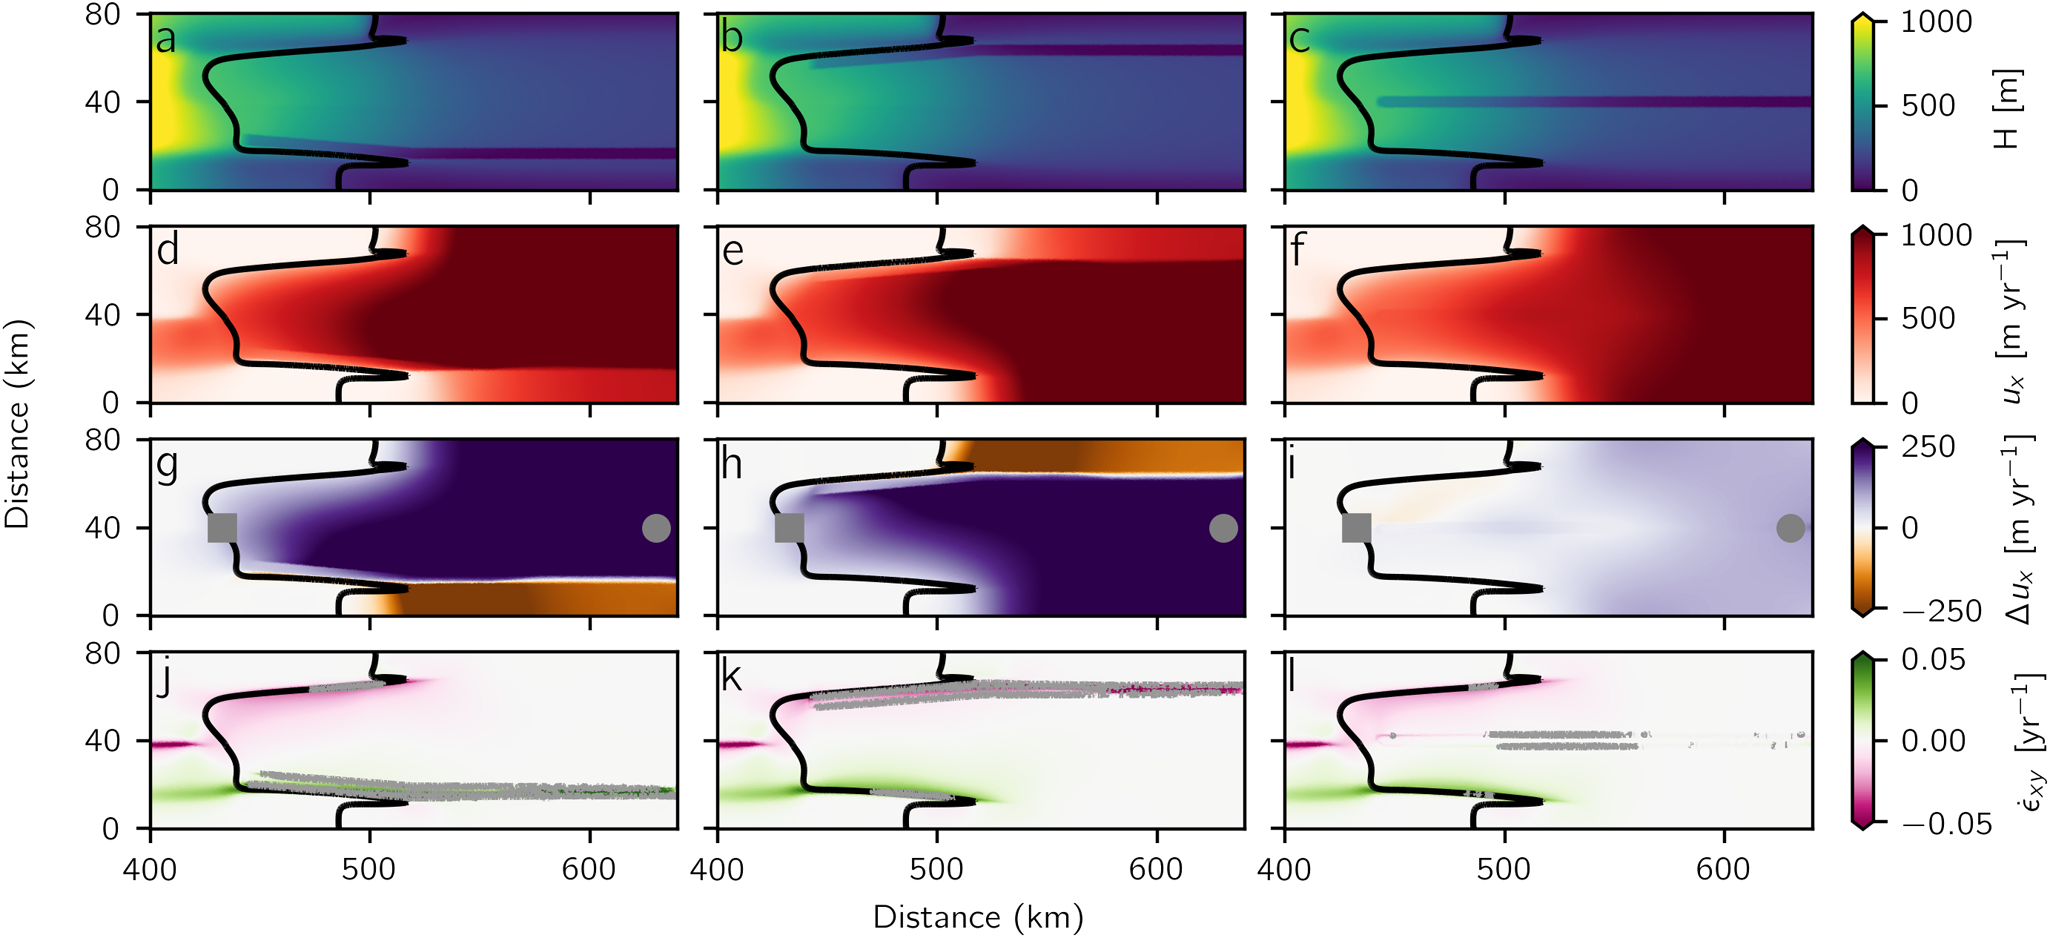
Effect of two channels on MISMIP+ setup. (a–c) Ice thickness with two full, inner and outer channels, respectively. Width varies so that simulations have similar incised volume (within 4%) for fair comparison. Widths are 1.5, 3 and 5 km, respectively. (d–f) Horizontal speeds with channels as in (a–c). (g–i) Difference in flow speed due to channels in (a–c). Gray square, circle and diamond show grounding line, mid-shelf and shelf-edge locations plotted in Figures 5 and S2. (j–l) Horizontal shear strain rate, with channels as in (a–c). Gray contour shows  ${\tau _{vM}}$=265 kPa, a threshold for failure (Grinsted and others, Reference Grinsted, Rathmann, Mottram, Solgaard, Mathiesen and Hvidberg2024).
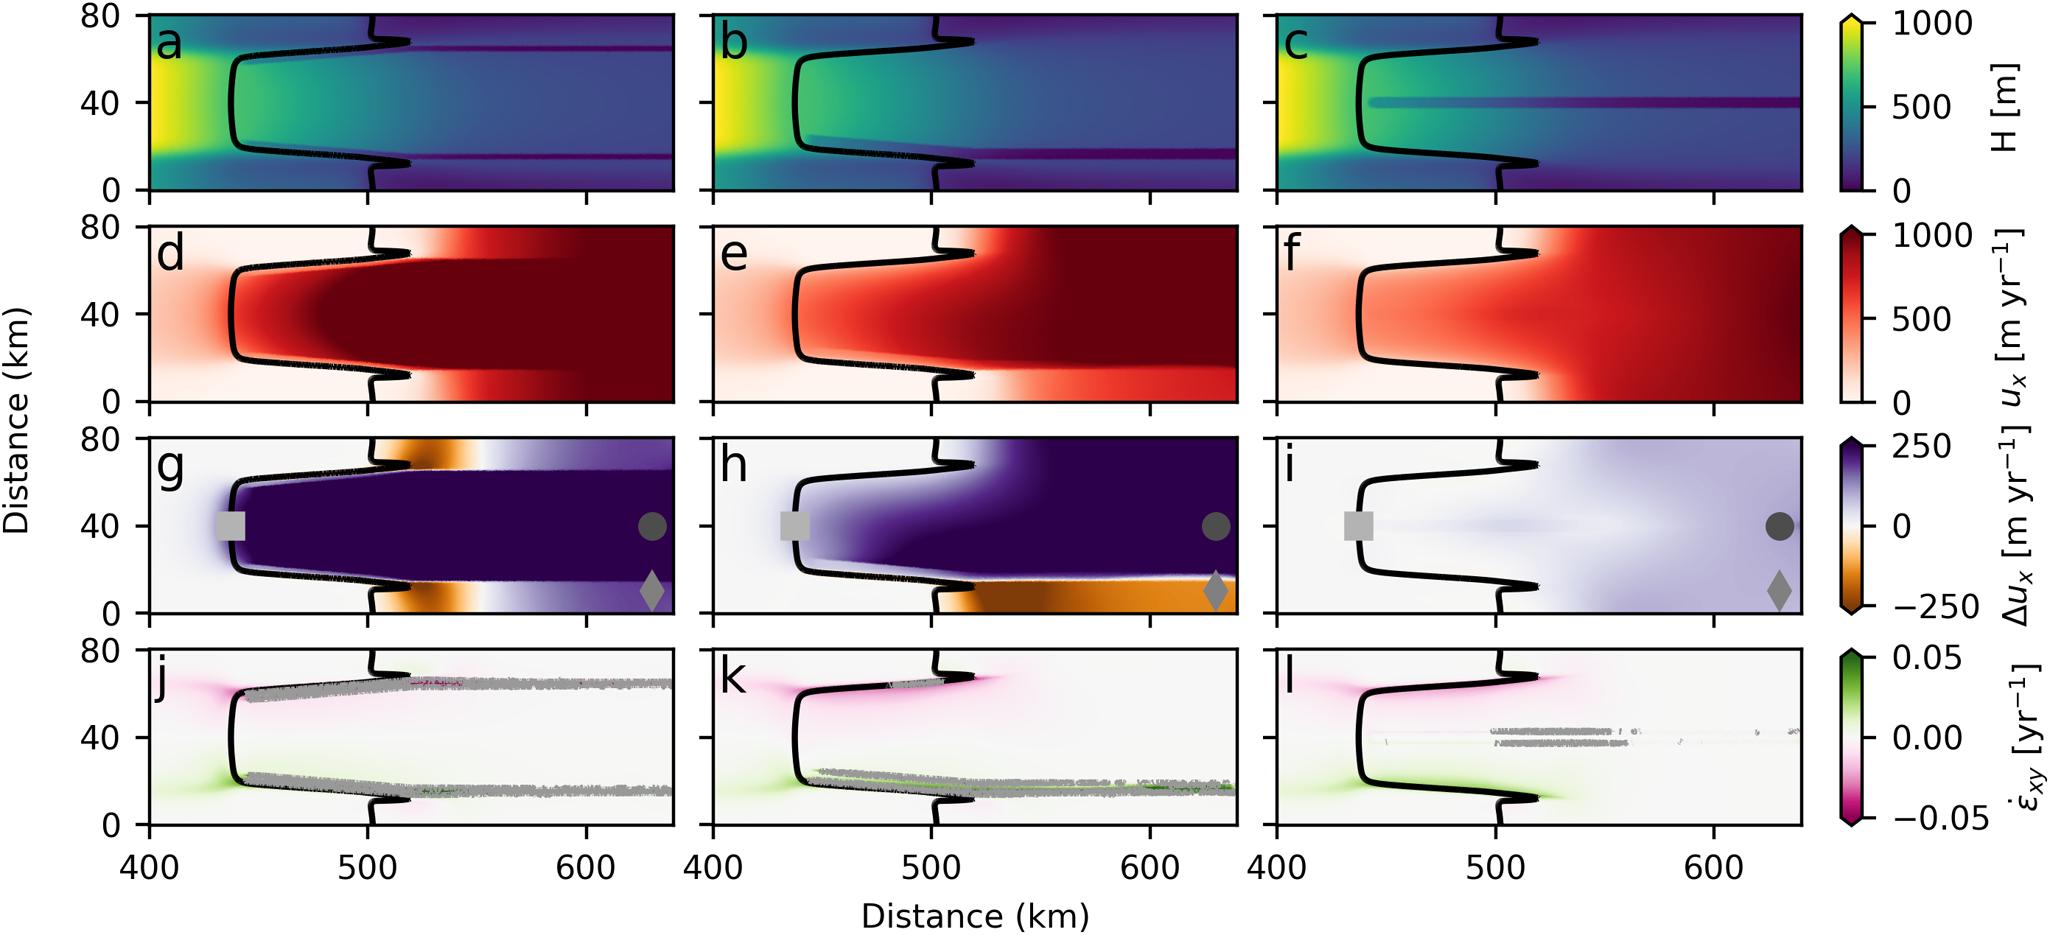
Ice-shelf flow is much more sensitive to channel depth than channel width (Figs 5, S2 and S3). Channels in one or both shear margins that are twice as deep result in at least twice as much difference in flow speed compared to even melt, regardless of whether those channels extend the full length of the shelf or just through the confined portion. The speed difference between channels that differ by 100% in depth is 200–375% at the center of the ice shelf and 250–390% at the grounding line (Fig. S3). On the other hand, the difference in flow speed caused by channels differing in width by 100% is <29% at the shelf center, and <32% at the grounding line (Fig. S3). Channels in the center of the shelf or only on the unconfined portion of the shelf affect flow speeds in ways that are not directly related to their relative width or depth.
Difference in flow speed due to channels (a) in the middle of the shelf near the calving front and (b) at the grounding line for the MISMIP+ setup. Locations are shown in Figure 4 by circle and square, respectively. Color indicates the channel number and location. Bar size encapsulates the range of effects on flow for various channel widths, from 0 km (a triangular channel) at the low end to 5 km at the high end.
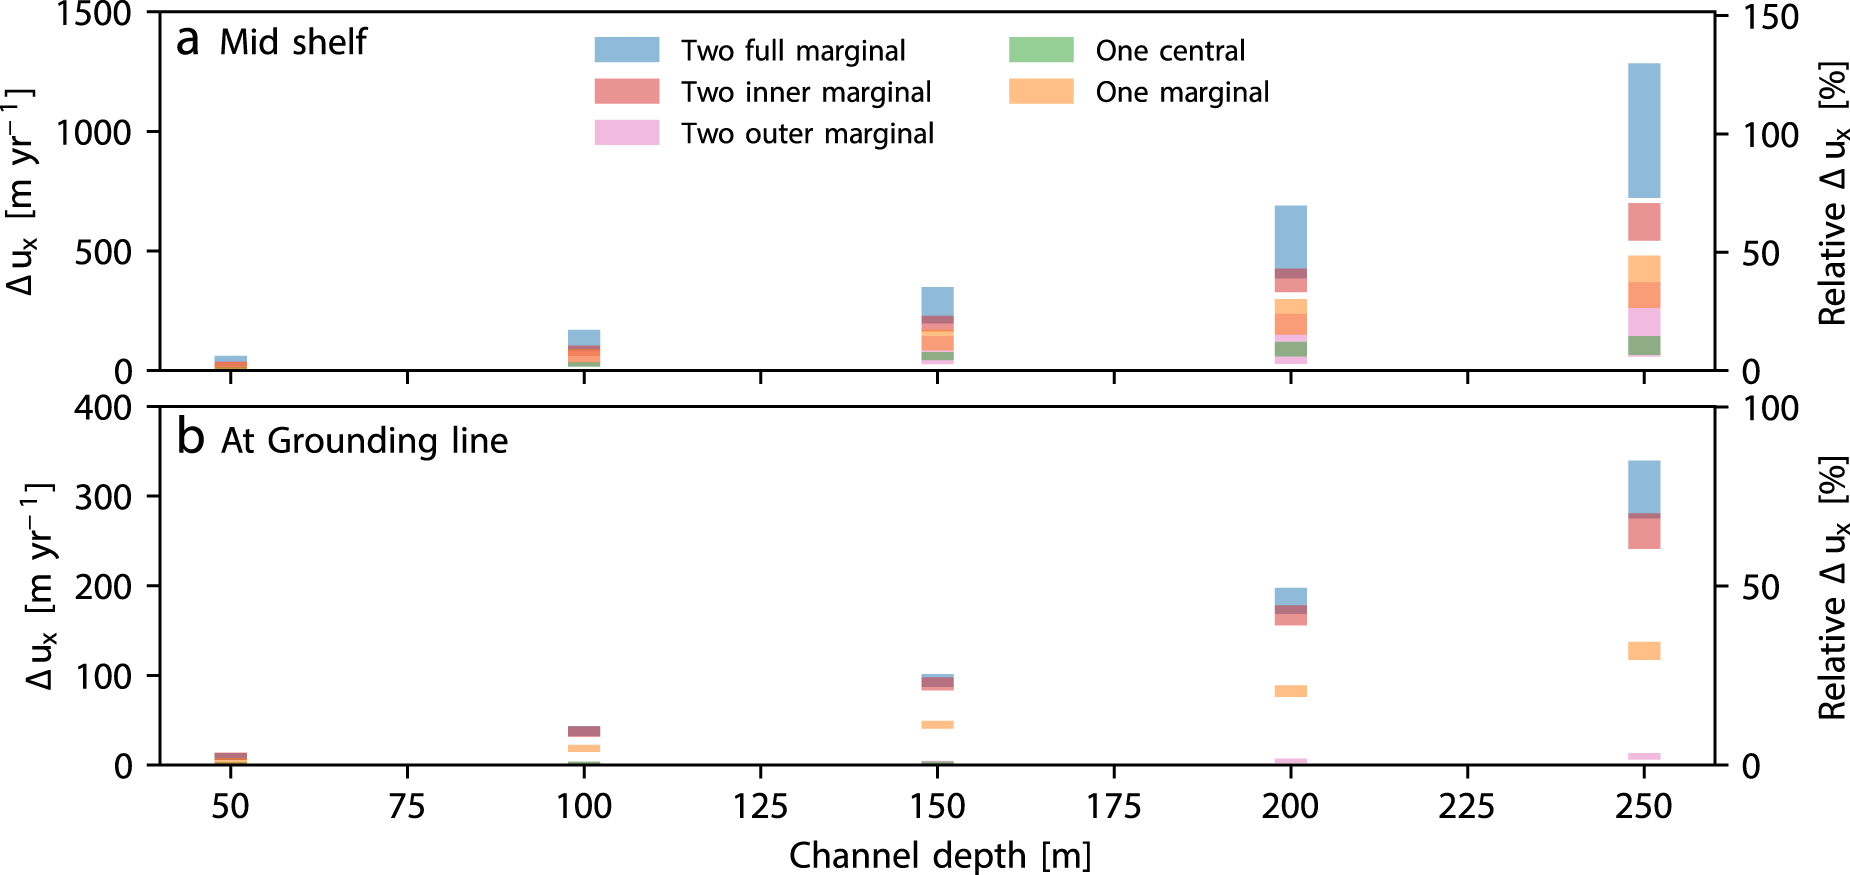
Channels have greater effect on ice-shelf flow when near the grounding line rather than farther out on the shelf (Figs 4d–f and 5a). However, at equal volume incised, channels extending the full length of the shelf have ∼25% greater effect on flow speeds than channels just near the grounding line (Fig. 5). We attribute this difference to the full-shelf channels mechanically separating the center of the freely spreading portion of the shelf from the outsides, leading to more difference in speed compared to the even melt case (compare ∼520 km into the domain in Fig. 4g and h). At the grounding line, channels that are limited to the inner, confined portion of the shelf have similar effects to full-shelf channels (within 15%) at equal volume incised (Figs 4g, h and 5b). This suggests that, while ice-shelf flow speeds may be sensitive to whether channels extend the whole length of the shelf, the net effect on buttressing upstream ice is relatively insensitive to the extension of channels into the freely spreading portion of the shelf. On the other hand, channels on the outer, freely spreading portion of the shelf barely affect flow at the grounding line (<12 m yr−1, <3% of previous flow speeds and <4% the effect of two full-shelf channels with equal volume).
Single channels do not affect flow of ice shelves or grounded ice as much as two channels of equal volume (Figs 5 and S4). At the center of an ice shelf, a single channel has 44 ± 5% of the effect on flow speeds that two channels of equal dimension have, though the relative effect depends upon the channel dimensions (Fig. 6a). One shallow channel has ∼50% the effect on flow of two shallow channels, while for one deep channel has only ∼35% the effect of two deep channels. At the grounding line, a single channel has closer to half of the effect of a pair of channels on ice flow (47 ± 3%; Fig. 6b), with similar dependence on channel width and depth as for flow at the shelf’s center. A single channel in the center of the ice shelf has little effect on flow, resulting in speeds that differ by at most 140 m yr−1 compared to even melt (<14% of previous flow speeds, <11% of the difference caused by two full-shelf channels with equal volume) (Fig. 5). At the grounding line, the effect of a central channel is <2 m yr−1, <1% of previous flow speeds, for all simulations.

3.2. Partial stream setup
For the simulations with only half the shelf fed by an ice stream, we focus on the results involving one channel incised in different positions (Fig. 7) since the effect of two channels is very similar to that found in the MISMIP+ setup (Fig. S6). Channels at either edge of the ice shelf have similar effects on ice flow, both larger than the effect of a central channel, suggesting that separation from the resistance of grounded ice surrounding the embayment is the critical way that channels affect shelf velocity (as opposed to separating ice that flowed in quickly from that which flowed in slowly). A central channel separating fast- and slow-flowing ice does not have significant effect on flow since the lost resistance is taken up by the other lateral margin. There is a slight asymmetry to how marginal channels affect the flow of grounded ice; if the channel is on the side of the shelf with the ice stream (right marginal for our setup), the difference in ice-flow speed at mid shelf is 7 ± 1% greater than if the channel is on the opposite side (Figs 7j, k and S5). However, at the grounding line, the difference is 15 ± 7% less for the right-marginal channels. These differences are relatively small, but likely indicate a slight, asymmetric adjustment in flow direction resulting from the effective separation of the shelf from its embayment.
Effect of channels on partial stream setup. (a–c) ice thickness with one right-marginal, left-marginal and central channel, respectively. (d–f) Horizontal speeds with channels as in (a–c). (g–i) Difference in flow speed due to channels in (a–c). Circle and square show mid-shelf and grounding line locations plotted in Figure S5. (j–l) Horizontal shear strain rate, with channels as in (a–c). Gray contour shows  ${\tau _{vM}}$=265 kPa, a threshold for failure (Grinsted and others, Reference Grinsted, Rathmann, Mottram, Solgaard, Mathiesen and Hvidberg2024).
Comparing the MISMIP+ and partial stream setups, across all simulations with substantial effects on velocity (i.e. excluding those with channels only on the outer shelf or a single central channel), the velocity differences compared to even melt at the center of the shelf are nearly the same (in the partial stream simulations, channel incision affects speed by 3 ± 3% more). At the grounding line, speed changes by 10 ± 5% less in the partial stream simulations than in the corresponding MISMIP+ simulations. There is high variance in the relative effect on flow of the simulations with channels only on the outer shelf or a single central channel, but since the overall difference in speed is low we do not interpret this further. Overall, the tight correspondence between speed differences with the two different setups (MISMIP+ and partial stream) suggests that our results are not unique to each model geometry, but rather are robust to some site-variable characteristics.
3.3. Rifting
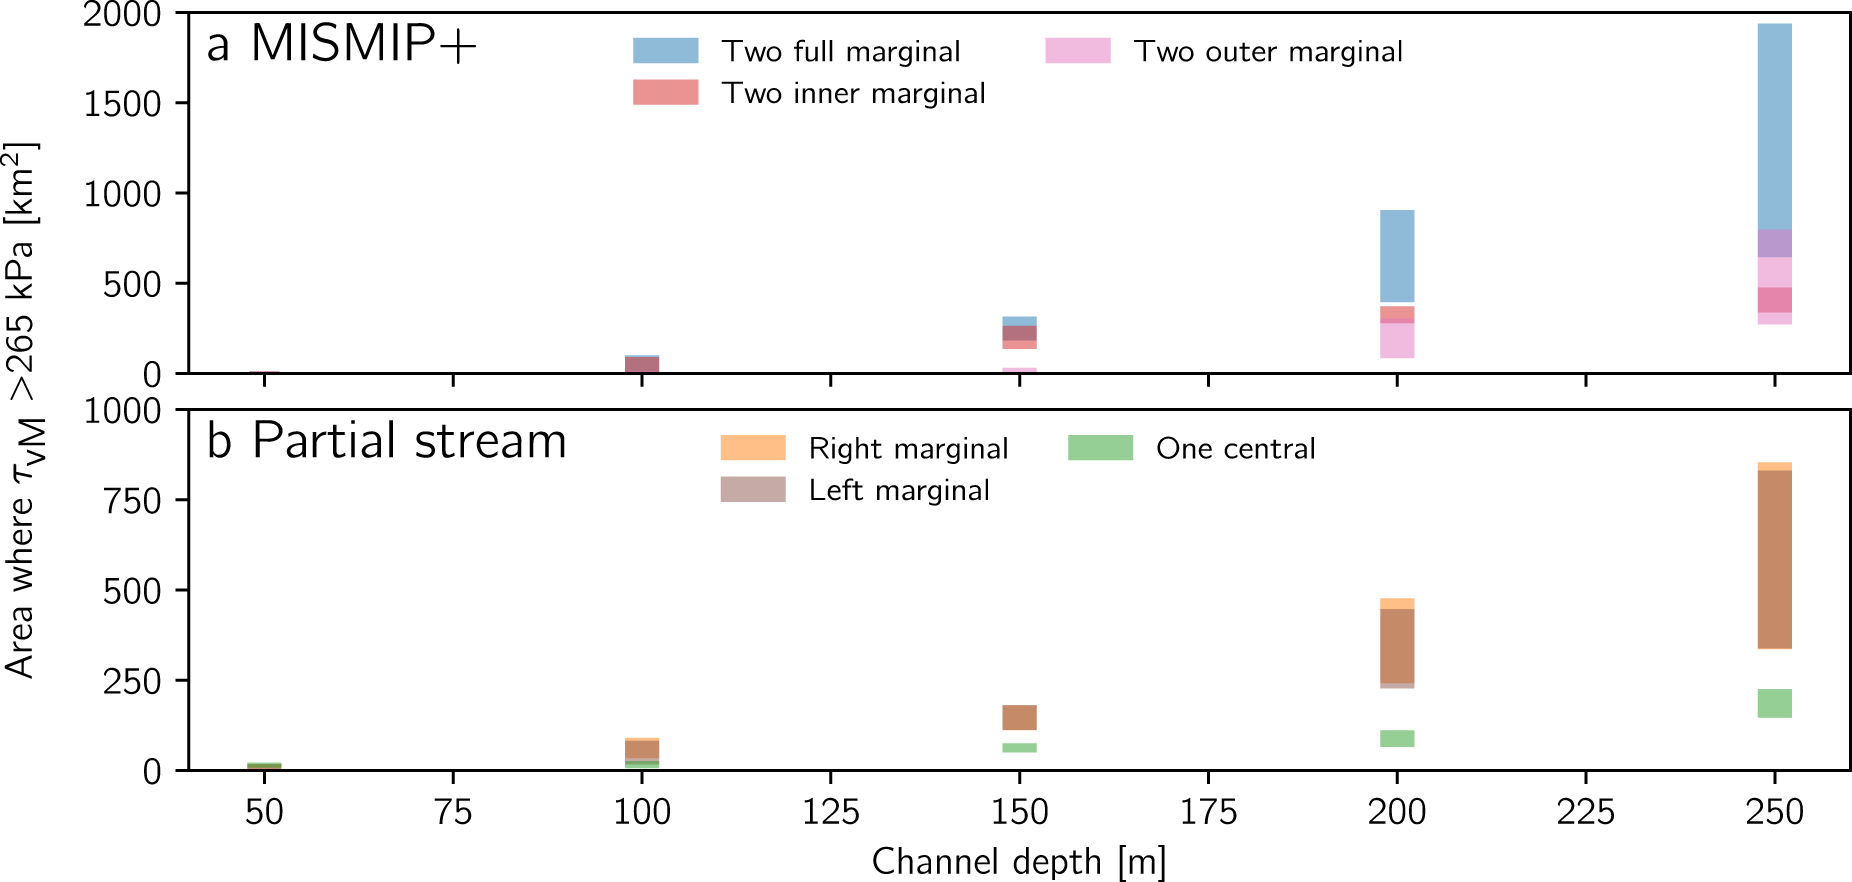
When channels are incised, substantial areas may exceed the failure threshold (Figs 4j–l and 7j–l). The total area that exceeds the failure threshold varies by three orders of magnitude depending on channel depth and position (Fig. 8). With channels that are ≤100 m deep, there is almost no additional area with von Mises stress exceeding the failure threshold. If channel depth exceeds 100 m, the area exceeding the failure criterion and likely experiencing rifting is substantial, regardless of channel position or width. In most cases, wider channels are associated with slightly more area subject to failure, though in other cases wider channels correspond to less area exceeding the threshold (200 m deep, full-shelf and inner-shelf channels in Fig. S7a; 250 m deep, single-margin channels in Fig. S7b). We attribute this counterintuitive result to deformation being spread across the wider channel area and note that the implication is that increasing melt, with the right distribution, might have stabilizing secondary effects on ice-shelf flow. For deep (250 m) channels in both margins, both the MISMIP+ and partial stream setups show the potential for substantially more area to exceed the failure threshold as channel width increases. This substantial increase in area subject to failure is associated with superlinear change in flow velocity with wider channels (Fig. 5a, Fig. S7a). The highly nonlinear increase in area exceeding the failure criterion as channel depth increases, and the complexity in how this area varies with channel width, highlight that not all channels are likely to have the same secondary effects on flow.
Area where  ${\tau _{vM}}$ 265 kPa (a) for MISMIP+ setup and (b) for partial stream setup. Color indicates location of channel(s). Bars span all widths tested (0–5 km); the area exceeding 265 kPa does not relate to channel width in a simple way (see Figure S7).
4. Discussion
We first consider implications for ice-shelf stability, both through feedbacks between channel incision and rifting and through direct effects on flow, then address limitations of the idealized model and implications for future work.
4.1. Implications
4.1.1. Rifting feedback
Substantial rifting alters the bulk rheology of ice, leading to faster flow (Borstad and others, Reference Borstad, Rignot, Mouginot and Schodlok2013), which suggests that by excluding any speedup due to rift formation our results underestimate the effect of channels on flow. Moreover, the area that crosses the failure threshold instantaneously likely underestimates the total area subject to crevassing or rifting, since cracks initiated in that area will advect downstream. Even though the areas experiencing rifting do not connect in a way that isolates blocks (and thus cause calving) in our simulations, they might do so eventually by advecting downstream (Krug and others, Reference Krug, Weiss, Gagliardini and Durand2014) or by transferring stress to neighboring areas that then also exceed the failure threshold. Extensive coupled modeling similar to Lhermitte and others (Reference Lhermitte2020) would be needed to assess this possibility. Additionally, recent work suggests that melt is further increased within highly fractured areas in channels (Watkins and others, Reference Watkins, Bassis, Thouless and Luckman2024), implying a further feedback between rifting and further channel incision that is not captured by our model. However, unexpected stabilizing effects are possible if melt is redistributed widely rather than deeply, since reduced area experiencing rifting may avoid runaway acceleration that can occur from feedbacks between channel incision and rifting (Lhermitte and others, Reference Lhermitte2020). Overall, the complicated relationship between rifting and shelf width and depth suggests that the (de)stabilizing effect of channels on flow will have to be evaluated on a case-by-case basis, resolving actual channel and shelf geometry, as well as incorporating rifting feedbacks and actual basal rates to understand the time-varying behavior.
4.1.2. What channels destabilize ice-shelf flow?
Our results suggest that some channels are much more important for ice-shelf flow than others, and channel geometries like those observed in actual ice shelves can range from unimportant to first-order controls on flow. At equal volume incised (i.e. roughly equivalent melt rates), channels can have effects ranging from approximately doubling ice-shelf flow speeds to changing speeds by <15%. At the grounding line, the difference in speed compared to even melt can range from 0 to 100% with equal volume incised. This is only the instantaneous difference; due to the altered stress state caused by channels, and over time, this difference might be expected to lead to dynamic thinning and further alteration of the flow of grounded ice, in addition to the rifting feedback discussed above.
In general, concentrated melt leads to greater destabilization of flow than dispersed melt; deeper channels have greater effect than wider channels. While inflow of ice from areas surrounding narrow channels can slow the rate at which they cut through ice shelves, such back flow is less able to mitigate large channels breaking through shelves (Wearing and others, Reference Wearing, Stevens, Dutrieux and Kingslake2021). Wide channels might thus be able to erode the entire ice thickness, and eventually have a greater effect on flow. Even considering only our simulations, widely distributing melt does not always lead to greater stability. Channels under both shear margins have a greater effect on flow than a channel under one margin (assuming equal volume incised). When a single channel is incised, the opposite margin can take up some of the lost resistance to flow, moderating the effect on speed. A shallow channel in a single margin has about half the effect on flow of identical channels in both margins, while a deep channel under one margin has less than half the effect of deep channels in both margins (Fig. 6). The diminishing effect of a channel in a single margin hints that there is a limit to the effect that a single channel can have on ice flow and suggests that ice shelves with highly asymmetric channels incised, such as Dotson Ice Shelf (Gourmelen and others, Reference Gourmelen2017; Zinck and others, Reference Zinck, Wouters, Lambert and Lhermitte2023), may not be entirely undermined by channel incision.
Channels affect flow most when they separate a shelf from its confining embayment. Channels outside an embayment have little effect on flow, particularly upstream at the grounding line. However, the extension of channels that begin in an embayment onto the freely spreading portion of a shelf does allow further speedup, and has greater effect than deeper channels inside the embayment (compare Figs 4g, h and 5). Perhaps surprisingly, separating fast- and slow-flowing portions of a shelf is not sufficient to cause speedup in our simulations (Fig. 7i). Channels that separate the shelf from both sides of its embayment are more effective than channels separating it from just one, in both an absolute and relative sense. Thus, we conclude that channels under both margins, extending the full length of the shelf, have the greatest effect on flow per volume incised.
4.2. Limitations and future directions
This work considers only the instantaneous response to channel incision, since this allows us to avoid specifying a melt rate and lets us explore a much wider range of channel geometries than would be possible using a time-varying model. However, we see two major drawbacks to this approach. First, the type of feedback between rifting and channel incision explored in Lhermitte and others (Reference Lhermitte2020) cannot be fully considered, since damage is not considered in the calculated flow speeds, and even if the instantaneous change in viscosity were considered, the damage could not be advected at a single point in time. Full exploration of how this feedback varies with channel geometry is likely to be computationally demanding and difficult. Second, the diagnostic model limits us to considering the instantaneous effect on flow of grounded ice, with no ability to evaluate how the mass balance of the ice stream would evolve with time. Nevertheless, our approach allows us to consider a broader suite of channel widths, depths and locations than would be possible with long, time-varying simulations. This work might help guide future prognostic modeling efforts by identifying what channel geometries are most likely to alter flow.
Since we consider only two initial setups, there is some question as to whether it is appropriate to evaluate our results in terms of channel depth rather than remaining shelf thickness after channel incision. Given that we chose to use the MISMIP+ bed and grounding-line position, we have a fixed shelf thickness and so considering incised or remaining thickness is equivalent. Future work to establish which of these two parameters governs how the channels affect flow will likely need to consider multiple ice-shelf thicknesses, and thus design new bed geometries, to identify which of these parameters is more important.
5. Conclusions
The importance of melt channels for ice-shelf dynamics depends on their size and position. Channels have the greatest effect on ice-shelf flow when they begin near the grounding line, and when they mechanically separate the shelf from lateral resistance, in which case they can cause an ice shelf to flow more than twice as quickly and result in substantially faster flow at the grounding line (>80%). In unconfined areas of shelves, channels have little effect on flow even at the central portion of the shelf (<35%). For controlling flow of grounded ice upstream, this difference in impact is compounded; channels in unconfined portions of shelves have almost no effect on upstream flow, while channels in the confined portion can substantially alter grounded flow dynamics. While a channel on one side of a shelf affects flow, its effect is usually less than half of what is caused by channels at both margins. Channels that are twice as deep have >200% effect on flow speeds, compared to <50% for channels that are twice as wide, suggesting that subtle changes in melt profile, even within a channel, can have a large effect on flow. Regardless of channel position, they can cause stresses to exceed the failure strength of ice, suggesting that rifting and thus further weakening are likely to result. However, this behavior only appears with channels deeper than 100 m, and the dependence on channel geometry is complex. Prognostic models that fail to account for channelization of melt, for example by using depth-dependent melt-rate parameterizations, are thus likely to underestimate the change in flow of ice-shelf/ice-stream systems in response to ocean forcing. Similarly, models that do not account for feedbacks between channel incision and fracture are also likely to underestimate changes in flow, since channels can cause increasing stresses that lead to rifting and further speedup.
Supplementary material
The supplementary material for this article can be found at https://doi.org/10.1017/jog.2025.36.
Acknowledgements
RBA acknowledges support from NSF (PLR 1738934) and NASA (80NSSC22K0384). This research was supported in part by Lilly Endowment, Inc., through its support for the Indiana University Pervasive Technology Institute. We thank two anonymous reviewers and the scientific editor, Matthew Siegfried, for comments that improved the precision and clarity of the manuscript.
Data availability statement
All data used in this study are publicly available. The model code can be found at https://github.com/icepack/icepack. Code to run the simulations presented here can be found at 10.5281/zenodo.14851944.


 Open access