


Introduction
The policy decisions of state governments profoundly impact people’s day-to-day lives. States are tasked with providing for the education, health, welfare, and public safety of residents. With politics becoming more and more polarized and gridlocked at the national level, state legislatures are increasingly a key locus of policy action and innovation. While the 113th Congress passed only 352 bills, state governments passed over 45,000 during the same two-year period.Footnote 1 These policies have far-reaching public consequences. In 2018, for example, 15 states adopted new restrictions on abortion and family planning; 18 passed legislation to increase the minimum wage; 43 states enacted new laws and resolutions related to either immigration enforcement or immigrant integration; and over 45 states considered laws to address the opioid crisis.Footnote 2
Despite the dramatic effects that state policies have on people’s health, welfare, and quality of life, we know little about the public communications patterns of state lawmakers. Existing research on state legislatures typically uses election data, roll-call votes, and surveys of lawmakers to document their behavior (Hamm, Hedlund, and Miller Reference Hamm, Hedlund, Miller and Haider-Markel2014). We have learned a great deal about the aggregate responsiveness of state policies to the public (e.g., Caughey and Warshaw Reference Caughey and Warshaw2016), the electoral consequences of legislator roll-call voting (e.g., Rogers Reference Rogers2017), and how the professionalism of state legislative institutions affects the lawmaking process (e.g., Squire Reference Squire2007). However, we currently lack widely applicable and scalable measures of the public communications of state legislators, despite the potential for such measures to unlock key research questions in state politics in the areas of agenda setting, political responsiveness, and policy-making. This measurement problem stems primarily from data limitations: collecting and analyzing thousands of press releases from all state legislators, for example, is an incredibly time- and resource-consuming task. As a result, we lack systematic information about state legislator engagement via their public communications platforms and whether and how they use such platforms to discuss policy.
In an effort to overcome these limitations, we pursue an empirical strategy that has not yet been widely applied in the study of state politics. Building on extensive work that leverages social media data to document the communications of members of Congress and national legislators in many countries (e.g., Barbera et al. Reference Barbera, Casas, Nagler, Egan, Bonneau, Jost and Tucker2019; Evans, Cordova, and Sipole Reference Evans, Cordova and Sipole2014; Hemphill, Russell, and Schöpke-Gonzalez Reference Hemphill, Russell and Schöpke-Gonzalez2020; Russell Reference Russell2018; van Vliet, Törnberg, and Uitermark Reference van Vliet, Törnberg and Uitermark2020), we study the public communications of state legislators from 15 different states by analyzing all of the messages they posted on Twitter in 2018.Footnote 3 We begin by introducing a variety of basic facts about the presence of state legislators on Twitter, including the proportion of state legislators who are on the platform, their levels of activity, and how this varies across state and party. Laying this descriptive groundwork is a critical first step for generating future research questions and developing new theory.Footnote 4 We find that more than 75% of state legislators in our 15 state sample have Twitter accounts, and they produce new messages on average once a day.
We then use state-of-the-art topic modeling techniques to predict the policy issues that state legislators discuss in their public communications. Prior work shows that a large number of national legislators use Twitter often and that the issues they discuss on the platform approximate the issues they address in their other public communications (Barbera et al. Reference Barbera, Casas, Nagler, Egan, Bonneau, Jost and Tucker2019; Casas and Morar Reference Casas and Morar2015). In order to discover the policy issues addressed in tweets by state legislators, we employ recent advances in the application of deep neural networks to text. We first use automated unsupervised feature extraction methods (so-called language models trained on large sets of unlabeled text) to transform each message into a list of word embeddings. We then feed these word embeddings into a convolutional neural net (CNN) that is trained to classify each tweet into topics according to a well-established policy issue categorization, the Comparative Agendas Project (CAP) codebook.Footnote 5 Our topic modeling approach is able to classify the policy content of state legislator tweets with 80% accuracy, and we demonstrate that state lawmakers discuss policy-relevant issues in 70% of their tweets.
Next, we demonstrate the value of the data and method by performing several initial empirical tests and validation checks that speak to debates in the state politics literature. For example, we find that while Twitter adoption is more common among state lawmakers in more professionalized legislatures, the rate of discussing policy areas is roughly equal across more and less professionalized states (conditional on being on the platform). We also discover that, contrary to existing theory, state legislators from competitive electoral districts are more likely to engage in policy debates than those from less competitive districts. Finally, we provide new evidence about which issues individual legislators discuss and whether state legislators focus on different topics than members of Congress. We show that legislators sitting on policy-relevant committees are generally more likely to tweet about the policy topic associated with that committee. Consistent with federalism literature on policy domains, we also find that state lawmakers are more likely than national legislators to discuss the areas traditionally associated with state politics—such as education and crime—and less likely to weigh in on national issues such as foreign trade.
The rest of the article is organized as follows. In the section “Using Twitter Data and Machine Learning to Study the Public Communications of State Legislators,” we introduce the data and present some initial descriptive statistics. In the section “Classifying Policy Relevant Tweets,” we describe the machine-learning method we designed to study the public communications of state legislators. In the section “Applying the Method to Study State Politics,” we review the literature on state politics to develop several exploratory hypotheses that allow us to apply and validate our method. The section “Predicting Twitter Usage Across State Legislators” presents our descriptive results, and the discussion section concludes by discussing some of the promising applications of this approach within the state politics literature.
Using Twitter Data and Machine Learning to Study the Public Communications of State Legislators
A growing literature examines how Congressional representatives use Twitter to engage in self-promotion, communicate with constituents, articulate their policy agendas, and discuss relevant public issues (e.g., Barbera et al. Reference Barbera, Casas, Nagler, Egan, Bonneau, Jost and Tucker2019; Casas and Morar Reference Casas and Morar2015; Golbeck, Grimes, and Rogers Reference Golbeck, Grimes and Rogers2010; Hemphill, Russell, and Schöpke-Gonzalez Reference Hemphill, Russell and Schöpke-Gonzalez2020). In general, research on social media has shown that political actors integrate social media platforms with their traditional campaign messaging strategies (Shapiro and Hemphill Reference Shapiro and Hemphill2017; Straus Reference Straus2018). Politicians often use Twitter and other social media platforms to link to content on their websites or in the traditional media (Jungherr Reference Jungherr2014; Kwak et al. Reference Kwak, Lee, Park and Moon2010), and journalists draw from social media messages in their political news coverage. Early work in this area uncovered few differences in the adoption and usage of social media platforms like Facebook, Twitter, and YouTube across politicians (e.g., Gulati and Williams Reference Gulati and Williams2011). However, over the past few years Twitter has become the dominant social media platform for most legislators as a result of its open network, which facilitates the ability to connect broadly with the public, as opposed to Facebook, which operates on a closed system (Evans, Ovalle, and Green Reference Evans, Ovalle and Green2016; Golbeck et al. Reference Golbeck, Auxier, Bickford, Cabrera, McHugh, Moore, Hart, Resti, Rogers and Zimmerman2018; Hemphill, Russell, and Schöpke-Gonzalez Reference Hemphill, Russell and Schöpke-Gonzalez2020).Footnote 6
But while research on Twitter usage among members of Congress has burgeoned over the past decade, studies of whether and how state legislators use the platform have lagged behind. An exception is Cook (Reference Cook2017), which documents state legislator presence on Twitter in 2016 and establishes several individual and district correlates of Twitter usage. Cook (Reference Cook2017) finds that legislators with leadership positions from more professionalized legislatures and those representing younger districts are more likely to have a Twitter account, but he also emphasizes that studies of state legislators and social media are relatively rare and that we still know little about the topics that legislators are discussing. Our study begins to fill this gap.
Sample and Data Overview
There are a total of 7,383 state legislators in the United States. In order to render the data collection and analysis more manageable, we focused on all legislators with a Twitter account from a sample of 15 states: Arizona, California, Florida, Illinois, Massachusetts, Montana, North Dakota, New Jersey, Nevada, New York, Ohio, Texas, Utah, Virginia, and Wyoming. Collecting and analyzing the tweets sent by these legislators proved to be an arduous task even for this subset of states. We obtained an initial set of state legislator Twitter handles via Google Civic API, and we then manually searched for accounts for every remaining lawmaker in our sample. We then had to operate within Twitter’s data collection limits/restrictions, and the accounts needed to be queried frequently during the period of analysis to make sure we did not miss any of the messages they sent. Finally, substantial computing power and a high-performing cluster were needed to train our machine-learning model and to generate topic predictions for all the tweets in our dataset.
Although the primary aim of this article was to establish a method for analyzing the policy content of state legislator tweets, we also wanted to draw some initial, exploratory comparisons across states. Although our 15 state sample means that any cross-state differences we uncover are necessarily tentative, we nevertheless selected these states with the goal of maximizing variation across several key features, including size, geographic region, levels of legislative professionalization, the partisan composition of the chambers, and whether the legislature was in session versus out of session. We based our selection criteria on data from a variety of sources, including the Census Bureau, the Correlates of State Policy Database, and the National Conference of State Legislatures.
Table 1 shows how the states in our study compare across these dimensions. The 15 states vary widely in the level of professionalization, including seven of the country’s most professionalized legislatures (Arizona, California, Illinois, Massachusetts, New Jersey, New York, and Ohio) and four of the least professionalized legislatures (Montana, North Dakota, Utah, and Wyoming), according to the Squire Index (Squire Reference Squire2007). Moreover, these states vary dramatically in how politically competitive they are, with some legislatures serving as safe one-party bastions (e.g., Wyoming and Massachusetts) and others electing a close mix of Democrats and Republicans (e.g., Virginia). Additionally, four of these state legislatures did not actively convene in 2018 (North Dakota, Montana, Nevada, and Texas), allowing us to compare public communication patterns among legislators both in and out of session.
Key features of the states selected for the analysis
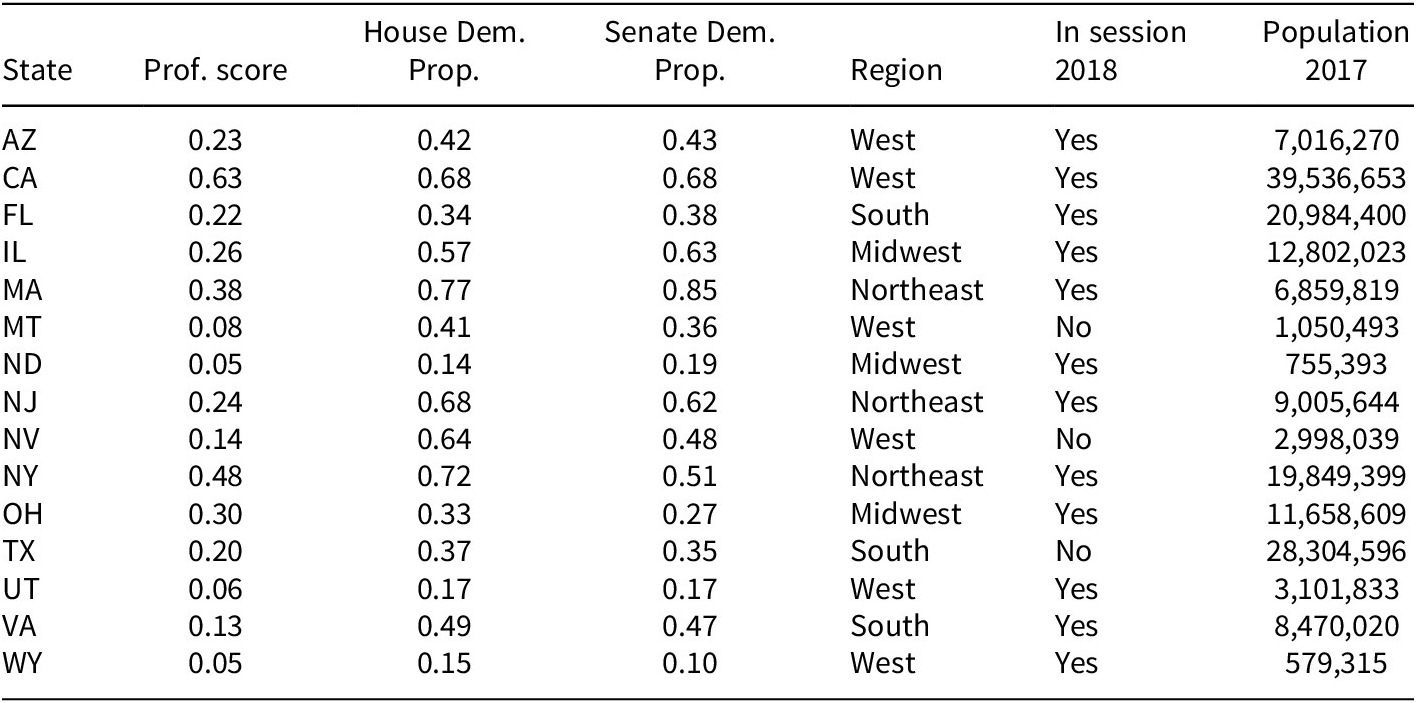
Note. Professionalism Score is from The Correlates of State Policy Project (http://ippsr.msu.edu/public-policy/correlates-state-policy), population is from the 2017 American Community Survey (https://www.census.gov/programs-surveys/acs/news/data-releases/2017/release.html) and the partisan composition variables are from the National Conference of State Legislatures for the year 2018 (http://www.ncsl.org/research/about-state-legislatures/partisan-composition.aspx).
After selecting this set of states, we collected the Twitter handles for every legislator who was on the platform. First, we used the Google Civic API, which provides the user handles for most state legislators. Then, to make sure that we did not miss any Twitter accounts for the remaining lawmakers, we manually searched for them online, finding a few additional Twitter handles for active lawmakers.Footnote 7 Before examining the policy content of state legislator tweets, we begin by introducing several novel facts about Twitter presence among state legislators. In Table 2, we report the number of legislators by state and party in 2018—Legislators (N)—and the number and the proportion for which we found a Twitter account—Legislators on Twitter (Prop). Overall, 75% of policy makers in these 15 states had a Twitter handle (1,515 out of 2,025). In some states, most legislators are on the platform (such as California and Texas), while in other states only a minority are Twitter users (e.g., Montana and North Dakota).
State legislator twitter activity by state and party

There is clearly more variation in Twitter adoption among state legislators than among members of Congress. In 2018, for example, all 100 US Senators and every member of the House of Representatives had an account (Straus Reference Straus2018). Along with determining whether legislators simply had a Twitter account, we also assessed average use. Twitter usage is particularly low among members of the least professionalized legislatures—that is, Wyoming and North Dakota, where lawmakers on Twitter send fewer than 0.5 messages a day, on average—and much higher in states like California and Arizona, where state legislators tweet more than once a day.Footnote 8
We note here that the self-selection of state legislators onto Twitter across states necessarily limits our analysis to descriptive inference. If only a small proportion of lawmakers in states like Wyoming and North Dakota choose to adopt the platform, these legislators are likely different from other representatives in their states. They might be younger, more tech savvy, more concerned about representation, or any combination of factors. We stress that one of the main contributions of this article is introducing a method that allows us to collect, classify, and analyze the policy content of state legislators’ tweets. While the preliminary analyses that we conduct with these data and this method are exploratory in nature, they nonetheless suggest several important avenues for future research in state politics and public communications.
Classifying Policy Relevant Tweets
We collected every tweet sent by these legislators from January 1 to December 31, 2018, using the Twitter REST API to collect the legislators’ timelines every month. The API allows developers to collect the last 3,200 messages sent by a given user, so this data collection strategy meant that we were able to collect all the tweets that the legislators sent during this time period: a total of 576,461 messages. The next step was to identify policy topics discussed in tweets (as well as classify non-policy relevant messages). Given the large number of tweets, manual coding was not practical for the full corpus. Instead, we trained a machine-learning model (a CNN) predicting whether each tweet discussed one of the 21 topics of the CAP (Baumgartner and Jones Reference Baumgartner and Jones2010), a comprehensive and widely used classification scheme for studying political agendas.Footnote 9 We also added a non-policy-issue category reserved for tweets that did not address any policy area, such as tweets commemorating holidays.Footnote 10
We chose to train a neural network, rather than a more simple bag-of-words or ngram-based model (such as a decision tree or a support vector machine [SVM]) or an unsupervised model (such as Latent Dirichlet Allocation (LDA)) (Blei, Ng, and Jordan Reference Blei, Ng and Jordan2003) for three main reasons. First, in recent years neural networks have been shown to outperform more simple models in many textual tasks, including text classification (Hassan and Mahmood Reference Hassan and Mahmood2017; Joulin et al. Reference Joulin, Grave, Bojanowski and Mikolov2016). Moreover, as we show in Supplementary Table A2, after running some initial tests we found that the CNN model outperformed an SVM, the ngram-based model that previous research had found to be most accurate in predicting the CAP-topics discussed in congressional bills as well as tweets (Collingwood and Wilkerson Reference Collingwood and Wilkerson2012; Hemphill and Schöpke-Gonzalez Reference Hemphill and Schöpke-Gonzalez2020).
Finally, although unsupervised topic models have also been shown to be useful for studying tweets and the public communications of politicians (Barbera et al. Reference Barbera, Casas, Nagler, Egan, Bonneau, Jost and Tucker2019), recent studies (e.g., Denny and Spirling Reference Denny and Spirling2018) suggest that supervised approaches may yield more stable and robust results, making them a preferable option. Similar to Kim (Reference Kim2014), we trained a three-layer CNN. Figure 1 shows the architecture used to identify CAP-topics. We next describe our two main model architectures and then outline our training data-sets and validation scheme in detail.
Architecture of the convolutional neural net predicting the policy topics discussed in tweets by state legislators.
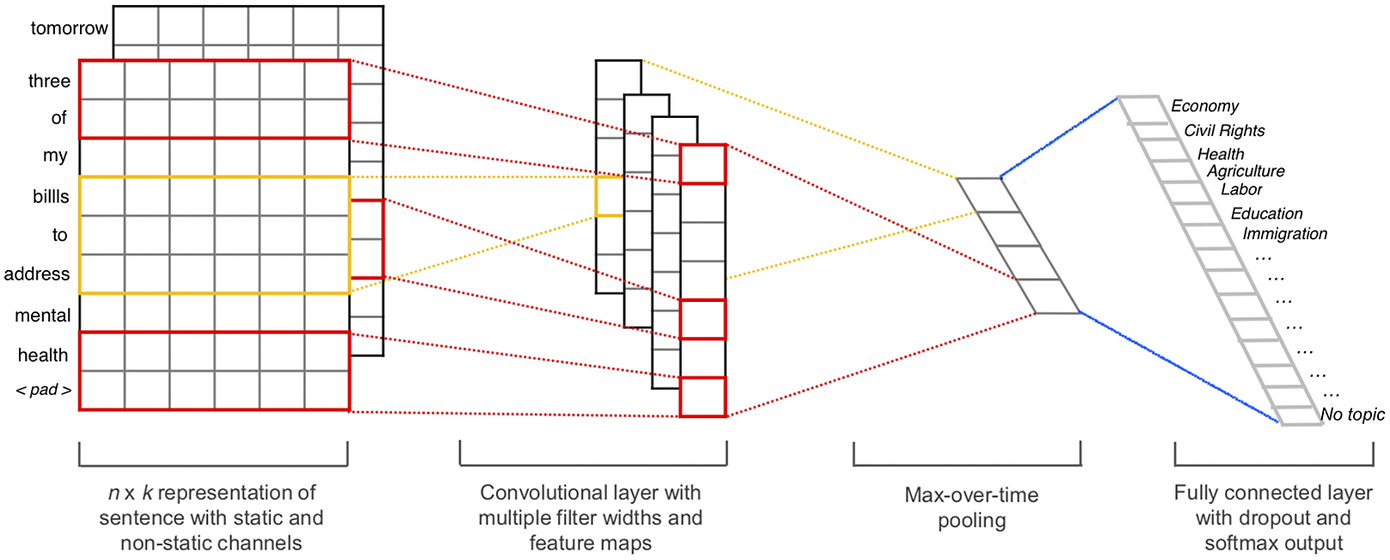
First, we represented each word in a given sentence as a 300-dimension word—embedding (a vector that ideally represents an integration of each word’s meaning and context/position in the text as dense features for further analysis) (Terechshenko et al. Reference Terechshenko, Linder, Padmakumar, Liu, Nagler, Tucker and Bonneau2020). We obtained the model used to produce word-embeddings by finetuning a pretrained Word2Vec model for an additional 10 epochs (Mikolov et al. Reference Mikolov, Chen, Corrado and Dean2013), to which we had first added all unique new vocabulary present in our training datasets as well as in the tweets to which we wanted to apply the resulting model.Footnote
11 This results in a three-dimensional matrix ( $ n\times k\times d $
) that is used as our primary model input, where
$ n\times k\times d $
) that is used as our primary model input, where $ n $
is the maximum word length for all training documents,
$ n $
is the maximum word length for all training documents, $ k $
is the size of the embedding (300), and
$ k $
is the size of the embedding (300), and $ d $
is the number of documents to pass through to the CNN.
$ d $
is the number of documents to pass through to the CNN.
The CNN that comprises our second model (the model used to classify CAP topic and political relevance) has three convolutional layers of different sizes, each processing three-, four-, and five-word embeddings at a time, which produces hidden layers of different sizes. These hidden layers are joined into a single vector for each document by max-pooling the weights in each word-vector. The last stage of the CNN is comprised of a fully connected layer mapping the previous max-pooled vector to the 21 CAP issue classes (20 policy areas plus the “non-policy/not-relevant” class). We employ a cross-entropy loss function, and gradient optimization is performed via adaptive moment estimation (Kingma and Ba Reference Kingma and Ba2015). We use a batch size of 64 for training the model.
Model Training and Accuracy
We trained the model with four datasets and a total of 855,854 text records, described in Table 3: (A) all available CAP-labeled datasets for the United States available on the CAP website (789,004 records), (B) 45,394 tweets from Senators who served during the 113th Congress and that were labeled by Russell (Reference Russell2018), (C) 18,088 tweets sent by media accounts and followers of our state legislators that we coded according to the CAP classification, and (D) 3,368 tweets sent by the state legislators that we also coded.Footnote 12 Building on recent advances in transfer learning, we combined these datasets and tried many data combinations when training the model. We assessed the out-of-sample accuracy of each model/data-combination pair and selected the best-performing model-data pairing to generate topic predictions for all tweets sent in 2018 by the state legislators in our sample. In Supplementary Appendix A, we provide a detailed explanation of the training process, as well as evidence showing how the CNN model outperformed an SVM algorithm—the ngram/bag-of-words model that to date has been shown to perform best at classifying text into the CAP topic categories.
Public datasets coded using the CAP 21-issue classification, used for training and testing a classifier predicting Policy Issues in tweets from state legislators

In Table 4, we report accuracy measures for our best-performing CNN. During training, we split the labeled data into a train, test, and validation set. We used the Train set to calculate the model loss and update the model weights at each iteration. We used the Test set to calculate at each iteration how well the model was performing on a heldout set, as well as to calculate the final out-of-sample accuracy of the trained model. Although we did not use this test set for training the model per se, we did rely on it during training to evaluate the model loss and update the model parameters at each iteration, and to decide for how many iterations the model needed to be trained. For this reason, we also report the accuracy of the model when generating predictions for a completely untouched Validation set. Moreover, we assess the accuracy when predicting all tweets in the test/validation split (All), and also when only predicting the tweets coded as being about one of the policy areas after excluding the non-policy tweets (Policy). Because the tweets not related to any policy area represented a large part of the tweets we coded from state legislators, we wanted to ensure that our model did well at both distinguishing overall policy relevance and at distinguishing between policy areas.
Out of sample accuracy of best-performing CNN model we trained predicting the political topics of the CAP

Table 4 indicates that the best-performing CNN does a good job at distinguishing between tweets that are about policy issues and those that are not, and between policy-relevant tweets on different topics. Predicting a large number of (unbalanced) topic classes (n = 21) is a very complicated task, yet the test accuracy in both cases is close to 80%. More importantly, the validation accuracy based on the untouched labeled tweets sent by state legislators is close to 60%. Despite many precautions to avoid over-fitting on the training and test sets (e.g., including a drop-out rate during estimation and waiting for the test accuracy to slightly decline before stopping the training), the drop in accuracy between the test and validation sets is expected given that the test set has been used to calculate the model loss and update the model parameters at each iteration, whereas the validation set has been completely untouched.
The largest issue category in the annotated set (Govt. Operations) accounts for 26% of all messages coded as being about a policy issue. Hence, a naive model classifying all tweets into the modal category would only get it right 26% of the time. This best-performing CNN is 79 and 55% accurate when distinguishing between issue categories, substantially more accurate than this naive model. In addition, as pointed out, this CNN outperforms more simple ngram/bag-of-words models such as an SVM algorithm (see Supplementary Table A2).
We run many additional validation exercises to assess the performance of the model. In Table 5, we show that the accuracy and f-score (based on the held-out test sets) are very high for all the topic classes, despite most of them being rarely discussed. To assess the face validity of the model, in Table 6 we show the top distinctive text features of the tweets predicted to be about each topic. Reassuringly, the top features seem to be relevant to each policy area. As a final test, we examine the proportion of daily tweets on immigration in 2018 to see whether attention to that topic peaked at moments where we would expect it to, such as when the President presented his immigration plan in the beginning of the year, during the child separation crisis at the end of June, and when the “caravan” of central-American refugees heading north became salient at the end of October. We find that the tweets classified as being about immigration indeed increased when immigration was actually salient in the news during 2018 (see Supplementary Figure B1).
Class accuracy and f-score for the best-performing model

Top distinctive features of tweets predicted by the CNN to be about each topic or policy area

In sum, these many validations indicate that this CNN model does a satisfactory job at distinguishing between tweets about a policy (vs. non-policy relevant messages) and between different policy issue categories. However, we note that less than perfect accuracy suggests that we are measuring our variables of interest with measurement error. But, as will be seen in the analysis, we are aggregating over many tweets, and thus any stochastic measurement error becomes smaller.
Applying the Method to Study State Politics
Having introduced the data and our topic modeling method for classifying the policy content of state legislator tweets, we now zoom back out to consider how this approach can contribute to the study of state politics. We begin by drawing from the state politics literature to develop theoretical intuition about the state-level and individual-level variables that might matter for state legislator behavior on Twitter. After developing some tentative hypotheses, we perform a variety of exploratory analyses that both validate the method and allow us to investigate how state legislators use Twitter to discuss policy.
State-Level Correlates of Twitter Activity
As a first cut to examine how Twitter behavior varies across state contexts, we focus on three institutional variables: term limits, degree of legislative professionalism, and whether a legislature is in session or not. Proponents of term limits have hypothesized that limiting the time that lawmakers can serve will lead them to spend more time on legislative activities and less time pursuing reelection goals (Carey, Niemi, and Powell Reference Carey, Niemi and Powell2009; Glazer and Wattenberg Reference Glazer and Wattenberg1996). Legislators in term-limited states might be forced to engage with new ideas and be less wed to the status quo by experiencing frequent turnover. At the same time, a constant influx of new members might make it difficult for lawmakers to get up to speed with current policy debates. Empirical work tends to support this latter view (Moncrief and Thompson Reference Moncrief and Thompson2001; Peery and Little Reference Peery, Little, Farmer, Rausch and Green2002), but Kousser (Reference Kousser2005) finds that legislators at the end of their term often experience a burst of productivity as they seek to enact policies before being termed out. Given the additional informational hurdles associated with term limits, we tentatively expect state legislators in term-limited states to be less active on Twitter than those in non-term-limited states.
One of the most important institutional variables in the state politics literature is legislative professionalization. State legislative professionalism refers to the ability of legislative bodies to generate and digest information throughout the policy-making process (Squire Reference Squire2007). Legislators from states with professionalized legislatures spend more time in session and have more staff resources at their disposal. For example, the two most professionalized legislatures are California and New York, where state legislators earn over $100,000 a year and have access to over 2,000 permanent staffers. In contrast, legislators in Wyoming meet only every two years, earn $150 a day, and collectively employ only 100 staffers. Given these differences in resources, legislators in professionalized states tend to be more attentive to constituent concerns (Lax and Phillips Reference Lax and Phillips2009; Maestas Reference Maestas2003) and pass a higher proportion of bills than their colleagues in less-professionalized chambers (Tan and Weaver Reference Tan and Weaver2009). We therefore expect legislators in the most professional states to be more likely to have Twitter accounts and to discuss policy-relevant issues than legislators in states with less professionalized legislatures.
Finally, we examine whether being in session predicts Twitter use among state legislators. In the United States, 46 states meet in annual legislative sessions, but four meet only every other year. When legislators are off-session, do they substitute social media activity for their regular legislative duties? The theoretical expectations here are unclear. Legislators who are currently in session are more likely to be actively dealing with policy issues related to current bills. But lawmakers in states with significant time spent out of session are often quite active in their district, particularly in terms of communicating with constituents (Jewell Reference Jewell1982). They also might have more time to spend on Twitter compared to legislators that are in session. Because session length is one of the components used to generate measures of legislative professionalism (Squire Reference Squire2007), we caution against any sort of causal interpretation. Nevertheless, four of the states in our sample were not in session in 2018—Montana, Nevada, North Dakota, and Texas—and in our predictive models we include an indicator for being in session to account for any differences in Twitter activity (after adjusting for overall professionalism).
Individual Correlates of Twitter Activity
We also consider several individual-level correlates of Twitter behavior among state legislators. These include standard demographic traits such as race and gender, as well as political traits such as leadership position, number of committees served on, seniority (in years), whether the legislator is serving their last term, and the electoral margin of victory in the district. Existing empirical work shows that lawmakers in leadership positions are more active on Twitter (Scherpereel, Wohlgemuth, and Lievens Reference Scherpereel, Wohlgemuth and Lievens2018), likely because of their public-facing role and the additional resources at their disposal. Serving on more committees may or may not influence Twitter behavior, although we tentatively expect that more committee service will be associated with more active Tweeting across different policy areas. Similarly, seniority might cut either way: more senior members could lag behind in terms of technological adoption (Cook Reference Cook2017), but they might also possess unique policy expertise. Building on the literature on term limits discussed above, we expect those legislators serving in their last term to focus less on their public communications and so to be less active on social media.
The literature offers a more clear-cut prediction when it comes to district competitiveness. Legislators in competitive districts face different communication incentives than representatives from safer districts. For example, competitive elections can cause candidates to avoid engaging directly on policy issues in debates (Simon Reference Simon2002), and representatives in competitive districts tend to avoid articulating specific positions (Casas and Wilkerson Reference Casas and Wilkerson2017; Grimmer Reference Grimmer2013). We therefore expect legislators from competitive districts to discuss policy issues on Twitter at lower rates than other lawmakers.
Which Policy Areas do State Lawmakers Focus on?
Finally, we turn to the question of which specific policy issues state legislators dedicate their attention to. As an initial validity check, we examine whether legislators on committees with a clear policy focus are more likely to tweet about that policy area. We find strong evidence that this is the case for most committees. We then draw from two competing theoretical accounts to examine whether state legislators are more likely to discuss policy issues that are generally considered to be the domain of state government, or if they focus equally (or more) on national issues.
Research on federalism typically argues that candidates for different levels of office tend to focus on the policy areas that are most directly tied to that office (e.g., Jacob and Vines Reference Jacob and Vines1965; Laumann and Knoke Reference Laumann and Knoke1987). An extension of this logic would suggest that state legislators should pay more attention to issue areas that are primarily the domain of state government as opposed to the federal government. The policy areas that are traditionally the focus of the federal government are finance and domestic commerce, defense, science and technology, foreign trade, and international affairs and aid (Kollman Reference Kollman2017). Most state legislatures do not have standing committees on these issues (Fouirnaies and Hall Reference Fouirnaies and Hall2018), and the federal government has sole power to conduct foreign affairs and regulate interstate commerce. On the other hand, states are constitutionally tasked with providing for health, education, welfare, and public safety. The following policy areas are generally the realm of state government and also comprise the largest share of legislation passed by state legislatures (Jewell Reference Jewell1982): health, education, labor and employment, transportation, law and crime, social welfare, and housing.Footnote 13
At the same time, the increasingly nationalized nature of American politics might blur these traditional boundaries. If voters tend to be more engaged with and knowledgeable about issues that are the purview of the federal government, it would make sense for state legislators to focus on those national issues as well (Hopkins Reference Hopkins2018). In summary, if we find that state legislators are more likely to discuss issues that have traditionally been the focus of state government, that would be consistent with the predictions of the policy domain literature. In contrast, null findings here would be consistent with recent arguments about the nationalization of politics.
Predicting Twitter Usage across State Legislators
We now demonstrate how our data and policy classification approach can be used to study the political communication behavior of state legislators. We begin by examining how the state-level and individual covariates introduced in the previous section predict three key outcomes: (1) whether a legislator is on Twitter (a binary outcome estimated via logistic regression), (2) whether the legislator is an active user (based on logged number of tweets estimated via linear regression), and (3) whether the legislator discusses policy issues (i.e., the proportion of tweets about a policy issue estimated via linear regression). The unit of observation in the following analyses is an individual legislator. We run two sets of models. In the first set, in order to explore the correlations for our state-level covariates (Legislative Professionalization, Legislature in Session ’18, and Term Limits), we do not estimate any state-level parameters, although we do cluster the standard errors at the state level.
However, given that the data points are not fully independent because groups of legislators belong to the same state, we also run a set of multilevel models with state random intercepts. This second set of analyses allows us to explore individual-level correlations while accounting for state-level differences. Equations (1) and (2) show the specifications for the first set of logistic and linear regressions, respectively, where we model outcomes for legislator $ i $
in state
$ i $
in state $ j $
with a single intercept (
$ j $
with a single intercept ( $ \alpha $
) and standard errors clustered at the state (
$ \alpha $
) and standard errors clustered at the state ( $ j $
) level:
$ j $
) level:
 $$ {y}_{ij}=\frac{1}{1+{e}^{-\left(\alpha +\beta {X}_{ij}+{\varepsilon}_{ij}\right)}}, $$
 $$ {y}_{ij}=\alpha +\beta {X}_{ij}+{\varepsilon}_{ij}. $$
We then estimate Equations (3) and (4), which include state random intercepts ( $ {\alpha}_j $
):
$ {\alpha}_j $
):
 $$ {y}_{ij}=\frac{1}{1+{e}^{-\left(\alpha +\beta {X}_{ij}+{\alpha}_j+{\varepsilon}_{ij}\right)}}, $$
 $$ {y}_{ij}=\alpha +\beta {X}_{ij}+{\alpha}_j+{\varepsilon}_{ij}. $$
In Figure 2, we use the results from these models to report the marginal effects of each covariate on the likelihood of each of these outcomes. The coefficients from the pooled models are shown with circles, and the results from the multilevel models are shown with triangles. For continuous variables, we express the marginal effect of a one standard deviation change, and for dummy/categorical variables we expressed the marginal effect of belonging to the specified group (compared to the reference category).Footnote 14
Logistic regressions (left panel) and linear models (two right panels) predicting which legislators are on Twitter (binary outcome), how active they are on the platform (count variable), and how often they use it to discuss policy issues (proportion of tweets about one of the CAP policy areas). Note: The top three rows (above the dotted line) are state-level covariates, while the other covariates measure individual-level attributes. Results of the “Being on Twitter” model are based on 1,267 legislators for which all covariates are available. Results for the “Being Active: Num. Tweets” are based on 998 legislators (those from the previous model that are on Twitter). The results of the final model are based on 829 legislators (those from the previous model that sent more than one tweet in 2018). For continuous variables, we calculate the marginal effect of a one standard deviation change (Legislative professionalization, Number of committees, Seniority, and Electoral margin of victory). For binary and categorical variables, we calculate the marginal effect of belonging to that category (i.e., being a Democrat rather than a Republican). Coefficient tables for these regressions are available in Supplementary Table B1.

As suggested by the raw data presented in Table 2, legislators in more professionalized states are more likely to have a Twitter account (about three times more likely) as well as to be active on Twitter. A one standard deviation increase in the legislative professionalization score correlates on average with a 15% increase in the number of tweets sent by individual legislators in 2018. Although social media drastically lowers the costs for state legislators to directly communicate with their constituents, the level of professionalization (salary, number of permanent staffers, and so forth) still appears to correlate with the adoption and usage of such communication channel. However, legislators in more professionalized legislatures are not more likely, ceteris paribus, to discuss policy issues in their tweets than legislators from less professionalized legislatures.Footnote 15
This last finding may indicate positive selection among the set of legislators who are on Twitter in less-professionalized states. Perhaps only the most ambitious or policy-oriented lawmakers make an additional effort to “go public” and join Twitter in these states, so conditional on having an account, these lawmakers are equally likely to tweet about policy. But even if this result is merely an artifact of self-selection, the fact that the public communications of certain legislators in less professionalized states resemble those of their peers in more professionalized legislatures is a finding that warrants additional attention in future research. We typically observe stark differences in the behavior and output of legislators from more or less professionalized states (e.g., Berry, Berkman, and Schneiderman Reference Berry, Berkman and Schneiderman2000; Kousser and Phillips Reference Kousser and Phillips2009; Maestas Reference Maestas2003; Malhotra Reference Malhotra2008). However, it remains unclear whether these differences reflect hard institutional constraints or differences in the types of lawmakers that serve in different states. Future work in this area might explore whether social media platforms like Twitter can allow policy-oriented lawmakers with fewer resources at their disposal to substitute for more costly public communication.
Interestingly, legislators in session are not more likely to discuss policy topics compared to legislators out of session. While we might expect legislators in session to be more likely to engage with policy debates related to current bills being considered, journalistic accounts of state legislators indicate that members spend a great deal of time working on local issues and communicating with constituents when they are away from the capitol. As John McDonald of the New York State Assembly explains, “During the off season…I spend a significant amount of time talking to local government officials and assisting when appropriate on local issues.”Footnote 16 While we caution that being in session is closely correlated with legislative professionalism, this finding indicates that the data and method used in this article might be useful in shedding light on how legislators shape the policy agenda during their time out of session.
Finally, legislators from states with term limits are not systematically more likely to be on Twitter, to be more active, or to discuss policy issues at a higher rate. However, this dichotomous state-level variable does not fully capture whether legislators at the end of their term behave differently. When turning to the individual-level correlates, we observe that those legislators from states that have term limits and who are serving in their last term are less active in terms of number of tweets sent compared to other policymakers. This makes sense if state lawmakers in their final term are no longer driven by reelection pressures and put less effort into communicating their messages to their constituents (Alt, de Mesquita, and Rose Reference Alt, de Mesquita and Rose2011; Carey Reference Carey1994; Fouirnaies and Hall Reference Fouirnaies and Hall2022). At the same time, these legislators in their final term are marginally more likely to discuss policy-related issues, consistent with the idea that lawmakers might feel more free to take positions on hot-button policy issues relative to their peers who are facing potential reelection.
We examine several additional individual-level characteristics that predict the activity of state legislators on Twitter. In general, note that the estimated coefficients are quite similar substantively between the pooled and the multilevel models, suggesting that any observed individual differences are not merely picking up public communication tendencies that vary across states. The most surprising result is that we find no correlation of district margin of victory with either the likelihood of being on Twitter or discussing policy-relevant issues. If anything, it appears that as margin of victory increases (i.e., as districts become safer), legislators become less likely to discuss policy (although the difference is not statistically significant). Existing theoretical and empirical work typically predicts that candidates in more competitive elections will avoid articulating specific policy positions (e.g., Grimmer Reference Grimmer2013; Simon Reference Simon2002). A topic ripe for future research would be to determine whether strategic engagement with policy issues operates differently at the subnational level, or if this result reflects something distinct about social media as a policy platform.
We uncover additional interesting findings when looking at the other individual-level predictors. We observe Democrats to be approximately 50% (1.5 times) more likely to be on Twitter. Given that most legislators in large states and professionalized legislatures are on the social media platform, this difference is mainly driven by Democrats in smaller states and less professionalized legislatures who are more likely than their Republican counterparts to have an account on Twitter (i.e., legislators from North Dakota, Utah, and Montana). Out of those state legislators on the platform, Democrats also sent approximately 10% (1.1 times) more messages than Republican state legislators. In terms of seniority, we find younger members to be more likely to be on the platform and to be active users. However, conditional on these two previous factors, we observe senior members to be more likely to discuss substantive policy issues in their tweets. Given their extended policymaking experience, we speculate that those senior members who decide to be on the platform are better equipped to engage in policy-oriented conversations.
We also examine several individual correlates of Twitter activity for which we lacked ex-ante hypotheses but which nonetheless reveal intriguing initial patterns. First, legislators who are Black or Hispanic are on average more likely to be on Twitter (although the difference is not statistically significant), but this correlation appears to be largely driven by the fact that non-white legislators are more likely to serve in states where Twitter adoption is high. After including random state effects in the models, the coefficients on both of these variables shrink. However, we do observe a positive and precise difference for Hispanic legislators when it comes to being active on Twitter: on average they send approximately 20% (1.2 times) more tweets than white legislators. This correlation holds in both the pooled and the multilevel models.
Finally, we find no difference in Twitter presence or activity between men and women. Previous work has shown that women in Congress are more likely to discuss policy on Twitter relative to men (Evans and Clark Reference Evans and Clark2016; Evans, Ovalle, and Green Reference Evans, Ovalle and Green2016).Footnote 17 This research typically argues that women face additional obstacles in demonstrating their merit for office and that they can use social media platforms such as Twitter to counter coverage in the mainstream news that often focuses on their personal traits. However, after adjusting for each of the other state-level and individual-level predictors, we uncover no correlation between gender and Twitter activity. Whether this result indicates that women and men behave more similarly in their social media usage in state legislatures relative to Congress is beyond the scope of this article but deserves additional attention in future research.
State Legislators and Tweets about Policy
Next, we turn to the question of which specific policy areas state legislators are discussing. As an initial validity check, we examine if members are more likely to discuss policy areas when they serve on the associated policy-relevant committee. For example, are legislators on the education committee more likely to discuss education in their tweets? We find strong evidence that this is indeed the case across a variety of committees and display the likelihoods in Figure 3. In general, serving on a specific committee (such as energy, environment, education, immigration, or public lands) is correlated with discussing that topic on Twitter. For example, those serving on an Energy-related committee are approximately three times more likely to discuss energy-related topics in their tweets. Note that for the policy areas where committee-service is not predictive (e.g., civil rights and the economy), it is likely that all legislators are actively engaged in discussing these topics.
Ordinary least squares (OLS) models predicting the proportion of tweets legislators dedicate to discussing each topic as a function of being on a committee on the topic, plus the covariates included in the models in Figure 2. Standard errors clustered by state. Note: We estimated a separate OLS model for each topic, and we report in the figure the coefficient for the variable indicating whether the legislator served in a committee about that topic. The coefficient for the Housing policy area (estimate of 22.7 with a confidence interval from 12.6 to 32.7) has been excluded because its large value made it difficult to interpret the rest of the coefficients.

We can also examine attention to issues by state as opposed to by committee. In Figure 4, we show the relative attention given to each topic by state. For each state (column), the cell entry gives the percentage of tweets from legislators in that state’s legislature that are about the row topic, conditional on the tweets being about a policy topic. While we mainly present this as an example of the type of analysis that can be done with this data, it is worth noting that there are some interesting observable patterns that are consistent with the idea that state legislators are more likely to discuss issues that are more important for their particular state. For example, legislators from California, North Dakota, and Wyoming are more likely to discuss agriculture, and lawmakers from Arizona, California, New York, and Texas are more likely to discuss immigration. These unsurprising patterns add validity to our measures and suggest several useful applications for our classification approach in terms of documenting agenda setting at the state level.
Proportion of attention that legislators from each state devoted to each issue area in 2018.

Finally, we turn to the question of whether state legislators tend to focus on “state issues.” According to the literature on federalism, we would expect lawmakers to pay special attention to the domains over which they have the most impact. At the same time, as suggested by recent work by Hopkins (Reference Hopkins2018), it could be that the increasing nationalization of US politics leads state actors to focus equally or more on national issues. Using traditional classification schemes from work on functional federalism, we divided each policy issue into one of three categories: state, federal, or joint. In the left panel of Figure 5, we show the percentage of policy-relevant tweets on each topic broken down by issue type sent by state legislators and members of Congress in 2018. Then in the right panel, for each of the policy areas, we take the difference between the proportion of tweets sent by state legislators and the proportion sent by members of Congress, which allows us to more clearly display how much more (or less) state legislators discuss particular policy areas relative to members of Congress.
Percentage of policy-related tweets on each topic: Members of Congress and State Legislators. Note: On the left panel, darker bars indicate how much of the policy-related tweets from State Legislators are about each topic. Lighter bars indicate the attention paid by Members of Congress.

We find that state legislators and members of Congress pay similar amounts of attention to most policy areas. However, at the margins, we find evidence consistent with the policy domain literature. State legislators do seem to be more likely to discuss areas that are traditionally the domain of state government, such as education, law and crime, transportation, and housing. Members of Congress are more likely to discuss national issues such as defense, international affairs, and foreign trade. These differences are fairly small—often only a few percentage points—but they suggest that state legislators are nominally focused on a different set of issues, many of which are at the forefront of major policy battles today.
Discussion
In this article, we used state-of-the-art deep learning techniques to uncover the topics discussed by policymakers from 15 US states on the social media platform Twitter, providing a valuable new method and measurement technique for studying state politics. In doing so, we also make several contributions to the study of agenda setting and public communications in state legislatures. First, we add to a nascent body of work demonstrating that state legislators use Twitter as one of their main public communications platforms (e.g., Cook Reference Cook2017). We also provide new evidence that both Twitter adoption and social media use by lawmakers varies substantially across states, and we validate an original approach to classifying the policy content of state legislator tweets.
Using these new data and measurement approaches, we uncovered several interesting patterns that are relevant to work on state-level policy and public communications. For example, in contrast to research showing that lawmakers working in less professionalized state legislatures are less politically ambitious and less productive (Hogan Reference Hogan2008; Maestas Reference Maestas2000; Malhotra Reference Malhotra2008), we find that the state legislators that use Twitter in these states are actually equally likely to discuss policy issues relative to their counterparts in more professionalized settings. We also find that state legislators in competitive districts are no less likely to discuss policy issues on Twitter compared to legislators in safe districts. According to most theoretical research, marginal legislators should spend more effort emphasizing their appropriations or constituency casework compared to discussing policy (Ashworth and de Mesquita Reference Ashworth and de Mesquita2006; Grimmer Reference Grimmer2013; Weingast, Shepsle, and Johnsen Reference Weingast, Shepsle and Johnsen1981). The fact that this does not appear to be true for state legislators on Twitter poses an intriguing puzzle for future research in this area.
Finally, we also find that state legislators are marginally more likely to discuss policy areas that are traditionally the domain of state government—such as law and crime, education, and transportation—than are members of Congress. At the same time, they are slightly less likely to discuss national issues such as defense and international affairs. These findings suggest that even given the nationalization of American politics over the past decade, state and federal lawmakers are still focusing their attention on distinct sets of issues that are directly relevant to the functions of each level of government.
One of the benefits of studying state politics is that researchers can examine how institutional or other environmental factors affect political phenomena of interest. We uncover evidence that substantial variation exists in terms of Twitter adoption and engagement across states. While we demonstrate that legislative professionalism and term limits appear to explain some of this variation, further unpacking when and how state legislative activity on Twitter varies across states will be a clear next step for this research agenda.
More broadly, we hope that the results and methodological approach introduced in this article serve as a launchpad for scholars interested in studying agenda setting, policy-making, and communication at the state level. This article demonstrates that classifying the policy content of state legislator tweets is indeed possible, which opens up a wide variety of future avenues for work in this area. For example, how does the Twitter usage of state politicians in communicating with their constituents and discussing their policy positions compare with national politicians? How do the policy priorities of state legislators vary across states and in relationship to important state-specific events over time? How does the agenda-setting process differ between the state and federal level? And finally, how responsive are state legislators to the mass public when it comes to issue attention? These are just a few of the areas ripe for future research that might use the data collection and classification approaches established in this article.
Supplementary Materials
To view supplementary material for this article, please visit http://doi.org/10.1017/spq.2022.1.
Data Availability Statement
Replication materials are available on SPPQ Dataverse at https://dataverse.unc.edu/dataset.xhtml?persistentId=doi:10.15139/S3/50TOWY (Payson et al. Reference Payson, Casas, Nagler, Bonneau and Tucker2022).
Acknowledgments
We thank Srinivas Parinandi for helpful comments and suggestions on the draft presented at the 2019 Annual Meeting of the Midwest Political Science Association.
Funding Statement
This research was supported by the Bill and Melinda Gates Foundation. We also gratefully acknowledge that the Center for Social Media and Politics at New York University is supported by funding from the John S. and James L. Knight Foundation, the Charles Koch Foundation, Craig Newmark Philanthropies, the William and Flora Hewlett Foundation, the Siegel Family Endowment, the Bill and Melinda Gates Foundation, and the National Science Foundation.
Conflict of Interest
The authors declared no potential conflicts of interest with respect to the research, authorship, and/or publication of this article.
Author Biography
Julia Payson is an assistant professor at New York University in the Department of Politics and a Research Associate at NYU’s Center for Social Media and Politics.
Andreu Casas is an assistant professor at Vrije Universiteit Amsterdam in the Department of Communication Science and a research associate at NYU’s Center for Social Media and Politics.
Jonathan Nagler is a professor at New York University in the Department of Politics and co-director of NYU’s Center for Social Media and Politics.
Richard Bonneau is a professor at New York University in the Departments of Biology, Computer Science, and Center for Data Science and a co-director of NYU’s Center for Social Media and Politics.
Joshua A. Tucker is a professor at New York University in the Department of Politics and co-director of NYU’s Center for Social Media and Politics.


 Open access