


Introduction
Economic progress has often been associated with technological advancement. The age of merchant empires was perhaps the time in which this relationship became most salient as decisive developments in shipping technology shaped long-distance trade successes and failures (Maddison Reference Maddison1982; Modelski and Thompson Reference Modelski and Thompson1988; Brezis et al. Reference Brezis, Krugman and Tsidon1993; Israel Reference Israel1989; Acemoglu et al. Reference Acemoglu, Johnson and Robinson2005; Unger Reference Unger2006, Reference Unger2011). Portugal’s advanced shipping proved very successful in the fifteenth century discoveries and the subsequent establishment of the first European merchant empire in Asia in the sixteenth century. By 1600 however, Portugal had lost its technological dominance, whereas the Netherlands had become the major shipbuilder in Europe. Factors affecting technology decisions in these countries become therefore vital to understand patterns of path dependence in merchant empires.
In Portugal, kings retained control of the monopoly of eastern trade while signing contracts with private agents, who temporarily traded in specific routes or products, or simply participated in the pool of capital of a voyage to get a share of profits on the return cargo (Costa Reference Costa, Coppolaro and McKenzie2013). The king however, remained the residual claimant of the enterprise.Footnote 1 In contrast, the trade monopoly of the Dutch East India Company (Verenigde Oost-Indische Compagnie, henceforth VOC) was chartered to private merchants, who managed trade according to merchant interests (De Vries and van der Woude Reference De Vries and van der Woude1997: 384). Chartered companies like the VOC, were key to the rise of the corporate firm (Harris Reference Harris2020; Odegard Reference Odegard2022); they maintained close relationships with the state and connected local-national and global entities (Pettigrew and Veveers Reference Pettigrew and Veveers2018) but remained real firms despite their influence on states (Wagner Reference Wagner2018). Dutch ownership thus, remained with merchants, who were residual claimants of the VOC.Footnote 2
Whether royally or privately owned, all empires used military power to pursue and defend trade, both of which were central to Western economic success (Findlay and O’Rourke Reference Findlay and O’Rourke2007). Kings and merchants however, differed substantially in their goals of empire so organizational control was not a mere label: merchants would be more willing to invest and put effort in a firm that they did control, which made their business decisions (for example on shipping) more likely to be market driven. Merchant control implied, therefore, a more efficient firm according to standard market practices. These implications stem directly from previous work on the origins of the different control structures of merchant empires (Rei Reference Rei2011). As such, diverging business decisions and efficiency levels across empires are exogenous in the context of this paper.
I extend the organizational argument in Rei (Reference Rei2011) into the realm of technological decisions in merchant empires. Firstly, I present a simple framework illustrating the relationship between a firm’s organizational control and its technology decisions. Investments in research and development that allow for successive technological improvements are less attractive to the experienced incumbent than to an entrant with no notable experience record since the latter has less to lose. Technological advancements bring the advantage back to the incumbent for whom the gain from investment is now larger. When firms are equally efficient the result is continuous leapfrogging (Brezis et al. Reference Brezis, Krugman and Tsidon1993). In merchant empires however, Portugal was summarily displaced by the Netherlands, which, according to the framework, suggests different levels of market efficiency. The old technology served the monarch’s objectives better, thus Portugal remained invested in it despite its efficiency cost, whereas Dutch merchants – not subject to royal preferences – developed market-oriented technology improvements that made their empire thrive.
Guided by this framework, I gather historical evidence on Portuguese and Dutch shipping on the Cape Route from the sixteenth to the eighteenth centuries. In the early 1500s Portugal adapted her small and swift exploration ships to the rising needs of Asian trade, but by the end of the century Portuguese ships had grown gigantic resulting from the choice of sending small fleets of large vessels to Asia (Costa Reference Costa, Coppolaro and McKenzie2013). These vessels carried more merchandise and were also more fitting of the monarch’s goals of empire, which involved the projection of royal power and glory in distant locations. But these monstrous ships – never replicated in other empires – were also slower, more difficult to maneuver and therefore more vulnerable in stormy waters or under enemy attack. I then show Portugal’s losses rose from 1 in every 10 ships in the early 1500s to nearly 1 in every 5 a century later. By then, the Dutch had become active traders in Asian markets using relatively smaller cargo vessels. Between 1602 and 1794 the VOC conducted far more voyages to Asia than Portugal had between 1497 and 1700, at less than 1 loss per 25 ships sent.Footnote 3
Finally, I investigate whether the gap in loss rates could emerge from factors beyond the rising vessel size. For example, Portugal’s increased losses in the seventeenth century could have resulted from her reduced network of outposts in the Indian Ocean. Alternatively, the Iberian Union (1580–1640) could have raised Portugal’s losses once Portuguese vessels became fair targets for England and the Netherlands. I discuss these and other potential explanations to the gap in loss rates but find no unambiguous association with Portugal’s higher loss pattern.Footnote 4
This paper sheds light on the shipping technology of merchant empires from an economic leadership perspective, since technology has not been considered in the literature a potential culprit of Portugal’s demise in the Indian Ocean (Domingues Reference Domingues2004; Castro Reference Castro2005; Costa Reference Costa, Coppolaro and McKenzie2013). Portugal’s decline and the fast ascendancy of the Dutch around the turn of the seventeenth century are unlikely to be due to a single cause. Thus, it is not the objective of this paper to claim causality. Rather, the paper considers the existing literature on shipping technology in the early seventeenth century and brings suggestive evidence that ship size could be correlated with the turning point of leadership between the Portuguese and the Dutch merchant empires.
A simple framework of technology adoption
Consider a firm in the long-distance trade market making profit π0 from technology τ0. The firm may invest z, which improves technology to τ1 yielding π1 > π0 with certainty, for simplicity. Investment occurs if the net benefit is larger than the cost
 $${{\rm{\pi }}_1} - {{\rm{\pi }}_0} \gt {\rm{z}}.{\rm{\;\;\;}}$$
The higher the current profit π0 and/or cost z, the less likely the firm will invest. The deterring effect of high π0 is known as the Arrow replacement effect: high returns to experience in the current technology tend to slow the adoption of a new and better technology (Arrow Reference Arrow1962). The replacement effect is stronger for a monopolist facing new entrants who start with π0 = 0 and invest so long as π1 > z (Aghion and Howitt Reference Aghion and Howitt1998).
All firms operate in remote markets and face similar challenges in the business of empire. Investment decisions, however, vary according to the preferences of the party in control: king and merchants both care for trade and profit, but the king also cares for glory and prestige, which distort pure trade objectives (Author 2011). Even though each firm’s investment decision is optimal (i.e., utility maximizing) for the party in control, the market outcome of each decision varies with different objective functions – exogenous in the context of this paper. As a result, each firm is associated with an efficiency level φ ∈ (0, 1] that affects investment returns so (1) becomes
 $$\varphi \left( {{{\rm{\pi }}_1} - {{\rm{\pi }}_0}} \right) \gt {\rm{z}}.{\rm{\;\;\;}}$$
The more efficient the organizational form (φ → 1), the less distorted the investment decision. If all firms have access to the same technological options (equal values for π0, π1, and z), then only φ matters in the investment decision.Footnote 5 In poor organizational forms (low φ) the investment return is lower, so firms invest less but not necessarily nil.
Suppose now that the incumbent exploring τ0 has efficiency level φL, and that a new player enters the market with technology τ1 and a better organizational form φH > φL. If the replacement effect is large enough, the incumbent will not adopt τ1 and the two firms share the market with ${{{\varphi _L}{{\rm{\pi }}_0}}}\over{{{\varphi _L} + {\varphi _H}}}$
of the profits going to the incumbent, and
${{{\varphi _L}{{\rm{\pi }}_0}}}\over{{{\varphi _L} + {\varphi _H}}}$
of the profits going to the incumbent, and ${{{\varphi _H}{{\rm{\pi }}_1}}}\over{{{\varphi _L} + {\varphi _H}}}$
to the entrant. When improved τ2 comes along, incumbent and entrant will respectively invest if
${{{\varphi _H}{{\rm{\pi }}_1}}}\over{{{\varphi _L} + {\varphi _H}}}$
to the entrant. When improved τ2 comes along, incumbent and entrant will respectively invest if
 $${{{{\varphi _L}}}\over {{{\varphi _L} + {\varphi _H}}}}\left( {{{\rm{\pi }}_2} - {{\rm{\pi }}_0}} \right) \gt {\rm{z\;\;\;and\;\;\;}}{{{{\varphi _H}}}\over {{{\varphi _L} + {\varphi _H}}}}\left( {{{\rm{\pi }}_2} - {{\rm{\pi }}_1}} \right) \gt {\rm{z}}.{\rm{\;\;\;\;}}$$
Even though the replacement effect now favors the incumbent (π2 – π0 > π2 – π1), for sufficiently low values of φL the entrant may invest in the new technology while the incumbent may not.Footnote 6 In this case, the incumbent sticks to the old technology even if losing market share.
This simple framework does not provide the basis for a cost–benefit assessment of technology adoption, or an all-encompassing explanation for the rise and fall of merchant empires. Rather, the objective is to illustrate how Portugal, despite its less efficient organizational form, was initially able to invest in improving the sailing ship but lost momentum when countries with more efficient organizational forms entered the long-distance trade market. The Dutch were able to make technological investments that Portugal found less appealing: π0 was relatively high since it was associated with vessels that both transported more goods and projected power, which served the monarch’s interests better. To adopt a new technology would be to abandon the raison d’être of the fleet, which, therefore, remained technologically behind.
I now turn to the historical evidence of shipping patterns of the Portuguese and Dutch empires to evaluate whether they are consistent with the framework’s implications on organizational efficiency.
Shipping decisions
A successful voyage to the East depended not only on the knowledge of wind and current systems in the Atlantic and Indian Oceans, but also on the ship herself. Even in the absence of pirates at sea, danger was ever present: storms, disease, and various kinds of accidents played a substantial role not only in the survival of the crew, but also in the success of the voyage. If these hazards affected all on the Cape Route, then voyage completion depended crucially on vessel type. This section evaluates Portuguese and Dutch shipping decisions in light of the organization argument already presented.
The Portuguese case Footnote 7
In 1498 Vasco Da Gama completed the first successful maritime voyage to India at the service of the king of Portugal. The date marks the beginning of direct trade between Europe and Asia through the Cape Route, which effectively undercut high spice prices arriving in Europe via the Levant (O’Rourke and Williamson Reference O’Rourke and Williamson2009).Footnote 8 This event occurred nearly after a century of Portuguese naval exploration, which added to existing geographic, maritime, and sailing knowledge.
Unknown ports in uncharted coastlines required small and swift vessels, as the fifteenth-century caravel. This lateen-rigged ship, of at most 60 tons, was handy to maneuver under sudden and unexpected weather changes.Footnote 9 Rising trade replaced the light caravels by larger square-sailed vessels – offering better usage of wind power – such as naus (called carracksFootnote 10 by the English and the Dutch) and galleons. The nau was lightly gunned and mainly used for cargo purposes whereas the galleon was primarily a war vessel, often pressed to serve as a cargo ship since the early days of empire.Footnote 11
The first attempts to introduce ships larger than 500 tons on the Cape Route date from the 1520s. By 1550 there were large galleons of 900 to 1,000 tons in use, but these were not the most common vessels. Ship size increased steadily between 1551 and 1570, with a smaller number of units bringing more spices to Lisbon than ever before. Larger vessels were a natural outcome of expanding trade in the sixteenth century, but the largest vessels were also slower and less maneuverable than smaller vessels.
The rising loss rate in the second half of the century led the monarch in 1570 to enact a new law requiring all vessels destined to the Cape Route to be between 300 and 450 tons. In the 1580s, a new king relaxed the 1570 law, and it became common practice every year to build two or three vessels above 1,000 tons each (Boxer Reference Boxer1948: 13).Footnote 12 By then, vessels on the Cape Route averaged 1,000 tons with some reaching 2,000 tons (De Vries Reference De Vries, Flynn and Giráldez2003: 44 and 50, Duncan Reference Duncan, van Kley and Pullapilly1986: 7). A few of these great ships were built in Asia, where better timber produced more resistant hulls for tropical waters, allowing longer vessel lifespans.Footnote 13 Though more seaworthy, these ships were even larger than those built at home. Such was the case of Cochin-built Santa Cruz of 1,600 tons, voluntarily burned off the Azores in 1592 to avoid English capture (size in Boxer Reference Boxer1948: 15, fate in Guinote et al. Reference Guinote, Frutuoso and Lopes1998: 226). The building of very large ships in India continued into the seventeenth century as attested by the vessel Nossa Senhora de Belém – the largest vessel ever built for the Cape Route – lost in a storm off the Brazilian coast in 1635 (Guinote et al. Reference Guinote, Frutuoso and Lopes1998: 345).
The fast rate of vessel decay on the Cape Route and the empire’s expansion, made Lisbon’s shipbuilding a fast-growing industry. The conditions of haste in which shipwrights labored, as well as the owner’s cargo specifications, allowed little change in ship design. With the king as the main merchant and armor, Lisbon’s shipyards quickly specialized in the construction of very large vessels pre-ordered for specific voyages (Costa Reference Costa1997).
But why would monarchs choose big ships? Irrational preferences are not plausible in a context of utility maximizing agents of my simple framework of technology adoption. Rather, this technological option befits an empire strategy valuing elements other than the profits yielding from a large trade volume. Monarchs also valued the glory and prestige that the sight of such gigantic and massively adorned vessels – with multiple decks, forecastle, and aftercastle – conveyed. These large ships became distinctive features of Portugal’s naval architecture since no other nation built such “mountains of wood” (Boxer Reference Boxer1948: 14).Footnote 14 Looking powerful mattered to a king directly engaged in trade with distant sovereigns he would never personally meet. Private merchant companies valued demonstrations of power as well. Beyond conducting trade, they also administered justice and maintained their own armies, effectively becoming states within the state. But the extent to which kings cared for power and glory was different: an empire would bring the visibility and international prestige recognized by sovereigns of the time and in the future. Kings would therefore, more than merchants, distance themselves from market objectives due to their glory and prestige motivations.Footnote 15
While the Dutch introduced changes that improved vessel stability and seaworthiness in the seventeenth century, Portugal kept building larger, slower, and less maneuverable vessels as shown by the giant India-built ships. The tendency of building large and magnificent vessels was not exclusive to Portugal’s sovereign. The most notable example arguably comes from 1625 Sweden when the king commissioned the construction of one the greatest warships ever built until then at 1,300 tons. On August 10th, 1628, the Vasa capsized and sank on her maiden voyage barely 1,500 yards out of Stockholm’s harbor under perfect weather. The recovery of the wreckage in 1961 revealed hundreds of decorative wooden sculptures carved by Dutch, German, and Swedish artists.Footnote 16 Abundant decoration clearly served the purpose of glory and prestige as noted by Jean-Baptiste Colbert, France’s naval minister from 1665 to 1683: “nothing can be more impressive nor more likely to exalt the majesty of the King, than that his ships should have more magnificent ornamentation than has ever before been seen at sea” (Paine Reference Paine2000: 195).
Though fitting royal hubris, the deliberate increase in Portugal’s vessel size proved disastrous for safety. In the 1620s the dreadful situation led a group of experienced Portuguese officers – from merchants to sea captainsFootnote 17 – into persuading the crown to reinstate the 1570 tonnage law. The main arguments against the very large carracks included difficult maneuverability and excessive loading, both of which contributed to vessel instability and increased losses.Footnote 18 With the king’s pepper taking up most of the space, everything else was stored wherever possible sometimes outside the hull supported by ropes (Castro Reference Castro2005: 18). Shipwreck narratives provide various accounts of crews forced to let go of some of the hanging cargo to try and stabilize large vessels during storms. Even in the absence of bad weather, the experienced officials noted, large and overloaded vessels could and did capsize when entering or exiting ports. These great vessels were also slower posing problems to convoys given the different speeds of galleons and great carracks, which on their own were rather vulnerable. The slower speed also made ships more likely to winter in Mozambique further delaying voyage completions and subsequent departures.
In light of this, cargo vessels were built smaller, but the situation worsened for galleons, which previously rarely exceeded 600 tons and could now reach 1,200 tons. Such was the case of the Santa Tereza destroyed in the Battle of the Downs against the Dutch in 1639 (Boxer Reference Boxer1948: 13). The ambiguous success of expert pleas suggests only a limited influence of merchant and maritime personnel on the shipping decisions of empire whose residual claimant, retaining major organizational decisions, remained the Portuguese crown.
The Dutch case
As a country whose land was partially reclaimed from the sea, the Netherlands have a long tradition of shipbuilding suited for canals, rivers, but also the oceans. Through the fourteenth century, shipbuilding proliferated on Dutch shores and river estuaries, but by the fifteenth it mostly concentrated in towns, where gathering the necessary investment capital was easier (Unger Reference Unger1978: 2). Antwerp, the largest medieval city in the Low Countries, remained the major distribution center of foreign goods in Northern Europe until 1585 when it fell under Spanish control. Such commercial prominence gave the Dutch ample experience in the transportation of bulk goods around Europe, facilitating further shipping development.Footnote 19
After 1550, a new series of technically superior cargo carriers emerged in Dutch ports leading to “impressive gains in output and lower shipping costs” (Unger Reference Unger1978: 35). The buyscarveel, the boyer, the vlieboot, and finally the fluit, each picked on previous designs and adapted to specific navigational needs. With a size between 200 and 500 tons, the fluit resulted from a long sequence of modifications and experiments with sails and hull construction techniques.Footnote 20 The rigging over two or three short masts with some easier to handle “gaff sails” made the vessel more maneuverable while requiring fewer sailors. The shallow but box-like hull and round (instead of square) stern, provided larger cargo capacity than contemporary ships of similar size. The small bulk above the water line – no forecastle, and few or no guns – reduced wind resistance and improved sailing quality, but constrained fluits to safer routes or to sail in convoys.Footnote 21
So successful was the fluit, that the Dutch supplied this and other cargo vessels of force to the French India Company, England, Hamburg and Ostend, as well as Denmark and Sweden (half these fleets was Dutch-built), and even the Spanish colonial trade (Barbour Reference Barbour1930: 286–7).Footnote 22 Though Dutch shipbuilding is difficult to estimate, exports probably never equalled domestic consumption and production for foreign buyers may have peaked at as much as 50% of total output (Unger Reference Unger1978: 11).
The VOC’s foundation in 1602 occurred therefore in a context of constant shipping developments. The company’s fleet was composed of a variety of square- and round-sterned ships. Among the first, the most common were the East Indiamen used as cargo and passenger carriers. These were the VOC’s largest operating vessels, but they never reached the size of the great Portuguese carracks, as no other empire pursued the operation of such giant ships (De Vries Reference De Vries, Flynn and Giráldez2003). The Indiamen carried guns but had greater hulls than the more heavily armed warships, which could also be used as cargo carriers of smaller capacity. Beyond war and cargo vessels on the Cape Route, the Dutch (as all other empires) employed other vessels according to the navigation needs of empire, for instance the intra-Asian trade.Footnote 23
Among the round-sterned ships, fluits played a permanent role in the company’s fleet. The fluit’s hull design with a low center of gravity gave it more stability in bad weather, and the use of pine instead of oak (except in the hull) made it an exceptionally light vessel of large cargo capacity (Unger Reference Unger1978). Regarded as cheap to build, man, and maintain, bigger fluits were fairly common on the Cape Route next to the larger East Indiamen well into the eighteenth century when the latter dominated (Bruijn et al. Reference Bruijn, Gaastra and Schöffer1979: 55).
The VOC built its own ships, but it also resorted to the purchase and hire of vessels from private shipyards, especially fluits. This practice was standard at an early stage when the company’s own production was insufficient but ceased by the late 1600s. During and after the Fourth Anglo-Dutch War (1780–1784) external purchases and hires of smaller vessels resumed. Overall, the company’s shipbuilding prevailed: in nearly two centuries of operation the VOC bought or hired 378 vessels and built 1,461 (Bruijn et al. Reference Bruijn, Gaastra and Schöffer1979).
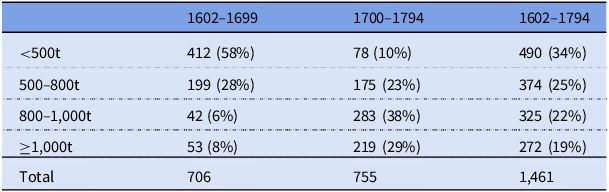
Table 1 shows the VOC’s shipbuilding by size. In the seventeenth century the Company constructed mostly small- and medium-sized vessels below 800 tons, which represented 86% of the company’s naval production.Footnote 24 Large cargo vessels served only a fraction of the needs of the establishing empire, which also required smaller ships to defend ports and engage in the intra-Asian trade.
Ships built in VOC Shipyards
Source: Bruijn et al. (Reference Bruijn, Gaastra and Schöffer1979, I: 52).
The continuous presence of the Dutch in Asia reduced the needs of small and medium vessels to a replacement level in the eighteenth century (33%). A higher trade volume on the other hand, especially in the early 1700s, led to a rise in the construction of vessels above 800 tons (67%). Overall, vessels above 1,000 tons were never the biggest fraction of output in the VOC’s shipyards, representing only 19% of total construction over the two centuries of operation. As Portugal, the VOC increased vessel size with time, but the largest Dutch vessels never reached the size of Portugal’s, showing a distinct manifestation of shipping technology decisions in this organization.
Shipping losses
Organizational choices, here in the form of shipping decisions, ultimately reflected in losses at sea. In this section I present and analyze Portuguese and Dutch loss rates by time period according to each empire’s shipping decisions.
The Portuguese case
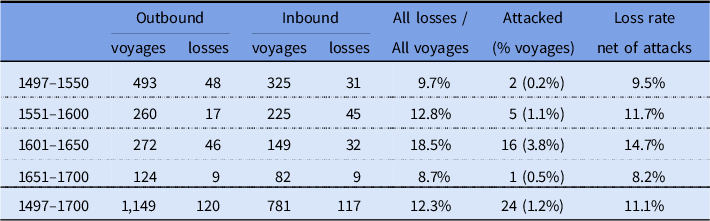
Duncan (Reference Duncan, van Kley and Pullapilly1986) provides aggregate numbers per decade for Portuguese voyages on the Cape Route, including losses, from 1497 to 1700. Table 2 summarizes this information in fifty-year periods. The initial loss rate of 9.7% jumped by almost a third in the second half of the sixteenth century, as ships grew larger. In the 1600–1650 period, Portugal’s losses reached their peak at 18.5%: nearly 1 in every 5 Portuguese ships was lost on the Cape Route, compared to 1 in 10 one century earlier. This rising loss rate partially reflects Portugal’s rising opposition in the high seas during the Iberian Union (1580–1640) when Spain’s traditional enemies – England and the Netherlands – regarded Portuguese ships as legitimate targets. Though more losses resulted from enemy attacks in the first half of the seventeenth century than in all other periods combined, such losses represented only 3.8% of voyages in that period. The rise in the net loss rate from 9.5% between 1500 and 1550, to 14.7% between 1600 and 1650 is still remarkable and coincides with the building of larger vessels and the complaints of experienced officers.
Portuguese Losses on the Cape RouteFootnote 27
Sources: Duncan (Reference Duncan, van Kley and Pullapilly1986: 22–3) for Portuguese voyages and losses per decade; Guinote et al. (Reference Guinote, Frutuoso and Lopes1998) for losses resulting from attacks.
After regaining independence in 1640, Portugal either made diplomatic concessions to the English (e.g., Bombay in 1661Footnote 25 ) or lost key battles with the Dutch (e.g., Malacca in 1641, Ceylon in 1658), thus having a negligible contribution on the Cape Route. In the late seventeenth century Portugal’s presence in the East was limited to three ports in India (Goa, Daman, and Diu) and two in East Asia (Macau and East Timor).Footnote 26 By then, Portugal merely maintained annual communication between Europe and Asia with returning ships often stopping in Brazil. The decline in Eastern trade reduced voyage needs and, likely, ship size as suggested by the decline of the loss rate to 8.7% (or 8.2% net) between 1651 and 1700.
Guinote et al. (Reference Guinote, Frutuoso and Lopes1998) provide a list of all 237 losses of Portuguese ships on the Cape Route with information on vessel name, the stage of the voyage (outbound or inbound), date of shipwreck, and, whenever known, the location and cause of loss. Unfortunately, this list does not include vessel type or size. I found this information, for some of the wrecked vessels, in secondary sources such as: narratives of shipwrecks based on reports of survivors and close witnesses (Boxer Reference Boxer1959, Reference Boxer1968; Burman Reference Burman1967, Reference Burman1968; Duffy Reference Duffy1955)Footnote 28 ; studies by naval historians including excerpts of letters of missionaries surviving one or more shipwrecks, as well as studies of naval archeologists (Guinote et al. Reference Guinote, Frutuoso and Lopes1998 and Castro Reference Castro2005, respectively); and also, English or Dutch sources that refer to captures of Portuguese vessels returning from Asia (Boxer Reference Boxer1948; Latham and Youings Reference Latham and Youings1999; Boxer Reference Boxer1965).
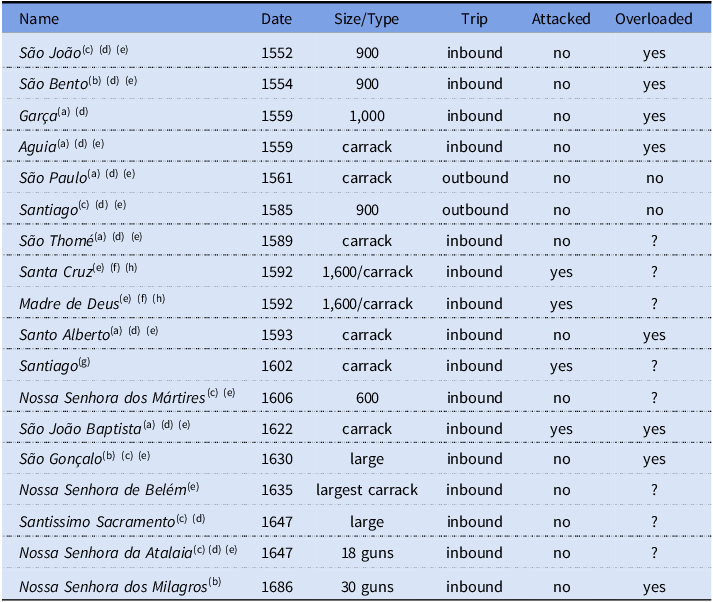
These secondary sources do not report on all of Portugal’s losses at sea (many vessels simply disappeared in remote locations of the ocean without witnesses) but they report losses in ships of different sizes, so it is not the case that authors just wanted to impress readers by reporting losses of very large vessels alone. Of all the shipwrecks described in these sources, the 18 listed in Table 3 have information on ship size or type. The reported sample represents roughly 8% of all Portuguese losses at sea between 1500 and 1700, and 12% of losses between 1552 and 1686, the start and end dates in Table 3. Even though if small, the sample is very informative of the gigantic nature of some lost vessels. In particular, the two 1,600-ton carracks lost in 1592 provide a clear indication of the dimensions of this type of vessel never replicated by other empires.
Reported Portuguese Losses on the Cape Route by Size (sample)
Sources: (a)Boxer (Reference Boxer1959, Reference Boxer1968), (b)Burman (Reference Burman1967, Reference Burman1968), (c)Castro (Reference Castro2005), (d)Duffy (Reference Duffy1955), (e)Guinote et al. (Reference Guinote, Frutuoso and Lopes1998), (f)Latham and Youings (Reference Latham and Youings1999: 78), (g)Boxer (Reference Boxer1965), (h)Boxer (Reference Boxer1948).
Two of the vessels in Table 3 sank on the outward voyage and, evidently, were not overloaded. Of the remaining 16 vessels, eight were overloaded while there is no information on whether that was also the case of the other eight vessels. The prevalence of overloading in inbound losses further underlines the magnitude of this problem in Portuguese voyages. By contrast, only four vessels in the sample (Madre de Deus, Santa Cruz, Santiago, and São João Baptista, all carracks sunk between 1592 and 1622) underwent enemy attacks, reinforcing the idea that losses for this reason were not too prevalent.
There are eight wrecks of carracks, not all of which reached sizes above 1,000 tons. The rising ship size started in the 1520s, but only after the repeal of the 1570 law does the literature mention great carracks such as the Madre de Deus or the Santa Cruz at 1,600 tons, and the Nossa Senhora de Belém – the largest vessel ever built for the Cape Route (Guinote et al. Reference Guinote, Frutuoso and Lopes1998: 345). I therefore take a conservative approach and consider carracks before 1580 as large vessels while those after that date as very large, a criterion consistent with the changing nature of the term carrack throughout the sixteenth century (Boxer Reference Boxer1948: 12). This classification is further justified by the arguments against excessive vessel size by Portuguese officers in the first half of the seventeenth century when the loss rate peaked.
Of the 18 reported losses, eight are very large (Garça, Madre de Deus, Nossa Senhora de Belém, Santa Cruz, Santo Alberto, Santiago, São João Baptista, and São Thomé). Eight ships belonged to the large category (between 800 and 1,000 tons) since they were reported to have 900 tons (São João, São Bento, and Santiago), were simply referred as “large” or “carrack” before 1580 (São Gonçalo, Santíssimo Sacramento and Águia and São Paulo). I also consider Nossa Senhora dos Milagros in this category since it was overloaded and had 30-gun cannon on board. Finally, Nossa Senhora dos Mártires was a 600-ton medium-size ship, and I assume Nossa Senhora da Atalaia also to be of medium-size since it had 18 guns on board.
Overall, 16 out of the 18 wrecks occurred in large or very large vessels while small vessels do not figure in this sample, which is clearly not realistic.Footnote 29 This void may result from smaller wrecks having fewer survivors whose recollections would less likely get published. It is implausible however, that only the losses of large and very large ships survived in secondary sources, otherwise all narratives would have information on vessel size or type, which is not the case. All in all, the evidence in Table 3 strongly suggests (without absolutely proving) that Portugal relied on large and very large vessels well into the seventeenth century when her loss rates rose considerably, yet another manifestation of poor organizational choices.
The Dutch case Footnote 30
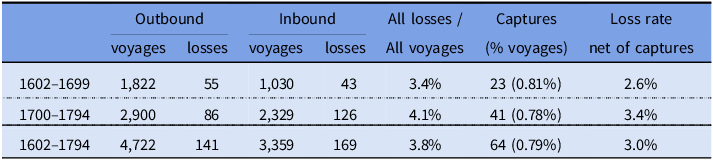
Table 4 shows a generally low loss rate for Dutch vessels, when compared to the Portuguese counterpart in Table 2. Though the absolute number of Dutch losses was higher than the Portuguese (310 vs 237), the Dutch sent more than four times as many ships to and from Asia (8,081 vs 1,930) during a similar time window of 200 years. Less than 1 in 25 Dutch ships was lost in two centuries of voyages, but losses rose slightly from in the eighteenth century.
Dutch losses on the Cape Route
Source: Bruijn et al. (Reference Bruijn, Gaastra and Schöffer1979, II and III) lists all Dutch outbound and inbound voyages, including the losses and their details.
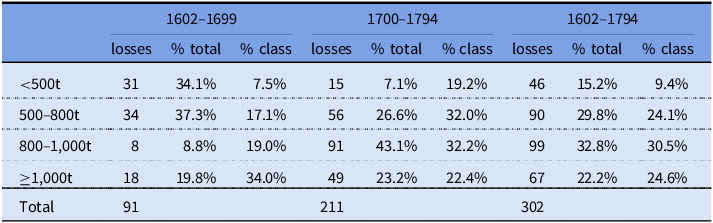
Captured ships nearly doubled in the same period, but these were only a very small fraction of the total voyages of the Dutch company, which remained relatively constant (0.81%–0.78%).Footnote 31 Of the 310 vessels lost by the VOC on the Cape Route, eight lack information on tonnage (six outbound and two inbound) leaving a total of 302 vessels with information on size, which I summarize in Table 5.
Dutch losses on the Cape Route by size
Source: Bruijn et al. (Reference Bruijn, Gaastra and Schöffer1979, II and III) for absolute losses.
The VOC lost vessels of all sizes, but the distribution of total losses (middle column in each panel) changed with time. In the seventeenth century over 70% of the losses occurred in small- and medium-sized vessels, but in the eighteenth most losses occurred in the large and very large categories (66.3%). This trajectory is consistent with the evolving needs of empire: early on, smaller vessels were needed to defend newly conquered outposts and conduct local trade; as trade increased, so did the demand for larger vessels on the Cape Route and more of these were lost. In nearly two centuries, most of the VOC’s losses occurred in large and medium vessels (32.8% and 29.8%), followed by very large vessels (22.2%) and small vessels (15.2%).
The last column in each panel of Table 5 shows loss rates per tonnage class. In the early history of the VOC, the probability of loss was monotonically increasing in vessel size suggesting that larger ships were more dangerous. The more intense nature of operations in the eighteenth century resulted in an overall loss-size relationship rising until 1,000 tons and decreasing thereafter. Such non-monotonic pattern suggests that larger size did not make Dutch vessels more vulnerable in the 1700s, a result that is not necessarily surprising since the largest Dutch vessels never reached the grandiose, and perilous, scale of Portugal’s. Of all Dutch ships sent to Asia, the single largest was the 1,300-toner Admiraal de Suffren built at the Amsterdam yards in 1785 and lost in a storm in the South China Sea on her first return voyage to Europe in 1787. There was no other vessel of this size. Indeed, the most common tonnage among the Dutch Indiamen was barely above the said threshold at 1,150 tons, and well below the size of the Madre de Deus or the Santa Cruz (1,600 tons) and other India-built carracks (Boxer Reference Boxer1975: 208).
In sum, even if the largest Dutch ships were not more likely to sink, Portugal’s oversized (and much larger) vessels still might have been responsible for her higher loss rates, in a direct manifestation of differing organizational forms. I now explore alternative explanations for the divergent pattern of loss rates in the Portuguese and Dutch merchant empires. The objective is not to completely dismiss alternative causes, but to shed light on vessel size as a driver for the observed disparity in loss rates.
Potential causes of the disparity in loss rates
The VOC’s overall loss rate of 3.8% was less than a third of Portugal’s at 12.3%, although the Dutch conducted more voyages (8,081 vs 1,930). The different timing of operations in the East could explain the gap in loss rates due to evolving shipping technology. Over time, the production of better ships benefitted the Dutch whose voyages started 104 years after the Portuguese and lasted to 1794 while Portugal’s data stop in 1700. Sailing ships in 1498 were surely different from those of 1794, but the corresponding technology improvements did not translate into falling loss rates for either Portugal or the Netherlands while they operated on the Cape Route.Footnote 32 The Dutch variation – from 3.4% in the seventeenth century to 4.1% in the eighteenth – is rather small, but Portugal’s loss rate nearly doubled between 1550 and 1650! In the seventeenth century the contrast is even greater −3.4% versus 15.3% – suggesting the two empires were already on different technological paths. Thus, despite the non-overlapping time frames of operation in the East, the Portuguese and Dutch data are comparable.
Portugal’s higher loss rate could also result from competition with other empires, especially after the Iberian Union during which, England and the Netherlands, Spain’s long-term enemies also became Portugal’s. Excluding losses resulting from enemy action brings Portugal’s loss rate down to 11.1% in Table 2. Though Portugal was relatively more affected by enemy attacks – especially in between 1600 and 1650 when it started competing directly with the Dutch and the English – the large disparity relative to the Dutch net loss rate (3% in Table 4) remains unexplained.
A less obvious way competition could have raised Portugal’s losses lies in the changes of her network of outposts in Asia. In the seventeenth century the English and Dutch companies started using the Cape Route and expanding their reach in the Indian Ocean, ousting the previously established Portuguese. As Portugal’s network of ports shrank, her vessels could have become more vulnerable at sea due to the potential lack of shelter. But Portugal’s lost ports were ports of trade, not ports of call. Such was the case of Kochi, Ceylon, Malacca, or the Moluccas, which were gone by 1650 when Portugal’s Asian trade was already minimal. Mozambique, Portugal’s traditional port of call since Da Gama, remained in Portugal’s control throughout providing shelter to passing vessels as well as a place to wait the change of season if needed. Thus, Portuguese vessels were no more vulnerable at sea in the seventeenth century than they were when they started venturing on the Cape Route in 1498.
Similarly, Portugal may have faced different military needs in the Indian Ocean, which could have affected not only ships sent to Asia but also the casualties suffered en route. More pressing military needs could, however, have different implications on the loss rate: they could result in better defense and less losses, but they could also imply overextension and more losses. A thorough comparison of Portuguese and Dutch military objectives is beyond the scope of this paper, but it is unclear they were that different since both empires clashed with locals upon arrival. Portugal focused mostly on India and disputed port cities in the Red Sea, South-East Asia, and the Far East. The Dutch on the other hand, fought the natives in South-East Asia while sharing efforts with the English to displace the Portuguese elsewhere.
Portugal’s higher losses could still result from factors unrelated to competition such as the lax practice of convoys, excessive loading, and different labor skills, all of which are associated with either vessel size, poor organization, or both. First, Dutch ships could have been more resilient as they traveled in large convoys on the homeward voyage after the Cape, the VOC’s traditional port of call.Footnote 33 Convoys were also in effect in Portugal in the sixteenth century before vessels became excessively large. Since the early 1500s, one or more fleets departed Lisbon yearly, each typically composed of five or six well-armed cargo vessels eventually joined by smaller ships usually destined to remain in the East. Cargo vessels returned home with other vessels of the same fleet, and sometimes also with vessels from previous fleets that had wintered in Mozambique.Footnote 34 As ship size increased however, Portuguese vessels became slower and often traveled solo or with other large, and equally vulnerable, vessels (Solis Reference Solis1955). The original cause of rising vulnerability, therefore, seems to be vessel size, with the lax convoy practice as the unintended inefficiency thus associated.
Second, excessive loading of Portuguese ships could well be behind the disparity of losses at sea. There is no indication that the VOC faced this problem – unsurprising since Dutch ships were smaller but many – whereas Portuguese sources repeatedly mention overloaded vessels after 1550, always in connection with excessive tonnage. The very rationale of carrying more merchandise with fewer but larger units could have naturally raised the probability of overloading in a scenario of expanding markets and poor organization. Contemporaries note that larger vessels carried more people, and therefore more liberty chests – allowed to royal employees for carrying spices – and other belongings all piled on deck, at times reaching the height of the aft castle (Guinote et al. Reference Guinote, Frutuoso and Lopes1998: 388). Such occurrences surely denote inadequate management, yet another symptom of poor organization that, in this case, cannot be disentangled from vessel size.
Third, Dutch labor could have just been better skilled, resulting in better ships and relatively fewer overall losses. This claim is consistent with a more efficient organization overall, and without dismissing a labor productivity argument (Lucassen and Unger Reference Lucassen, Unger and Unger2011), both the Portuguese and the Dutch dominated naval technology at some point because their labor force, though different, was skilled enough to achieve such feat. Vessel quality, on the other hand, seems to be inversely related to vessel size since: (a) the only cargo vessels known for their improved stability in this early modern period were the Dutch fluits, which were considerably smaller than the East Indiamen, the VOC’s heavy carriers; and (b) the largest Dutch ships were still smaller than Portugal’s great carracks notorious for their occasional capsizing when maneuvering in and out of port. Even if Dutch ships were superior this still does not explain Portugal’s rising loss rates between 1550 and 1650 when vessel size rose to unprecedented, and never repeated, levels.
A more serious contender behind the disparity in loss rates involves the sea routes in which each country specialized: if Portugal’s route was more prone to disaster that would naturally result in more losses. In the Atlantic both empires followed similar paths, save the Dutch specific segment north of the Iberian Peninsula and through the English Channel (or around the British Isles, depending on the season). But in the Indian Ocean the routes diverged substantially according to the different headquarter locations: headed to Goa on India’s western coast, Portugal’s ships sailed mostly along the west Indian Ocean through the Mozambique Channel (or outside of Madagascar, depending on the monsoon); the Dutch also sailed to India (particularly to Bengal in the north-eastern coast, or Ceylon today Sri Lanka), but their headquarters in Batavia (today Jakarta, Indonesia) gave them far more exposure to the south and east Indian Ocean.Footnote 35 Varying routes and times of entry implied different navigational learning. The Portuguese pioneered the Cape Route single-handedly and learned about Atlantic currents and winds by trial and error, and from Muslim pilots on the Indian Ocean. The VOC had, perhaps, a less daunting task when it started sending ships to Asia given the preexisting knowledge of the eastern passage through the Cape, but it still faced a fair amount of learning, especially in the less traveled areas of the east Indian Ocean.
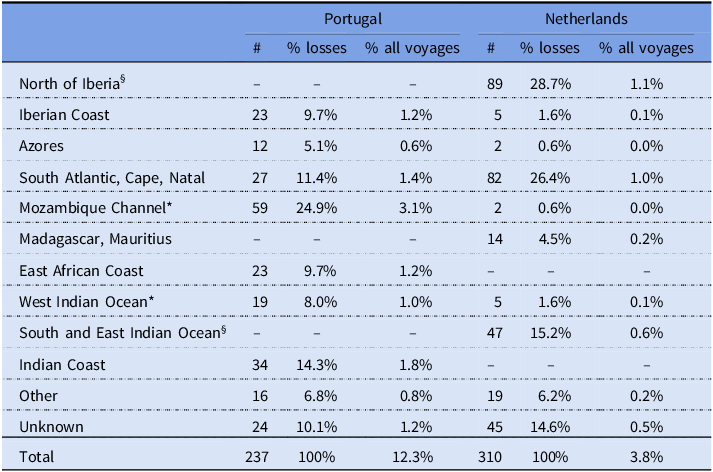
The difficult sections of both routes can be gleaned from Table 6 with the geographic dispersion of losses. There were losses throughout the entire route with particularly high incidence in shallow waters close to shore. Thus, the Portuguese had a higher share of losses near their ports of call in the Azores (5.1%) and the Iberian coast (9.7%) than the Dutch (0.6% and 1.6%, respectively), even though ships from both countries sailed these waters. Similarly, the Dutch lost relatively more ships in the South Atlantic-Cape-Natal section (26.4%) than the Portuguese (11.4%), whose ships passed by but hardly ever called at the Cape. For this reason, the share of Dutch losses in every common segment of the routes is not necessarily lower than the Portuguese, as it would be expected of a more efficient organization. This relationship, however, is visible in the last column of each panel in Table 6 where losses are shown as fractions of all voyages. Each common segment of the routes (for example, the Cape) necessarily saw all ships corresponding to the 8,081 Dutch voyages and the 1,839 Portuguese voyages so the Dutch fractions are obviously lower.
Geography of losses on the Cape Route
§ Exclusive Dutch segment.
* Common segments across routes used much less often by the Dutch.
Sources: Portugal: Guinote et al. (Reference Guinote, Frutuoso and Lopes1998: 124) for all 1,114 voyages from 1497 to 1650. Netherlands: imputed data from all 8,081 voyages between 1602 and 1794 listed in Bruijn et al. (Reference Bruijn, Gaastra and Schöffer1979), Vols. II and III.
The more dangerous segments of each route were nearly exclusive: while most Portuguese losses (24.7%) occurred in the Mozambique Channel – home to Portugal’s main port of call – which the Dutch hardly ever sailed, the Dutch lost most of their ships (28.7%) north of Iberia (along the Dutch coast, in the English Channel, or north of Scotland) where the Portuguese did not sail at all. Weather in the North Atlantic makes Dutch losses in this section of the route inevitable, but did the VOC keep losses down by avoiding the areas of the Indian Ocean where Portuguese ships perished more? The answer is not clear-cut due to the endogenous choice of sea routes and corresponding headquarters and ports of call. But even if the common segments that the Dutch sailed little are deemed more dangerous, Portugal’s losses in these areas correspond to 4.1% of all her voyages, still leaving a loss rate of 8.2% – more than double of the Dutch at 3.8% – to be explained by factors other than the more difficult route.
In sum, among the identifiable elements associated with poor organization, Portugal’s rising ship size seems to be an unavoidable element behind the disparity in loss rates. The lack of systematic evidence on vessel size, has led most of the literature to either dismiss or discount this potential reason behind Portugal’s decline in the Indian Ocean in favor of an overextension beyond her arguably natural Atlantic scale. This claim seems corroborated by the successful defense of Brazil in the sixteenth and seventeenth centuries (Domingues Reference Domingues2004).Footnote 36 The Netherlands however, were an even smaller country that did not seem to incur in this overextension problem, which may be an indicator of better organizational choices consistent with the argument in the current paper.
The remaining question is, therefore, whether there could be another economic rationale for building large vessels beyond the glory and prestige motives associated with crown control. Economies of scale would be the most natural justification for very large vessels if construction or maintenance costs were lower relative to the volume of goods carried. This argument applies to both empires since both saw rising trade volumes in Asia. But the Dutch, whose trade dwarfed that of the Portuguese, would have faced the lowest shipbuilding cost per volume and thus a greater incentive to build larger vessels, which never materialized. Economies of scale, therefore, cannot have been the decisive factor behind the construction of the great carracks. Portugal’s early incumbent status in a context of expanding trade could have led to naval experimentation and, consequently, to overshooting vessel size. The delay in adapting to best market practices, however, is yet another sign of poor organization.
Conclusion
Organization has profound implications in the general governance of firms. In this paper I focus on the leadership transition in merchant empires from the Portuguese to the Dutch and provide a simple framework where low organizational efficiency is associated with reduced incentives to invest in technological improvements. I investigate the implications of the framework in shipping technology.
In the Age of Discovery, Portugal used small and easily maneuverable vessels, ideal for sailing in unknown waters and unchartered coasts. The establishment of empire in the 1500s and the rising volume of trade increased ship size. Large vessels carried more merchandise but became less seaworthy beyond a scale, when slowness and poor maneuverability made them more likely to perish in storms or under attack. As a result, Portugal’s loss rate soared in the late sixteenth century and into the seventeenth. Such massive ships were however more fitting of the monarch’s objective of empire, which included not only profit but also the demonstration of glory and power, in far distant nations.
In the early seventeenth century the Dutch specialized in the construction of smaller and more seaworthy cargo vessels, which they used and sold to other merchant empires. Upon the foundation of the VOC in 1602, eastern trade was still on the rise, but the largest Dutch ships never reached the size of Portugal’s. In fact, this merchant-controlled organization conducted far more voyages than Portugal at a much lower loss rate.
Relatively better skilled labor from the Dutch side is a plausible cause behind this discrepancy (Lucassen and Unger Reference Lucassen, Unger and Unger2011). In light of the presented framework this is consistent with a poorer organizational structure for Portugal. From a shipping technology perspective however, only the lax practice of convoys and the excessive loading of Portuguese ships could plausibly explain the difference. These clear organizational inefficiencies can be understood as the unintentional consequences of vessel size, which seems to be the unavoidable culprit behind the divergent performance of Portuguese and Dutch vessels.
To date, the literature on the Portuguese empire has dismissed shipping technology and, in particular, ship size, as a potential cause of its decline in Asia due to lack of systematic evidence on vessel dimensions (Castro Reference Castro2005; Costa Reference Costa, Coppolaro and McKenzie2013; Domingues Reference Domingues2004). I use data on reported Portuguese losses and the complete database of Dutch voyages to suggest that indeed ship size could be one of the plausible reasons explaining this turning point in leadership in merchant empires.
Acknowledgments
I thank Bob Margo and Andy Newman for early-stage discussions and Jeremy Atack, Bill Collins, Mauricio Drelichman, and Richard Unger for detailed suggestions on earlier drafts as well as the editors, without whom this paper would not have been published. I also thank Tania Casal, Ben Eden, Boyan Jovanovic, Petra Moser, Giacomo Ponzetto, Ahmed Rahman, Peter Rousseau, Ken Snowden, Claudia Steinwender, Jan de Vries, and participants at various seminars and conferences for helpful comments.
Appendix
Comparing fleets
If vessel size was a driving force behind the technology transition from Portugal to the Netherlands in the early seventeenth century, then Portugal’s fleet should have been more reliant on very large ships than the Dutch fleet. Unfortunately, there is no systematic information on Portugal’s ship sizes, which prevents a direct comparison of both fleets. The evidence on Table 3 however, shows very large Portuguese shipwrecks well into the first decades of the seventeenth century. I therefore estimate the composition of Portugal’s fleet combining the information on all Portuguese losses and the reported Portuguese losses by size with the information on all Dutch ships by size and all Dutch losses by size. The resulting estimate of very large vessels of Portugal’s imputed fleet is a lower bound because I assume identical loss rates by tonnage class in both fleets and the largest VOC vessels were smaller than Portugal’s largest vessels. Portugal’s imputed fleet per tonnage class is then:
 $$Reported{\rm{\;}}PT{\rm{\;}}losse{s_{size}} \times {{{All{\rm{\;}}PT{\rm{\;}}losses}}\over {{Reported{\rm{\;}}PT{\rm{\;}}losses}}} \times {{{All{\rm{\;}}NL{\rm{\;}}buil{t_{size,{\rm{\;}}time}}}}\over {{Reported{\rm{\;}}NL{\rm{\;}}losse{s_{size,time}}}}}$$
The first term comes from Table 3, which contains 18 Portuguese losses: eight in very large ships (above 1,000 tons), eight in large ships (800–1,000 tons), two in medium-sized ships (500–800 tons), and none in small ships (below 500 tons). It is implausible to assume that Portugal’s fleet had no small ships so I impose an equal fraction on this category to that of VOC built ships in Table 1. The second term does not vary with ship size and provides an indication of the representativeness of the reported Portuguese losses: between 1552 and 1686 Portugal lost a total of 148 ships, but only 18 are reported by size, therefore this constant term is 148/18. The last term combines data from Tables 1 and 5 varying with size and period, which allows for the estimated fleet to adjust to the different naval needs of empire.
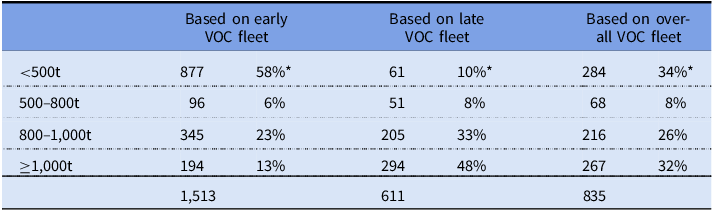
Table 7 shows three potential imputed fleets for Portugal according to the time period of the last term in (4). On the left panel, I used Dutch data from the seventeenth century corresponding to the early history of the VOC. Biased toward small ships, this early imputed fleet reflects the establishment of empire with navigation needs relating mostly to defense and communication purposes in Asia so there is a larger fraction of small ships. In contrast, the fleet in the middle column uses Dutch data from the eighteenth century when the VOC’s trade was already well established. This imputed late fleet is therefore geared toward larger cargo vessels that met rising trade needs. The fleet on the right-hand-side uses data for the entire history of the VOC in Asia and provides a more balanced picture of the overall shipping needs of empire. The question is now whether any of the estimated fleets in Table 7 is plausible.
Portugal’s imputed fleet
In its 8,081 voyages, the VOC used 1,839 vessels (own-built or outside purchased/hired). Accordingly, Portugal’s 1,930 voyages should have been possible with 439 vessels. Correcting for the higher loss rate (12.7% vs 3.8%), Portugal’s fleet should have been comprised of 478 ships, a lower value than any of the estimates in Table 7 probably for two reasons. First, the 478-vessel fleet assumes different loss rates across empires, but identical depreciation rates of capital. Portugal, however, could have faced faster ship decay, since her vessels were the first to sail in tropical waters where shipworm (also known as termites of the sea) infiltrate wooden hulls creating leaks, which ultimately render vessels useless. This problem affected vessels of all empires but hull preservation techniques, such as sheathing, improved with time making the Dutch benefit from late entry.Footnote 37 Second, the 478-fleet al.so assumes identical capital utilization across empires, but the Dutch were exceptionally efficient in reducing idle time in ports when compared to the Portuguese (Parthesius Reference Parthesius2010: 57).
Monsoons in the Indian Ocean and difficulties rounding the Cape in winter could force long stays at intermediate ports affecting voyage duration and vessel turnover. The average duration of Dutch voyages was 8.1 months outbound and 7.8 inbound (Bruijn Reference Bruijn, Gaastra and Schöffer1979, I: 74 and 89). In the absence of unexpected delays, Portugal’s voyages lasted 5.8 and 6.5 months respectively, as expected of a shorter route.Footnote 38 However, one in every nine Portuguese vessels between 1500 and 1635 wintered in a port of call, stretching the outward voyage to 12 or even 18 months (Godinho Reference Godinho, Bruijn and Gaastra1993: 12). If the Dutch had a better capital utilization, Portugal would need more ships for any given number of voyages. The multiplier’s magnitude depends on the idle time Portuguese vessels spent in ports waiting for the change of season: half a year would require twice as many ships, four months 1.66, three months 1.5, two months 1.33, and so on.Footnote 39 Monsoons in the Indian Ocean last five months but only two of those months have intense rains and winds, whereas winter can take up to four months. If these were the two major events halting Portuguese ships in port, any idle time up to six months of the year would be sensible. The maximum multiplier would be 2 corresponding to a fleet no larger than 956 ships.
All told, shipworm and lower capital intensity both render the baseline fleet size of 478 vessels too small. But the 1,513-fleet with a bloated multiplier of 3.25 corresponding to 13.5 months idle in port per year waiting for the change of season, is manifestly absurd. The remaining two fleets of 611 and 835 vessels provide, therefore, plausible lower and upper bounds with implicit multipliers of 1.28 and 1.75 corresponding to nearly two months and four-and-a-half months of idle time in port in a year, respectively, which seems sensible.Footnote 40
In the lowest capital utilization scenario of the 835-fleet, the 32% share of very large vessels is higher than any of the corresponding shares of ships built in the VOC’s shipyards in Table 1. Given the Company’s outside purchases and hires of small and medium vessels, the share of very large ships in the Dutch fleet would only be lower than that of its own ship building making the comparison with Portugal’s estimated fleet even more stark. Portugal’s heavy reliance on very large vessels befits an empire where shipping decisions stemmed from the crown, whose objectives involved not only trade but also glory and prestige.



 Open access

