


Introduction
Radical right parties (RRPs) seldom break into national party systems out of the blue. Sometimes, they rely on second-order elections (SOEs) as steppingstones. Several examples illustrate this logic: Vox’s breakthrough in the 2018 Andalusian regional election before entering the national parliament in 2019, the Danish People’s Party debut in the 1997 municipal elections before it entered the national parliament in 1998, and farther back, the Freedom Party of Austria landing in several regional parliaments before gaining seats in the 1956 general election. These examples suggest RRPs may benefit from a bottom-up spillover effect, helping them break into national party systems. Yet, what is the logic behind this effect?
The electoral studies literature can help us make sense of this bottom-up spillover effect for RRPs. Since the seminal work of Cox (Reference Cox1997), we know that an electoral result provides information to voters, which helps them to update the status of different parties and the popularity of their policy/ideological positions. Admittedly, the magnitude of information updating is not always the same, and it is well known that a threshold can affect voters’ calculus (Shugart and Taagepera, Reference Shugart and Taagepera2017). When an RRP crosses an electoral threshold, it is perceived as more viable (Aldrich et al., Reference Aldrich, Blais, Stephenson, Aldrich, Blais and Stephenson2018, p. 18). Likewise, when an RRP obtains parliamentary representation, this can bring along more media exposure (Gattermann et al., Reference Gattermann, Meyer and Wurzer2022) and signals a legitimation of the RRP’s viewpoint (Bischof and Wagner, Reference Bischof and Wagner2019; Valentim, Reference Valentim2021). Although most works on information-updating focus on first-order elections (FOEs), this framework can certainly be extended to SOEs, for parties and voters are both situated in a multi-level system. As such, when an RRP crosses the threshold in an SOE, these different information-updating processes can affect the party’s vote share and voters’ calculus of voting in a subsequent FOE.
In this article, I test whether RRPs benefit from bottom-up spillover effects using the case of Germany. The SOE of this paper’s concern is regional elections, and I use the case of Germany for two main reasons. The first reason concerns its multi-level political system. Both its regional and national elections have largely congruent electoral systems that consist of a 5% threshold, and it has a nationally integrated party system. Also, because its regional parliaments have powerful jurisdictions, regional elections attract much media attention. The second reason relates to its political culture, as the stigma against RRPs has been particularly strong. The stigma has been so strong that all major parties maintain a cordon sanitaire around RRPs. Because of the social desirability pressure, voters shy away from giving overt support for an RRP, leading to a high barrier for RRPs to compete even in regional elections. For these two reasons, voters are likely to update the status of an RRP if it breaks into a regional parliament.
To examine whether the effect exists, I first collected vote shares of all RRPs in regional elections and federal elections at the regional level. This aggregate-level dataset covers the period from 1965 to 2019. Through a regression discontinuity design (RDD), I find that passing the regional threshold can substantially boost an RRP’s electoral result in a subsequent FOE. I also explore whether the effect is generalizable to other party families but fail to find evidence for them. Next, to analyze the micro-level mechanisms of this effect for RRPs, I use the German Longitudinal Election Study (GLES) panel and focus on a short episode from 2016 to 2017. During this short period, the Alternative for Germany (AfD) had entered regional parliaments in two states (treated states), while there were several states where the AfD had not yet entered (control states). The GLES panel is crucial because I can check for the horizontal spillover across regions, as the regional parliamentary entry in treated states can contaminate control states. Though this horizontal spillover can only underestimate the effects of different causal mechanisms, I still find that AfD voters in treated states evaluate AfD more positively than those in control states. On the other hand, the panel analysis does not provide support for the viability mechanism and exposure mechanism. Taken together, these results suggest that the legitimation mechanism is the dominant mechanism.
The contribution of the article is threefold. First, it enriches the SOE literature by showing that precedent regional electoral results affect an RRP’s vote share and voters’ calculus of voting in an upcoming FOE. Importantly, the bottom-up spillover effect for RRPs challenges the conventional SOE framework that argues ideologically extreme parties usually lose votes in a subsequent FOE. Second, by studying whether a bottom-up spillover effect exists, this research helps us understand why an RRP can succeed in establishing itself in the national party system through SOEs. In the current literature, some studies analyze RRP success in regional arenas using the demand-side or supply-side approach (Kestilä and Söderlund, Reference Kestilä and Söderlund2007; Patana, Reference Patana2020). Yet, they have not studied whether RRPs can take advantage of a bottom-up spillover effect (but see Schulte-Cloos, Reference Schulte-Cloos2018 for the top-down spillover effect). Hence, this research is the first to find such an effect for RRPs. Third, this paper disentangles the mechanisms behind the bottom-up spillover effect, namely the viability mechanism, the exposure mechanism, and the legitimation mechanism. Although previous studies of information updating have identified these three mechanisms, they did not disentangle them at the micro-level.
Literature related to bottom-up spillover effects
This paper uses two main strands of literature to understand bottom-up spillover effects, namely studies on information updating in concatenated elections and studies related to SOEs. These two strands of literature are usually kept separate despite the potential for fruitful cross-fertilization. Blending them helps us understand how previous SOE results shape an RRP’s success and voters’ calculus of voting in a subsequent FOE.
The fact that electoral results reveal information and shape subsequent vote choices is hardly novel. When Piketty (Reference Piketty2000) proposes ‘voting as communicating,’ he argues that a previous electoral result can influence voting behavior in a subsequent election. Explicit in his model is the idea that voters do not simply focus on one single election. Instead, elections are concatenated, and the result of a previous election can enter voters’ calculus of voting in a subsequent election. In other words, the function of the first-stage election is not merely to select parties or policies, but also to aggregate information about the distribution of different parties’ preferences. This information can then shape voters’ choices in a second-stage election.
Different scholars used this idea of information updating by explaining different phenomena of concatenated elections, such as parties’ policy platforms and voter turnout. Of particular interest is the work by McMurray (Reference McMurray2017) that elucidates why some voters opt for an extremist party, even though it is doomed not to be elected. In his model, voters have incentives to choose an extremist party in the first-stage election because its electoral performance ‘can nudge the policy outcome even further to the left or right’ (p. 200). Although this study emphasizes how mainstream parties incorporate the extremist party’s electoral result to identify their optimal policies, this information-updating process can plausibly occur among voters as well. That is, the vote share in a first-stage election can influence voters’ beliefs and vote choice in a future election.
One important remark about the concatenated elections literature is that it is mainly applied to USA presidential primaries or European two-round runoffs (Abramson et al., Reference Abramson, Aldrich, Paolino and Rohde1992; Blais and Loewen, Reference Blais and Loewen2009; Kiss and Simonovits, Reference Kiss and Simonovits2014), but is less employed in analyzing a multi-level system. However, the notion of information updating in concatenated elections has parallels in the SOE literature. Several studies examined how previous SOEs impact a party’s vote share or voters’ preferences in a subsequent FOE. In terms of aggregate-level evidence, some scholars show that previous SOEs shape electoral volatility in a subsequent FOE (Bechtel, Reference Bechtel2012) and increase the size of national party systems (Prosser, Reference Prosser2016). Focusing on the top-down spillover, Schulte-Cloos (Reference Schulte-Cloos2018) finds that European Parliament (EP) elections foster RRPs’ vote shares in national elections, as RRPs leverage the opportunities in EP elections to increase their visibility. Talking about the bottom-up spillover, Dinas and Foos (Reference Dinas and Foos2017) use the case of Germany to show that a small party’s vote share increases in a subsequent FOE if it crosses the regional electoral threshold, regardless of party families. Importantly, they argue that breakthrough in regional elections can provide parties with organizational resources.
On the other hand, the individual-level evidence on spillover effects is rarer. Using the example of the Liberal Democrats in the UK, Cutts (Reference Cutts2014) argues that winning a local council election serves as a ‘stepping stone’ for a subsequent FOE, for local success can boost the party’s campaign effort. In terms of cross-country studies, Dinas and Riera (Reference Dinas and Riera2018) demonstrate that voting patterns in EP elections spill over to national elections via habitual voting, which thus increases the national share of small parties. Overall, even though scholars investigate various party families and propose different mechanisms, these studies support the idea that previous SOEs influence a party’s vote share and voters’ calculus of voting in a subsequent FOE.
In this paper, I push forward the above literature by analyzing the bottom-up spillover effect for RRPs. Regarding the aggregate-level evidence, I argue that the bottom-up spillover effect is reflected through an increase in an RRP’s vote share in a subsequent FOE. The focus on the RRP family is driven by the fact that RRPs have been stigmatized in Western European democracies (Harteveld et al., Reference Harteveld, Dahlberg, Kokkonen and van der Brug2019). As such, the information-updating process should be especially salient when an RRP crosses a regional electoral threshold, as electoral studies have already shown that voters’ information-updating process is non-monotonic around an electoral threshold (Shugart and Taagepera, Reference Shugart and Taagepera2017). This leads us to the following hypothesis:
Bottom-up spillover effect (H1): If an RRP crosses the regional electoral threshold, its vote share increases in the upcoming FOE.
There are two caveats in understanding this bottom-up spillover effect. First, when an RRP crosses a regional electoral threshold, the information-updating process takes place not just in that region but may spillover to other regions as well (i.e., contamination). Second, it is important to note that the bottom-up spillover effect for RRPs conflicts with the conventional SOE framework, which suggests that ideologically extreme parties lose votes in a subsequent FOE (Schmitt et al., Reference Schmitt, Sanz, Braun and Teperoglou2020).
The viability mechanism, exposure mechanism, and legitimation mechanism
In this section, I elaborate on three possible mechanisms that explain the effect. The first is the viability mechanism. This mechanism suggests that the first-stage SOE result of an RRP can change voters’ expectations of its viability (Blais and Bodet, Reference Blais and Bodet2006). That is, voters learn about the RRP’s level of support from the first-stage SOE result, which allows them to better coordinate their votes in the second-stage FOE. Put differently, electorates have prior expectations concerning the RRP’s viability, and these prior beliefs are updated when an RRP surpasses the SOE electoral threshold.
This expectation implies, first, that an RRP’s breakthrough in a regional election should increase its perceived probability of entering the national parliament in the upcoming FOE among its voters. Moreover, due to this increase in perceived viability, the RRP’s entry into regional parliament should increase voters’ likelihood to choose the RRP as the first preference: Previous RRP voters are more likely to stick to the party in subsequent FOE and potential supporters from other parties and previous non-voters are less likely to think voting for the RRP is a wasted vote (Golder et al., Reference Golder, Lago, Blais, Gidengil and Gschwend2017, pp. 89–91). On this basis, I formulate the following hypotheses:
After an RRP crossed the regional electoral threshold,
H2a: its voters in the upcoming FOE in treated states are more likely to perceive the RRP as capable of entering national parliament than those in control states.
H2b: its voters in the upcoming FOE in treated states are more likely to choose the RRP as their first preference than those in control states.
The second mechanism is the exposure mechanism, which concerns the visibility advantage that an RRP obtains in regional parliaments. If an RRP does not have regional parliamentary representation, it has fewer resources to maintain party organization. Contrarily, entering regional parliaments brings public funding and helps enroll party members (Dinas and Foos, Reference Dinas and Foos2017; Dinas et al., Reference Dinas, Riera and Roussias2015). These resources are crucial for a subsequent FOE, as they can improve the RRP’s visibility. Moreover, regional parliamentary representation increases media exposure. Whereas failure to enter a regional parliament means limited access to public media, regional parliamentary success implies more media reporting (Gattermann et al., Reference Gattermann, Meyer and Wurzer2022). This media exposure can raise the salience of the RRP’s policy position (Dinas et al., Reference Dinas, Riera and Roussias2015), especially its position on immigration, which is thought to be the major issue of RRPs (Grande et al., Reference Grande, Schwarzbözl and Fatke2019). These expectations lead to the following hypothesis:
After an RRP crossed the regional electoral threshold,
H3a: its voters in the upcoming FOE in treated states are more likely to receive the RRP’s campaign information than those in control states.
H3b: its voters in the upcoming FOE in treated states are more likely to know the RRP’s immigration position than those in control states.
The last mechanism is the legitimation mechanism. It suggests that an electoral result transmits information to electorates about social norms (Bischof and Wagner, Reference Bischof and Wagner2019; Valentim, Reference Valentim2021). When an RRP obtains representation, it signals that the radical right viewpoint is less stigmatized. As a result, RRP supporters are more likely to perceive that their views have been legitimized and more likely to reveal their affinity with the RRP. Although previous studies mostly focused on FOEs, this mechanism can certainly be applied to SOEs. That is, an RRP’s entry into a regional parliament signals the RRP is now a socially acceptable option. Consequently, RRP voters evaluate the RRP in a more positive light. This leads to the hypothesis of legitimation mechanism:
After an RRP crossed the regional electoral threshold,
H4: its voters in the upcoming FOE in treated states evaluate the party more positively than those in control states.
Research design
Aggregate-level analysis
My analysis involves two parts. First, I test whether a bottom-up spillover effect exists for RRPs. I use the vote share data at the regional level provided by the Federal Returning Officer. I create a dataset that includes an RRP’s vote share in a regional election within a region and its vote share in a subsequent federal election within that region. The RRP parties include AfD, DVU (Die Deutsche Volksunion), NPD (Nationaldemokratische Partei Deutschlands), REP (Die Republikaner), Schill Partei and Offensive D. The timeframe of this dataset is from the 1965 national electoral cycle up to the Thuringia regional election in 2019. In the period before unification, the results apply to 10 states that constituted the former Federal Republic of Germany, whereas from 1990–2019, the results of 5 new East German states and Berlin are included.
In estimating the effect, I follow the standard RDD approach by allowing a pooled regression on both sides of the threshold and estimate using the rdrobust package (Calonico et al., Reference Calonico, Cattaneo, Farrell and Titiunik2017). The estimation suggests using one polynomial for both sides of the threshold at all bandwidths. As such, my RDD model is a local linear regression model, written as follows:
 $${Y_{i,s,t}} = \;{\alpha _\;} + \beta ({X_{i,s,t}} - c) + \tau {D_{i,s,t}} + {\varepsilon _{i,s,t}}$$
where i = 1…n signifies the parties within the RRP family; s = 1…16 denotes the states in Germany; t indicates the timing of regional election; ${D_{i,s,t}}\;$
is a dummy that switches on if party i passed the 5% regional electoral threshold in state s at time t;
${D_{i,s,t}}\;$
is a dummy that switches on if party i passed the 5% regional electoral threshold in state s at time t; ${X_{i,s,t}}$
denotes party i’s vote share in a regional election in state s at time t, and
${X_{i,s,t}}$
denotes party i’s vote share in a regional election in state s at time t, and $c$
is the 5% electoral threshold that exists in all regional parliamentary elections.Footnote
1
$c$
is the 5% electoral threshold that exists in all regional parliamentary elections.Footnote
1 ${Y_{i,s,t}}$
is party i’s vote share in a subsequent federal election in state s at time t.Footnote
2
The coefficient of
${Y_{i,s,t}}$
is party i’s vote share in a subsequent federal election in state s at time t.Footnote
2
The coefficient of ${D_{i,s,t}}$
(
${D_{i,s,t}}$
( ${\rm{\tau }}$
) concerns this research most, as it indicates the change in vote share in percentage points (pp) in a subsequent FOE if party i can cross the regional electoral threshold in state s. I test the robustness of the results using various bandwidths (i.e., full sample, ±5%, ±4%, ±3%, and the optimal bandwidth proposed by Calonico et al. (Reference Calonico, Cattaneo, Farrell and Titiunik2017), which is ±2.692% in this case). The estimation uses a triangular kernel, which gives more weight to the data points that are closer to the threshold, and errors are clustered at each regional election.
${\rm{\tau }}$
) concerns this research most, as it indicates the change in vote share in percentage points (pp) in a subsequent FOE if party i can cross the regional electoral threshold in state s. I test the robustness of the results using various bandwidths (i.e., full sample, ±5%, ±4%, ±3%, and the optimal bandwidth proposed by Calonico et al. (Reference Calonico, Cattaneo, Farrell and Titiunik2017), which is ±2.692% in this case). The estimation uses a triangular kernel, which gives more weight to the data points that are closer to the threshold, and errors are clustered at each regional election.
Individual-level analysis
In the second-stage analysis, I use the GLES Panel (Debus et al., Reference Debus, Faas and Roßteutscher2021) to analyze which micro-level mechanism is more dominant in driving the effect. GLES recruited respondents via an online access panel that used socio-demographic quotas. My analysis draws on all seven pre-federal election waves collected between October 2016 and September 2017 (See Table A.1 and A.2 for the data collection period and panel retention rates).
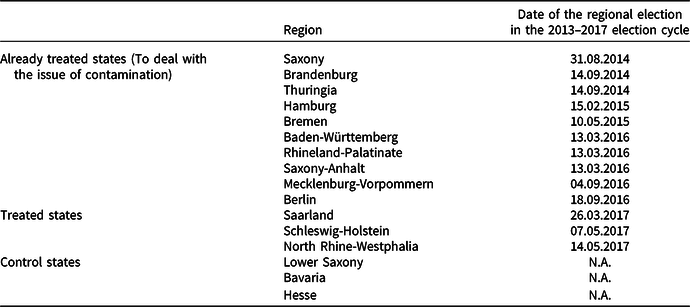
The panel data has several advantages. First, most measurements concerning the three mechanisms were collected repeatedly. This allows me to trace the evolvement of political attitude, perception, and vote preference among AfD voters and other voters in this short episode. Second, as shown in Table 1, AfD had broken into regional parliaments in some states in-between survey waves, but not in others. This quasi-experimental setting enables me to use a Difference-in-Differences (DiD) model to estimate the change in parameters of interest in the former states (treated states) relative to that in the latter states (control states). Note that the terminology is merely for convenience because, as mentioned before, citizens in control states could receive information when AfD broke into the regional parliament in treated states. In the robustness check, I address this issue of contamination of control units. Nonetheless, I assume the effect of AfD’s entry into regional parliament should be stronger in treated states than that in control states. Also, contamination of control units only attenuates the effects of different mechanisms being observed.
Data structure of the GLES panel: AfD’s breakthrough in regional parliaments during the 2013–2017 election cycle
The DID model is formalized as follows:
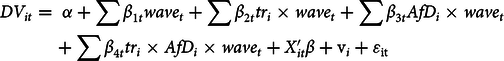 \begin{gathered}D{V_{it}} = \;\alpha + \sum {{\beta _{1t}}} wav{e_t} + \sum {{\beta _{2t}}} t{r_i} \times wav{e_t} + \sum {{\beta _{3t}}} Af{D_i} \times wav{e_t} \\
+ \sum {{\beta _{4t}}} t{r_i} \times Af{D_i} \times wav{e_t} + X{'_{it}}\beta + {{\text{v}}_i} + {\varepsilon _{{\text{it}}}} \\\end{gathered}
\begin{gathered}D{V_{it}} = \;\alpha + \sum {{\beta _{1t}}} wav{e_t} + \sum {{\beta _{2t}}} t{r_i} \times wav{e_t} + \sum {{\beta _{3t}}} Af{D_i} \times wav{e_t} \\
+ \sum {{\beta _{4t}}} t{r_i} \times Af{D_i} \times wav{e_t} + X{'_{it}}\beta + {{\text{v}}_i} + {\varepsilon _{{\text{it}}}} \\\end{gathered}
where i = 1…N respondents in the dataset; t = 1…7 indicates wave number. $t{r_i}$
is a dummy that switches on if respondent i lives in a treated state and 0 otherwise.
$t{r_i}$
is a dummy that switches on if respondent i lives in a treated state and 0 otherwise. $Af{D_i}$
is a dummy that switches on if respondent i is an AfD voter in the 2017 federal election and switches off if he/she chose other parties or abstained.
$Af{D_i}$
is a dummy that switches on if respondent i is an AfD voter in the 2017 federal election and switches off if he/she chose other parties or abstained. ${{\rm{v}}_i}$
is the unobserved time-invariant individual effect.
${{\rm{v}}_i}$
is the unobserved time-invariant individual effect. ${{\boldsymbol X}_{it}}$
is a vector of individual-level covariates at wave t, which include AfD partisanship, economic attitude, immigration attitude, political interest.
${{\boldsymbol X}_{it}}$
is a vector of individual-level covariates at wave t, which include AfD partisanship, economic attitude, immigration attitude, political interest. $D{V_{it\;}}$
is the dependent variable of respondent i in wave t as delineated below. Regarding the regression sample in the main analysis, I exclude respondents who live in the ten states where AfD had already entered the regional parliament before the panel survey began. Yet, in the robustness check, I use these samples in placebo tests to handle the issue of contamination. In total, the baseline dataset has 599 respondents who voted AfD in the 2017 federal election and 4426 respondents who chose other options.
$D{V_{it\;}}$
is the dependent variable of respondent i in wave t as delineated below. Regarding the regression sample in the main analysis, I exclude respondents who live in the ten states where AfD had already entered the regional parliament before the panel survey began. Yet, in the robustness check, I use these samples in placebo tests to handle the issue of contamination. In total, the baseline dataset has 599 respondents who voted AfD in the 2017 federal election and 4426 respondents who chose other options.
Talking about the dependent variables, the analysis relies on two measurements for the viability mechanism. The first concerns the perceived probability of AfD entering the federal parliament. The survey asked respondents how likely AfD would be represented in the Bundestag. The scale ranges from 0 (definitely not) to 1 (definitely). The second dependent variable is whether respondents choose AfD as their first preference in their party-list vote in the 2017 federal election. This variable is coded as 1 if respondents answer they intend to vote for AfD in their party-list vote and coded as 0 if respondents answer: (a) other parties; or (b) not intend to vote and not provide any party preference.
Regarding the exposure mechanism, I employ two dependent variables. One dependent variable is having contact with AfD during the campaign period. It is a dummy that is coded as 1 if respondent encountered one of the following seven scenarios: (i) visited websites of a party or a candidate; (ii) saw campaign posters; (iii) saw party political broadcasts on TV; (iv) listened to party political broadcasts on the radio; (v) had conversations at an election campaign booth; (vi) received campaign flyers, e-mails, text messages; and (vii) received information material via a social network like Facebook or others. Another dependent variable is the knowledge of AfD’s immigration position. I create a dummy that is coded as 1 if respondents provided the immigration position of AfD and 0 if the answer is ‘don’t know’.
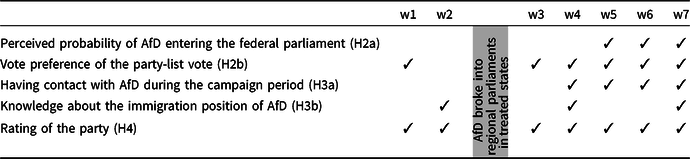
Lastly, for the legitimation mechanism, I use the feeling-thermometer question that asks respondents to rate AfD. Its scale ranges from −5 (I do not think much of the party at all) to +5 (I think a great deal of the party) (See Table A.3 and A.4 for the descriptive statistics and coding of variables). A caveat shall be made here: as shown in Table 2, some dependent variables were not measured before the AfD had entered regional parliaments in treated states because they were only asked during the campaign period. Thus, if there are significant changes between the two units over subsequent waves, I infer AfD’s breakthrough in regional parliaments exerts an impact on the quantity of interest.
Data structure of the GLES panel: parameters of interest collected across waves
Results
Aggregate-level RD estimation
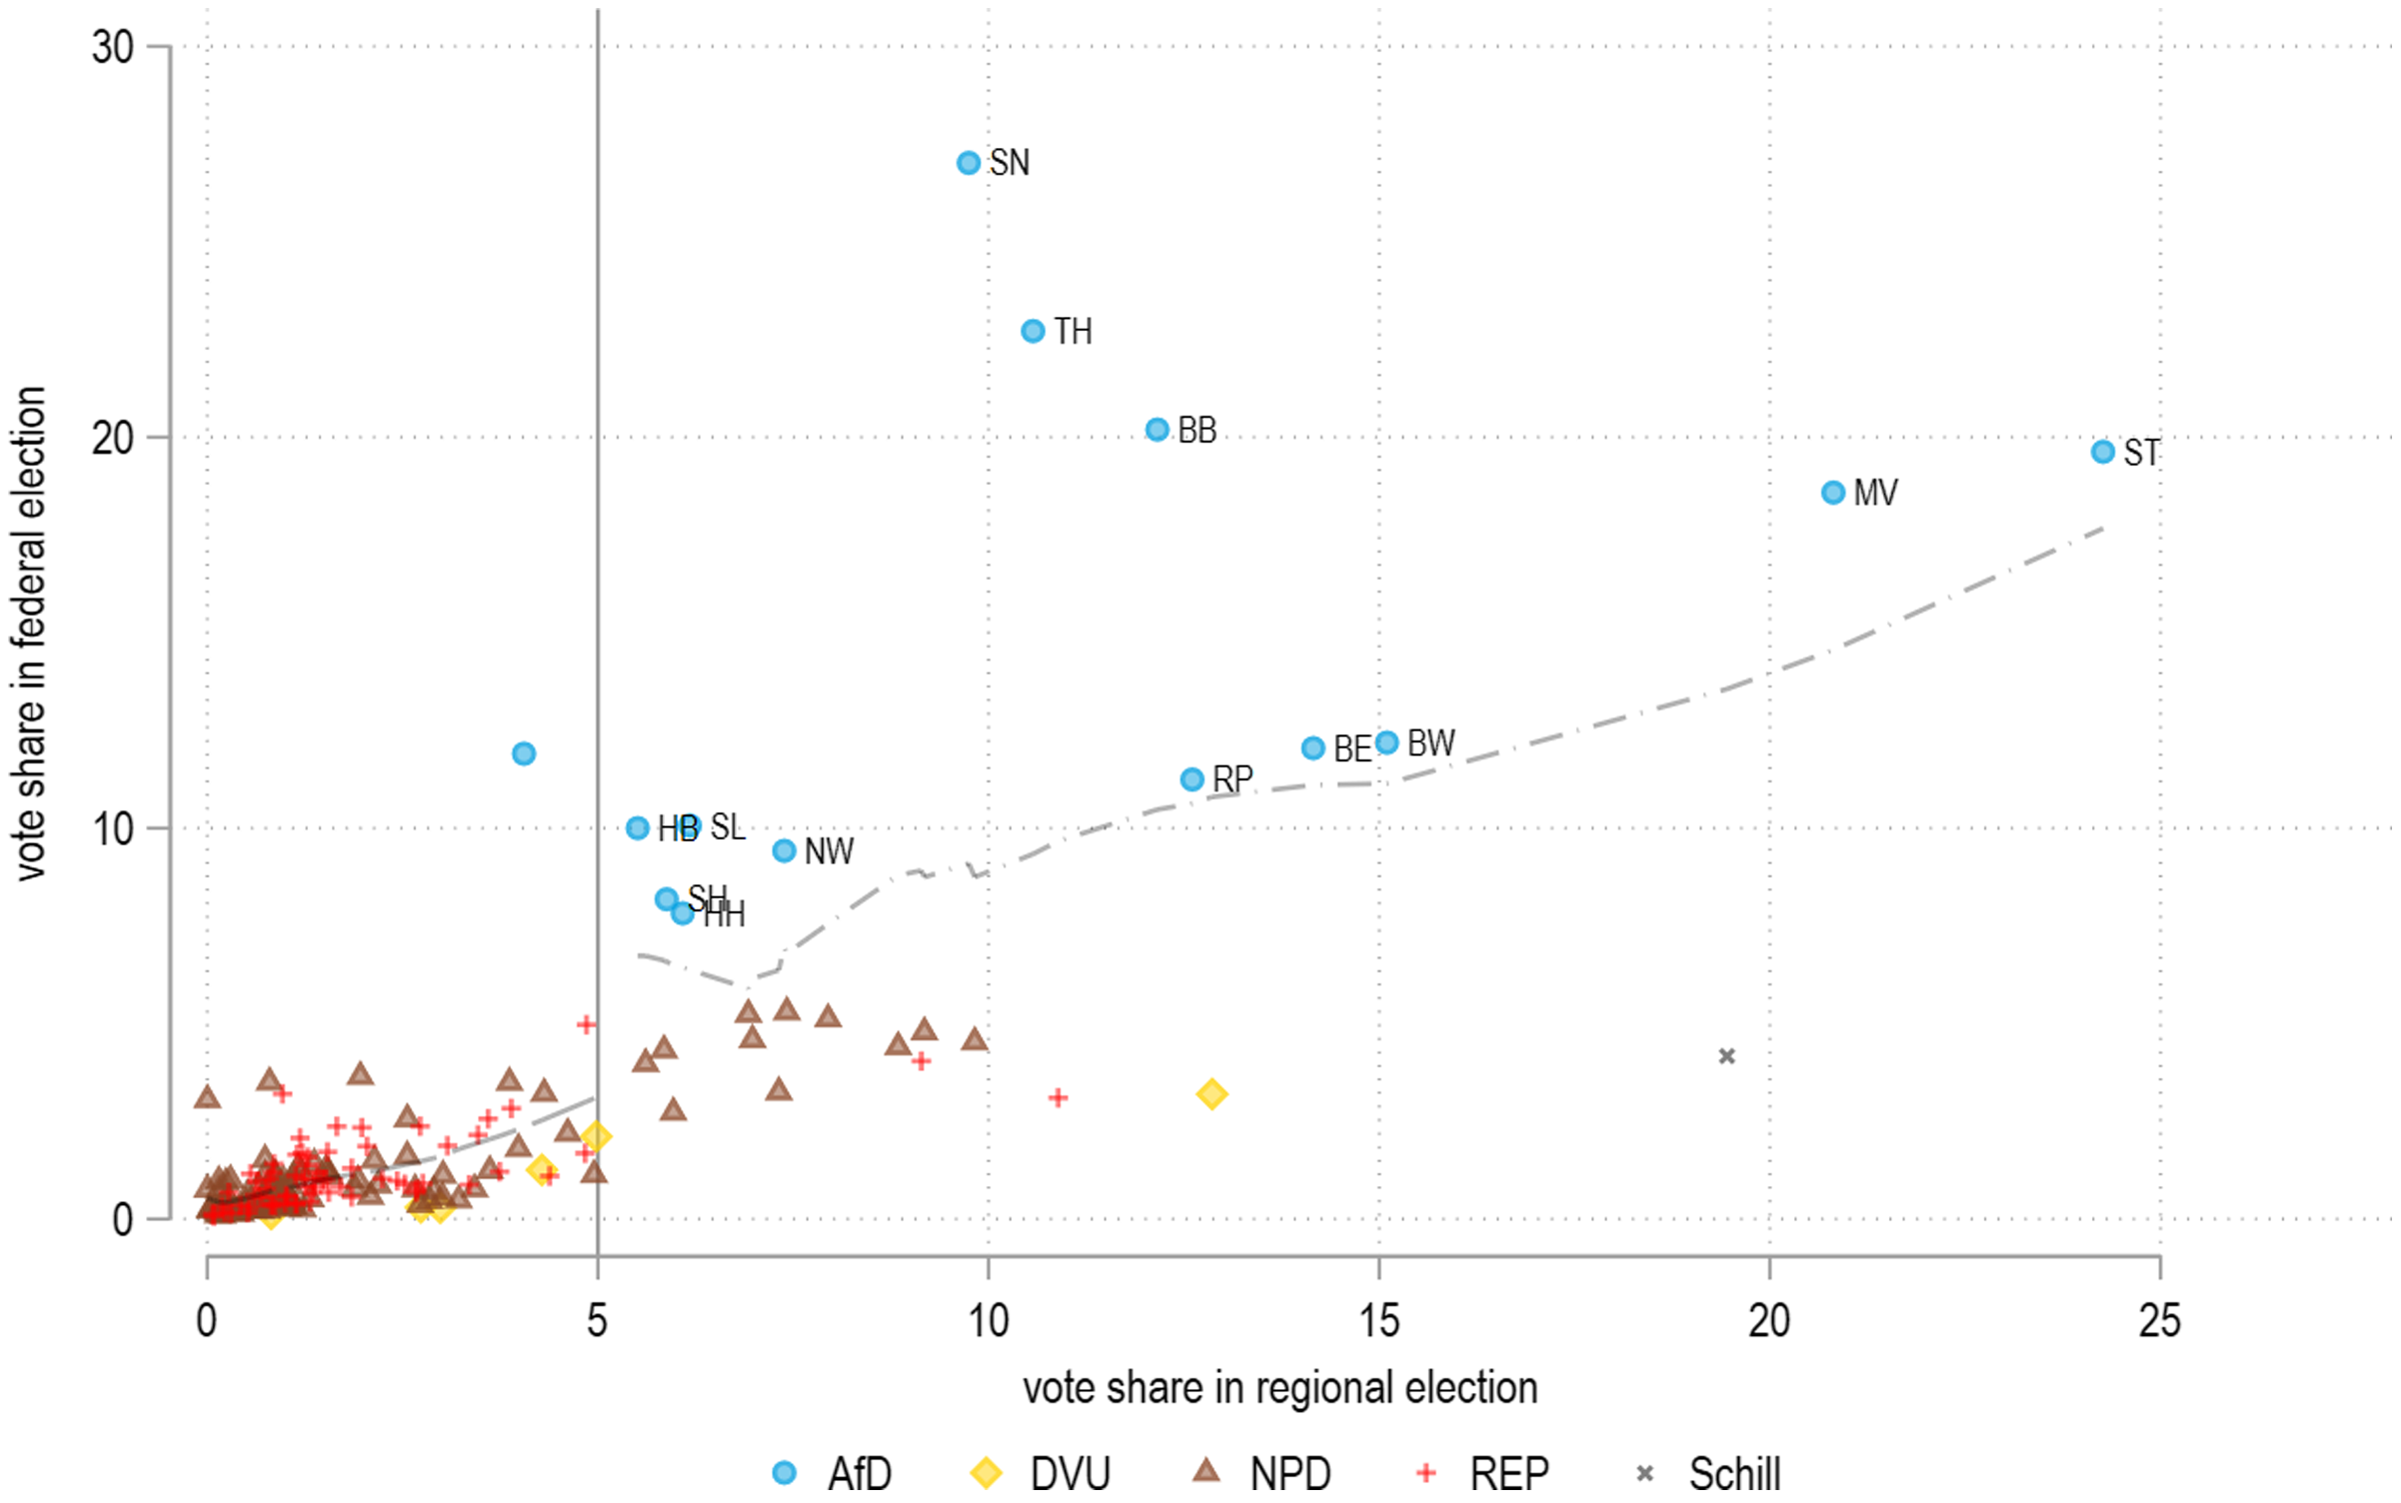
Figure 1 shows the vote shares of RRPs in a regional election and their vote shares in a subsequent federal election within that region. There are several noticeable patterns. First, one can see that the number of data points on the left-hand side of the 5% electoral threshold is much larger than that on the right-hand side, meaning RRPs’ entry into regional parliaments is uncommon. Second, DVU, NPD, and REP could not cross over the threshold in regional elections most of the time, with many data points clustering around 0%−2%, which indicates the stigmatization of RRPs in Germany. Third, the bottom-up spillover effect is most evident upon AfD. In eight out of thirteen states, there is an increase in its vote share in the 2017 federal election after it crosses the regional threshold. The increase is especially abrupt in those East German states, like Brandenburg, Saxony, and Thuringia.
Vote shares of different radical right parties in state elections and their vote shares in a subsequent federal election (N = 194). Note: The solid line represents the 5% threshold in a regional election; the dotted lines are the lowess curves below and above the threshold respectively. Abbreviations denote the following states: BW = Baden-Württemberg; BE = Berlin; BB = Brandenburg; HB = Bremen; HH = Hamburg; MV = Mecklenburg-Vorpommern; NW = North Rhine-Westphalia; RP = Rhineland-Palatinate; SL = Saarland; SN = Saxony; ST = Saxony-Anhalt; SH = Schleswig-Holstein; TH = Thuringia.
Talking about the estimation of the bottom-up spillover effect, Figure 2 upper panel illustrates the average treatment effect ( ${\rm{\tau }}$
) of the RDD model at different bandwidths using the conventional estimate (See online Table B.1 for regression results). The sign of
${\rm{\tau }}$
) of the RDD model at different bandwidths using the conventional estimate (See online Table B.1 for regression results). The sign of ${\rm{\tau }}$
is positive in all models, which indicates there is an increase in vote share in a subsequent federal election if an RRP can cross a regional electoral threshold. In substantive terms, if an RRP can pass through a regional electoral threshold, its electoral performance in a subsequent federal election is enhanced by around 3.0 pp−4.3 pp on average. Importantly, even when narrowing the bandwidth further to the optimal one (
${\rm{\tau }}$
is positive in all models, which indicates there is an increase in vote share in a subsequent federal election if an RRP can cross a regional electoral threshold. In substantive terms, if an RRP can pass through a regional electoral threshold, its electoral performance in a subsequent federal election is enhanced by around 3.0 pp−4.3 pp on average. Importantly, even when narrowing the bandwidth further to the optimal one ( $ \pm $
2.69%), the estimate is still marginally significant and stays at the same magnitude. In sum, the RD estimations demonstrate that there is a bottom-up spillover effect for RRPs. To reiterate, this effect conflicts with the SOE framework because it suggests that ideologically extreme parties tend to lose votes in a subsequent FOE (Schmitt et al., Reference Schmitt, Sanz, Braun and Teperoglou2020).
$ \pm $
2.69%), the estimate is still marginally significant and stays at the same magnitude. In sum, the RD estimations demonstrate that there is a bottom-up spillover effect for RRPs. To reiterate, this effect conflicts with the SOE framework because it suggests that ideologically extreme parties tend to lose votes in a subsequent FOE (Schmitt et al., Reference Schmitt, Sanz, Braun and Teperoglou2020).
Upper panel: Regression discontinuity estimates of the bottom-up spillover effect for radical right parties. Note: Thick and thin error bars represent 90% and 95% confidence intervals (Conventional Estimate). Lower panel: Loess curve illustrating the temporal dimension of the bottom-up spillover effect. Note: Each dot represents ${\boldsymbol{\tau }}$
. The grey area represents 95% confidence intervals. The bandwidth is set at
${\boldsymbol{\tau }}$
. The grey area represents 95% confidence intervals. The bandwidth is set at $ \pm $
4%. If the number of observations is below 30, they are not included in the estimation.
$ \pm $
4%. If the number of observations is below 30, they are not included in the estimation.

To illustrate the temporal dimension of the bottom-up spillover effect, I run the regressions again with pooled observations of RRPs and exclude observations that are close to the federal election first, day by day accumulatively. That means, the first estimate excludes observations in which the temporal distance between the regional election and the subsequent federal election is $ \le $
1 day. The second estimate excludes observations in which the temporal distance is
$ \le $
1 day. The second estimate excludes observations in which the temporal distance is $ \le $
2 days, and so on. The bandwidth is set at
$ \le $
2 days, and so on. The bandwidth is set at $ \pm $
4% to ensure enough observations and there are 1056 estimates (
$ \pm $
4% to ensure enough observations and there are 1056 estimates ( ${\rm{\tau }}$
). The output is shown in Figure 2 lower panel, with each data point representing
${\rm{\tau }}$
). The output is shown in Figure 2 lower panel, with each data point representing ${\rm{\tau }}$
. The bottom-up spillover effect is rather stable at around 4.5pp until the excluded days reached 950. Once the excluded days are larger than 950, the effect is reduced to zero and even drops to a negative value. This trend of the bottom-up spillover effect certainly conflicts with the work of Dinas and Foos (Reference Dinas and Foos2017), which finds the effect is most pronounced when the regional election is temporally far from a subsequent general election. For the bottom-up spillover effect to come to fruition, they argue sufficient time is needed for parties to organize and recruit members, regardless of party families. However, my result shows that this organizational explanation may not apply to RRPs, for they gain electoral momentum only when the temporal distance between SOE and a subsequent FOE is within 2.5 years. As such, the temporal dimension of the bottom-up spillover effect works differently for RRPs.
${\rm{\tau }}$
. The bottom-up spillover effect is rather stable at around 4.5pp until the excluded days reached 950. Once the excluded days are larger than 950, the effect is reduced to zero and even drops to a negative value. This trend of the bottom-up spillover effect certainly conflicts with the work of Dinas and Foos (Reference Dinas and Foos2017), which finds the effect is most pronounced when the regional election is temporally far from a subsequent general election. For the bottom-up spillover effect to come to fruition, they argue sufficient time is needed for parties to organize and recruit members, regardless of party families. However, my result shows that this organizational explanation may not apply to RRPs, for they gain electoral momentum only when the temporal distance between SOE and a subsequent FOE is within 2.5 years. As such, the temporal dimension of the bottom-up spillover effect works differently for RRPs.
Regarding robustness checks, I first use bias-corrected estimates to check whether the effect remains robust. Except for the full sample regression, the bias-corrected estimates are all statistically significant at 0.05 level and they are even slightly stronger than the conventional estimates in magnitude (4.5 pp−5.8 pp) (see online Table B.2 & Figure B.1). Next, to check whether this effect is driven by an RRP alone, I rerun the model using the full sample and pull out a single RRP in each estimation. The results are robust across all models: the magnitudes of the bottom-up spillover effect revolve between 2 pp−3 pp in four out of five models and maximize at around 6pp when NPD is dropped (see Table B.3 & Figure B.2). So, even when AfD is dropped from the estimation, there is still a statistically significant effect (P < 0.001), which signifies that the effect is not driven by AfD alone.
In terms of placebo tests, I use an RRP’s vote share in the previous federal election as the outcome. Passing through the 5% threshold in a regional election should not affect its vote share in the previous federal election. In the second placebo test, the threshold is shifted to 3%: the bottom-up spillover effect should not be triggered by this pseudo-threshold. Third, the forcing variable is changed to an RRP’s vote share in a federal election, and the vote share in a subsequent regional election is used as outcome. The rationale is to respond to the question concerning whether there is also a top-down spillover effect. According to my framework, passing through the 5% hurdle in FOE within a particular state shall not induce a change in the RRP’s vote share. All placebo tests are safely passed (See Tables B.4–B.6).
In terms of covariate balance tests, I create dummy variables for pre/post-1989 and all 16 states and rerun all analyses using these dummies as outcomes. The motivation is to ensure that these covariates do not confound RD estimates and these covariates are not over- or under-represented on each side of the threshold (Caughey and Sekhon, Reference Caughey and Sekhon2011). The covariate balance test is reported in Figure B.3 and Table B.7–B.11, showing that all estimates of the dummies are indistinguishable from zero. The null results of the East German states’ dummies are noteworthy since the literature mentions RRPs have a stronghold in East Germany (Olsen, Reference Olsen2018). However, the bottom-up spillover effect does not merely apply in East Germany. Lastly, because an RRP can deliberately decide not to run in some regional elections that they anticipate would barely fall below the threshold, I use the manipulation test to check if there is any sorting of data points at different bandwidths (Cattaneo et al., Reference Cattaneo, Jansson and Ma2018). Yet, none of these tests indicates sorting (Table B.12).
Is the effect generalizable?
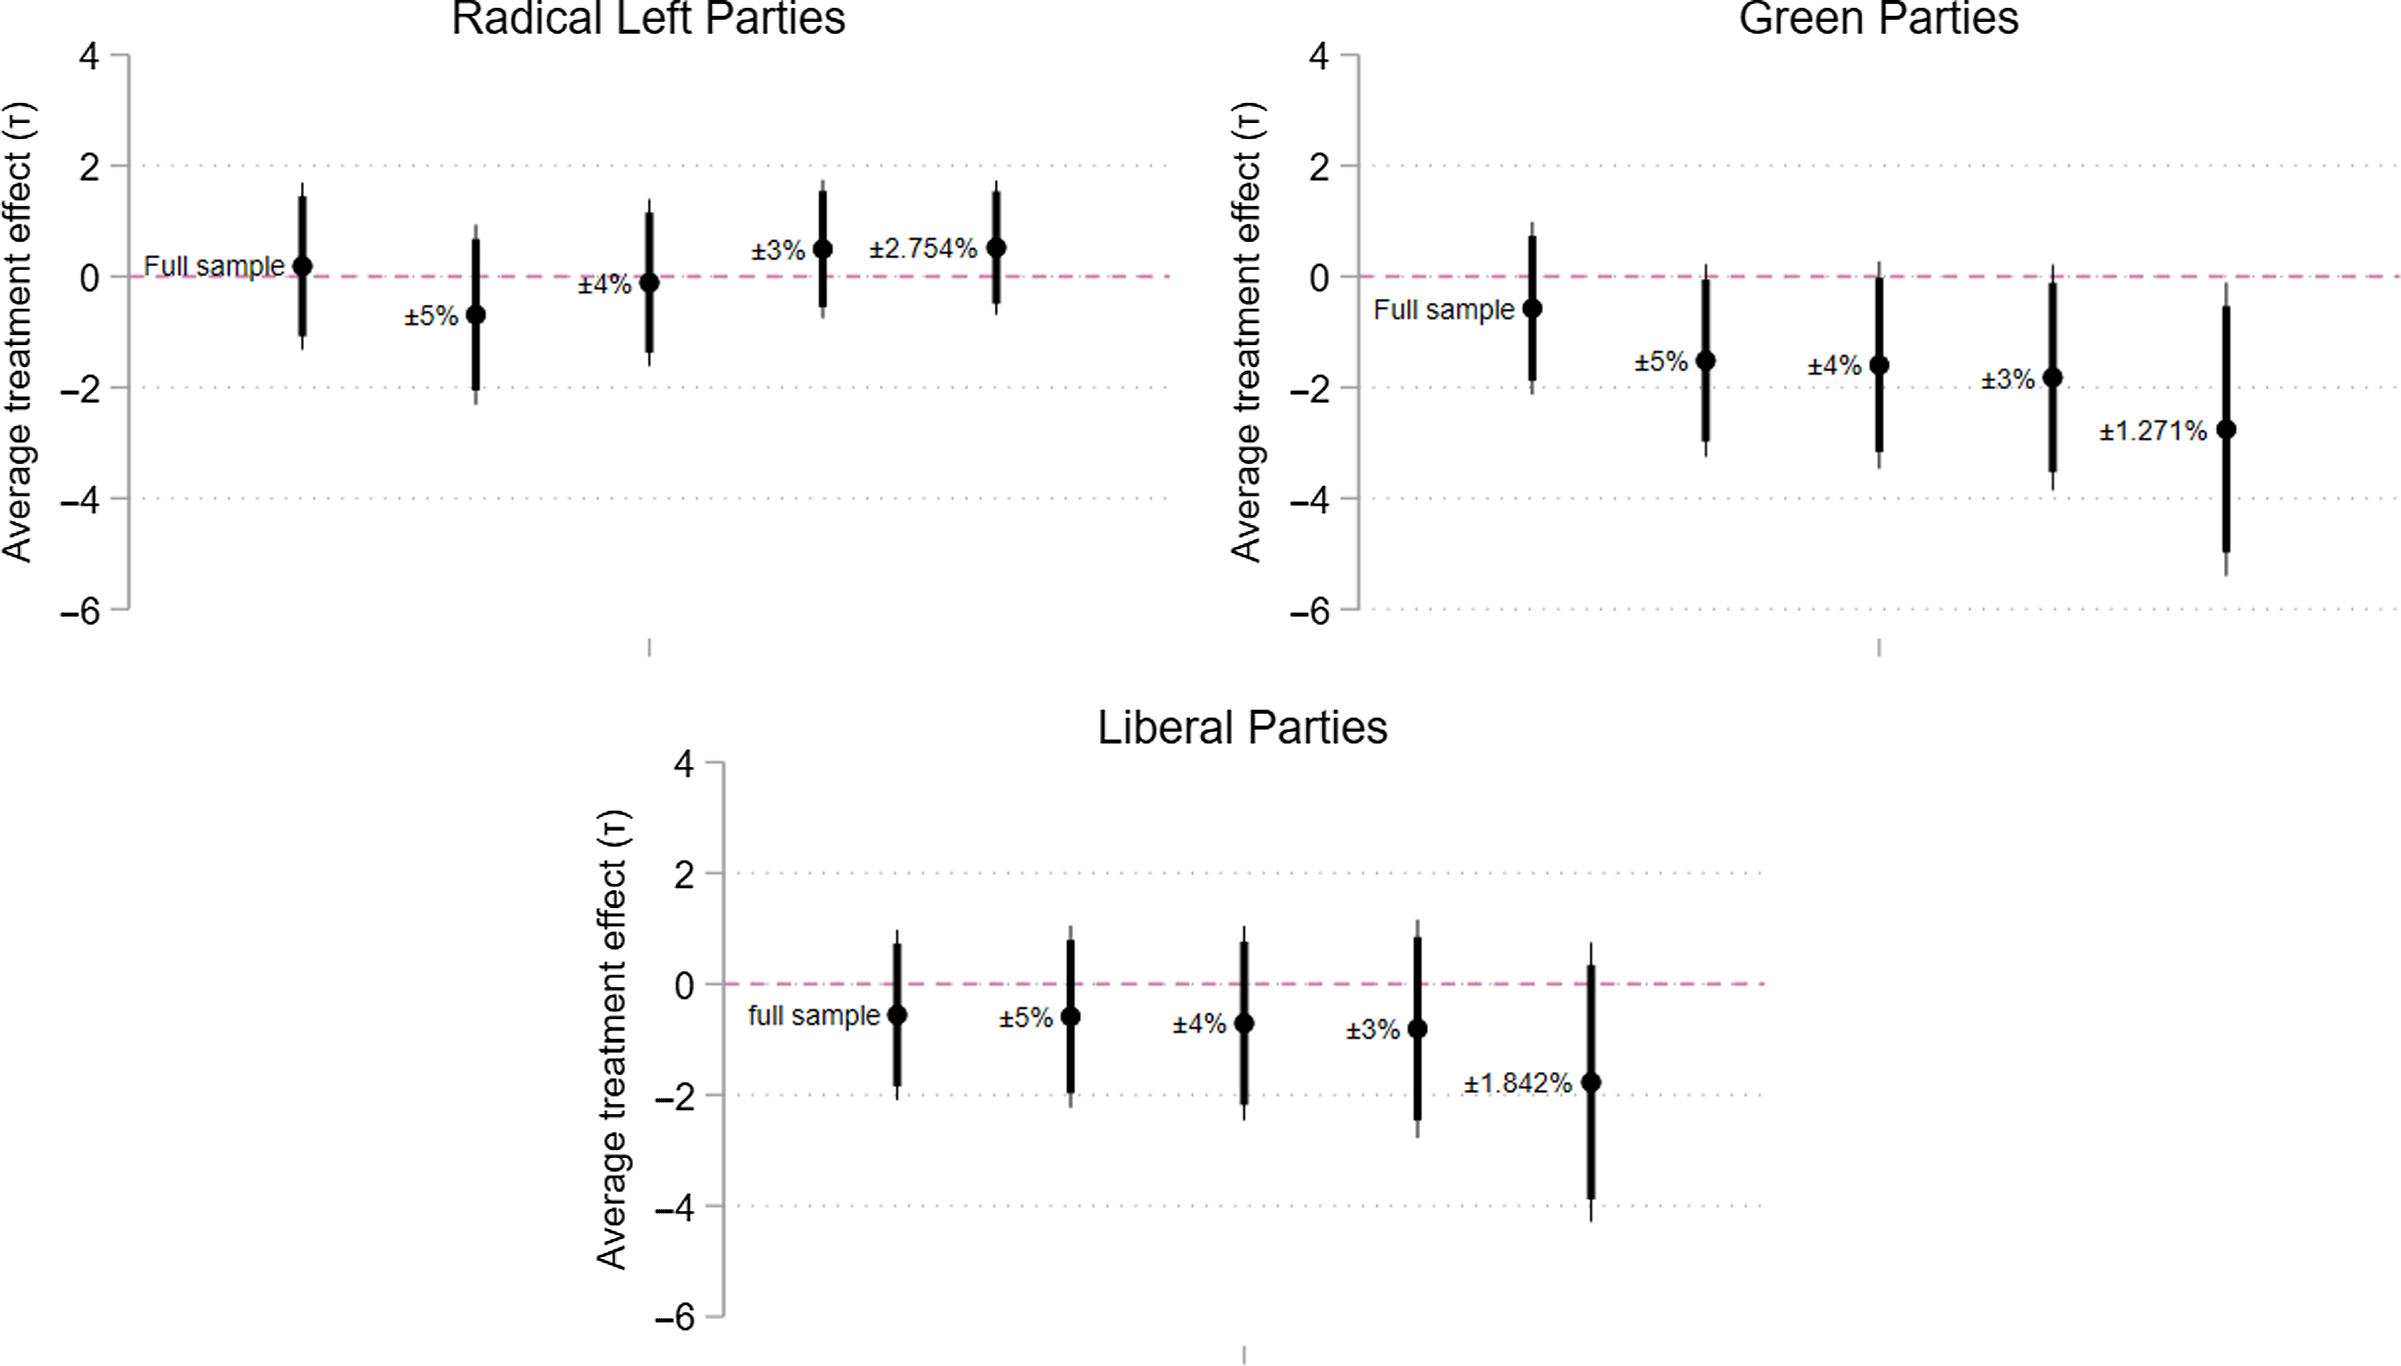
At this point, one may wonder whether the bottom-up spillover effect applies to other party families. To explore this possibility, I also collected the vote share data of three party families, namely: (1) the radical left; (2) the liberal; and (3) the green (see Table B.13 for parties that are included in these families). The timeframe and the data structure are the same as that of RRPs. I repeat the RD estimation for the three party families separately.
Figure 3 illustrates the effects at different bandwidths for these party families (See Table B.14–B.16 for regression results). For radical left parties and liberal parties, ${\rm{\tau }}$
is statistically indistinguishable from zero. Yet, readers should note that the sample size for radical left parties is particularly small. On the other hand, the effect for green parties is inconsistent. The effect is indistinguishable from zero in the full sample. Yet, it becomes marginally significant at 0.1 level when the bandwidths narrow down, and its bottom-up spillover effect is negative. In substantive terms, if a green party crosses a regional electoral threshold, it experiences a decrease in vote share in a subsequent federal election by around 1.5 pp−2.8 pp on average. This finding, unlike that of RRPs, is more in line with the conventional SOE framework.
${\rm{\tau }}$
is statistically indistinguishable from zero. Yet, readers should note that the sample size for radical left parties is particularly small. On the other hand, the effect for green parties is inconsistent. The effect is indistinguishable from zero in the full sample. Yet, it becomes marginally significant at 0.1 level when the bandwidths narrow down, and its bottom-up spillover effect is negative. In substantive terms, if a green party crosses a regional electoral threshold, it experiences a decrease in vote share in a subsequent federal election by around 1.5 pp−2.8 pp on average. This finding, unlike that of RRPs, is more in line with the conventional SOE framework.
Regression discontinuity estimates of the bottom-up spillover effect for radical left parties, green parties and liberal parties (Conventional Estimate). Note: Thick and thin error bars represent 90% and 95% confidence intervals.
Overall, these RD estimations demonstrate that the bottom-up spillover effect can be heterogeneous across different party families. Here, I provide several complementary reasons that explain this heterogeneity. First, as said, the lifetime of radical left parties in Germany is short, and the insufficient number of observations can lead to a false negative. Second, the political context of this case matters. A recent study finds that German green parties’ breakthrough in regional parliaments could generate a backlash from mainstream conservative voters (Arend et al., Reference Arend, Ellger and Valentim2021), which echoes the negative effect in my case. Also, given that RRPs have been stigmatized in the German political context, its bottom-up spillover effect should be the strongest among all party families, which can overcome the backlash from leftwing voters. Third, the organizational approach of these party families differs, which in turn affects whether they benefit from the bottom-up spillover effect. Research on party studies suggests radical left and green parties are more grassroots-oriented (March and Mudde, Reference March and Mudde2005), whereas RRPs are more leader-centered (de Lange and Art, Reference de Lange and Art2011). Because the former two party families are more reliant on party building, the information revealed by regional parliamentary breakthrough is less of an important signal compared to RRPs.
Alas, this paper cannot fully ascertain the reason behind the heterogeneity of bottom-up spillover effects. Nevertheless, its findings suggest there is a need to consider party families when studying the bottom-up spillover effect. Future research can investigate whether this heterogeneity applies in other cases and the reasons behind it.
Individual-level mechanism
I now turn to the question of which micro-level mechanism mainly drives this effect for RRPs. Since the models involve lots of interaction terms and this paper concerns RRP voters, I plot the marginal effects of AfD voters in the 2017 federal election in treated units and those in control units over waves.Footnote 3 Alongside these marginal plots, I show the coefficient plots to facilitate interpretation. Regarding the marginal effects of non-AfD voters, they are reported only when there is a significant change between the treated units and control units (See Table C.1 for full regression results).
To recap, the viability mechanism suggests that AfD voters update AfD’s viability once the party crossed the regional electoral threshold. As such, AfD voters in treated states would perceive AfD as more likely to enter federal parliament than those in control states. However, Figure 4 shows this is not the case: although the perceived probability of AfD entering federal parliament increases in subsequent waves for both AfD voters in treated states and those in control states, the difference in probability between the two units is indistinguishable. Contrarily, I find that non-AfD voters in treated states perceive AfD as more likely to break into federal parliament than those in control states (see Figure C.1). In short, non-AfD voters incorporate the information about AfD’s entry into regional parliament and update its viability, but this information-updating process does not occur among AfD voters.
Viability mechanism. Note: Upper-left panel shows the perceived probability of AfD entering federal parliament among AfD voters in treated states and those in control states; Lower-left panel shows the probability of choosing AfD as the first preference among AfD voters in treated states and those in control states; 95% confidence intervals are shown; the gray bar represents the period when AfD had broken into regional parliaments in treated states. Right panels plot the coefficients of the parameters; thick and thin error bars represent 90% and 95% confidence intervals.
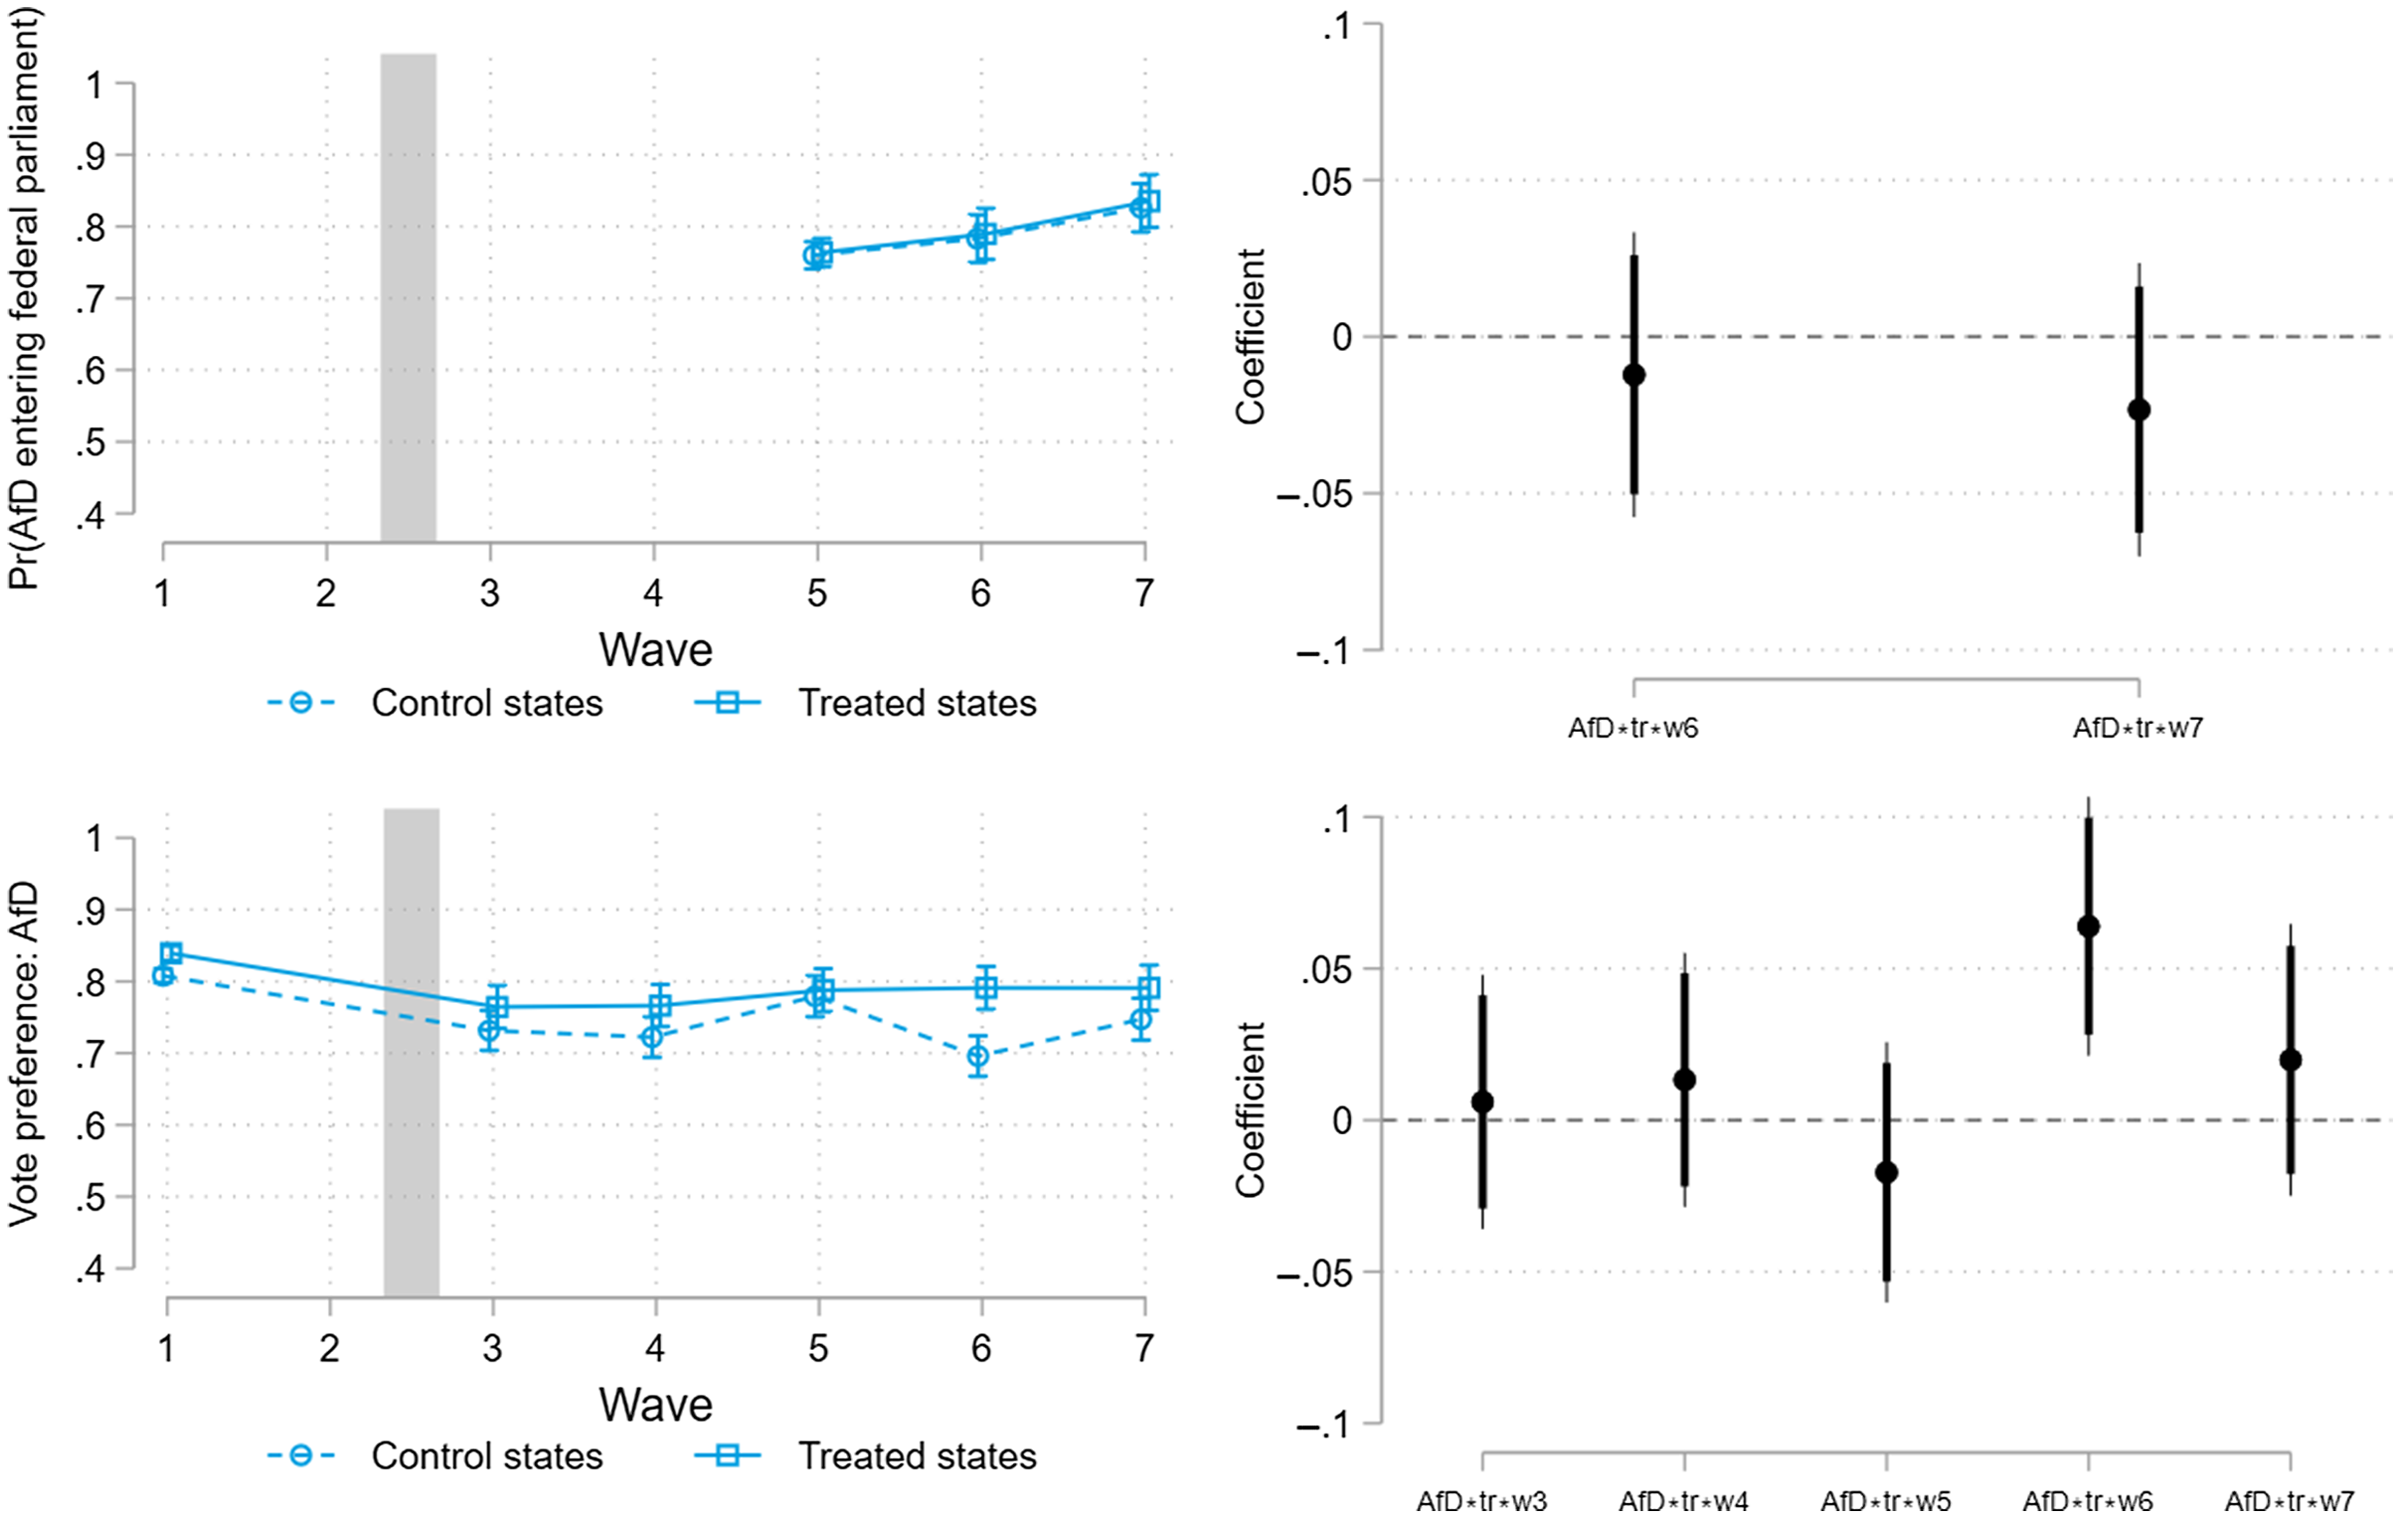
Also, the viability mechanism expects that, after it had entered regional parliament, RRP voters in the upcoming FOE are more likely to choose the party as their first preference in their party-list vote due to an increase in perceived viability. Thus, AfD voters in treated states should be more likely to choose AfD than those in control states. Yet, the result cannot provide solid support for this expectation, since AfD’s entry into regional parliaments does not have a stable positive effect on the probability of choosing AfD as first preference. Specifically, AfD voters in treated states are more likely to choose AfD as their first preference than those in control states in wave 6 only (P < 0.01). Taken together, the viability mechanism is unlikely to be the main mechanism.
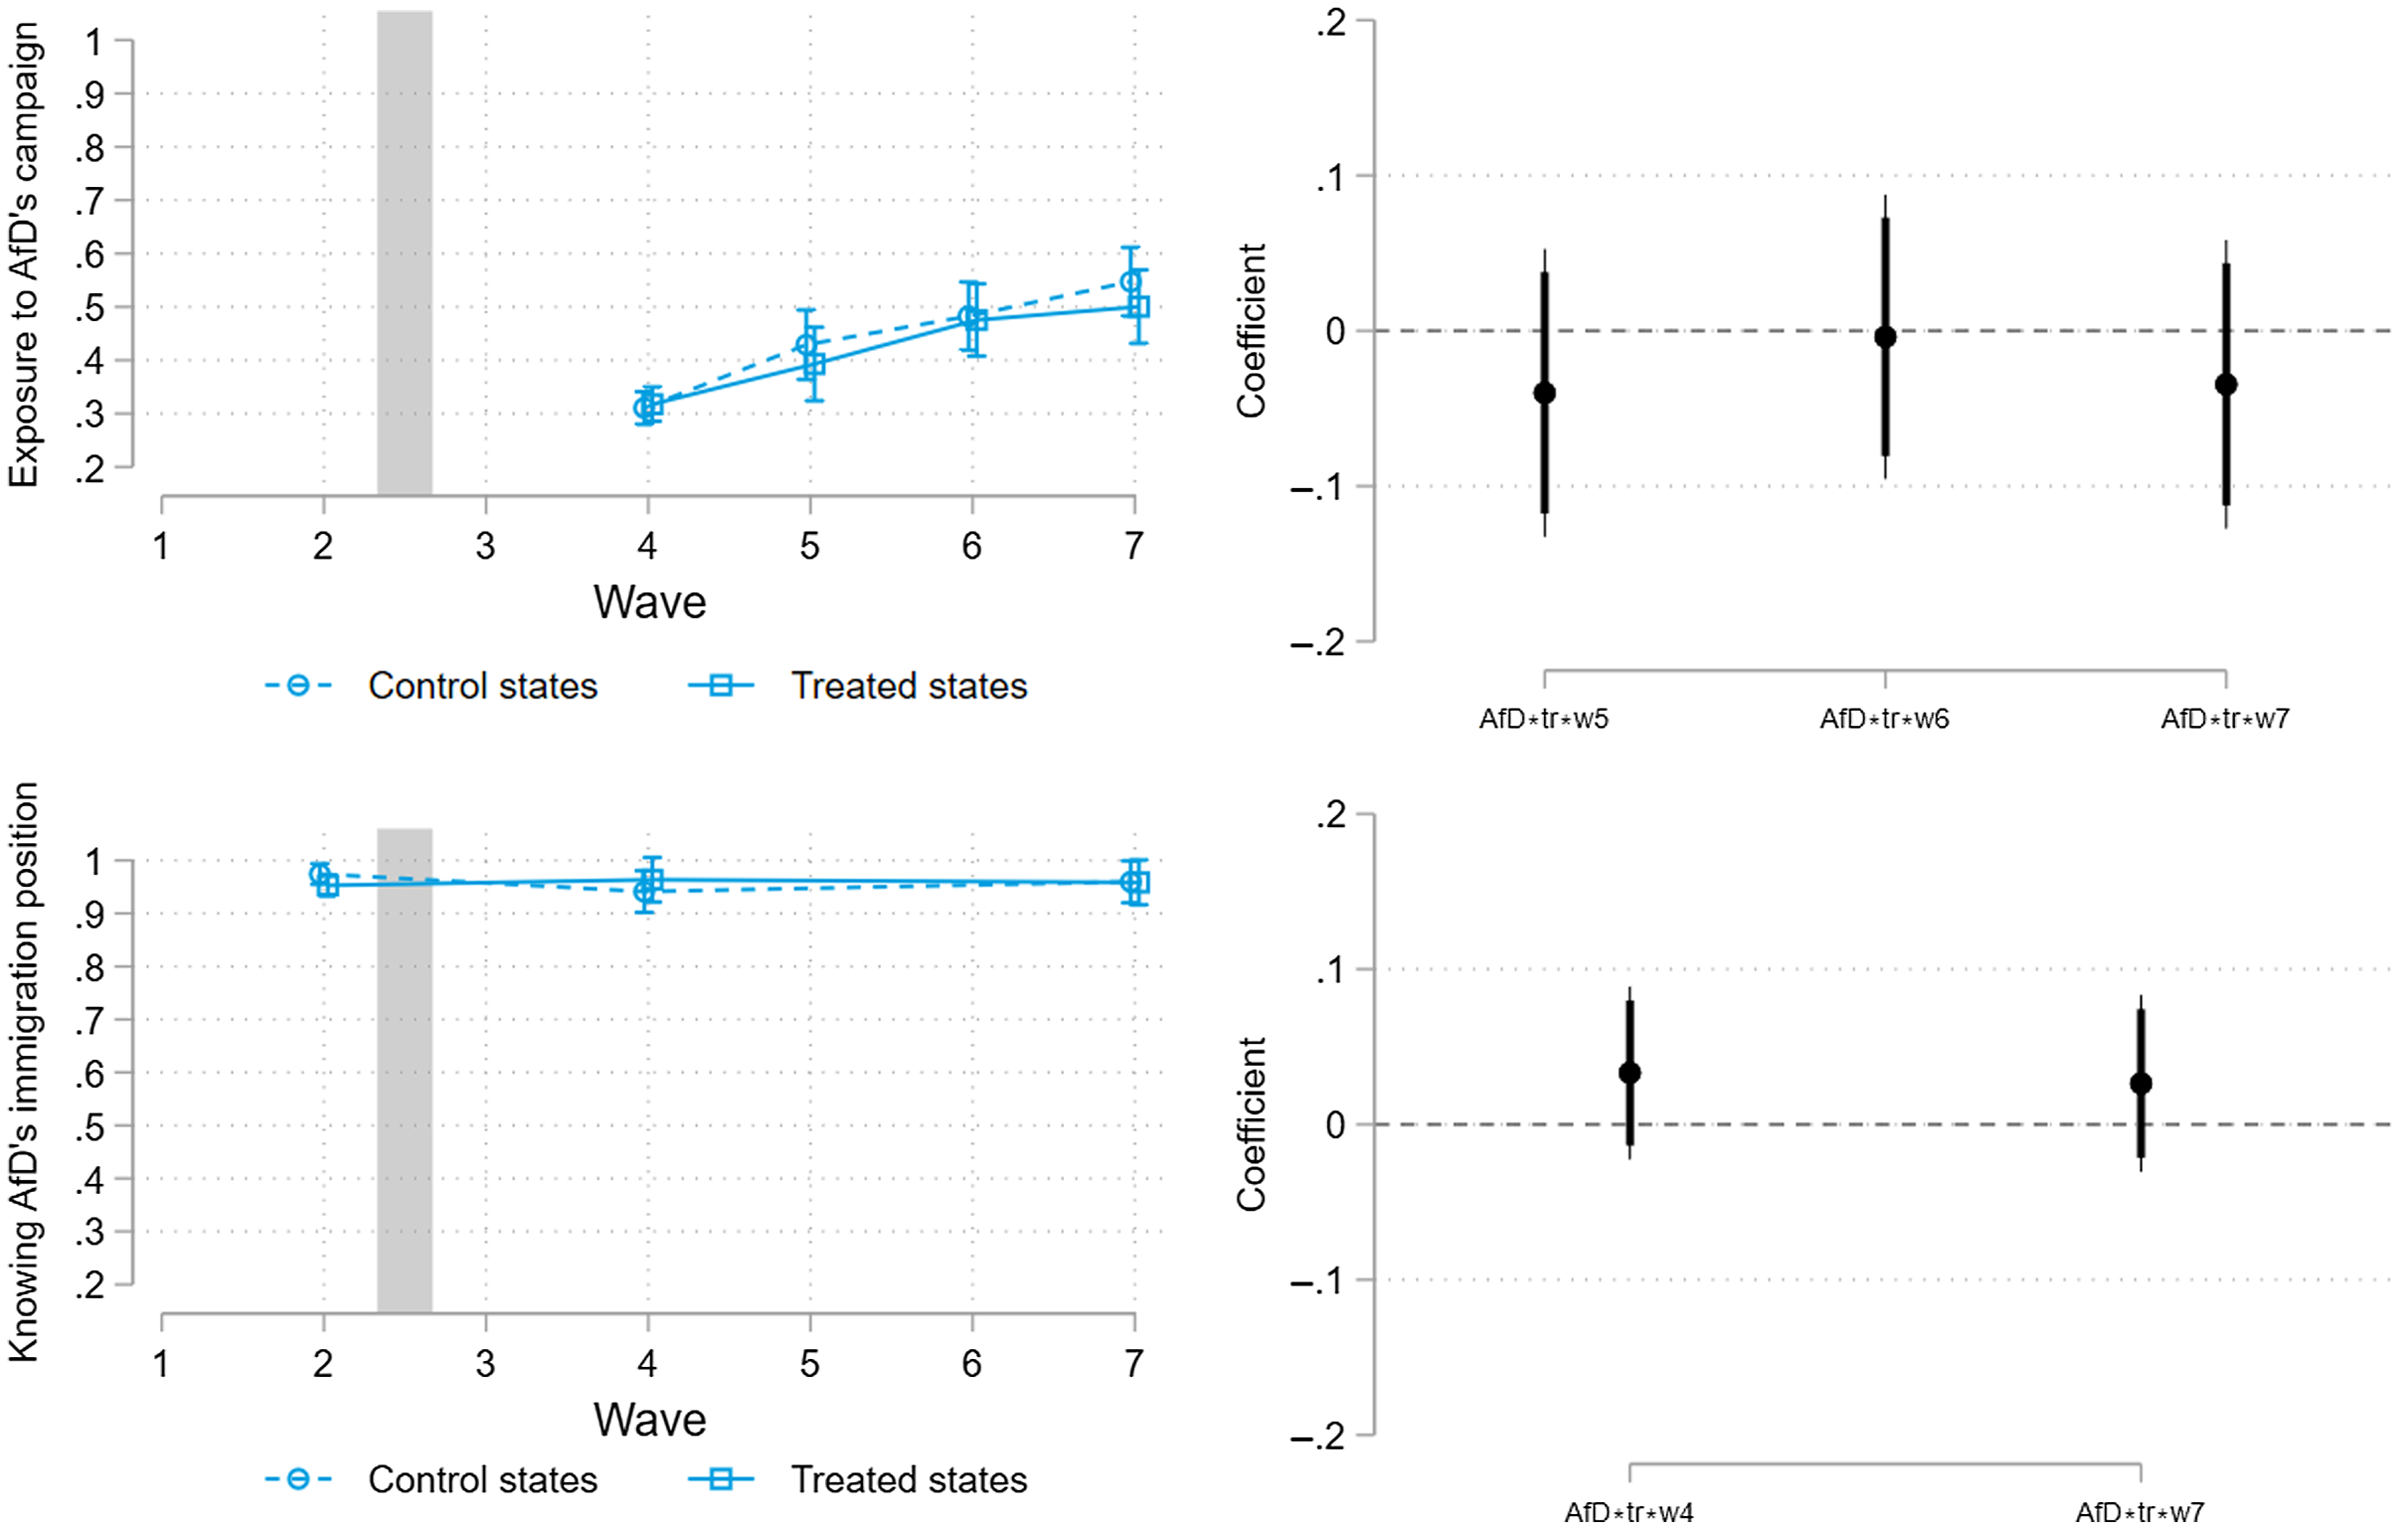
Moving on to the exposure mechanism, we look at Figure 5 that shows the outcome concerning exposure to AfD’s campaign and knowledge of AfD’s immigration position. One can notice that AfD voters in treated units and those in control units are more likely to receive AfD’s campaign information over time, which can be attributed to the campaign effect of the federal election. However, AfD voters in treated states are not significantly more likely to receive the party’s campaign information than those in control states. Also, regarding the knowledge of AfD’s immigration position, AfD voters in treated states are not more likely to know this position than those in control states. Overall, these findings cannot support the exposure mechanism because AfD voters in the two units are similar in terms of campaign information reception and knowledge of AfD’s immigration position.
Exposure mechanism. Note: Upper-left panel shows the level of exposure to AfD’s campaign among AfD voters in treated states and those in control states; Lower-left panel shows the knowledge of AfD’s immigration position among AfD voters in treated states and those in control states; 95% confidence intervals are shown; the gray bar represents the period when AfD had broken into regional parliaments in treated states. Right panels plot the coefficients of the parameters; thick and thin error bars represent 90% and 95% confidence intervals.
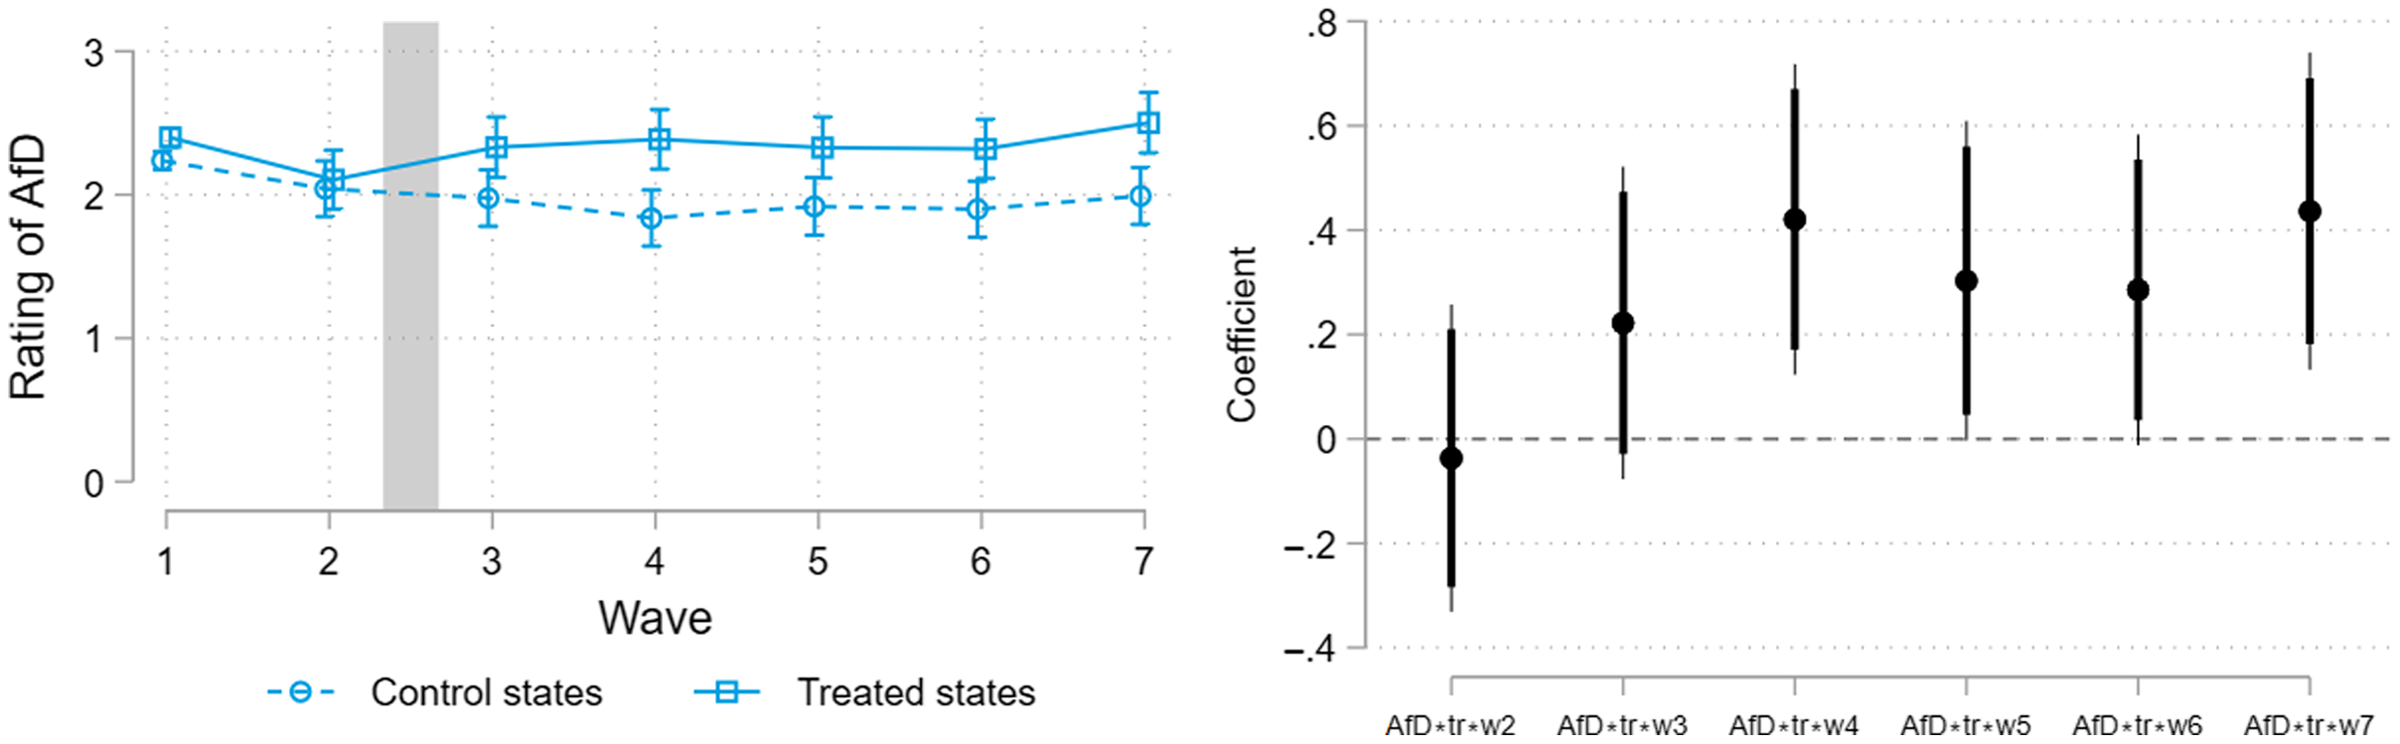
Lastly, the results of the legitimation mechanism are shown in Figure 6. Before the party broke into regional parliaments in treated states, AfD voters in treated states and control states shared a similar rating of AfD. However, from wave 4 onwards, the rating of AfD increases significantly in treated units, but not among control units. In the post-treatment waves, the differences in rating between the two units range from 0.35 to 0.55 within an 11-point scale. In sum, the results supports the legitimation mechanism, which suggests AfD voters evaluate the party more positively after it crossed the regional electoral threshold.
Legitimation mechanism. Note: The left panel shows the rating of AfD among AfD voters in treated states and those in the control state; 95% confidence intervals are shown; the gray bar represents the period when AfD had broken into regional parliaments in treated states. Right panel plots the coefficient of the parameters; thick and thin error bars represent 90% and 95% confidence intervals.
Appendix C presents several robustness checks for the legitimation mechanism. First, one can suspect that the improved rating of AfD in treated states is not driven by AfD’s regional parliament breakthrough. Rather, it can be due to: (i) regional campaign effects; or (ii) bandwagon effects as AfD experienced vote gain, which could induce a sense of winning (Stiers et al., Reference Stiers, Daoust and Blais2018). To eliminate these possibilities, I substitute the dependent variable with the rating of all other five parties (i.e., CDU, SPD, FDP, Green, and Left Party) and replace the dummy variable $Af{D_i}$
with a dummy of these five parties, one at a time (See Figure C.2 and Figure C.3). In total, five models are generated. Out of these five models, only one model shows that the rating in the treated unit significantly differs from that in the control unit (when
$Af{D_i}$
with a dummy of these five parties, one at a time (See Figure C.2 and Figure C.3). In total, five models are generated. Out of these five models, only one model shows that the rating in the treated unit significantly differs from that in the control unit (when $D{V_{it}}$
is rating of FDP). The null findings of CDU and Left Party are especially important because both parties, like AfD, had a vote gain in both treated states as well. Taken together, the improved rating of AfD in treated states cannot be attributed to regional campaign effects or bandwagon effects.
$D{V_{it}}$
is rating of FDP). The null findings of CDU and Left Party are especially important because both parties, like AfD, had a vote gain in both treated states as well. Taken together, the improved rating of AfD in treated states cannot be attributed to regional campaign effects or bandwagon effects.
Next, some may challenge that, after AfD had broken into regional parliaments in those treated states, voters in control states could also incorporate this information as well, thus leading to the contamination of control units. To check whether contamination is serious, I replace those respondents in control units with respondents who live in the ‘already treated states’. Here, the dummy $t{r_i}$
is now coded as 1 if the respondent lives in an already treated state and 0 if he/she lives in a treated state. If there is contamination of units, there should still be a gap in the rating of AfD between AfD voters in treated states and those in the “already treated states” after wave 2. However, no coefficient is positive and statistically significant; so, the contamination of units should not be a critical concern (see Figure C.4 and Table C.2).
$t{r_i}$
is now coded as 1 if the respondent lives in an already treated state and 0 if he/she lives in a treated state. If there is contamination of units, there should still be a gap in the rating of AfD between AfD voters in treated states and those in the “already treated states” after wave 2. However, no coefficient is positive and statistically significant; so, the contamination of units should not be a critical concern (see Figure C.4 and Table C.2).
Conclusion
By bringing together the literature of information updating in concatenated elections and that of SOE, this paper analyzes whether and how an RRP’s regional electoral result affects its vote share and voters’ calculus of voting in a subsequent FOE. It argues that an RRP’s electoral result in an SOE can reveal the distribution of voters’ preferences, which enters voters’ calculus of voting and foster an RRP’s performance in the upcoming FOE. Through the case of Germany, I first find that there is a bottom-up spillover effect for RRPs at the aggregate level: if an RRP crosses the regional electoral hurdle, its vote share in a subsequent FOE increases substantially. Yet, similar positive bottom-up spillover effects cannot be found in other party families.
Next, to analyze the micro-level information-updating process for RRP voters, I use a panel dataset to ascertain which mechanism mainly drives this effect. My analysis could not find solid evidence for the viability mechanism. The reason for this is that the perceived likelihood of entering the national parliament is similar between AfD voters in treated states and those in control states; the same applies to the probability of choosing the AfD as the first preference in the party-list vote. The findings likewise do not support the exposure mechanism, because AfD voters in treated states and those in control states have similar levels of campaign information and knowledge of AfD’s immigration position. What the analysis suggests is that the legitimation mechanism is the dominant mechanism—AfD voters in treated states saw the party in a more positive light after it had entered regional parliaments.
Nevertheless, some limitations can only be addressed by future studies. First, the data that traces the evolvement of AfD voters’ political attitudes and perceptions is an online panel. This sample may not be fully representative of the German electorate and the respondents who stay in the panel usually have higher political interest than average. Hence, these respondents are more likely to follow political news and receive campaign information. This non-random online sample may partially explain the null findings for the viability mechanism and the exposure mechanism. Also, the panel did not measure some parameters of interest before the treatment. As such, part of the analysis relies on the assumption that an effect exists if the difference between treated units and control units changes over waves. Lastly, although this paper addresses the issue of contamination, I cannot completely rule out this possibility. So, theoretically speaking, the viability mechanism and the exposure mechanism can exist alongside the legitimation mechanism. Nevertheless, this paper still demonstrates that the legitimation mechanism is the dominant mechanism that drives the effect for RRPs since the issue of contamination should merely attenuate the effect.
The findings of this paper can contribute to the field by, first, speaking to the rich literature that explains RRP success. There have been studies of RRPs that adopt a demand-side or supply-side approach to study RRP’s success in regional arenas (Kestilä and Söderlund, Reference Kestilä and Söderlund2007; Patana, Reference Patana2020). Yet, they did not extend this to study how these RRP’s regional successes interact with the national arena. Thus, this paper is the first to analyze how an RRP’s regional success helps it to break into the national parliament. Although this paper only uses the case of RRPs in Germany to study the bottom-up spillover effect and its mechanisms, the findings surely suggest that future works on RRPs should pay more attention to how SOEs and FOEs interact in a multi-level system. For instance, Vox’s regional success is another example of the bottom-up spillover effect that could be tested. Also, it is worthwhile to study those cases in which a bottom-up spillover effect fails to materialize. In that regard, the National Front under the leadership of Jean-Marie Le Pen can be an important example. Finally, some RRPs did not rely on the bottom-up spillover effect but could still break into national parliaments. Examples include Chega in Portugal and Party for Freedom in the Netherlands. In short, the political contexts in which bottom-up spillover effects manifest in various ways is an important topic for future studies.
In addition, the results of this paper enrich our understanding of the SOE framework. The conventional SOE framework suggests that ideologically extreme parties lose votes in a FOE (Schmitt et al., Reference Schmitt, Sanz, Braun and Teperoglou2020). However, this paper finds that, once we consider how the electoral result of previous SOEs impacts subsequent FOEs, this need not be the case. As a starting point, this paper uses RRPs in Germany as a most likely case to test for bottom-up spillover effects. Nevertheless, it should open avenues for different lines of research for the SOE framework. First, in the aggregate-level analysis, I find that the bottom-up spillover effects cannot be generalizable to other party families. Still, more cases are needed to understand how bottom-up spillover effects unfold for different party families in other political contexts. Second, the bottom-up spillover effects of this paper mainly focus on voters’ perspectives. Yet, from the literature on party positioning, we know that other parties shift their positions in response to RRPs’ national successes (Abou-Chadi and Krause, Reference Abou-Chadi and Krause2020). As such, whether and how bottom-up spillover effects work out in party positioning within a multi-level system is an open question. Finally, the spillover effect analyzed in this paper only concerns regional elections—a subset of SOEs. Hence, future research can investigate the spillover effects of local elections or referenda in a multi-level system.
Supplementary material
To view supplementary material for this article, please visit https://doi.org/10.1017/S1755773922000133.
Acknowledgements
I thank André Blais, Endre Borbáth, Mirjam Dageförde, Ruth Dassonneville, Jean-François Daoust, Klaus H. Goetz, Daniel Saldivia Gonzatti, Edgar Grande, Roman Hlatky, Sophia Hunger, Swen Hutter, Mert Moral, Oliver Pamp, Jerome Schäfer, Paul W. Thurner, Stuart Turnbull-Dugarte, and Vicente Valentim for their valuable comments. An earlier version of this article was presented at the workshop of PSA German politics specialist group, MPSA Conference 2021, the Canada Research Chair in Electoral Democracy at UdeM, and WZB.


 Open access