


1. Introduction
Sedimentary successions in pericratonic rift basins preserve the evolutionary history of adjacent cratons and orogenic belts (Dickinson & Suczek, Reference Dickinson and Suczek1979; Dickinson, 1988). Provenance interpretations of these sedimentary successions contribute to the understanding of tectonic setting, climate, extent of weathering and drainage patterns during the time of deposition (Nesbitt & Young, Reference Nesbitt and Young1982; Algeo & Maynard, Reference Algeo and Maynard2004; Tribovillard et al. Reference Tribovillard, Algeo, Lyons and Riboulleau2006; Hofer et al. Reference Hofer, Wagreich and Neuhuber2013; Verma & Armstrong-Altrin, Reference Verma and Armstrong-Altrin2016; Armstrong-Altrin et al. Reference Armstrong-Altrin, Botello, Villanueva and Soto2019). However, temporal provenance shifts often remain untraceable because of their effects being masked by simultaneous sediment supply from multiple sources. This can be resolved only when mineralogical and geochemical variations in a sedimentary formation are correlated not only to probable sources but also to time. Due to their limited mobility during weathering and transportation, many trace elements, including rare earth elements (REEs), present in the clastic sedimentary rocks are useful in tracking dispersal of sediments (McLennan et al. Reference McLennan, Taylor and Eriksson1983; Bhatia & Crook, Reference Bhatia and Crook1986; Armstrong-Altrin & Verma, Reference Armstrong-Altrin and Verma2005; Armstrong-Altrin et al. Reference Armstrong-Altrin, Nagarajan, Madhavaraju, Rosalez-Hoz, Lee, Balaram, Cruz-Martínez and Avila-Ramírez2013, Reference Armstrong-Altrin, Ramos-Vázquez, Zavala-León and Montiel-García2018; George & Ray, Reference George and Ray2017; Ramos-Vázquez & Armstrong-Altrin, Reference Ramos-Vázquez and Armstrong-Altrin2019). The concentrations of trace elements and Sr and Nd isotopic composition provide information about the chemical composition and age of mantle derivation (or duration of crustal residence) of the source rocks. The integrated approach of using trace-element content, Nd isotope model ages and Sr isotope ratios is therefore likely to resolve secular shifts in the sedimentary source. The result may further enlighten us about the related plate tectonic setting.
The c. 3000 m thick Mesozoic succession in the Kutch Basin, western India is taken as a test case here. The choice is prompted by the fact that the secular shift in sediment contributing source has already been suggested for this succession based on petrographic modal analysis and major-element composition (Chaudhuri et al. 2020). However, the present approach moves forwards to the compositional make-up of the source rocks of specific time ranges. The main objective of this work is to determine the lithology and age of the source rock of Mesozoic sediments in Kutch. For this purpose, we use geochemical (trace elements) and isotopic (Sr–Nd) fingerprinting.
2. Geological setting
During the Late Jurassic Period, after the break-up of eastern Gondwana from its western counterpart, the earlier-formed Kutch Basin remained attached to the Indian subcontinent. Madagascar remained with western India until 88–90 Ma (Storey et al. Reference Storey, Mahoney, Saunders, Duncan, Kelley and Coffin1995; Torsvik et al. Reference Torsvik, Tucker, Ashwald, Eidea, Rakotosolofod and De Wite1998) while Seychelles split at c. 63 Ma (Collier et al. Reference Collier, Sansom, Ishizuka, Taylor, Minshull and Whitmarsh2008). The Kutch Basin is a proven petroliferous basin at the western continental margin of India formed by the reactivation of primordial faults along the Aravalli–Delhi fold belt during the Gondwanaland break-up (Biswas, Reference Biswas1982, Reference Biswas1987, Reference Biswas2005). During the syn-rift to early post-rift stage, the Kutch Basin accumulated Upper Triassic – Lower Cretaceous mixed siliciclastic and carbonate sediments of thickness c. 3000 m (Biswas, Reference Biswas1982, Reference Biswas1987). The post-rift Cenozoic succession consists of mixed carbonate siliciclastic intervals (Biswas, Reference Biswas1981; Banerjee et al. Reference Banerjee, Chattoraj, Saraswati, Dasgupta and Sarkar2012 a, b; Saraswati et al. Reference Saraswati, Khanolkar and Banerjee2018). The Kutch Basin remained surrounded by Nagar Parkar Igneous Suite to the north, Bhilwara, Aravalli and Delhi Supergroups to the NE, Dharwar Supergroup to the south and Central Indian Tectonic Zone (CITZ) to the east. The Aravalli highlands to the east and the Nagar Parkar Ridge to the north are traditionally considered as source areas of the Mesozoic sediments in the Kutch Basin (Ahmad & Bhat, Reference Ahmad and Bhat2006; Ramakrishnan & Vaidyanadhan, Reference Ramakrishnan and Vaidyanadhan2008; Ahmad et al. Reference Ahmad, Noufal, Masroor and Khan2014; Valdiya, Reference Valdiya2015). The E–W-trending faults result in a series of uplifts exposing the Mesozoic sections in Island Belt Uplift (comprising Patcham, Khadir, Bela and Chorad islands), Wagad Uplift and Kutch Mainland Uplift (Biswas, Reference Biswas1980, Reference Biswas2005) (Fig. 1).
Geological map of Kutch mainland showing extents of Cenozoic and Mesozoic outcrops (after Biswas, Reference Biswas1977, Reference Biswas1981). Mesozoic succession of the Kutch Basin, western India (after Biswas, Reference Biswas1977, Reference Biswas1981).
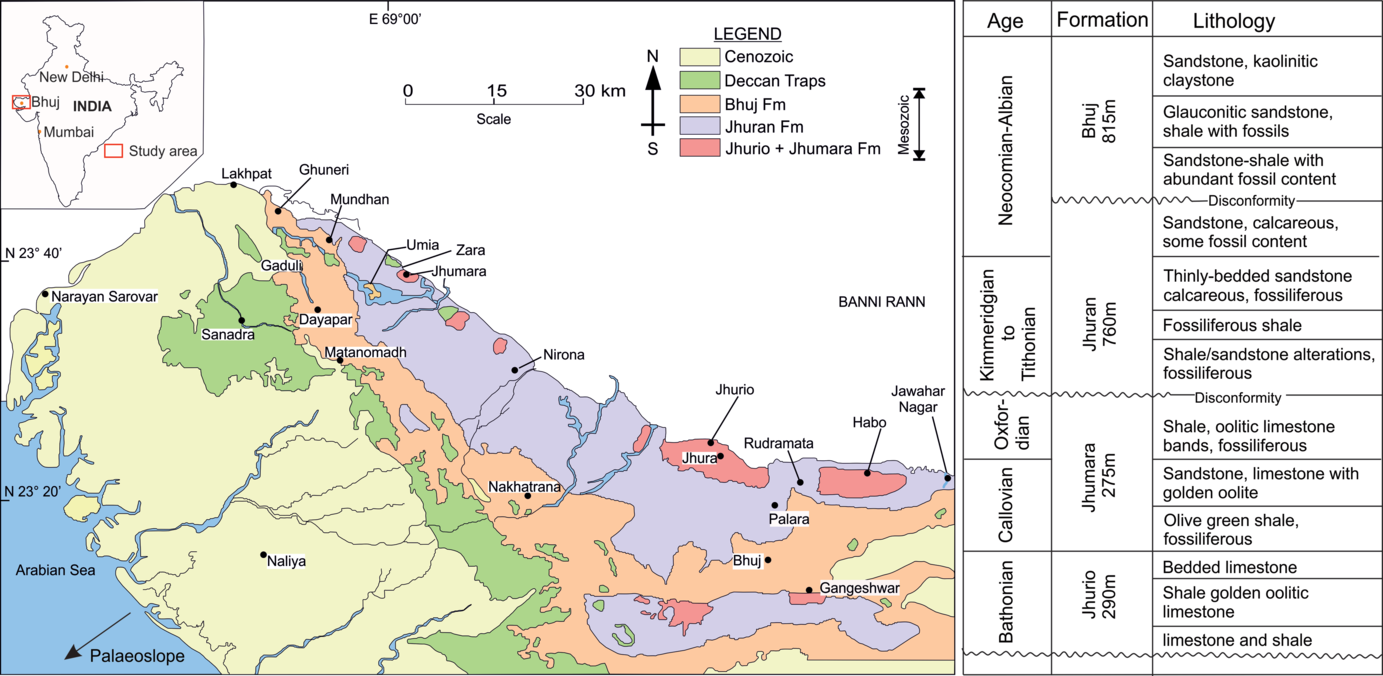
The Mesozoic stratigraphy of the Kutch Mainland Uplift comprises Jhurio, Jhumara, Jhuran and Bhuj formations in ascending order of succession overlying the basement rocks, separated by a basal granite–cobble conglomerate (Biswas & Deshpande, Reference Biswas and Deshpande1968; Biswas, Reference Biswas1987) (Fig. 1). The marine Jhurio Formation (Bathonian–Callovian) rests unconformably on the Precambrian basement and mainly comprises limestone and minor shale. The overlying Jhumara Formation (Oxfordian) consists of argillaceous sediments at the base, and limestone and minor sandstone beds at the top (Biswas, Reference Biswas2005). The shallow-marine Jhuran Formation (Kimmeridgian–Tithonian), unconformably overlying the Jhumara Formation, consists primarily of sandstone–shale alternations and it is divided into three constituent members based on three coarsening-upwards cycles of depositions (Arora et al. Reference Arora, Banerjee and Dutta2015, Reference Arora, Dutta, Gogoi and Banerjee2017). The youngest Bhuj Formation (Valanginian–Albian), consisting exclusively of sandstone and shale, was deposited in fluvio-deltaic conditions (Biswas, Reference Biswas, Tandon, Pant and Casshyap1991). Several workers reported a predominantly southwesterly palaeocurrent pattern for the entire Mesozoic sequence (Biswas, Reference Biswas, Tandon, Pant and Casshyap1991, Reference Biswas1993, Reference Biswas2005; Mandal et al. Reference Mandal, Koner, Sarkar, Tawfik, Chakraborty, Bhakta and Bose2016; Arora et al. Reference Arora, Dutta, Gogoi and Banerjee2017; Desai & Biswas, Reference Desai and Biswas2018).
3. Methods
Samples for the present study were collected from different locations in the Kutch Mainland Uplift, namely Zara, Nirona, Palara, Bhuj, Yaksh, Rukmavati, Gangeshwar and Tapkeshwar. The majority of the collected samples from the oldest Jhurio Formation contain a significantly high amount of calcareous fragments and were therefore not included in the current study. Besides, pore-filling and replacive carbonate cements are abundant within sandstones in Jhumara, Jhuran and Bhuj formations, whereas they are absent from the associated shales in these formations (Chaudhuri et al. Reference Chaudhuri, Banerjee and Le Pera2018). We have therefore mainly selected shale samples from Jhumara, Jhuran and Bhuj formations along with two sandstone samples from the Bhuj Formation because of the negligible amounts of carbonate cementation in them. In total, 15 samples from Jhumara Formation, 53 samples from Jhuran Formation and 17 samples from Bhuj Formation were analysed for the present investigation. The Jhuran Formation is considerably thick and is mapped by previous workers up to the Member level in the Kutch Mainland. A large number of studied samples therefore belong to the Jhuran Formation. For trace-element and REE concentrations, c. 50 mg of each sample powder was used to prepare sample solutions with 5 mL of 1 ng mL–1 103Rh solution added as an internal standard. From this stock solution, 5 mL was diluted to 50 mL using deionized water and analysed at CSIR-NGRI, Hyderabad, using a high-resolution inductively coupled plasma mass spectrometer (HR-ICP-MS) (Nu Instruments Attom, UK). Chinese standard reference material GSR-5 was used to check the accuracy and precision of measurements. Some of the trace-element data (sample series JP, NP and BP) were generated at the Physical Research Laboratory, Ahmedabad, India using a Thermo X-Series Q-ICP-MS. For this, carbonate and organic matter were removed from powdered samples before being dissolved in HF-HNO3. Analyses were carried out in 2% HNO3 sample solutions and BHVO-2 standard (from USGS) was used for calibration as well as for checking the accuracy and precision of measurements. Reproducibility at 2σ level was ≤3% for REEs and ≤6% for all other trace elements (Chatterjee & Ray, Reference Chatterjee and Ray2017, Reference Chatterjee and Ray2018).
For Sr–Nd isotopic ratio analyses at the Physical Research Laboratory, Ahmedabad, India, the samples were dissolved following the standard HF-HNO3-HCl dissolution protocol for silicate rocks (e.g. Awasthi et al. Reference Awasthi, Ray, Laskar, Kumar, Sudhakar, Bhutani, Sheth and Yadava2010). Sr was separated from other REEs by cation exchange column chromatography while Nd was separated from other REEs using Ln-specific resin from Eichrom with dilute HCl (0.18 N) as elutant (Dickin, Reference Dickin2000; Awasthi et al. Reference Awasthi, Ray, Laskar, Kumar, Sudhakar, Bhutani, Sheth and Yadava2010). 87Sr/86Sr and 143Nd/144Nd were measured using a Thermo Neptune multi-collector (MC) ICP-MS (Awasthi et al. Reference Awasthi, Ray, Singh, Band and Rai2014). The measured 87Sr/86Sr and 143Nd/144Nd ratios were corrected for mass fractionation using 86Sr/88Sr of 0.1194 and 146Nd/144Nd of 0.7219. Average measured 143Nd/144Nd for an internal laboratory standard (Merck Nd) was 0.511705 ± 27 (2σ, n = 56). The average 143Nd/144Nd for BHVO-2, measured regularly during our analyses, is 0.512967 ± 0.000008 (n = 10; ±0.2 in εNd units at 2σ). Further details of analytical protocols and data presentation for comparison are provided in Chatterjee & Ray (Reference Chatterjee and Ray2017, Reference Chatterjee and Ray2018).
4. Results
4.a. Trace-element composition
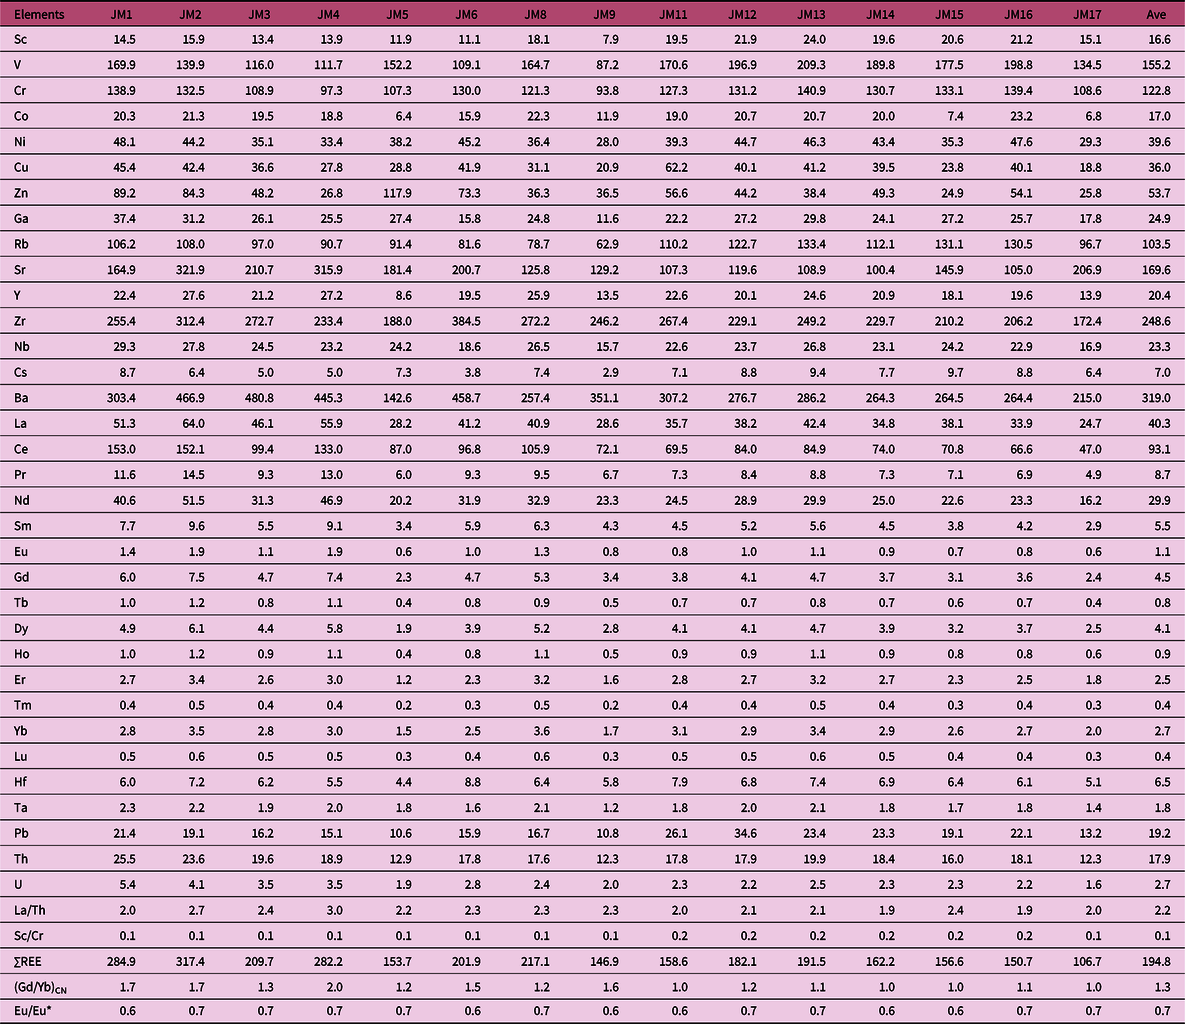
Trace-element concentrations of samples from Jhumara, Jhuran and Bhuj formations are presented in Tables 1–5. Concentrations of most trace elements, especially that of large-ion lithophile elements (LILEs), are higher in these samples compared with the average shale composition (Wedepohl, Reference Wedepohl1971), except for Ni and Sc. The Lower Member of the Jhuran Formation possesses the highest average ∑REE of c. 317 ppm. The Upper Continental Crust (UCC) normalized trace-element concentrations in these samples are either enriched, depleted or UCC-equivalent (Fig. 2). Ba, U, Pb and Sr exhibit prominent depletion with increasing Sr depletion in younger formations. Th shows enrichment for the entire Mesozoic record. However, Nb and Ta show enrichment. The Lower Jhuran sediments show an increase in Zr and Hf, whose magnitude diminishes towards the top of the succession (Fig. 2). The Nb/Ta versus Zr/Hf of all the samples from the basin show two clusters, one group showing higher Nb/Ta and lower Zr/Hf compared with the other (Fig. 3).
Trace-element concentrations of samples from Jhumara Formation. CN – chondrite-normalized
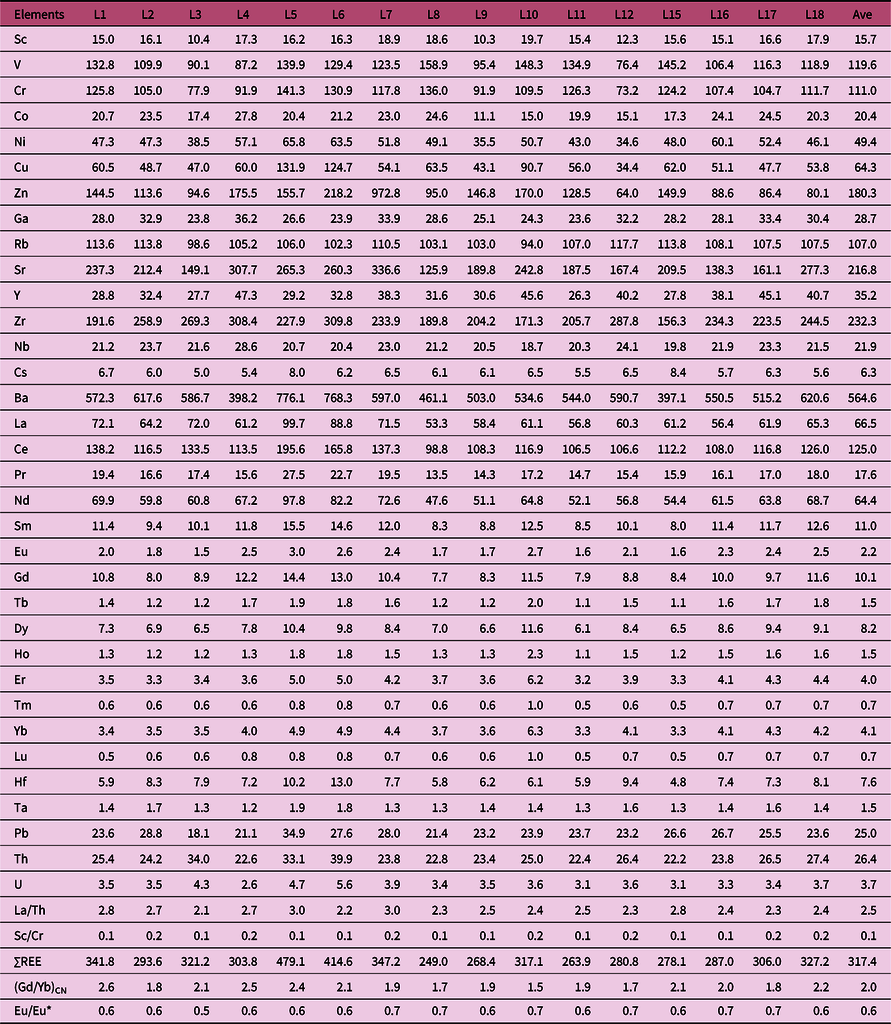
Trace-element concentrations of samples from Lower Member, Jhuran Formation. CN – chondrite-normalized
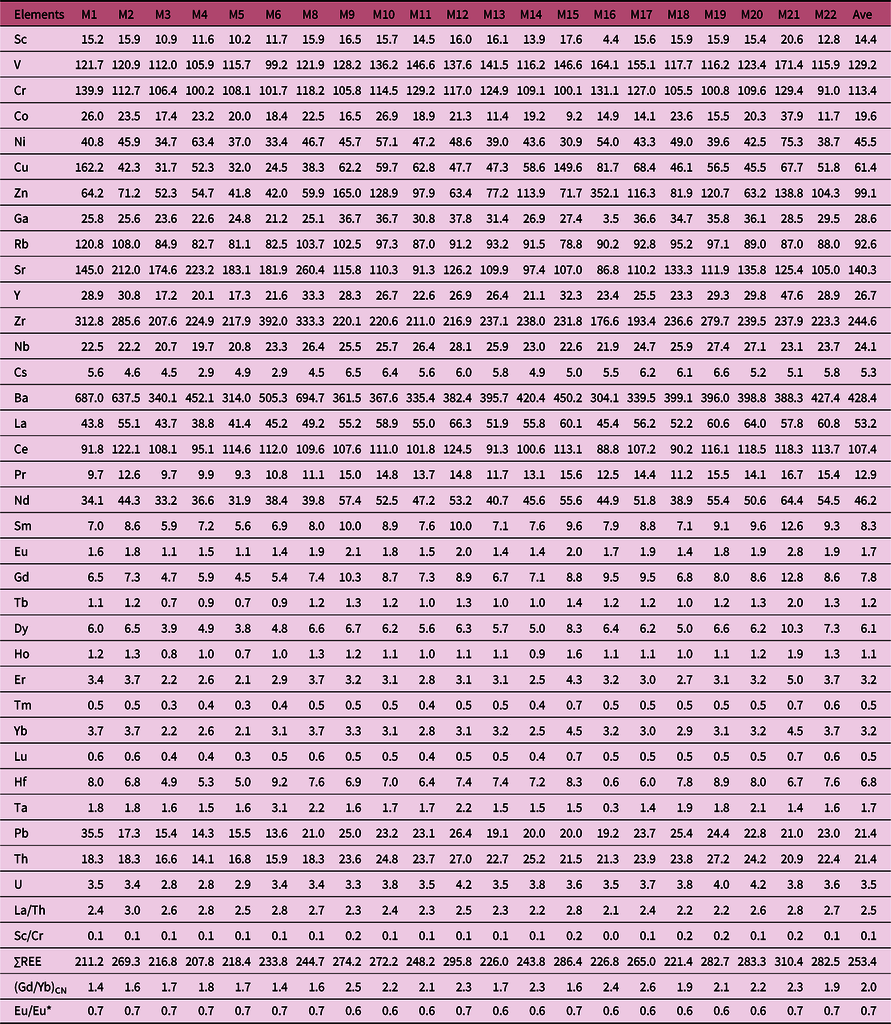
Trace-element concentrations of samples from Middle Member, Jhuran Formation. CN – chondrite-normalized
Trace-element concentrations of samples from Upper Member, Jhuran Formation. CN – chondrite-normalized
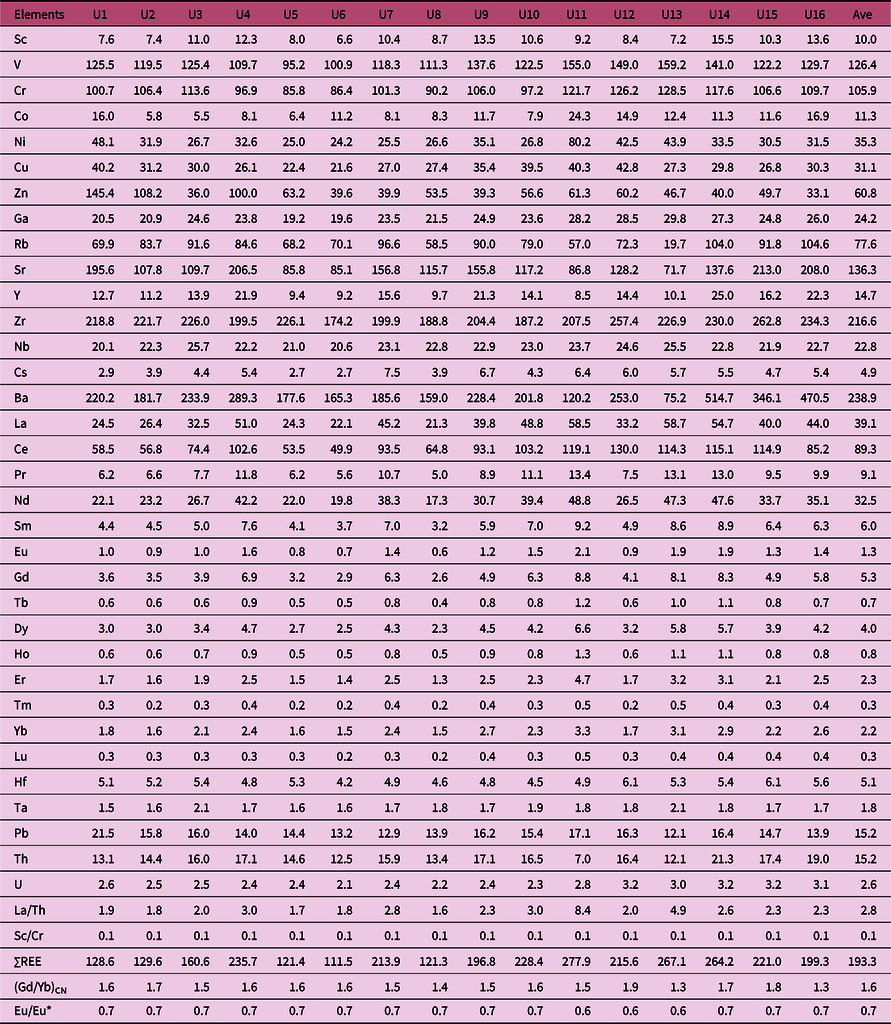
Trace-element concentrations of samples from Bhuj Formation. CN – chondrite-normalized
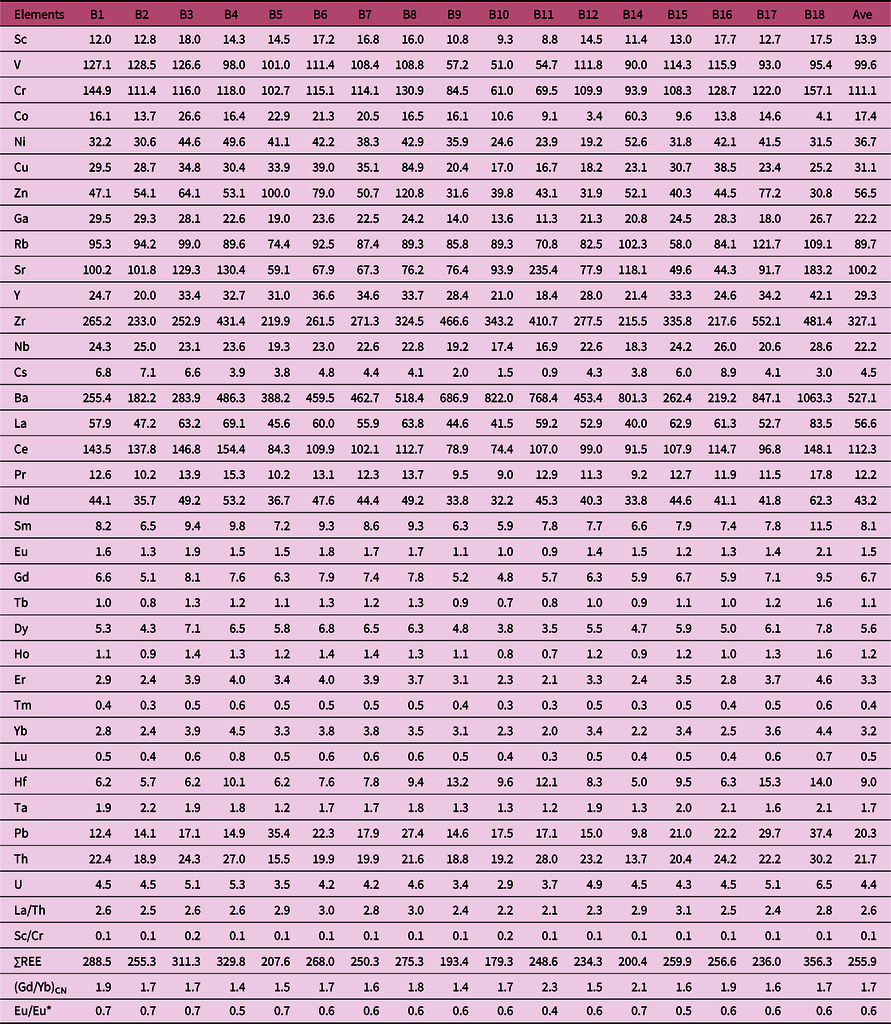
Upper Continental Crust (UCC-) normalized trace-element patterns for samples from various formations, arranged in stratigraphic order, of the Mesozoic Kutch Basin. Normalizing values are from Rudnick & Gao (Reference Rudnick, Gao, Holland and Turekian2003).
Nb/Ta versus Zr/Hf plot for samples from the Mesozoic Kutch Basin.

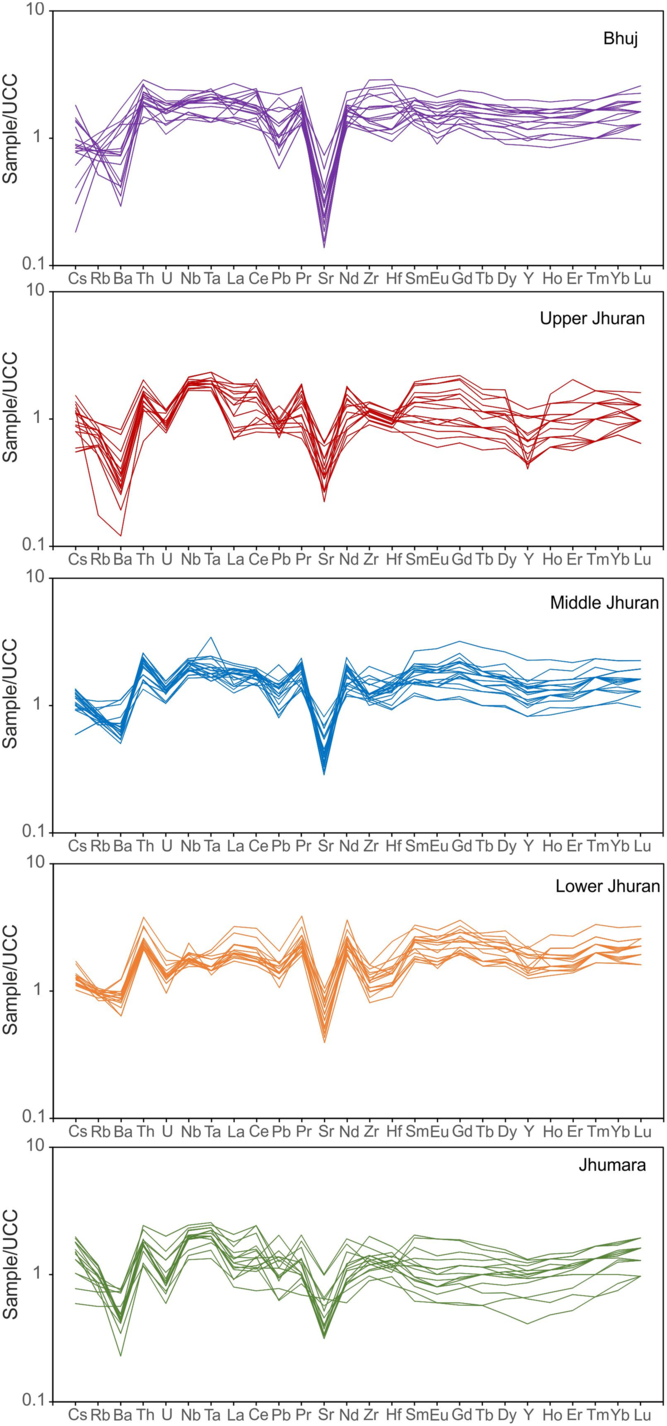
Chondrite-normalized REE patterns of Jhumara, Jhuran and Bhuj samples show broadly similar characteristics, with a prominently LREE-enriched pattern, negative Eu anomaly and positive Gd anomaly (Fig. 4). These patterns broadly overlap with those of UCC and Post-Archean Australian Shale (PAAS). Weak negative Eu anomalies, Eu/Eu* = Eu/(SmCN*NdCN)1/2 (where the subscript ‘CN’ indicates chondrite-normalized) in Jhumara, Jhuran and Bhuj samples have average values of 0.65, 0.65 and 0.61, respectively. The chondrite-normalized REE patterns for shale samples from the Jhuran Formation reveal three distinct bands for its three Lower, Middle and Upper members (Fig. 4). The samples from the Lower Member exhibit consistently high ∑REE contents, whereas those of the Upper Member show distinctly low ∑REE content. Nearly half of the samples from the Jhumara Formation exhibit REE patterns similar to those of the Upper Member of the Jhuran Formation. Samples from all three formations exhibit a low La/Th ratio (1.59–3.01 ppm); those from the Bhuj Formation exhibit the highest average (2.60). In a cross-plot of Th versus Sc, the samples from the Jhuran Formation exhibit the maximum spread of data points (Fig. 5). Most samples from Jhuran and Bhuj formations and nearly half of the samples from the Jhumara Formation bear felsic signature, while a few samples from the Jhuran (belonging to the Upper and Middle members) and Bhuj formations and most samples from the Jhumara Formation plot within the field for intermediate igneous rocks (Fig. 5) (Cullers, Reference Cullers2002).
Composite log of the Jhumara, Jhuran and Bhuj formations (adapted from Biswas, Reference Biswas2005; Fursich et al. 2005; Mandal et al. Reference Mandal, Koner, Sarkar, Tawfik, Chakraborty, Bhakta and Bose2016). Chondrite-normalized REE patterns for Jhumara (lower), Jhuran (middle) and Bhuj (upper) are placed to the right of the log. Solid lines: LM – Lower Member; MM – Middle Member; UM – Upper Member. Dashed lines: MORB – mid-ocean-ridge basalt; NASC – North American Shale Composite; PAAS – Post Archean Australian Shale. Chondrite meteorite values from Boynton (1984). NASC, PAAS and MORB values from Taylor & McLennan (Reference Taylor and McLennan1985).

Source-rock discrimination based on Th versus Sc plot (Cullers, Reference Cullers2002) for shale samples from Jhumara, Jhuran and Bhuj formations. Abbreviations as for Figure 4.

Average Sc/Cr ratios for samples from Jhumara, Jhuran and Bhuj formations are 0.13, 0.12 and 0.13 respectively. In a cross-plot of La/Th versus Hf, most samples plot in the field marked for passive margin sources, but a few samples occupy the field of acidic arc sources (Fig. 6). Samples from the Lower Member of Jhuran Formation and the Bhuj Formation exhibit distinctly higher concentrations of Hf compared with samples from other formations.
Tectonic setting discrimination based on La/Th versus Hf (Floyd & Leveridge, Reference Floyd and Leveridge1987) for shale samples from Jhumara, Jhuran and Bhuj formations. Abbreviations as for Figure 4.

4.b. Isotope composition
Samples from Jhumara, Jhuran and Bhuj formations bear continental crustal signatures. The value of (87Sr/86Sr)t is similar in all three formations; samples from the Bhuj Formation have the highest (87Sr/86Sr)t ranging over 0.73–0.76, followed by Jhuran Formation (0.72–0.75) and Jhumara Formation (0.72–0.73) (Fig. 7). All samples exhibit overlapping but negative εNd(0) and εNd(t) values, suggesting derivation from LREE-enriched mantle. Samples from the Jhumara Formation and Lower and Middle members of the Jhuran Formation exhibit high values of εNd(t), while those from the Upper Member of the Jhuran Formation and the Bhuj Formation demonstrate relatively low εNd(t) values (Fig. 7a). In a cross-plot of εNd(0) versus Th/Sc, samples from Jhumara, Jhuran and Bhuj formation indicate the dominance of felsic components with values similar to those of upper crust (Fig. 8). The fractionation factor f Sm/Nd values vary from −0.37 to −0.49, −0.31 to −0.50 and −0.40 to −0.46 for the Jhumara, Jhuran and Bhuj samples, respectively. Figure 9 shows temporal variations in εNd(0), depleted mantle model age (T DM) and εNd(t) in the succession. The marked decrease of εNd(0) and εNd(t) in samples from the Bhuj Formation is accompanied by an increase in T DM. The T DM age calculated from the measured data range over 1560–2170 Ma, 1430–2220 Ma and 1760–2320 Ma for the Jhumara, Jhuran and Bhuj formations, respectively (Table 6). The average T DM for the analysed samples increases through 1570, 1680 and 1800 Ma from Jhumara through Jhuran and Bhuj formations with T DM mode at 1800 Ma (Fig. 10). In a cross-plot of f Sm/Nd versus εNd(0), Jhumara, Jhuran and Bhuj samples plot within the early Proterozoic upper crustal rocks (> 1.6 Ga) and are in agreement with the values of T DM (Fig. 11).
(a) εNd(t) and (b) T DM versus (87Sr/86Sr)t plot for shale samples from Jhumara, Jhuran and Bhuj formations. Abbreviations as for Figure 4.

Source-rock discrimination based on εNd versus Th/Sc plot (McLennan et al. Reference McLennan, Hemming, McDaniel, Hanson, Johnson and Basu1993) for shale samples from Jhumara, Jhuran and Bhuj Formation. Abbreviations as for Figure 4.

Variations in εNd(0), T DM(Ga) and εNd(t) across Jhumara, Jhuran and Bhuj formations. Abbreviations as for Figure 4.

Sm–Nd isotope data for samples from Jhumara, Jhuran and Bhuj formations
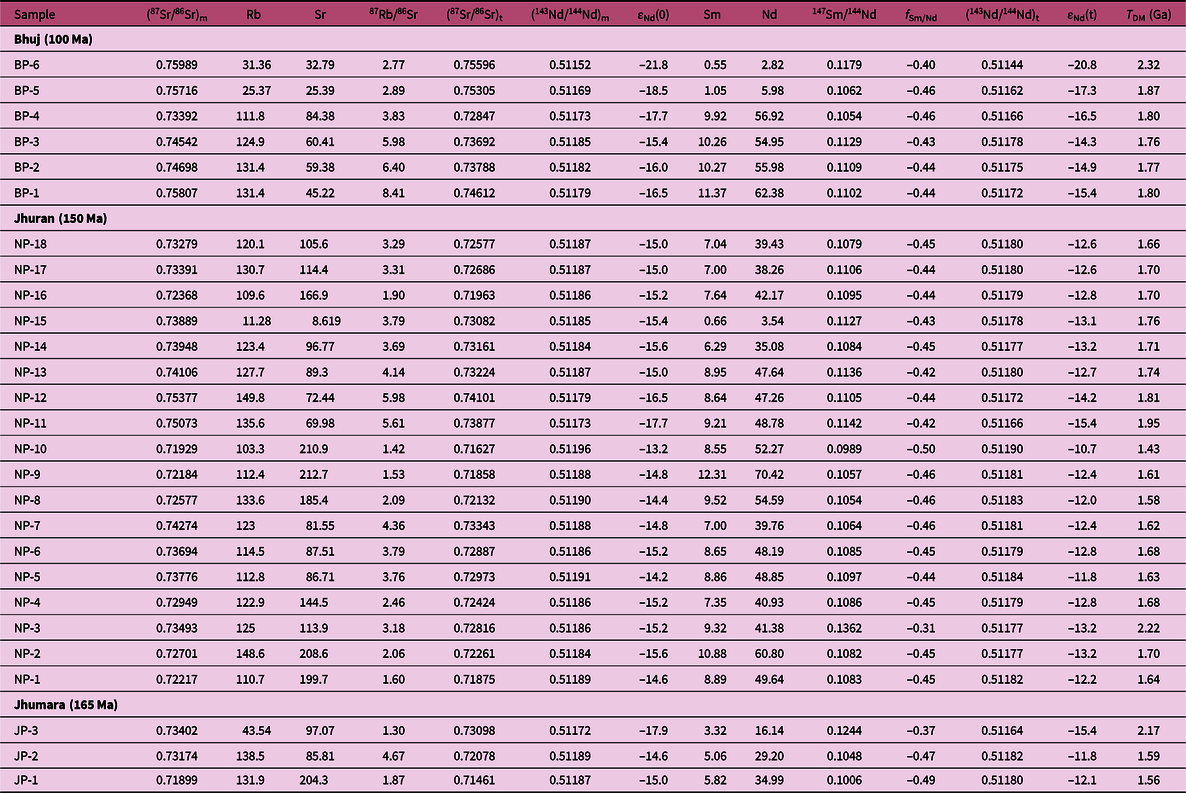
Note: Subscripts m and t indicate the ratios measured and at the time of deposition, respectively. Initial ratios were calculated at the age of deposition, given in brackets. Sm and Nd concentrations were measured by Q-ICP-MS at Physical Research Laboratory, Ahmedabad, India. Depleted mid-ocean-ridge basalt mantle values used for T DM calculations: 143Nd/144Nd = 0.513114 and 147Sm/144Nd = 0.222 (Michard et al. Reference Michard, Gurriet, Soudant and Albarede1985).
Histogram of T DM distribution for the sediments in the Mesozoic Kutch Basin.

Plot of f Sm/Nd versus εNd(0) (modified after McLennan et al. Reference McLennan, Hemming, McDaniel, Hanson, Johnson and Basu1993) for shale samples from Jhumara, Jhuran and Bhuj formations. Abbreviations as for Figure 4.

5. Discussion
Both trace-element analysis and Sr–Nd isotopic composition of sediments in the Mesozoic Kutch Basin point to their derivation primarily from upper continental sources. This is reflected in the enriched LILE and LREE, (87Sr/86Sr)t > 0.71, εNd(t) < −10 and negative f Sm/Nd (Condie, Reference Condie1993). The same is reflected in the T DM distribution of the sediments (Fig. 12). T DM mode at 1800 Ma is related to one of the major crust-forming episodes on the Earth (Condie, Reference Condie2001; Condie & Aster, Reference Condie and Aster2010). The insignificant change in εNd(t) from the Jhumara Formation to the Middle Member of the Jhuran Formation suggests a negligible shift in sediment sources. The low Th (Fig. 5), lowest (87Sr/86Sr)t and average T DM age of 1570 Ma indicate sediment inputs from a juvenile mafic source for the oldest Jhumara Formation. The basin possibly received sediments from young orogenic belt(s) during the initial phase. Importantly, the influence of such a sediment source diminishes through time, with felsic (granitic) source progressively dominating from the bottom to the top of the Mesozoic succession. The concentration of trace elements such as Th and Sc, the LREE-enriched chondrite normalized patterns and the negative Eu anomaly suggest the dominance of felsic composition at source for Jhumara, Jhuran and Bhuj formations. The high content of Th (average, 26.4 ppm) and high ∑REE in samples from the Lower Member of the Jhuran Formation are possibly related to the high content of monazite in the samples as reported by Chaudhuri et al. (Reference Chaudhuri, Banerjee and Le Pera2018) (Table 2). Low Sc/Cr ratios and the cross-plot of La/Th versus Hf indicate a passive-margin setting (Bhatia & Crook, Reference Bhatia and Crook1986; Floyd & Leveridge, Reference Floyd and Leveridge1987) (Fig. 6).
Average T DM versus average εNd(t) plot for Mesozoic sediments in the Kutch Basin compared with those of potential sources in Rajasthan. Error bars for the source points are 3σ. Data sources: George & Ray (Reference George and Ray2017) and Shukla et al. (2019).

The depletion of Ba, U, Pb and Sr observed in all the formations (Fig. 2) are possibly linked to the weathering of the source region (cf. Price et al. Reference Price, Gray, Wilson, Frey and Taylor1991). The magnitude of Sr depletion increases from the bottom to the top of the succession, which could be attributed to higher weathering in the source region as a function of time (i.e. the younger formations received more sediments from highly weathered sources). The highly weathered nature of the source possibly corresponds to the progressive tectonic stability of the basin from syn-rift to post-rift. The two clusters in Nb/Ta versus Zr/Hf cross-plot suggest multiple weathering or depositional histories (Fig. 3). The high Nb/Ta (low Zr/Hf) most likely represents highly recycled sediments, that is, derivation from sedimentary source rocks; the low Nb/Ta could be attributed to derivation from felsic igneous rocks.
The Nd isotopic composition of the Bhuj Formation indicates predominant sediment derivation from crustal sources of early Proterozoic age (Figs 7, 8, 10–12). T DM ages indicate the dominance of source rocks of late Palaeoproterozoic age (1700–1800 Ma), with subordinate contributions from rocks of early Mesoproterozoic (1400–1600 Ma) and early Palaeoproterozoic (2100–2400 Ma) ages (Fig. 10). The mode of T DM is c. 1800 ± 200 Ma.
Considering the overwhelming southwesterly slope of the basin (Biswas, Reference Biswas, Tandon, Pant and Casshyap1991, Reference Biswas2005; Arora et al. Reference Arora, Banerjee and Dutta2015, Reference Arora, Dutta, Gogoi and Banerjee2017; Mandal et al. Reference Mandal, Koner, Sarkar, Tawfik, Chakraborty, Bhakta and Bose2016; Desai & Biswas, Reference Desai and Biswas2018), the possible rocks which could have sourced these sediments include Nagar Parkar Igneous Suite exposed in the Nagar Parkar Ridge; Banded Gneissic Complex; Aravalli, Bhilwara, Delhi and Marwar supergroups; Erinpura Granite; and Malani volcanic rocks exposed in the Aravalli highlands (Fig. 13). The Nd isotopic composition of Mesozoic sediments in the Kutch Basin and their T DM ages overlap with those of the Proterozoic Marwar Supergroup and the Erinpura Granites (Fig. 12), suggesting these rocks were the major source of sediments to the basin. The mafic juvenile component, especially in the Jhumara Formation, possibly derives from the Nagar Parker Igneous Suite in the north, which contains mafic magmatic rocks within a largely granitic terrain (e.g. Khan et al. Reference Khan, Murata, Rehman, Zafar and Ozawa2012, Reference Khan, Murata, Jan, Rehman, Zafar, Ozawa, Qadir and Mehmood2017; Jan et al. Reference Jan, Agheem, Laghari and Anjum2017; de Wall et al. Reference de Wall, Pandit, Donhauser, Schöbel, Wang and Sharma2018; Rehman et al. Reference Rehman, Khan, Jan, Lee, Chung and Murata2018). This indicates the existence of southerly drainage during the initial phase of the basin. Subsequently, the palaeoslope became southwesterly because of the seawards tilting of the basin. Although there is substantial similarity in the source of the Middle Jurassic syn-rift sediments and the Lower Cretaceous post-rift sediments, trace-element concentrations, their ratios and Nd isotopic compositions reveal subtle variations in source characteristics of younger sediments. The increasing Hf concentration in samples from Jhuran and Bhuj formations exhibiting older sediment components suggest erosional unroofing at the source (Fig. 6). Increasing mean T DM ages exhibited by Jhumara, Jhuran and Bhuj samples further supports this interpretation.
Schematic diagram of palaeodrainage pattern in the Early Cretaceous Kutch Basin and possible provenance areas.

This study indicates the dominance of felsic source rocks for the entire Mesozoic rock record. Integrating results from trace-element and Sr–Nd systematics (low Th, low (87Sr/86Sr)t and T DM < 1600 Ma) highlights additional juvenile mafic source rocks in the Jhumara Formation. The concentration of Hf indicates older source rocks in younger Jhuran and Bhuj formations. Finally, εNd(t) and T DM ages, along with the established palaeoslope, provide a more reliable correlation with the existing rocks at source area. This confirms the applicability of trace elements and Nd isotope geochemistry in tracing multiple source rocks.
6. Conclusions
Concentrations of trace elements (Th, Sc) and their ratios (Nb/Ta and Zr/Hf) indicate that multiple sources, including both igneous and sedimentary rocks, contribute sediments to Jhumara, Jhuran and Bhuj formations of the Mesozoic Kutch Basin. High (87Sr/86Sr)t, negative εNd and LREE enrichment indicate enriched crustal source of sediments. Although the felsic source rocks dominate, sediments in the Jhumara Formation exhibit inputs from a juvenile mafic source.
T DM ages indicate that rocks of late Palaeoproterozoic age (1700–1800 Ma) are the dominant sediment contributors, as well as those of early Mesoproterozoic (1400–1600 Ma) and early Palaeoproterozoic (2100–2400 Ma) ages.
Concentrations of Hf indicates the dominance of older inputs in younger sediments of Jhuran and Bhuj formations. The increasing mean T DM from bottom to top, namely 1570, 1680 and 1800 Ma for Jhumara, Jhuran and Bhuj formations, respectively, corroborates sediments from older rocks in younger formations, suggesting erosional unroofing of source rocks. Average T DM of 1800 Ma coincides with one of the major crust-forming events.
The increasing (87Sr/86Sr)t from the bottom to the top of the Mesozoic succession relates to increased weathering of the source rock, possibly linked to the increasing tectonic stability of the basin.
Considering the southwesterly palaeoslope of this basin and the mean T DM ages, rocks of the Marwar Supergroup and Erinpura Granite north and NE of the Kutch Basin constitute the main sediment source. However, minor amount of sediments are derived from the Palaeoproterozoic Banded Gneissic Complex II, Bhilwara Supergroup and Aravalli Supergroup and the Mesoproterozoic Delhi Supergroup. The mafic juvenile component in the sediments of Jhumara Formation is likely to have derived from the Nagar Parkar Igneous Suite to the north.
Acknowledgement
We thank our host institutes for infrastructure support. SB acknowledges the Science and Engineering Research Board, Government of India for financial support through grant no. SR/S4/ES-709/2014 of the Government of India. We also thank Gaurav Chauhan for assistance with sample collection and Emilia Le Pera for constructive suggestions.


 Open access