


Introduction
How does fiscal equalization impact spatial inequalities? In several developed democracies, local governments are responsible for the delivery of welfare services. Since local governments have varying financial capacities (i.e., different tax bases) and socioeconomic conditions (i.e., expenditure needs), local governments vary in their ability to deliver welfare services of the same quantity and quality. This gives rise to spatial inequalities in the provision of welfare services. Equalization policy is a policy tool for addressing these spatial inequalities. Equalization policies transfer financial resources either from local governments with better tax bases and socioeconomic conditions to local governments with poorer financial resources and socioeconomic conditions or from the central government to the municipalities. Simply put, equalization policy is a form of regional redistribution. As such, equalization policies have the potential to reduce spatial inequalities in tax bases and expenditure needs, which has consequences for spatial inequalities in the provision of welfare services. Understanding how fiscal equalization systems influence inequalities in local government finance is hence important for understanding spatial inequalities in the delivery of welfare services.
In this paper, we analyze and compare the fiscal equalization systems in Denmark, Finland, Norway, and Sweden. To the best of our knowledge, we are the first to conduct a comparative empirical analysis of the Nordic countries’ fiscal equalization systems and not just a comparative description of the systems as in, for instance, Mønnesland (Reference Mønnesland2001), Pedersen (Reference Pedersen and Jørgen2018), and Borge et al. (Reference Borge, Etzerodt, Pedersen and Oulasvirta2018). This enables us to study inequalities before and after equalization. Inequalities before equalization concern disparities in tax bases and spending needs, and inequalities after equalization concern these differences, taking equalization into account.
Toward this endeavor, we compile a new data set consisting of granular data from the four countries’ local governments in the year 2020. Leveraging data from all municipalities in the four Nordic countries, we examine pre- and post-equalization inequalities, show how fiscal equalization systems are structured, and how they equalize spending needs and tax bases.
A large literature engages with income and wealth inequalities between individuals across nations and over time (Piketty Reference Piketty2014; Stiglitz Reference Stiglitz2012; Milanovic Reference Milanovic2016). In this paper, we shift the focus to inequalities between local governments and the effectiveness of fiscal equalization systems. In doing so, we stress the importance of variation in public policies and their consequences for spatial inequalities. The public policy literature links welfare policies to inequalities (Esping-Andersen and Myles Reference Esping-Andersen, Myles, Nolan, Salverda and Timothy2012; Sauer et al. Reference Sauer, Rao and Pachauri2023; Bação et al. Reference Bação, Duarte, Pereira and Simões2025). Likewise, the scholarship on place-based policies stresses how policies influence spatial inequalities (Duranton and Venables Reference Duranton and Venables2018; Immarino et al. Reference Immarino, Rodriguez-Pose and Storper2019; Neumark and Simpson Reference Neumark, Simpson, Gilles Duranton, Henderson and Strange2015). Yet, there has been surprisingly little attention paid to the role of fiscal equalization policies in addressing spatial inequalities and the effectiveness of these policies.
Fiscal equalization systems redistribute vast amounts of resources and are hugely influential for the welfare (services) that local governments can deliver – and hence for spatial inequalities in public policies. A long and well-established literature in political economy engages with fiscal equalization systems (Béland and Lecours Reference Béland and Lecours2014; Brenton Reference Brenton2020; Buchanan Reference Buchanan1950, Reference Buchanan1952; Musgrave and Musgrave Reference Musgrave and Musgrave1980; Bradbury et. al. Reference Bradbury, Ladd, Perrault, Reschovsky and Yinger1984; Oates Reference Oates1999; Boadway Reference Boadway2004; Shah Reference Shah, Broadway and Shah2007). Fiscal equalization is the redistribution of financial resources spatially, with the purpose of equalizing the economic conditions for service provision between local governments. Fiscal equity can be derived from the principle of horizontal equity and the desire of the central government to equalize fiscal positions of local governments. Fiscal disparities exist when local governments must levy different tax rates to provide the same level of public services (Bradbury et. al. Reference Bradbury, Ladd, Perrault, Reschovsky and Yinger1984). Some local governments have a high taxable capacity (the tax rate needed to obtain a given level of revenue is low) and, if lucky, have relatively low expenditures to provide for a comparatively similar level of welfare services. Those who are in a reverse position are fiscally weak. The fiscally strong or weak positions can be measured by the ratio of fiscal capacity to need (Musgrave and Musgrave Reference Musgrave and Musgrave1980, 530–531).
More particularly, this paper relates to the literature on school finance equalization within the U.S. states. All U.S. states have school districts where the local property tax is an important source of financing. Reschovsky (Reference Reschovsky1994) discusses different objectives for equalization, i.e., wealth neutrality (no systematic relationship between per-pupil spending and property values), taxpayer equity, and that each school district should be able to provide an “adequate” level of public education at a “reasonable” property tax rate. Hoxby (Reference Hoxby2001) shows that all equalization programs implemented in the U.S. states have reduced disparities in spending per pupil, but in most cases at the expense of reducing average state spending per pupil.
Fiscal equity (and fiscal justice in a normative meaning) is achieved when each municipality has the opportunity to provide a given quantity and quality of welfare services at the same tax rate. For this purpose, tax equalization grants are designed to a certain extent to compensate municipalities for higher costs or lower tax bases due to uncontrollable factors. Thus, only uncontrollable cost and income differences should be equalized (Jonsson Reference Jonsson2000, 13). Fiscal equalization may also contribute to stability in the form of risk-sharing as well as affecting economic efficiency (Blöchliger and Charbit, Reference Blöchliger and Charbit2008; Stokes, Reference Stokes, Boix and Stokes2009) and is often seen as a prerequisite for a decentralized system where local governments play an integral role in the delivery of welfare services.
Our main finding is that Sweden has the lowest inequality of service provision, both before and after equalization, while the degree of inequality is highest in Norway. Denmark and Finland are in between. This finding shows that by structuring fiscal equalization systems differently, policymakers can use these systems to influence spatial inequalities. In many countries, there is probably a lack of knowledge on the effects of municipal equalization, and our contribution shows one way to systematically compare these systems for politicians’ scrutiny. Decision-makers can also compare their country to other countries and assess how strong or weak their equalization policies seem to be.
Our analysis has implications for the study of spatial inequalities (Immarino et al. Reference Immarino, Rodriguez-Pose and Storper2019; Kemeny and Storper Reference Kemeny and Storper2023). Our paper highlights that municipal fiscal equalization – an aspect of fiscal federalism – impacts inequalities in local government finance, which has consequences for spatial inequalities in welfare provision. The paper, moreover, has implications for scholars of the provision of public services and welfare. As fiscal equalization systems structure inequalities in public finance, these systems also fundamentally structure the level and quality of welfare that local governments can deliver. This is an often-overlooked aspect of the mainstream welfare state literature (Esping-Andersen Reference Esping-Andersen1990), although it is a cornerstone in most local public finance systems in many unitary and federal states. Incorporating fiscal equalization into mainstream public policy models would allow scholars to examine not only differences in inequalities amongst social groups but also in their localities.
Our study might also have implications for voting, as some studies find that regional inequalities are related to populist right voting (Rodriguez-Pose Reference Rodríguez-Pose2018; Albanese et al. Reference Albanese, Barone and de Blasio2022; Becker et al. Reference Becker, Fetzer and Novy2017; Crescenzi et al. Reference Crescenzi, Cataldo and Giua2020). Some studies show that regional redistribution may curtail voting for populist right parties (Albanese et al. Reference Albanese, Barone and de Blasio2022). Related is also the literature on austerity and voting (Alesina et al. Reference Alesina, Ciminelli, Furcer and Saponaro2024; Bansak et al. Reference Bansak, Bechtel and Margalit2021; Fetzer Reference Fetzer2019; Hübscher et al. Reference Hübscher, Thomas and Wagner2021). To the extent that poor local governments have to retrench their welfare spending relatively more than richer municipalities, this may prompt a political response. By showing how differences in fiscal equalization relate to inequalities in local government’s ability to prioritize welfare services, inequalities in fiscal equalization may be one mechanism through which public policies impact voting.
Key facts about the Nordic municipalities
The Nordic countries are similar in many respects culturally, institutionally, and historically (Classen Reference Classen1937). They are small in terms of population size and rich in terms of high per capita GDP. Norway also has a large sovereign wealth fund based on revenues from the petroleum industry. The fund mainly contributes to higher revenues for the municipalities. To our knowledge, there is no evidence that the sovereign wealth fund has been important for the inequality among Norwegian municipalities.
The Nordic countries share many of the same values with respect to equality among citizens and regions and a strong local democracy. All are unitary representative democracies where the national parties are also important at the subnational level. They moreover have relatively generous and progressive welfare states and are often grouped together in the comparative welfare state literature as having similar welfare regimes (Esping-Andersen Reference Esping-Andersen1990; Kuhnle and Pedersen Reference Kuhnle, West Pedersen and Knutsen2017).
The most important difference, for our purpose, is the organization of the public sector. In Denmark, Norway, and Sweden, the public sector consists of three tiers. These are the central government, regional governments, and municipal governments. Typically, the regions are responsible for tasks that require a larger population, such as hospitals. Until 2023, Finland had a two-tier system, with only a central and a municipal level.Footnote 1 However, in Finland, there was extensive inter-municipal cooperation for tasks that required a larger population. Another major difference is that Denmark is small in terms of land area and has a higher population density than the other Nordic countries.
In this paper, we concentrate on fiscal equalization among municipalities. Table 1 provides key information on municipal structure in the four Nordic countries. In 2020, Sweden had the largest population size with 10.4 million, while the other countries were of roughly half the size. In all countries, the capital city is the most populous municipality. Copenhagen in Denmark, Helsinki in Finland, and Oslo in Norway had between 600,000 and 700,000 inhabitants. Stockholm in Sweden is more populous and has a population size close to 1 million.
Municipal population structure in the Nordic countries. January 1, 2020

Note: The Finnish numbers are from December 31, 2021, and include Åland with 16 municipalities. The Danish numbers do not include Greenland and the Faroe Islands.
Sources: Noegletal.dk (Denmark), Statistics Finland, Statistics Norway, and Statistics Sweden.
Municipalities in the Nordic countries are multi-purpose authorities that, to a large extent, are responsible for similar tasks. Nordic municipalities are responsible for welfare services such as education, some primary health care services, care for the elderly, and childcare; child welfare; as well as social assistance and services. In addition, they are responsible for local services such as planning, business development, municipal roads, water, sewage, garbage collection, culture, and leisure activities. But there are also some differences. For instance, in Finland and Sweden, upper secondary education is a municipal responsibility, while in Norway it is a regional responsibility and in Denmark a central government responsibility. Danish municipalities are also responsible for most transfers to individuals.
Equalization systems in the Nordic countries
Equalization systems can be structured in different ways. In most countries, local government revenues do not cover the expenditures, giving rise to a vertical fiscal gap. This gap can then be covered by the central government through intergovernmental transfers to the local government sector. Within the local government sector, there will also exist horizontal fiscal gaps (revenues do not match expenditures for the different municipalities), which raises an issue of redistribution between municipalities. With regard to these two dimensions, equalization systems can be designed and financed in different ways. For illustrative purposes, it is useful to consider two “extreme” alternatives. The first alternative is that the central government finances the equalization system by providing grants to the municipalities. Municipalities with a low tax base and high spending needs will receive larger grants than municipalities with a high tax base and low spending needs. These grants serve two purposes: to redistribute revenue among municipalities and to transfer revenue from the central government to the municipalities. These two purposes are intertwined and cannot be separated. The second alternative is that equalization is carried out as pure redistribution among the municipalities. In this “Robin Hood” alternative, municipalities with a high tax base and low spending needs transfer revenue to municipalities with a low tax base and high spending needs. In the “Robin Hood” alternative, central government grants are distributed in an intentionally neutral manner, e.g., by a fixed amount per capita. In the “Robin Hood” alternative, the two purposes, redistribution and transfer of revenue from the central government to the municipalities, are separated.
It should be noted that in all four countries, there is a net transfer of revenues from the central government to the local governments. Fiscal equalization is not carried out as a pure redistribution of local tax revenues, and grants from the central government play a crucial role in fiscal equalization. In the Finnish equalization system, the two purposes are intertwined, while in the other Nordic countries, they are to a larger degree separated. Equalization grants include both transfers from other municipalities and the central government.
Tax equalization
All Nordic countries have extensive tax equalization. Taxes are not completely equalized, and the countries differ with respect to compensation rates and which taxes are equalized. Equalization is not, as a rule, based on actual tax revenues, but in most cases, calculated tax revenues using averages of municipal tax rates are applied.
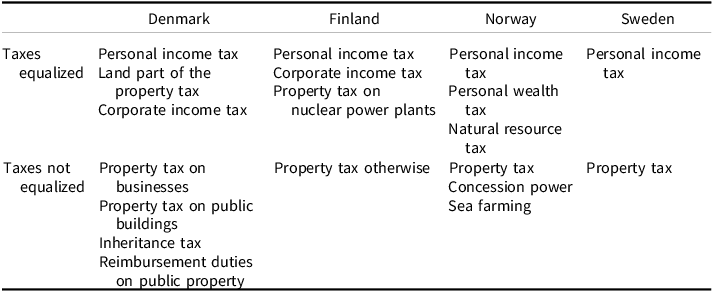
In our context, the most important criterion identified in the literature on tax assignment (McLure Reference McLure1998, Reference McLure2001) is distribution. More precisely, the per capita tax base should not be too unequally distributed across municipalities. We have chosen to distinguish between two types of local taxes: taxes that are equalized and taxes that are not equalized. Table 2 provides an overview using this classification. The personal income tax is by far the most important tax in all four countries. As a share of all municipal tax revenues, it amounts to 96% in Sweden, 89% in Denmark, 85% in Finland, and 82% in Norway. All countries have additional tax revenues. Some of them are equalized in the same way as personal income, some are less equalized, and others are not equalized at all.
Classification of local taxes in the Nordic countries, 2020

Note: Taxes equalized include taxes in the ordinary equalization scheme and taxes that are equalized to a lower degree. Including shared taxes.
We start out with the Swedish system that is the least complicated. Tax equalization includes only the income tax, while the minor property tax (kommunal fastighetsavgift) is not equalized. The so-called reference level is 115% of the national average tax base per capita.Footnote 2 Municipalities with a tax base below the reference level receive a tax equalization grant. This corresponds to 95% of the difference between the reference level and own tax base, while municipalities with tax base above the reference level must contribute by paying 85% of the difference between own tax base and the reference level.
The Finnish tax equalization includes the income tax, tax on corporate profit, and property tax from nuclear power plants. Property taxes on houses and businesses are not equalized. The reference level is the national average. Municipalities with a tax base below the average have a compensation rate of 80%, while municipalities with a tax base above average must contribute by paying a negative grant. In 2020, the contribution started at 30% of the difference between own tax base and average tax base and is increasing in own tax base at a maximum of up to 38%.
The Norwegian tax equalization includes the income and wealth tax from individuals and natural resource tax from hydroelectric power plants. The reference level is the national average. The tax equalization scheme consists of a symmetric part with compensation and contribution rates of 60%. In addition, municipalities with a tax base below 90% of the average receive an extra compensation of 35%. The property tax, revenues from the sale of concession power, and revenues from sea farming are not included in the Norwegian tax equalization.
The Danish system in 2020 implied simultaneous equalization of tax bases and spending needs via what was termed the structural deficit, i.e., calculatory tax revenues (the average municipal tax rate multiplied by the municipality’s own tax base) minus the calculated expenditure needs.Footnote 3 The calculatory tax revenue included the personal income tax and the land part of the property tax. Moreover, the corporate income tax is equalized to some extent, but to a lesser degree than other equalized taxes. Four minor taxes were not equalized.Footnote 4 The system equalized the structural deficit or surplus per inhabitant by a compensation or contribution rate of 61%. In addition, the system then included two equalization schemes for separate groups of municipalities. First, an extra equalization of structural deficit or surplus for municipalities in the Copenhagen area with 27%, i.e., 88% (61+27) in all at the margin. Second, an extra equalization grant to municipalities with a high level of structural deficit per inhabitant, calculated as 32% of the structural deficit, i.e., 93% in all. Six municipalities had a compensation or contribution rate of 61%, 34 had 88%, and 58 had 93%.
Sweden clearly has the highest degree of tax equalization, with comparatively high compensation and contribution rates. Norway and Finland have the lowest degree of tax equalization, but it is difficult to rank the two countries. Finland has lower compensation and contribution rates than Norway, but more taxes are exempted from equalization in Norway (around 10%) than in Finland (3–4%). Denmark had joint tax and spending needs equalization in 2020, and it is impossible to separate one from the other.
Spending needs equalization
The purpose of spending needs equalization is to equalize opportunities for service provision and not to secure equal service standards in all municipalities. Municipalities that voluntarily choose to have higher tax rates than the average, and thereby higher service standards, should not be compensated for that part. Municipalities that are less efficient due to their own faults and, as a result, have higher expenditure and tax rates than other municipalities should not be compensated with higher equalization grants. Furthermore, municipalities that are more efficient than other municipalities on average should not be punished by lower equalization grants.
In all Nordic countries, the municipalities are responsible for several service sectors; see Section 2. In principle, the starting point for calculating total spending needs is the sector-specific spending needs, e.g., for education. The sector-specific spending needs consist of a set of criteria and weights reflecting the relative importance of each criterion for expenditures in that sector. Then, total spending needs are calculated as the weighted average of the sector-specific spending needs using the sectors’ budget shares as weights. The municipalities have large discretion in how to allocate resources between service sectors.
The criteria are often labeled “objective.” By objective, we mean that they are not directly affected by municipal spending priorities in the short to medium term. The general rule is that the criteria should be available as official statistics. This is the case for age and most socioeconomic criteria like divorce rates, unemployment, mortality, and settlement patterns. Some criteria are based on reporting from the municipalities, but these are, in most cases, based on independent auditing. In all the Nordic countries, relevant criteria are to a large degree identified through statistical analyses of expenditures, either descriptive statistics or regression analysis.
Although the design of spending needs equalization varies across the Nordic countries, the systems also have many similarities. Equalization of spending needs is a pure redistribution between municipalities in Norway and Sweden. The same goes for Denmark from 2021. Transfers to municipalities with spending needs per capita above average are financed by contributions from municipalities with spending needs per capita below average. However, in Finland, the state finances the difference in calculatory spending needs so that the municipal self-financing per inhabitant is the same for all municipalities; the rest of the financing comes from the central government. The systems in Finland, Norway, and Sweden have full compensation for differences in spending needs. Denmark has less than full compensation, but still quite high. In Denmark, the compensation and contribution rates for spending needs are the same as for the tax equalization described above in 2020.
The conditions for providing services vary substantially across municipalities. We can, in general, distinguish between demand and cost factors. Age composition is a prime example of demand factors. In education, for example, the number of pupils in the population is an important demand factor. Cost factors include population size, settlement pattern, and wage level, which may be important for several services. It is less clear whether socioeconomic criteria should be classified as demand or cost factors.
All four countries compensate for both age and socioeconomic criteria, but the details differ across the countries. In Denmark, the socioeconomic criteria are captured by an index of 18 different criteria capturing among others unemployment, low education, immigrants, disability, affordable housing, psychiatric patients, and low life expectancy. The demographic index is captured by 15 age groups and a criterion for declining population. The two indices are added into one socioeconomic criterion, where the demographic index and the socioeconomic index are weighted 2/3 and 1/3, respectively. Denmark is the only country that does not directly compensate for diseconomies of scale, although, relating to diseconomies of scale, population decreases are included in the demographic criteria, and population density and distance to jobs are included in the socioeconomic criteria.
The spending needs equalization in Finland, Norway, and Sweden compensates for age, socioeconomics, and cost factors. Unlike in Denmark, the socioeconomic criteria are sector-specific, and there are fewer age groups. For hospitals and elderly care, Finland compensates for specific diagnoses. Finland is a special case in the sense that hospitals were a municipal responsibility in 2020. In elderly care, Finland is the only country that compensates for diseases like dementia, psychosis, and epilepsy. Norway compensates for diseconomies of scale due to low population size and sparse population. Finland and Sweden also compensate for a sparse population. Sweden is the only country that compensates municipalities for high wage costs, which benefits urban municipalities.
Finally, the services subject to spending needs equalization vary across the Nordic countries. In Norway, equalization is restricted to national welfare services and administration. Sweden also has some restrictions, e.g., services related to culture, leisure, and sports are not equalized. In Finland, some fully voluntary services are not included, for instance, some recreational and industrial development services. In Denmark, a broad range of services is included, and the spending needs equalization includes all municipality-delivered services. In all countries, Finland being the exception, equalization is based on net expenditures, i.e., after deducting earmarked grants from the central government and citizens’ user fees from the gross expenditures.
The criteria for spending needs are taken from the formulas used to calculate expenditure needs. This handling of spending needs is a limitation of our study since the calculatory spending needs can differ from the “true” spending needs of some municipalities. We acknowledge this limitation, but using the formulas is the best we can do.
Research design
In order to conduct an international comparative study on equalization, we have to decide on a relevant group of countries to include in the comparison. We would like, as far as possible, to identify possible differences in our dependent variable, i.e., the effectiveness of the fiscal equalization systems. On the other hand, we wish as far as possible to avoid explanations connected with other national differences and characteristics.
We argue that the Nordic countries, with their large welfare states, form a kind of cluster that is mostly similar in several relevant respects. First, the welfare models of the Nordic countries are universal welfare models differing from more corporative, continental, or liberal/residual models (Esping-Andersen Reference Esping-Andersen1990). This categorization is widely coincident with typologies of European public sectors originally established as social democratic welfare states (Sellers and Lidström Reference Sellers and Lidström2007). Second, the municipalities in the Nordic countries are general-purpose units that together constitute a significant part of the public sector. Third, the similarities are also found when it comes to municipalities’ own finance, primarily from local income tax and the level of autonomy, cf. the LAI-index (Ladner and Keuffer Reference Ladner and Keuffer2021) and an index measuring the level of decentralization of the public sector (Ivyana and Shah Reference Ivanyna and Shah2014). In sum, we find the four Nordic countries sufficiently similar in relevant aspects to make them useful for comparisons of the effectiveness of equalization.
We do not distinguish between tax and spending needs equalization but rather analyze the effects of total equalization grants in 2020. The reason for this is that Denmark had joint equalization of tax bases and spending needs in 2020, implying that it was not possible to separate the two. We take account of transitional arrangements to limit changes in equalization grants from year to year. For Norway, we also include grants to municipalities in the Northern part of the country, grants to small municipalities in the Southern part, and grants to municipalities with high population growth. For all countries, we abstract from other revenues like earmarked grants and user fees. In Norway, most of the compensation for COVID-19 was paid out as equalization grants, while the COVID compensation was paid out outside the equalization system in the other Nordic countries. To make the numbers comparable, we have chosen to use numbers from the Norwegian central government’s budget that was released before the pandemic (October 2019).Footnote 5 We only use data for 2020. Panel data would not add much information since the distribution of revenues among municipalities is quite stable over time.
A main contribution is that we analyze inequalities both before and after equalization. By inequalities before equalization, we mean inequalities in tax bases per capita and spending needs per capita, not taking equalization grants into account. We also calculate a single indicator of inequalities, namely the ratio between tax bases per capita and spending needs per capita. By inequalities after equalization, we mean the inequalities that remain after the equalization grants are taken into account. One possible indicator would be the sum of tax base per capita and per capita equalization grant, in the following denoted as revenues per capita. However, this indicator is imperfect because municipalities with high per capita spending needs must have high per capita revenues in order to compensate for the high spending needs. Our preferred indicator is therefore the ratio between revenues per capita and spending needs per capita.
To study differences in inequality between countries, we proceed in two different ways. First, we use a unified measure of inequality, the Gini coefficient (or Gini index). It is frequently used and fulfills general requirements for inequality measures such as anonymity, independence of scale (e.g., different countries having different levels of income), and independence of population size. The Gini index is based on the Lorenz curve, measuring the overall dispersion in the variable of interest by comparing the actual distribution with a perfectly equal distribution. It ranges from 0 to 1, where 0 corresponds to a situation where all municipalities have the same resources (full equalization), and 1 is the other extreme case where one municipality has all the resources (complete inequality). Gini coefficients are useful when comparing the countries before and after equalization. It is notable that we below find relatively big differences in the dependent variable. To complement the Gini coefficients, we also present the ratio between the 90th and 10th percentiles of the distributions, the 90/10 ratio.
One disadvantage of the Gini index is that two countries can have the same index value but completely different distributions. This means that the Gini index does not provide a complete picture of the distributions. Therefore, as a second way of studying inequality, we present histograms that provide a visual impression of inequalities before and after equalization. In the histograms, we use the ratio between per capita tax base and per capita spending needs as an indicator of inequalities before equalization and the ratio between per capita revenues (the sum of tax base and equalization grants) as an indicator of inequalities after equalization.
Results: inequalities before and after equalization
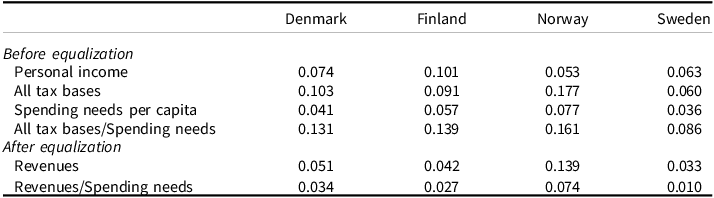
In Table 3, Gini coefficients for tax bases and spending needs are presented before and after equalization. As stated above, personal income is the most important local tax base in the Nordic countries. Personal income is also evenly distributed; the Gini coefficients vary between 0.05 and 0.10. Personal income is less equally distributed in Finland than in the other countries. One reason for this is that Finland is one of the most rapidly aging countries in Europe (Valkama and Oulasvirta Reference Valkama and Oulasvirta2021). Especially the peripheral municipalities suffer not only from low birth rates but also from a loss of people in the active working age, moving to growing city centers. This has, amongst other things, a differentiating influence on the income tax bases between municipalities. Norway has the lowest inequality in the personal income tax base in terms of the Gini coefficient.
Gini coefficients for different tax bases and spending needs, per capita, 2020

In row two of the table, all tax bases are included. Inequality in terms of the Gini changes only marginally for Sweden and relatively little for Finland. In addition to personal income, municipalities in Norway dispose of a number of other tax bases. The personal wealth and natural resource taxes in Norway have a substantial effect on the Gini coefficient, as do the revenues from the sale of concession power, property taxes, and revenues from sea farming. The Danish corporate tax also adds to the calculated Gini coefficient. If we add these other tax bases, inequality increases in Denmark and Norway compared to the personal income tax. The Gini index of aggregate tax base inequality is highest in Norway (0.177), while the Gini index in Denmark and Finland is respectively 0.10 and 0.09. Sweden stands out with the least unequal aggregate tax base, with a Gini index of 0.06. The main reason for this is that Sweden has the most narrowly defined municipal tax base. Capital income is not included in the personal income tax, and since there is a cap on valuable houses in the property tax, the property tax base is of little importance for the revenues in the Swedish municipalities.Footnote 6
Next, we briefly report the inequalities of spending needs as determined by the criteria set out in the four countries (see row three of Table 3). Note first that the Gini coefficients for the spending needs are lower than the corresponding figures for tax bases, indicating that the latter constitutes a more important source of inequality. Based on the criteria in the spending needs equalization, Norway has the largest variation in spending needs per capita, with a Gini of 0.077. Sweden has the lowest variation with a Gini of 0.036. Denmark and Finland have Ginis of 0.041 and 0.057, respectively.
The Gini coefficients reported in row two of Table 3 will generally overestimate the variation in “purchasing power” of taxes because of differences in spending needs. Some municipalities have high spending needs and need more resources to provide the same service standards as municipalities with low spending needs. If municipalities with low tax bases also have high spending needs, measured inequality will be higher than if we simply compare tax bases. In Figure B.1 in Appendix B, scatter plots are displayed showing the association between tax bases and spending needs. There is a clear negative pattern for Denmark, Finland, and Sweden, while, if anything, there is a positive association for Norway. In the fourth row of Table 3, tax bases are set in relation to spending needs and used as a basis for comparison. As expected, using this measure, inequality is considerably higher in Denmark, Finland, and Sweden. Many small municipalities in Norway have high tax bases and high spending needs, which contributes to the positive association between tax bases and spending needs in Figure B.1. As a result of this, the measured inequality for Norway is slightly lower in row four than in row three of Table 3.
Histograms before (blue bars) and after equalization (red bars), 2020.
Note: For Norway, one municipality is excluded because it has a very high index value (4.32) before equalization.

In the final two rows of Table 3, the impact of fiscal equalization, i.e., after equalization grants, is reported. Gini coefficients for the sum of taxes and equalizing grants are reported in row five. In Denmark, Finland, and Sweden, the Ginis reported in row five are roughly half the size compared to the figures reported in row two. This shows that tax equalization schemes in these countries have a large impact on equality in terms of resources. The difference for Norway is much smaller, and the level of inequality is arguably much larger.
Setting the total revenues in relation to the spending needs normalizes the resource bases to make municipalities comparable in terms of financing needs. Row six in Table 3 displays the results. The Gini coefficients regularly decrease when revenues are set in relation to needs; Sweden has the lowest Gini, followed by Finland and Denmark. Norway has the highest Gini coefficient.
How big is the impact of equalization on inequality? Comparing rows four and six in the table, we note substantial equalization in all countries. Sweden, having the narrowest tax base definition and the lowest inequality in the defined spending needs, obtains almost complete equalization. Finland and Denmark’s equalization efforts are strong, too, but less than that of Sweden. Comparing rows four and six, the Gini coefficient decreases by 88% in Sweden, some 81% in Finland, and by 74% in Denmark. Norway stands out as the country with the lowest redistribution (54%).
In Table A.1 in Appendix A, 90/10 percentile ratios are displayed following the same presentation as in Table 3. The general patterns we observe regarding the Gini coefficients are similar to those when we compare the tails of the distributions. Before equalization ratios (row four) are the highest in Finland and Norway. After equalization (row six), the ratios are substantially lower. Again, Norway stands out as the country with the lowest level of equalization.
To get a more visual impression of the impact of fiscal equalization, we present histograms comparing the situations before and after equalization. Before equalization corresponds to row four in Table 3 (the ratio between tax bases and spending needs), while after equalization corresponds to row six in Table 3 (the ratio between revenues and spending needs). Notice that the latter includes equalization grants. To make it easier to compare across countries, we have chosen to present normalized values, or index values, where the national average equals one. This applies to both before and after equalization.
The histograms are displayed in Figure 1, where the blue bars represent the situation before equalization and the red bars represent the situation after equalization. For all countries, it is evident that the red bars for all countries are more narrowly distributed than the blue bars, i.e., fiscal equalization has the intended effect of reducing disparities among municipalities.
However, the degree of equalization varies across the Nordic countries. Sweden stands out as the country with the least inequalities both before and after equalization. The index values before equalization range from 0.71 to 1.57. The municipality with the worst fiscal conditions before equalization is 29% below the national average, and the municipality with the best fiscal conditions is 57% above. After equalization, the index values range from 0.96 to 1.09. The disparities are substantially reduced compared to the situation before equalization.
In Denmark, the index values before equalization range from 0.63 to 2.14. After equalization, the range is 0.93 to 1.30. We observe that the worst-off municipality before equalization is lifted almost as much as in Sweden after equalization. At the top, however, Danish municipalities are better off compared to their Swedish counterparts.
In Finland, the range before equalization is 0.58 to 2.30, while after equalization it is 0.83 to 1.42. The worst-off municipality before equalization is lifted substantially less after equalization than in Sweden and Denmark. At the other end of the scale, the best-off Finnish municipality before equalization ends up with a slightly higher index value after equalization than in Denmark.
In Norway, the index values range from 0.46 to 4.32 before equalization, while after equalization, the range is 0.82 to 2.26. The worst-off Norwegian municipality before equalization is lifted to roughly the same level as in Finland after equalization. On the other hand, the best-off Norwegian municipality after equalization ends up with a much higher index value than in Finland.
It is reassuring that the histograms provide about the same ranking of the countries as the Gini coefficients. The two approaches have different strengths. The strength of the histograms is that they give a visual impression of the situations before and after equalization, while the Gini coefficients provide a metric for inequalities before and after equalization.
Concluding remarks
The aim of this paper is to examine how fiscal equalization impacts spatial inequalities in the four Nordic countries: Denmark, Finland, Norway, and Sweden. To the best of our knowledge, we are the first to conduct a comparative empirical analysis of the Nordic countries and not just a comparative description of the systems as in earlier studies. Leveraging a new data set with data from all the municipalities in the four Nordic countries, we analyze inequalities in tax bases and spending needs before and after equalization. In doing so, we address how fiscal equalization works to reduce inequalities in fiscal capacities and the conditions to deliver welfare services.
We examine descriptive inequalities in tax bases and spending needs before and after equalization. We find that Sweden has the lowest inequality in tax bases relative to spending needs both before and after equalization and also decreases inequalities the most in percent after equalization. With a Gini coefficient of 0.01 after equalization, inequalities in Sweden seem remarkably low. Finland has the second-highest relative reduction in inequalities after equalization, followed by Denmark. Norway is the country with the comparatively highest inequalities both before and after equalization, as well as the relatively lowest reduction in inequalities after equalization. The comparison of the Nordic countries reveals that the inequalities after equalization reflect a combination of inequalities in tax bases and the design of tax equalization. Spending needs equalization plays a secondary role in equalization.
There is an interesting relationship between inequalities before and after equalization in the Nordic countries. Countries with low inequalities before equalization have equalization systems that reduce inequalities relatively more than in countries with higher inequalities before equalization. In other words, inequalities before and after equalization tend to reinforce each other. This can be interpreted in different ways. One interpretation is that there is a limit to how much an equalization system can reduce inequalities without creating distortions, e.g., in reducing incentives for the municipalities to support development of local businesses. Another interpretation is that in each country, the central government decides both which taxes municipalities are allowed to utilize and the design of the equalization system.
A central government that is more concerned about disparities in the provision of welfare services has two means at its disposal: (i) reducing inequalities before equalization through the choice of municipal tax bases, and (ii) contingent on low inequalities before equalization design an equalization system that is effective in reducing inequalities further.
This is foremost exemplified by the Swedish tax and equalization system. Swedish municipalities tax personal income, which includes income from labor. Capital income is not included in the personal income tax base, and other taxes are of little importance. Income from labor income is the most evenly distributed type of income between municipalities, and therefore, tax base inequality is low in comparison. Having narrowly defined tax bases, the central government contributes to the financing of the municipalities by having a reference level well above the national average tax base per capita. The compensation and contribution rates are also high in comparison to the other countries. This eliminates a large part of the difference between the poorest and richest municipalities in terms of general income.
A central government that is less concerned about disparities in the provision of welfare services can do the opposite: (i) introduce tax bases that are unevenly distributed among municipalities and (ii) contingent on relatively large inequalities before equalization design an equalization system that is less effective in reducing inequalities.
Among the four Nordic countries, the Norwegian tax and equalization system comes closest to this description. In Norway, nine of the ten best-off municipalities after equalization are rural municipalities with low population size. The exception is Hammerfest, a small city in the most northern county, with a population size of 11.500. On average, the ten best-off municipalities have a population size of 3175, but if we disregard Hammerfest, the average drops to 2250. The average population size in Norway is slightly above 15.000, see Table 1. Moreover, these ten municipalities benefit from having large tax revenues that are unevenly distributed and are not equalized. Most of them have substantial revenue from hydroelectric power plants (property tax and sale of concession power), and twoFootnote 7 have large property tax revenues from landing facilities for petroleum. Half of them also have revenues from sea farming. Even if we include more municipalities than the ten best-off, there is a clear overrepresentation of small municipalities in rural areas that benefit from having revenues from natural resources that are not equalized. At the other end of the scale, we find urban municipalities, either medium-sized cities or suburbs of larger cities. They have low tax bases and an average population size of nearly twice the national average.
Compared to the other Nordic countries, Norway is not a member of the EU and is allowed to have a more active regional policy that benefits rural areas. Private firms and the public sector in rural areas have lower payroll taxes than those in urban areas. In the most northern part of the country, citizens pay less in taxes to the central government. In addition, the central government also finances extra down payments on student loans and lower payments for childcare.Footnote 8
The examples above, both with respect to the impacts of the Norwegian equalization system and the regional policy in general, indicate that rural interests are important in Norway. Although the main purpose of the system is to equalize conditions for service provision throughout the country, regional policy seems to be an independent goal of the equalization system.
The two countries ranked in the middle, Denmark and Finland, are more challenging to characterize. In Finland, all taxes, including the personal income tax, are quite unevenly distributed. For the central government, it is then difficult to choose an evenly distributed tax base. The central government must, to a larger extent than in Sweden, rely on the equalization system. In Denmark, the personal income tax is also quite unevenly distributed, at least compared to Norway and Sweden. Denmark has chosen additional taxes, which increase the overall tax base inequality. They co-finance income transfers to households with considerably varying expenditure needs. This is, to some degree, compensated by having a high degree of equalization.
Denmark and Finland, moreover, obtain somewhat similar levels of inequalities after equalization. Out of the four countries, Finland has the second-highest relative reduction in inequalities after equalization, followed by Denmark. It is also worth noting that Finnish municipalities are, on average, smaller than those in Denmark. Consequently, Denmark’s system equalizes between spatially larger municipalities compared to Finland.
Irrespective of some technical differences, all Nordic countries have equalization systems that reduce inequalities substantially compared to the situation before equalization. This does not come as a surprise since the Nordics are known to emphasize equality in the provision of welfare services and equality between citizens and regions. At the same time, there are differences between the four countries with respect to the degree of equalization. It is not easy to explain why the systems have different impacts on spatial inequality. Above, we have suggested that the relatively high inequality in Norway reflects a more active regional policy that benefits rural areas, but there may be other explanations. One candidate is that preferences for equality and redistribution may differ between countries. This may highlight a broader point for the literature on spatial inequalities in public policies: Since countries have large discretion in the choices of municipal tax bases and equalization intensity, political will and intention to reduce (or increase) inequalities may be important. If politicians desire to shape spatial inequalities in public policies, it may be difficult to hold them back. Another possible explanation is that politicians have limited knowledge of the degree of equalization in their tax and equalization systems. This comparative analysis of the Nordic countries can make it easier to compare the systems and help politicians to make more informed decisions about spatial equalization.
Data availability statement
Replication materials are available in the Harvard Dataverse at https://doi.org/10.7910/DVN/CLUJAW (Etzerodt Reference Etzerodt2026).
Acknowledgements
We are grateful for comments from participants at the PEARL seminar in Brno, Czech Republic, and the Annual Conference on Taxation in Detroit, U.S.
Funding statement
Borge would like to thank the Norwegian Research Council for funding through the project Financing Local Governments: Determinants and Effects of Taxes and Grants (project number 255608). Etzerodt would like to thank the Obel Family Foundation for financial support.
Competing interests
The authors declare none.
Appendix A
Before and after equalization, 90/10 ratios, 2020

Appendix B
In Table 3 in the main text, we have documented the variation in tax bases and spending needs without saying anything about how they are related. Two factors are particularly important. The first is the case where some municipalities have substantially higher spending needs than tax bases, implying that they must have a very high tax rate or being very efficient to achieve a comparable service standard to other municipalities. Such a situation is characterized by large variation in spending needs among municipalities with a similar tax base. The second factor is the correlation between spending needs and tax base. If municipalities with high spending needs tend to have low tax bases, the case for equalization is amplified. On the other hand, if municipalities with high spending needs tend to have high tax bases, the case for equalization is weaker.
Figure B.1 shows scatter plots with per capita spending needs along the vertical axis and per capita tax base along the horizontal axis, and a linear regression line. The spending needs and tax base variables are normalized so that the value 1 equals each country’s mean. In all countries there is large variation around the regression line, which means there is large variation in spending needs among municipalities with a similar tax base. Moreover, in all countries except Norway, there is a clear negative relationship between tax base and spending needs. Consequently, the case for equalization is strong.
Scatter plot and regression line of tax bases and spending needs.
Note: Taxes subject to ordinary equalization. Five outliers are dropped from Norway (cases with normalized revenues above 3). The spending needs and tax base variables are normalized so that the value 1 equals each country’s average.


 Open access