


1. Introduction and motivation
The product life cycle (PLC) or its development model forms the basis for every development task. It describes all phases that a product goes through, from conception to end of life and reuse or recycling (Reference Bender and GerickeBender & Gericke, 2021). Requirements are defined for the product based on the modeled life cycle (Reference Bender and GerickeBender & Gericke, 2021) and product-related data is also organized within product life cycle management (PLM) (Reference StarkStark, 2020). These requirements may relate not only to customer use and the resulting product functions, but also to internal company requirements for the product – such as the ability to manufacture the product on existing production lines or to integrate core competencies in the form of specific operating principles. These requirements, which are not directly demanded by the customer, are known as “ilities” (Reference Weck, Roos, Magee, Vest and de WeckOliver L. de Weck et al., 2011) and are summarized in collections within “Design for X” (DfX) guidelines.
With the implementation of the circular economy, which essentially pursues the goal of extending life cycles (Reference Pal, Gaur, Raj, Gupta and TiwariPal et al., 2025), there is now a corresponding increase in the number of “ilities” to be considered. At the highest level, for example, guidelines such as Design for Circularity (DfCE) are becoming increasingly specific and range from Design for Remanufacturing to Design for Disassembly (and the improved “disassemblability” of the product after implementation).
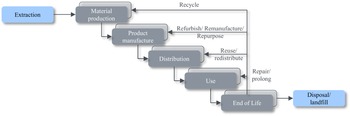
The modeling of all relevant phases of the PLC in the context of a given development task is the basis for the complete implementation of the requirements. According to the (German Institute for Standardization, 2017), the general life cycle is basically structured as follows: Individual phases of the life cycle are separated by conditions; activities take place within the phases in order to move from the initial condition to the condition of the next phase; and conditions can be work results (more likely in the early phases of development), but also time conditions or states of the product (e.g., end of life due to defect). Figure 1 shows the life cycle phases from a material perspective, which is the method of presentation usually favored for the life cycle of products within the circular economy (Reference Kreimeyer, Stölzle and DauschKreimeyer et al., 2025). The different R-strategies based on (Reference Kirchherr, Reike and HekkertKirchherr et al., 2017) are also integrated, as they are mainly used to describe different life cycle paths within the circular economy.
General life cycle in the context of circular economy

In order to derive and prioritize requirements in the form of DfCE criteria for a specific R-strategy, however, the life cycle has to be analyzed in more detail. This is also evident from statements made by interviewees in a meta-study on the topic of developing circular products (Reference Pfletschinger, Stölzle and KreimeyerPfletschinger et al., 2025), with practitioners not necessarily able to classify their products according to the R-strategies. The interviewees were asked to assign their products to individual R-strategies. They responded rather by describing life cycle phases and characterizing processes their products pass through. Many found it difficult to classify their own products according to the definition of R-strategies. It can be assumed that linking the R-strategies to the underlying life cycle phases and processes or detailing the life cycle phases promotes understanding and allows the relevant product requirements to be identified in the first place.
As engineers tasked with developing a product for a specific R-strategy, it is therefore necessary to translate R-strategies into defined life cycle phases and processes for which the product can be effectively optimized. The answer to this paper’s research question, “What phases do generic product life cycles involve in the context of R-strategies within the circular economy?,” forms the basis for a life cycle model that links R-strategies and operational circularity.
2. Research methodology
To answer the research question, the study was divided into two parts: First, a literature and product review was conducted to identify life cycle models – including their phases and processes – in the context of circular products. Second, based on the extracted life cycles and process models, a study was conducted to analyze specifics and derive insights from the various life cycles.
2.1. Research into life cycle models
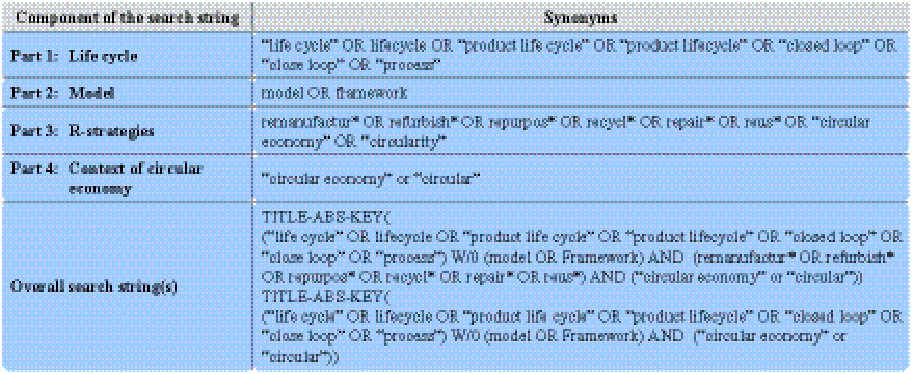
A systematic literature review was carried out to identify relevant life cycle models of circular products. The scope of the study was limited to complete life cycle models that consider the period from the end of life to reintegration into a new product life cycle. Literature that only considers individual phases (e.g., only the dismantling or only the reconditioning process of components) was not considered. Table 1 shows the cumulative search string that was used.
The literature search was carried out on Scopus. The titles, abstracts, and keywords of the papers were searched to obtain an extensive collection of relevant literature. No further restrictions such as the year or source type of the publication were used. The three filters that were applied to sort the identified publications are listed in Figure 2. The initial read-through only considered the title and keywords of these papers. Papers that were still viewed as relevant after reading the full article were taken into account for classification. Consideration was given to papers that included life cycles in the context of extending life (see classification of R-strategies within (Reference Kirchherr, Reike and HekkertKirchherr et al., 2017)): Reuse, Repair, Refurbishing, Remanufacturing, Repurposing, and Recycling. However, papers from the construction industry were filtered out because the life cycles and processes differ greatly from those of traditional mechanical engineering.
Ultimately, 555 scientific papers were found. After eliminating duplicates across the different search strings, a total of 462 independent sources remained. Reading the titles and keywords filtered out a large portion of these: 43 papers remained after the abstracts had been read, of which 16 included relevant models. It should be noted that some of the literature found includes several life cycle models, while others include only individual ones. Certain literature focused on a specific R-strategy, whereas others presented life cycle models with regard to several R-strategies. Figure 2 shows the number of papers that presented life cycle models regarding the respective R-strategies and the resulting number of life cycles models in brackets.
Breakdown of the search string

Circular products from the business sector were researched in order to extend beyond purely scientific literature. In research conducted online, press releases from companies describing their internal circular processes, videos documenting processes, and articles in magazines where journalists observed and described relevant processes were considered. A total of 13 additional products and corresponding life cycles were found, which were accumulated and classified in the following analyses.

2.2. Unification and modeling of life cycles
Due to the number of life cycles found, it was necessary to use a form of representation and modeling of the life cycles that would enable detection of all relevant life cycle characteristics – such as phase sequences, branches, or loops – to be identified using algorithms and, ideally, computer support. The DSM (Design Structure Matrix or, more approprately in the context of this paper, Dependency Structure Matrix) was therefore used as the modeling method (Figure 3 shows an example of transferring a life cycle to a DSM in the context of this paper).
The DSM generally represents relationships between two instances in a system. Applied to the product life cycle, these are the respective phases of the product life cycle and the procedural link between them. This link can be binary, i.e., existent or non-existent, but it can also be wider in the sense of exchanged information and so forth. In the context of the circular economy, it makes sense to specify the flow in terms of whether it comprises a product as a whole, components, or individual parts that certainly pass through processes within the PLCs. In other words, this constitutes the specification of a “product state” in the sense of a degree of assembly.
(Reference EppingerEppinger, 2012) presents various methods for matrix analysis. Matrix triangulation is particularly relevant in the context of life cycle analysis: Triangulation is a method for rearranging the rows and columns of a matrix so that entries are located as far as possible below the diagonal. If the process is strictly sequential without any branches, the DSM can be rearranged so that entries are located directly below the diagonal. Thus, one process follows the other, and so forth.
Using this matrix representation and manipulation method, the collected life cycles are analyzed in the following chapter and classified in a larger circular economy context. The primary operational objectives of the study can be derived from the methods presented:
-
• Derivation of generic life cycle phases depending on the R-strategies
-
• Analysis of the “importance” of different life cycle phases
-
• Analysis of a generic process sequence depending on the R-strategies
3. Findings
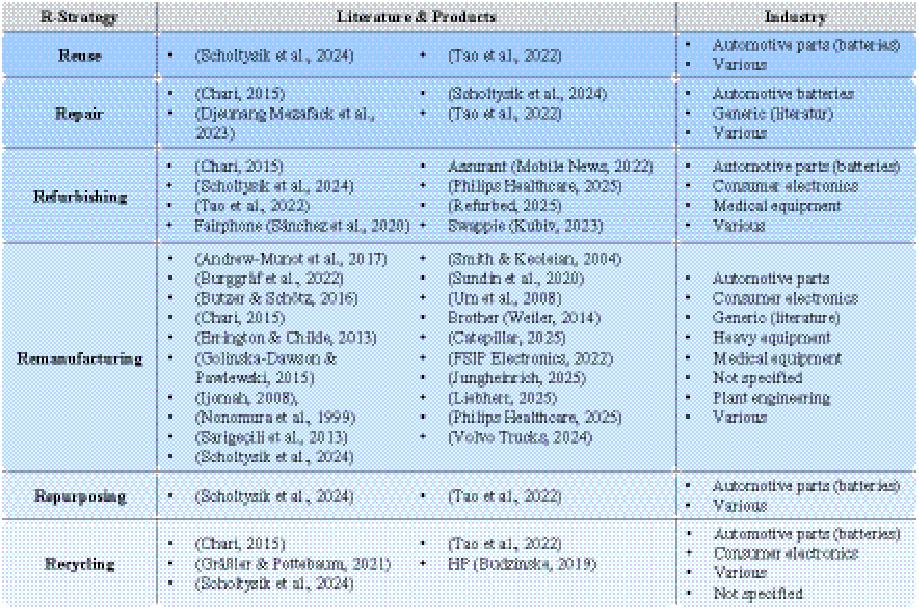
A total of 56 life cycles were found, of which 43 were from scientific literature. Table 2 shows the sources of the life cycles found, each assigned to the R-strategies. The classification of the respective authors was adopted in most situations, with only a few cases in which the authors’ own classification did not correspond to the definition of R-strategies according to (Reference Kirchherr, Reike and HekkertKirchherr et al., 2017). In these cases, the authors assigned the life cycles to the R-strategies. It was noted that most life cycle models were found in connection with remanufacturing, followed by life cycle models for refurbishing and recycling. Repurposing and reuse were not well represented in the literature or by products, with each only featuring two researched life cycle phases.
List of literature and products for life cycle models in context of circular economy

3.1. Life cycle analysis
To derive a generic list of all life cycle phases, all 56 life cycle models from the research were collated and a list of 158 independent life cycle phases was generated. This was followed by an examination of the independent phases for similarity and semantic equality in order to avoid duplicates and condense the actual content. For example, the phase “Reconditioning” was described in sources as “Reprocessing,” “Renewing,” or even “Reworking.” However, phases such as “teardown” could also be standardized to “disassembly to part-level” in the context of the source. The concretization of the phases regarding the product state was retained as specification of the relationship links within the DSM. As a result, the phases could relate either to the product, its components, or its parts. Figure 3 illustrates this approach using three examples.
From life cycle model to DSM: illustration of the generalizing and modeling of life cycles

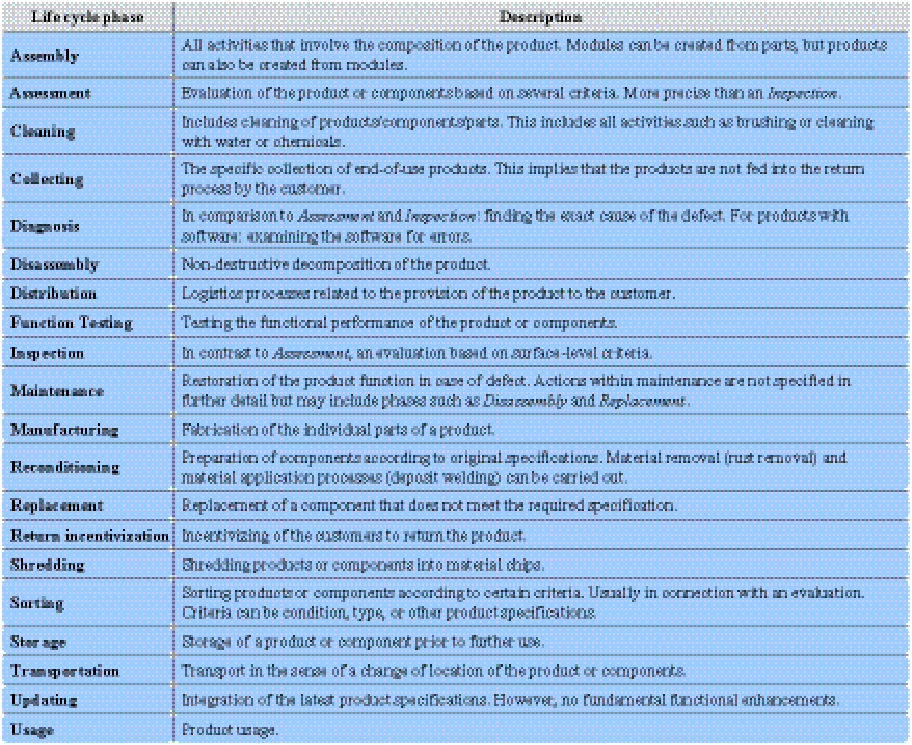
A total of 48 generic PLC phases were found, 20 of which occur in at least two life cycles. Table 3 lists these 20 generic PLC phases. It could be noted that the extracted life cycle phases are all described in a comparable manner – not necessarily in terms of an increasing number of modeled life cycle phases with R-strategies that have longer paths (e.g., reuse vs remanufacturing), but in the level of detail. Only the life cycles associated with recycling are described in greater detail, with the description often extending to the technical implementation of the recycling processes themselves (e.g., separating scraps with air or water and other chemical processes). The descriptions of the respective phases added to Table 3 are definitions derived by the authors based on the individual sources. They provide information on what has been summarized in each generic phase.
Some independent phases derived from the life cycles were only mentioned a few times or just once. Two categories were identified within these phases, namely industry-specific and source-specific phases. Table 4 shows the nine industry-specific phases, which are special processes that are only carried out in the relevant industries. Disinfection of medical devices and the erasing of data in consumer electronics are illustrative examples of this. Source-specific phases, on the other hand, were only present in certain sources, and in most cases represented either further specifications (“picking” within ‘assembly’) or generalizations (“remanufacturing process”) of other generic life cycle phases. 19 of these source-specific phases were found. These phases have been disregarded for the purposes of the study and comparability of the life cycles.
Generic PLC phases

Using the standardized phases, all “original” life cycles were revised and the independent phases were replaced by generalized phases. In addition, all life cycle phases prior to the use phase (if existent) were deleted in order to consistently compare only EoL life phases. These generalized and modified life cycles formed the basis for transferring the life cycles to matrix format.
Industry-specific PLC phases

3.2. Life cycle comparison
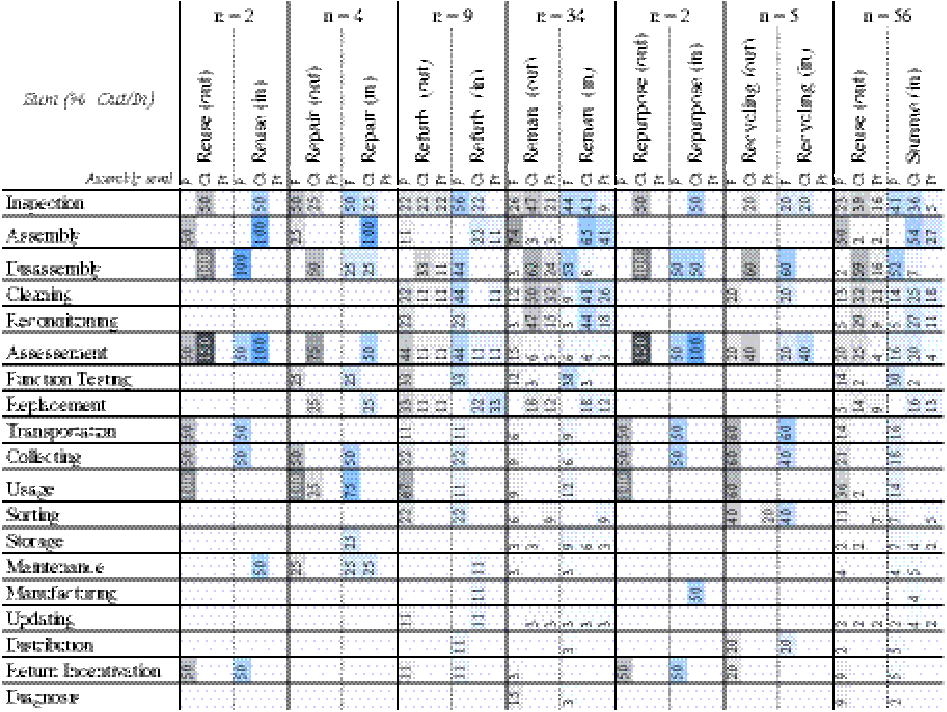
Table 5 shows the column totals (“out-degree”) and row totals (“in-degree”) of all individual R-strategies as well as the total across all researched life cycles in sum without assignment to a certain strategy. In addition, the data was divided according to the assembly level introduced in Figure 3. The percentages in the columns of the respective R-strategies also refer to the total of the life cycles analyzed within this strategy. The phases are sorted by number of overall mentions.
It should be noted that only a few of the life cycle phases are represented in all R-strategies (assessment, inspection, collecting, and disassembly). Transportation and return incentives are found in all R-strategies except repair. This makes sense in that the customer probably intends to keep the product when it is repaired. However, it is surprising that transportation for repair is always initiated by the customer in at least all four examined life cycles.
In general, refurbishing and remanufacturing seem to cover most of the life cycle phases. Cleaning, reconditioning, updating, and diagnosis are found exclusively in these two R-strategies. This is consistent with the general opinion that refurbishing and remanufacturing are the most complex R-strategies.
It should also be noted that some phases are listed as exceeding 100%. These phases are therefore repeated several times. Analyzing the individual life cycles, it is particularly noticeable in remanufacturing that the inspection or disassembly phase is repeated several times. This is because products are usually evaluated at the beginning of the process and again at the end – after reconditioning has been completed – to guarantee that they are free from defects. In some life cycles, the disassembly of products also takes place in steps from product to component and from component to part. However, disassembly to the component level occurs roughly three times more frequently than disassembly to the part level.
Number of mentions of life cycle phases regarding the respective R-strategies

By comparing the respective out/in degrees of the different life phases, it is possible to draw certain conclusions about the general position of the phases in the life cycle. If the total number of inputs is higher, this life phase tends to be at the end of a life cycle. The opposite is true for the number of outputs. However, considering not only the analytical observations but the individual life cycles themselves, meaningful conclusions can only be drawn in relation to cleaning, assessment, function testing, and sorting: Cleaning usually takes place in the first three phases but can also take place again after assembly. Comparing the evaluation phases of assessment, inspection, and function testing, the most extensive “assessment” usually takes place first. Inspection usually ensures quality after the reconditioning processes, and function testing usually concludes that the product is in perfect working order.
3.3. Generic life cycle model
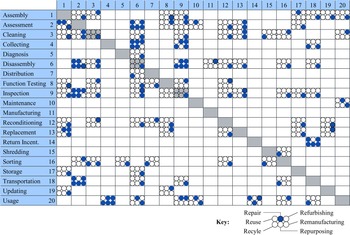
Figure 4 shows the summation of the modeled life cycles integrated into one DSM. The cells of the DSM each contain six circles, the fill level of which indicates whether or not there is a link between the life cycle phases involved. The circles are assigned to the R-strategies. The figure thus effectively shows six DSMs in one. It should be noted that no threshold was applied in terms of a required number of mentions of the relationship within the respective life cycles to be shown in the matrix. If a relationship is mentioned in one of the life cycles, it appears as a marker.
Complete DSM with life cycle phases and their links in dependence on the R-strategies

Figure 4 Long description
A matrix with 20 rows and 20 columns, each representing different life cycle phases and their links in dependence on the R-strategies. The rows and columns are labeled with phases such as Assembly, Assessment, Cleaning, Collecting, Diagnosis, Disassembly, Distribution, Function Testing, Inspection, Maintenance, Manufacturing, Reconditioning, Replacement, Return Incentive, Shredding, Sorting, Storage, Transportation, Updating, and Usage. The matrix uses a key to indicate different R-strategies: Repair, Refurbishing, Remanufacturing, Reuse, and Repurposing. Each cell within the matrix contains circles that are either filled in blue or left unfilled, indicating the presence or absence of a link between the corresponding life cycle phases and R-strategies. Notable trends include clusters of filled circles in specific areas, suggesting strong links between certain phases and strategies.
Neither the manipulation of the summation matrix nor of the six individual matrices of the respective R-strategy through matrix triangulation was successful due to the complex interconnections. The life cycles do not converge noticeably, and it was not possible to conclude that there is a superordinate universal life cycle in the form of a valid sequence of life cycle phases. Filtering the links by introducing thresholds so that links below a certain number of mentions are hidden only resulted in a significant reduction in the life cycle phases involved and thus did not serve the purpose of the investigation.
4. Discussion and outlook
Even though the evaluation does not allow for the derivation of a generic life cycle depending on R-strategies, it nevertheless yields interesting insights. On the one hand, life cycle phases were identified as significant for the various R-strategies within the circular economy. On the other hand, it was also possible to derive the relevance of certain phases for certain strategies.
There are limitations regarding the number of life cycles gathered. The reuse and repurpose phases are only minimally represented in the literature with generic and product-specific life cycle models. Examples of products related to these R-strategies are hard to find since, in the case of reuse, the phases are usually not performed by the manufacturing companies themselves but by smaller dealers (e.g., the used car market for automobiles or eBay). Repurpose seems to be generally under-researched, which could be due to the lack of predictability of corresponding reuse options and the resulting lack of widespread practice. It should be noted that the degree of granularity of the life cycles found is very similar. A more detailed investigation would probably not generate any further insights due to the highly divergent processes in each industry and product.
The results of this study can be applied in a variety of ways. On the one hand, the collective comparison represents a novelty in terms of the comparability of R-strategies at the life cycle phase level (and not just at the product state level). This can help developers optimize products in accordance with required R-strategies through corresponding DfX and more specific DfCE guidelines. In addition, the evaluation provides a basis for prioritizing conflicting requirements and design features of circular products.
However, the evaluation also shows that cycles become more complex as the number of processes increases and that this contribution provides a starting point but no product-specific evaluation for direct implementation.




 Open access

