



Introduction
Changes in air temperature with elevation due to adiabatic processes driven by the vertical movement of parcels of air are described by air temperature lapse rates. Lapse rates vary spatially and temporally due to differences in the relative humidity and vertical stability of air masses. Local lapse rates are determined by a combination of regional synoptic conditions and landscape-scale physiography (Dobrowski et al. Reference Dobrowski, Abatzoglou, Greenberg and Schladow2009). As air temperature is a fundamental variable in meteorology and bioclimatology, understanding lapse rates is important for the interpolation of air temperature between meteorological stations, particularly in areas of complex terrain, and for spatial modelling of biological phenomena such as species distributions, phenology and growing seasons. Lapse rates are also important for hydrological modelling and for downscaling global climate models (Dobrowski et al. Reference Dobrowski, Abatzoglou, Greenberg and Schladow2009). The present study examines lapse rates and cloud base levels on Macquarie Island as part of a broader project investigating the spatial distribution of plant species on the island.
Sub-Antarctic Macquarie Island (54.50°S 158.94°E) is 34 km long and 3–5 km wide. It has an undulating plateau with peaks reaching 420 m above sea level (a.s.l.) surrounded by steep slopes arising from narrow coastal plains. The climate of the island is at the extreme end of the oceanicity scale, being one of the few terrestrial environments on Earth with a continentality index < 0 (Currey Reference Currey1974). The climate is dominated by the Southern Ocean storm track with regular fronts accounting for at least 60% of precipitation (Wang et al. Reference Wang, Siems, Belusic, Manton and Huang2015). High humidity (mean 86%) and strong winds (mean 35 km h-1) occur year-round. Mean annual daily minimum and maximum temperatures are 3.1°C and 6.6°C. Rainfall at sea level typically occurs on 317 days per year with an annual mean of 1033 mm (1980–2010), increasing at ~65 mm decade-1 (Jovanovic et al. Reference Jovanovic, Braganza, Collins and Jones2012).
Cloud cover exceeds 80% over the Southern Ocean, mostly comprising boundary-layer cloud, while the less frequent frontal clouds (10–12% of cloud cover) are associated with higher precipitation intensity and hence higher total precipitation (Mace Reference Mace2010, Catto et al. Reference Catto, Jakob, Berry and Nicholls2012, Reference Catto, Jakob and Nicholls2013). Occult precipitation (i.e. fog deposition) is likely to be very important to the hydrology and ecology of Macquarie Island (Tweedie Reference Tweedie2000), where the tundra vegetation is dominated by large-leafed megaherbs, except in feldmark (Selkirk et al. Reference Selkirk, Seppelt and Selkirk1990).
Cloud base levels have not been directly measured on Macquarie Island, although Tweedie (Reference Tweedie2000) estimated cloud base levels using lapse rates and dew point temperatures from an altitudinal sequence of automatic weather stations, and Huang et al. (Reference Huang, Siems, Manton, Hande and Haynes2012) estimated frequency of cloud cover in altitude bands using sonde-derived relative humidity data.
Environmental lapse rates (air temperature lapse rates) are variable between locations (Table I) due to the effects of continentality, topography, synoptic weather patterns and localized phenomena such as cold air drainage, snow cover and sea breezes (Nunez & Colhoun Reference Nunez and Colhoun1986, Pepin Reference Pepin2001). Snow cover and cloud cover can also influence environmental lapse rates (Oke Reference Oke1987, Pepin & Norris Reference Pepin and Norris2005). For saturated air, the moist adiabatic lapse rate becomes steeper with decreasing air temperature (Barry Reference Barry1992). For example, the moist adiabatic lapse rate is ~0.55°C 100 m-1 at 10°C and ~0.6°C 100 m-1 at 5°C.
Lapse rates reported from other studies.

Macquarie Island provides a simple model environment for studying lapse rates at the oceanic extreme given the presumed lack of importance of confounding factors such as cold air drainage and sea breezes. The equable oceanic climate and strong persistent influence of synoptic winds means that lapse rates should be driven by airflow over the relatively simple but prominent topography, which is orientated more or less perpendicular to the prevailing winds (90.2% of winds at the meteorological station are from the westerly sector 180–360°). Low-level atmospheric stability due to the effects of topography on wind speed and air temperature may be important, as it will determine the magnitude of orographic lifting (Sarmadi et al. Reference Sarmadi, Huang, Siems and Manton2017).
The only detailed study of lapse rates on Macquarie Island examined the eastern (lee) slope of the island and suggested that western slope lapse rates (WLR) are probably less steep as the strong prevailing westerly winds create a pronounced föhn effect on the eastern slopes (Tweedie Reference Tweedie2000). We therefore expect a difference in lapse rates between opposite sides of the island due to adiabatic processes associated with orographic cloud and precipitation as the prevailing westerly air mass passes over the island's plateau.
Condensation associated with cloud or fog formation releases latent heat (Severini et al. Reference Severini, Tonna, Moriconi and Olivieri1986), which warms the surrounding air, reducing the environmental lapse rate. Therefore, we expect to see a signal in the air temperature elevation profile to indicate the presence of low cloud or fog. Lapse rates should be gentler under conditions of low cloud (Pepin et al. Reference Pepin, Benham and Taylor1999). Previous studies on the relationship between cloud base level and lapse rates have derived an estimated height of the cloud base from observed dew point data (Pepin et al. Reference Pepin, Benham and Taylor1999, Tweedie Reference Tweedie2000). In the present study, we utilize an archive of webcam images to provide observational data for the cloud base level.
We examine lapse rates on a transect across Macquarie Island in order to determine spatial and temporal patterns in air temperature and four possible drivers of these: solar radiation, synoptic weather systems, cloud cover and low-level atmospheric stability. We also test whether free air lapse rates from radiosonde data can be used as a proxy for terrestrial lapse rates. Furthermore, we investigate whether an altitudinal series of air temperature observations can predict cloud cover.
Methods
Air temperature
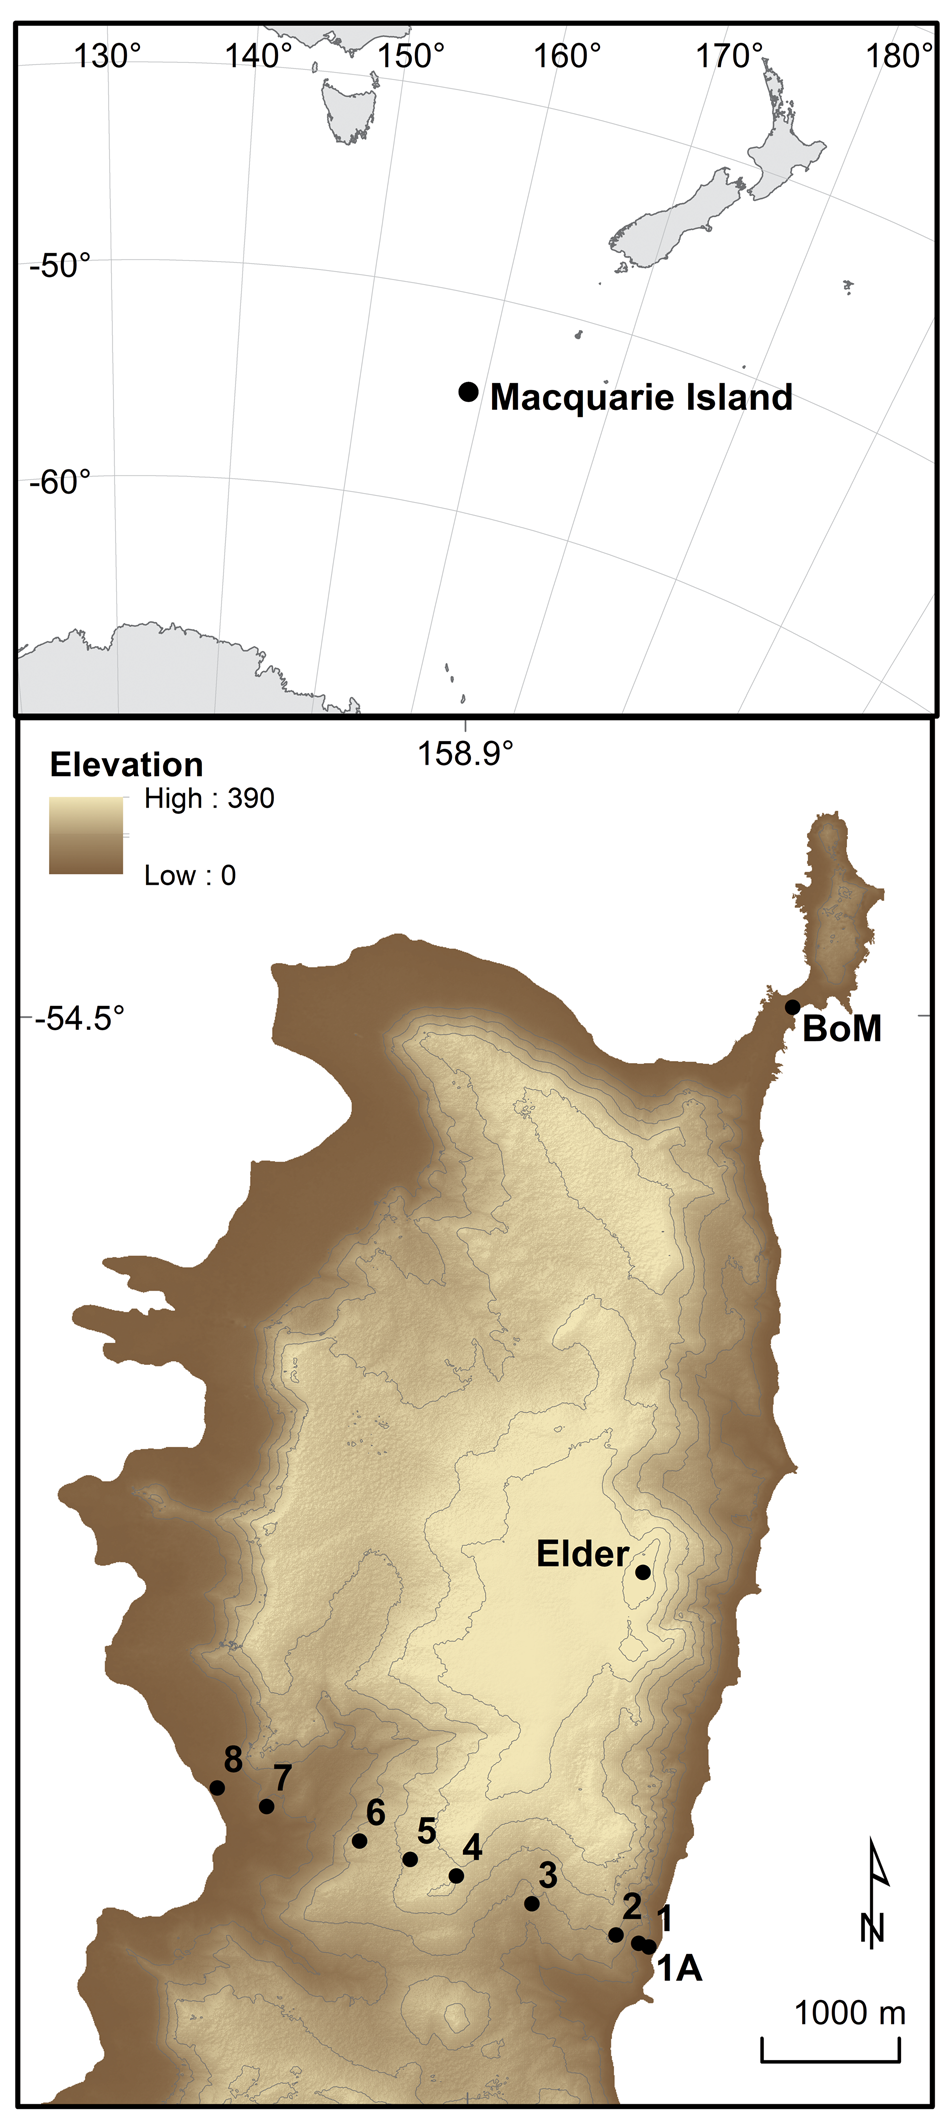
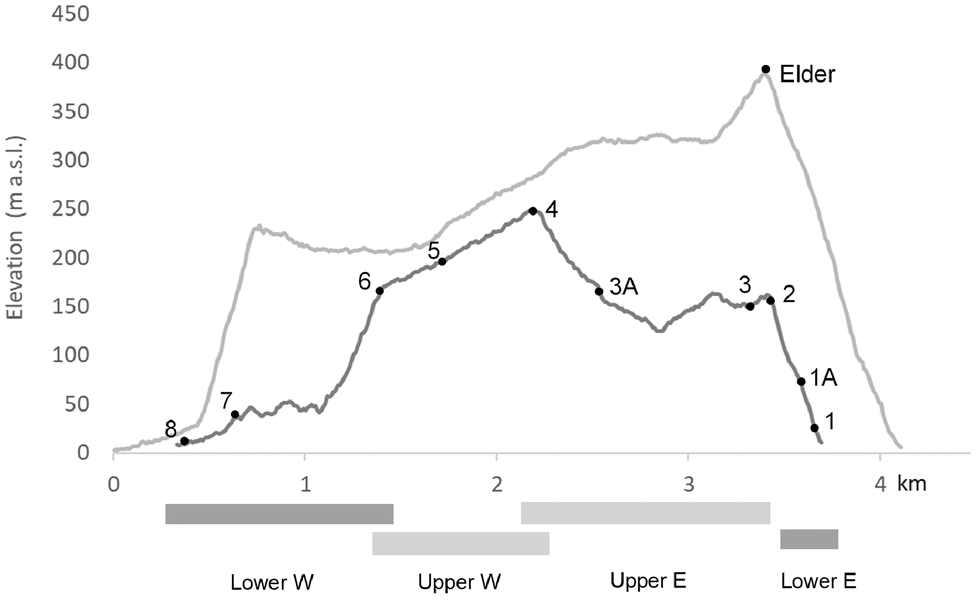
We used LogTag temperature loggers (model TRIX-16, LogTag Recorders Ltd, Auckland) placed inside waterproof polycarbonate cases (LogTag Recorders Ltd, Auckland) mounted on posts at a height of 1 m above ground level, with no solar radiation screening. The loggers were located along a transect crossing the main axis of Macquarie Island from the west to east coasts (Figs 1 & 2). This transect has been used for previous studies of wind exposure, vegetation communities and geomorphology (Peterson & Scott Reference Peterson and Scott1988, Scott & Comfort, unpublished data 2016). One logger was located 2 km north of the transect at the highest point in the northern half of Macquarie Island, the summit of Mount Elder (385 m a.s.l.), because this location provides a higher elevation than the transect and replicates a site used in a previous study of lapse rates (Tweedie Reference Tweedie2000).
Location of temperature logger sites at the northern end of Macquarie Island; 50 m contours shown.
Elevation profile of Macquarie Island transect (see Fig. 1) with temperature logger locations. Pale grey profile shows the location of the Mount Elder logger. Slope segments are shown below the profile.
Loggers were synchronized to record temperature hourly. Prior to field deployment in August 2014, all 11 loggers were stored together for 8 weeks to determine variation in temperature readings between individual loggers. Loggers were retrieved in March 2016. During the study period, the logger at Site 2 fell off its post and the Site 1A logger malfunctioned. These anomalous data were omitted from analyses.
A dataset of hourly observations of meteorological data from Macquarie Island Station of the Commonwealth Bureau of Meteorology (BoM) was obtained. One logger was placed in the BoM instrument enclosure, mounted without a screen and at the same height as our other loggers, to allow comparison between the logger record of temperature and the official meteorological data.
The BoM provided a dataset comprising atmospheric observations at various elevations from radiosondes launched twice daily, at 09h00 and 21h00 Macquarie Island time (UTC + 10 h). For each radiosonde flight during the period in which temperature loggers were deployed, we calculated the environmental lapse rate at Macquarie Island, using all air temperature observations below 400 m a.s.l., to compare with the logger data.
Cloud base level
The Australian Antarctic Division maintains a webcam at Macquarie Island Station facing south and capturing a profile image of the northern end of the island's plateau at 5 min intervals. Archived webcam images were obtained for the period in which LogTag data were collected to determine cloud base levels relative to the topography of the island.
Highly variable lighting and confounding factors such as moisture on the camera lens made automated image analysis using histogram comparison methods impractical. Instead, manual analysis of a random sample of images from the study period was undertaken. To enable comparison with temperature data, we selected only those images captured within 2 min of the hourly temperature logger observations, then analysed a random sample of this subset (50 random samples per month, n = 600). Using a graticule superimposed on the images, we manually classified each image using four categories of cloud base level (Fig. 3). The lowest level of cloud was consistent with the meteorological definition of fog (i.e. visibility < 1 km) at sea level. Images too dark or blurry to classify were excluded. We continued to randomly sample and manually classify images until we had at least 50 images scored for cloud base level in each month. This random sampling stratified by month provided a final dataset of 600 images (50 per month).
Examples of webcam images from Macquarie Island Station looking south towards Perseverance Bluff. a. High cloud (cap or crest clouds), b. medium cloud base level, c. low cloud base level and d. sea-level cloud (i.e. fog).

Data analysis
We identified outliers in the LogTag data using median absolute deviation (MAD) and accounted for the asymmetric distribution of outliers (i.e. mostly high temperatures) by calculating MAD separately for values lower and higher than the median. As the median temperature varies seasonally, we applied MAD monthly to each logger dataset. Outliers, defined as those values greater than two deviations from the median, were replaced with no data (n = 5833 or 4.9% of the data). Datasets with outliers removed showed little difference in median values from the original datasets.
The 12 month period with the most complete data (August 2013–August 2014), which has missing data from one logger (Site 1A) for the last 2 months, was used for most lapse rate calculations.
Annual average lapse rates were calculated for each of the western and eastern slopes. Although not on the transect, Mount Elder was included as a data point in each slope series in order to extend the elevation sequence to one of the highest points on the island.
Hourly lapse rates were calculated for the western and eastern slopes. To investigate differences in lapse rates between upper and lower slopes, as these may be related to cloud level, we calculated four different lapse rates for each hourly temperature observation using three to four data points for each (but not including Mount Elder): lower west slope (5–165 m a.s.l.), upper west slope (165–260 m a.s.l.), lower east slope (10–150 m a.s.l.) and upper east slope (130–260 m a.s.l.) (see Fig. 2).
Monthly lapse rates were calculated for the 18 months in which recording took place (with missing data for two loggers in the later months). Diurnal patterns were investigated by calculating lapse rates for daytime (10h00–15h00 local time) and night time (22h00–03h00). To investigate seasonal differences in lapse rates, we plotted air temperature and elevation for January (summer) and July (winter). Analysis of variance (ANOVA) was used to test for differences between monthly lapse rates and spatial differences between eastern and western slopes. Multiple linear regression and the Pearson correlation coefficient were used to examine the relationship between each pair of eastern, western and free air (radiosonde) lapse rates.
To investigate seasonal variation in air temperature with location, we determined the difference between lowest and highest mean monthly temperature for each logger over a 12 month period (excluding Site 1A, which had incomplete data) and performed linear regression with elevation as the explanatory variable for all sites and east and west slopes independently.
To examine potential synoptic-scale drivers of lapse rates, we classified weather patterns based on sonde data. Sonde-recorded air temperature, air pressure, relative humidity, wind speed and wind direction were binned into two altitude classes, representing the lower and upper elevations of Macquarie Island: 8–200 m and 201–400 m. Mean values were calculated where more than one observation occurred within an altitude class, while sonde flights in which no data were recorded within an altitude class were excluded from further analysis. Hierarchical clustering using Ward's method identified three distinct groups, which were tested for independence based on each of the eastern and WLR where simultaneous data were available.
Weather conditions and daily and annual cycles might influence cloud base level, so we tested time of day (1–24 h), month and meteorological variables from the BoM station (air temperature, dew point, relative humidity, wind speed, wind direction and mean sea-level pressure (MSLP)) as predictors for the five categories of cloud base level (including no cloud) using linear discriminant analysis, which incorporates potential interactions between variables. The relationship between each individual meteorological and time variable with cloud base level was tested using ANOVA (with a circular statistics implementation of ANOVA for time and month; https://r-forge.r-project.org/projects/circular).
To quantify low-level atmospheric stability, we calculated the Froude number using radiosonde-derived lapse rates, as these are representative of free air conditions. Observed air temperature and wind speed at launch (6 m a.s.l.) and temperature lapse rate at < 400 m a.s.l. were used to calculate the Brunt-Väisälä frequency, natural wavelength and, subsequently, Froude number (Stull Reference Stull2000). The Pearson correlation coefficient was computed in order to assess the correlation between Froude number and each of the east and west slope lapse rates. ANOVA was used to test for independence between Froude number and cloud level classes, as atmospheric stability influences the formation of orographic cloud. Data analysis and statistics were performed in R v.3.4.1 (http://www.r-project.org).
Results
Lapse rates
Correlation coefficients for all possible pairs of LogTags during the 8 week calibration period were > 0.998, with mean temperature ± 0.67°C. The LogTag recorder located at the BoM weather station had a median air temperature of 5.4°C compared to the BoM median of 5.1°C for the same period. LogTag data were consistent with the station at lower air temperatures but show some deviation at higher temperatures, at which the logger frequently had higher readings than the BoM temperature probe. LogTag readings that notably exceeded synchronous BoM readings occurred in the daytime in summer, most often when cloud cover (measured in oktas at the BoM station) was low, which suggests the LogTag unit was heated above ambient air temperature by direct solar radiation.
A linear fit approximated lapse rates for the western slope and eastern slope (Fig. 4). Including the data from Mount Elder improved the fit marginally for the western slope and notably for the eastern slope (Table II). On the western slope, the annual range of mean daily temperature was ~6°C between January and July throughout the elevation profile, resulting in similar lapse rates in January and July (Fig. 5a), while January lapse rates were steeper than July lapse rates on the eastern slope (Fig. 5b).
Mean annual temperature for 10 data loggers on a transect across Macquarie Island. Fitted lines are mean annual lapse rates for eastern (adjusted R 2 = 0.8155) and western slopes (adjusted R 2 = 0.9771). Note that the two highest loggers were shared by both slopes.

January 2015 (filled circles) and July 2015 (triangles) mean monthly air temperature (± SE) recorded at each logger with lapse rates plotted as a linear regression. a. western slope; b. eastern slope.

Lapse rates determined from mean air temperature over 18 months along altitudinal transect (with and without the highest logger at Mount Elder), showing R 2 for the linear relationship between altitude and air temperature.

Mean lapse rates varied significantly by month on both eastern and western slopes (Table III). Median lapse rates for the western slope varied between months, but with no distinct seasonal pattern evident, and with June appearing slightly anomalous (Fig. 6a). In contrast, the median lapse rates on the eastern slope displayed a seasonal trend, with steeper rates in summer months (Fig. 6b). Variability of lapse rates increased in the summer months on the eastern slope, while no seasonal pattern occurred on the western slope (Fig. 6). Sonde data showed no pattern in monthly median values, but, like the eastern slope, they generally exhibited more variability during the summer months (Fig. 7). The mean lapse rate from sonde data was 0.78°C 100 m-1.
a. Western slope and b. eastern slope hourly lapse rates over 12 months. Extreme outliers not shown.

Monthly free air lapse rates < 400 m above sea level at Macquarie Island determined from twice-daily radiosonde data, 1995–2017. Extreme outliers not shown.

Relationship between lapse rate variables and predictors (analysis of variance results).

The highest and lowest monthly mean rates for the WLR both occurred in December, with 0.91°C 100 m-1 in December 2014 and 0.69°C 100 m-1 in December 2015 (equal to the February 2016 rate). The eastern slope lapse rate (ELR) had a summer maximum of 1.15°C 100 m-1 in December 2014 and a winter minimum of 0.478°C 100 m-1 in August 2015.
Differences between daily minimum and maximum temperature lapse rates were notable on the eastern slope, whereas WLR showed little diurnal variation (Fig. 8). The diurnal lapse rate cycle for the eastern slope had a greater range in summer when daytime lapse rates were much steeper than at night, whereas in winter there was little difference (Fig. 8). Daily minimum and maximum temperature lapse rates averaged over 12 months were 0.495 and 1.029°C 100 m-1 for the eastern slope and 0.791 and 0.931 °C 100 m-1 for the western slope, respectively.
Mean hourly lapse rates for the eastern and western slopes.

Simultaneous hourly lapses were weakly correlated between all three elevation profiles: ELR, WLR and the open air (linear regression, P < 0.0001; Pearson correlation coefficient 0.23–0.28). Although correlated, lapse rates differed between east and west slopes (t = 23.771, P < 0.001). ELR generally exceeded WLR during the middle of each day (Fig. 9).
Relative frequency of cloud cover on Macquarie Island classified from webcam images. Cloud higher than the island or absence of cloud is classified as ‘clear’. See Fig. 3 for images of cloud base levels. S.L. = sea level.

No significant trends in the annual range of mean monthly air temperature with elevation were observed. Positive lapse rates, indicating temperature inversions, were very rare, accounting for 1.5% of hourly lapse rate observations for ELR and 0.2% for WLR.
Clustering of sonde data (n = 2547) revealed three broad meteorological conditions based on visual inspection of the dendrogram: 1) north-westerly airflows with high wind speeds, air temperatures and humidity (38% of observations), 2) westerly airflows with moderate wind speeds and lower air temperatures and humidity (49%) and 3) airflows from other directions characterized by lower wind speeds and moderate air temperatures and humidity (13%). Lapse rates derived from logger data showed no significant difference between these three weather regimes (ANOVA, eastern slope F = 1.488, P = 0.227; western slope F = 2.21, P = 0.142; n = 76).
Atmospheric stability (Froude number) was not strongly related to eastern slope (Pearson correlation coefficient = -0.292) or western slope (Pearson correlation coefficient = -0.133) lapse rates (n = 741). In both cases, steeper lapse rates were associated with higher Froude numbers, which indicate orographic lifting and leeward turbulence.
Cloud base level
Cloud obscured at least part of Macquarie Island's topography in just over half of the webcam images (Fig. 9). In approximately half of these instances of cloud at island level (~25% of all images), cloud was confined to the higher plateau and peaks (~250 m a.s.l. and higher).
Cloud base level shows a relationship with all tested meteorological variables other than wind direction (Fig. 10 & Table IV). Low cloud is generally associated with higher air pressure and air temperature and lower wind speeds (Fig. 10). Cloud base level varies between months, with no clear seasonal pattern (data not shown), and does not vary diurnally (Table IV). Linear discriminant analysis was unable to separate the cloud cover classes, as they overlapped strongly in environmental space rather than reflecting discrete combinations of weather variables.
Meteorological variables recorded at the Bureau of Meteorology under various cloud conditions.

Results of analysis of variance tests for five classes of cloud level. Variables are annual (month) and diurnal (hour) cycles and meteorological observations from the Bureau of Meteorology station at sea level.

Only the lower WLR showed a significant relationship with cloud base level (Table III). The difference between upper and lower slope lapse rates was also related to cloud cover classes on the western slope (Table III). Lapse rates did not vary with cloud cover classes on the western slope (Fig. 11). Cloud base level appears to be independent of low-level atmospheric stability (ANOVA, F = 0.922, P = 0.344; n = 39).
a. Eastern slope and b. western slope lapse rates under various cloud conditions (n = 600). Cloud-cover classes: clear = no low cloud (cloud base > ~400 m above sea level (a.s.l.)), high = cloud limited to higher peaks (cloud base > ~250 m a.s.l.), medium = most of plateau under cloud (cloud base > ~150 m a.s.l.), low = cloud covering most of vertical extent of island (cloud base > ~70 m a.s.l.), sea level = cloud at sea level. Extreme outliers not shown. S.L. = sea level.

Observations of cloud base level from webcam imagery were necessarily limited to the period from dawn to dusk and therefore may be subject to bias associated with diurnal cycles. While there was no significant relationship between time of day (ANOVA, F = 2.677, P = 0.102) and cloud base level in our dataset, we cannot be certain that our daylight observations are representative of cloud base levels during periods of darkness. In most cases we observed the presence of cloud at higher levels than the cloud base level, and in no cases was a low cloud base level observed in which cloud was visibly absent at a higher elevation. Consequently, where low cloud obscured the visibility of the higher elevations of the island, we assumed that cloud cover was present at all higher elevations, but we acknowledge that in rare cases the vertical extent of cloud cover may have been limited such that the higher elevations of the island were cloud free.
Discussion
Lapse rates
The observed mean lapse rates of ~1.0°C 100 m-1 are similar to most previous estimates from Macquarie Island (Taylor Reference Taylor1955, Jenkin Reference Jenkin1972, Davies & Melbourne Reference Davies and Melbourne1999; see Table I). However, Tweedie (Reference Tweedie2000) determined a mean ELR of ~0.6°C 100 m-1 and predicted a shallower rate on the (unmeasured) western slope due to a putative föhn effect on the eastern (lee) slope. While our results indicate steeper lapse rates on the eastern slope, the difference is very small (0.068°C 100 m-1). Temperature data and cloud formations indicate frequent and strong föhn winds on the eastern (lee) side of sub-Antarctic Heard Island, which has more than five times the vertical relief of Macquarie Island (|Thost & Allison Reference Thost, Allison, Green and Woehler2006). Based on 1 month of observations on the eastern slope of Macquarie Island, Davies and Melbourne (Reference Davies and Melbourne1999) noted a much steeper lapse rate on the lower slope (< 150 m a.s.l.) than the upper slope, while our data show no such inflection.
Macquarie Island lapse rates are considerably steeper than those typically reported for mid-latitude oceanic climates, such as Mount Wellington in Tasmania and the Pennines in Britain, which show considerable monthly and seasonal variation in lapse rates (Table I).
Mountains with more continental climates also typically display lapse rates close to the moist adiabatic lapse rate (0.4–0.6°C 100 m-1), as in the European Alps and central China (Table I). In the Rocky Mountains at 52°N, representing a continental climate at a similar latitude to Macquarie Island, annual mean lapse rates are only ~0.4°C 100 m-1, due in part to the moderating influence of frequent temperature inversions, but with little increase in summer (Diaz & Bradley Reference Diaz and Bradley1997).
As cool, moist conditions generally produce shallower lapse rates (e.g. Ashcroft & Gollan Reference Ashcroft and Gollan2013), it is surprising that Macquarie Island's uniformly cool, moist climate supports steep mean lapse rates. Steep mean lapse rates (0.98°C 100 m-1) have been reported from the sub-Antarctic, on a glacier on the lee side of South Georgia in the summer months (Smith Reference Smith1960). In contrast, mean lapse rates at Marion Island, with a sub-Antarctic climate comparable to Macquarie Island, are ~0.4–0.5°C 100 m-1 (Hedding Reference Hedding2006). Lapse rates for the internal temperature of Azorella selago cushion plants on Marion Island varied between four altitudinal transects (0.31–0.61°C 100 m-1 in winter, 0.51–0.72°C 100 m-1 in summer), with no consistent difference between western (windward) and eastern (lee) slopes (Nyakatya & McGeoch Reference Nyakatya and McGeoch2007). Heard Island has similar lapse rates to Macquarie Island, but they differs seasonally, with steeper rates in winter (Table I).
Solar radiation has daily and annual cycles, with steeper lapse rates associated with greater insolation in daylight periods and in summer (Pepin et al. Reference Pepin, Benham and Taylor1999). These associations fit our observations of diurnal and annual variability in lapse rates and suggest that terrestrial lapse rates on Macquarie Island may not be representative of free air lapse rates over the Southern Ocean. On the western slope, a greater influence of the prevailing winds and orographic lifting may override local convection. The influence of solar radiation on air temperature may be accentuated in our study by direct heating of the temperature loggers due to a lack of radiation screening. However, we removed outliers from the temperature dataset.
Seasonal patterns of steeper lapse rates in summer and gentler lapse rates in winter observed in the present study for the eastern slope are consistent with previous work on Macquarie Island (Tweedie Reference Tweedie2000), in central Europe (Rolland Reference Rolland2003), in the maritime mid-latitude Cascade Mountains (Minder et al. Reference Minder, Mote and Lundquist2010) and in subtropical Taiwan (Chiu et al. Reference Chiu, Lin and Tsai2014). However, mean free air lapse rates at Heard Island, measured by radiosonde, are steepest in September–October (0.79°C 100 m-1) and lowest in January–February (0.62°C 100 m-1) (Allison & Keage Reference Allison and Keage1986).
The outlying mean lapse rate for December 2014 fits the seasonal pattern of a summer maximum but is notably higher than in any other summer months, yet there are no anomalies in the meteorological variables to explain this result. Our analysis provides some indication of seasonal trends in lapse rates, but we note that data collected over a longer period than 12–18 months would be more robust in relation to interannual variation. Apart from the discrepancy between December 2014 and December 2015, other months displayed similar or less interannual variation than the variation between contiguous months.
Our observations of seasonal variation in ELR (0.864°C 100 m-1, or 0.52°C 100 m-1 after removing outlier) is much higher than previously reported (0.3°C 100 m-1) for the eastern slope of the island 2 km north of our transect (Tweedie Reference Tweedie2000). However, seasonal variation on the western slope in this study (0.25°C 100 m-1) is close to that reported by Tweedie (Reference Tweedie2000) for the eastern slope. The seasonal variation in lapse rates on Macquarie Island is low compared to more continental mountains, where temperature inversions tend to influence winter lapse rates (Rolland Reference Rolland2003, Blandford et al. Reference Blandford, Humes, Harshburger, Moore, Walden and Ye2008, Minder et al. Reference Minder, Mote and Lundquist2010). Positive lapse rates associated with temperature inversions were rare on Macquarie Island, where they are relatively more frequent for ELR than WLR.
The less distinct seasonal trend for WLR may be due to the strong influence of orographic lift related to the westerly airflow overriding any effects of solar radiation on air temperature. However, WLR varies independently of wind speed. Furthermore, Peterson and Scott (Reference Peterson and Scott1988) suggest that local patterns of wind flow on Macquarie Island, such as windward rotors, respond to topography.
The diurnal increase in lapse rates in summer occurs earlier on the east-facing slope (see Fig. 8), suggesting that surface heating from solar radiation shifts near-ground temperatures above the free air lapse rate. This supposition is supported by the differential between simultaneous lapse rates on each slope, which is strongly related to time of day, time of year and air temperature (and is mostly driven by fluctuations in ELR) and by previous observations from Macquarie Island's eastern slope (Tweedie Reference Tweedie2000). Differences in cloud cover between the two slopes may also be influential, with potentially greater cloud cover on the western slope. However, Wang et al. (Reference Wang, Belusic, Huang, Siems and Manton2016) modelled higher rainfall on the downwind (eastern) side of Macquarie Island, suggesting more cloud cover on the eastern slope.
Tweedie (Reference Tweedie2000) found strong correlations between meteorological data from an altitudinal transect on the eastern slope of Macquarie Island and the data from the BoM station. Therefore, the BoM data are a useful proxy for synoptic weather patterns, as weather variables such as wind direction, air temperature and MSLP are largely driven by synoptic conditions. We found limited explanation for changes in lapse rates based on meteorological data (from both the BoM station near sea level and the boundary layer to 400 m altitude), suggesting that synoptic conditions have little influence on lapse rates at Macquarie Island, which may be better explained by physiographic factors.
Sea-level air temperature and relative humidity are related to lapse rates, as they reflect atmospheric processes of convection and latent heat flux. Atmospheric pressure relates to the vertical movement of air masses, which influence lapse rates at a synoptic timescale (Blandford et al. Reference Blandford, Humes, Harshburger, Moore, Walden and Ye2008). Surprisingly, given our expectation that MSLP would represent the passage of circumpolar cyclones and associated fronts (i.e. synoptic-scale processes), there was not a strong relationship between MSLP and lapse rates (data not shown). As with our data, Blandford et al. (Reference Blandford, Humes, Harshburger, Moore, Walden and Ye2008) found that lapse rates related less to humidity than to air temperature.
The relationship between atmospheric stability and lapse rates is consistent with mountain wave behaviour as air masses with vertical stability or weak winds (low Froude number) are blocked by the topography of the island, resulting in shallow lapse rates, while strong winds with large wavelengths (high Froude number) promote orographic lifting on the windward slope and turbulences, with potential reverse flow upslope on the lee slope (Lin & Wang Reference Lin and Wang1996; Bao & Tan Reference Bao and Tan2012).
Snow cover can influence near-surface air temperature (Pepin & Norris Reference Pepin and Norris2005), and consequently variable snow cover might affect lapse rates. A lack of data for snow cover on Macquarie Island precludes consideration of this factor.
Cloud cover
The strong relationship between cloud level and atmospheric pressure indicates that synoptic-scale processes are the dominant determinants of cloud base level in the atmospheric boundary layer at Macquarie Island. Observations of cloud cover from webcam images show that the higher peaks of Macquarie Island (> ~300 m a.s.l.) experience cloud cover for ~50% of the time by one of two mechanisms. Discrete cloud confined to peaks or plateau (cap or crest clouds, respectively) are indicative of orographic clouds formed by the cooling of upslope winds. Macquarie Island provides exceptionally good conditions for orographic cloud formation, presenting a steep barrier up to 400 m a.s.l., mostly perpendicular to the strong prevailing winds that drive the uplift of moist air. Less frequently, the cloud base extends to sea level, representing low-level stratus cloud (fog), which is associated with relatively warm, moist, northerly airflows and occurs on ~70 days per year (Streten Reference Streten1988).
The lowest cloud base levels were associated with more north-westerly (rather than westerly) winds with slightly lower wind speeds and higher air temperatures than under more elevated cloud. These associations are consistent with low stratus cloud formed by the cooling of relatively warm pre-frontal north-westerly or northerly air masses driven by a blocking anticyclone system (Streten Reference Streten1988). The relatively high air pressure and temperature associated with low cloud is consistent with this phenomenon but, surprisingly, given the directional component to these weather systems, wind direction is not strongly related to cloud base level.
Intermediate cloud base levels may represent either orographic or synoptic (e.g. stratus or stratocumulus) cloud. On Heard Island, at a similar latitude to Macquarie Island (53°S), oxygen isotope ratios from snow indicate that orographic processes dominate precipitation (Allison & Keage Reference Allison and Keage1986). On Macquarie Island, high-resolution climate models suggest orographic forcing results in higher precipitation on the lee side than the windward side of the island under both drizzle and frontal conditions (Wang et al. Reference Wang, Belusic, Huang, Siems and Manton2016).
Our observations concur with previous studies using other methods to describe cloud base levels on Macquarie Island. Cloud base height estimated from recorded air temperature, dew point and lapse rate has mean monthly values of ~220–340 m a.s.l. (Tweedie Reference Tweedie2000).
Median cloud base level at 09h00 at Macquarie Island Station is 300 m a.s.l. (Bergstrom et al. Reference Bergstrom, Bricher, Raymond, Terauds, Doley and McGeoch2015). The height range of 260–500 m a.s.l contains the highest frequency of cloud cover determined from Macquarie Island sonde data (Huang et al. Reference Huang, Siems, Manton, Hande and Haynes2012). Similarly, typical cloud base levels are ~300 m a.s.l. on other Southern Ocean islands, such as Heard Island (Thost & Allison Reference Thost, Allison, Green and Woehler2006) and King George Island (Bitanja Reference Bitanja1995).
On sub-Antarctic Marion Island, Nyakatya and McGeoch (Reference Nyakatya and McGeoch2007) hypothesize that less seasonal variation in substrate temperatures on the western side and at higher elevations is due to more frequent cloud cover than occurs at lower elevations and on the eastern side of the island. Macquarie Island also has a higher frequency of cloud at higher elevations, yet we found no support in our observed annual range of mean monthly air temperature for an associated lower seasonal variation in air temperature.
In Britain, Pepin et al. (Reference Pepin, Benham and Taylor1999) observed steeper lapse rates with a more elevated cloud base level, attributing this effect to higher solar radiation and lower humidity. However, apart from the lower segment of the western slope, our results do not support the suggestion of Tweedie (Reference Tweedie2000), based on eastern slope data, that lapse rates generally increase with higher cloud base level. Indeed, our ELR values were consistent across all categories of cloud cover. The constant high humidity regardless of cloud cover, which is characteristic of Macquarie Island's climate, may explain this lack of a relationship between cloud base level and lapse rates.
Conclusions
To the best of our knowledge, this work is the most detailed study of environmental lapse rates in a hyper-oceanic climate and the first to compare annual environmental lapse rates on various aspects of a sub-Antarctic island. Our use of webcam imagery to determine cloud base level and our attempt to determine cloud base level from lapse rates we also believe to be novel and relevant to other regions. The weak correlation between sonde-derived lapse rates and those recorded at 1 m above the surface of the island suggests that free air lapse rates are not a useful proxy for terrestrial lapse rates for ecological applications.
Our observations of lapse rates on the eastern slope of Macquarie Island are consistent with diurnal and annual variation in solar radiation. However, lapse rates on the western slope do not show a similar pattern and appear to be largely decoupled from both daily and annual solar radiation cycles. The main differences between the slopes are greater wind exposure and later daily direct sun on the western slope. Diurnal and seasonal patterns in lapse rates are relevant to vegetation microclimates and climate change scenarios, including altitudinal migration of vegetation communities in response to atmospheric warming.
Despite a modest elevation range, compared to other sub-Antarctic islands and to continental massifs, Macquarie Island's location in an oceanic context with almost constant vigorous movement of humid air drives the frequent development of orographic cloud. Combined with a similar frequency of low cloud and precipitation related to synoptic processes, the highlands of Macquarie Island experience cloud cover for approximately half the time, with no seasonal or diurnal pattern.
The year-round dominance of westerly airflows and limited seasonal variation in air temperature and humidity explain the general lack of seasonal patterns in cloud cover or lapse rates in this study. Environmental lapse rates on Macquarie Island are generally not closely related to cloud coverage. Both environmental lapse rates and cloud cover, along with wind exposure, provide an explanation for the altitudinal zonation of plant species and communities on Macquarie Island.
Acknowledgements
Chris Howard and Paul Helleman (Tasmanian Parks and Wildlife Service) installed and retrieved data loggers. Warwick Barnes and Simon Alexander (Australian Antarctic Division) kindly provided the archive of webcam images. We acknowledge the logistical support provided by the Australian Antarctic Division and Tasmanian Parks and Wildlife Service. Manuel Nunez (University of Tasmania) provided invaluable advice and improvements. We thank the two anonymous reviewers.
Author contributions
NBF and JBK conceptualized the study and contributed to the manuscript. NBF performed the data analysis.
Details of data deposit
Datasets are archived online and publicly accessible at the Australian Antarctic Data Centre at https://data.aad.gov.au.



