


1. Introduction
Additive manufacturing (AM) has reshaped the design landscape by enabling complex geometries and rapid iteration. Among AM technologies, Material Extrusion (MEX) offers accessibility and scalability, allowing designers, engineers, and researchers to prototype and produce end-use parts with varying material characteristics. In prototyping, time is a primary value driver: accelerating the design–build–test–analyze–reflect loop, increases learning, and improves product quality (Reference Eikevåg, Auernhammer, Elverum, Dybvik and SteinertEikevåg et al., 2024; Reference Leifer and SteinertLeifer & Steinert, 2011). In AM by MEX, design and redesign are typically performed in Computer-Aided Design (CAD), where parameter-based modeling enables near-instant updates to the geometry (Reference García-Dominguez, Claver and SebastiánGarcía-Dominguez et al., 2020). Therefore, CAD can provide close to instant geometric changes ready for the next print, where printing time is the limiting factor.
Generative Design (GD) has emerged to capitalize on this design freedom. Rather than iteratively refining a single geometry, GD explores a design space defined by loads, boundary conditions, material models, and manufacturing rules. By posing objectives such as maximizing stiffness or minimizing compliance under mass constraints, GD yields families of solutions that often exhibit non-intuitive forms with organic struts, smooth transitions, and internal cavities (Reference Patwardhan and DeshpandePatwardhan & Deshpande, 2022). Traditional Topology Optimization (TO) tools typically handle a single objective function (or combine multiple objectives into one via weighting) and yield one optimal solution (Reference Vlah, Žavbi and VukašinovićVlah et al., 2020).
Therefore, TO established the feasibility of material distribution methods for high stiffness-to-weight structures; GD generalizes these ideas to multiple objectives, non-linear constraints, and user-defined design spaces (Reference Barbieri and MuzzupappaBarbieri & Muzzupappa, 2022). In Autodesk Fusion 360 (United States, San Francisco, Autodesk), a skilled designer can specify preserved, starting, and obstacle geometries; apply loads and constraints; choose material and manufacturing method; and define objectives—often within hours for small components (Reference McClellandMcClelland, 2022). GD is therefore a new tool that can be utilized in design, especially for load bearing structures. The application of GD in design can reduce development time while enhancing overall quality, minimising manual CAD work, and reducing the need for multiple prototype iterations which consume time due to printing and testing.
A well-known limitation of classical TO is that its result comes in the form of a tessellated mesh geometry (STL) (Reference Liu, Li, Liu, Chen and ZhangLiu et al., 2018; Reference Ren, Xia, Wang, Chen, Liu, Zhou and DuRen et al., 2025) which is not directly usable as a feature-based CAD model (Reference Barbieri and MuzzupappaBarbieri & Muzzupappa, 2022). Simulations is a tool that is highly useful for designers to spot improvements in the geometry, but simulations require a solid model requiring to remodel the structure before simulations can be performed (Reference Sedlacek, Kalina and StepanekSedlacek et al., 2023). A comparative study in 2020 found that a topology optimization in Fusion 360 yielded a single “mesh body” as the optimal shape, and about 30 minutes of extra CAD editing was required to make it a usable solid part (Reference Vlah, Žavbi and VukašinovićVlah et al., 2020). By contrast, Autodesk’s generative design module produces outcomes that are much closer to manufacturable, simulation-ready solid models. The generative design algorithms often employ methods like the level-set approach (moving the part boundaries smoothly) which are mesh-independent, resulting in clean boundary representation of the geometry (Reference Tkachenko and WangTkachenko & Wang, 2024; Reference Vlah, Žavbi and VukašinovićVlah et al., 2020). Studies report that generative design solutions can be exported as solid CAD bodies (e.g. as a B-rep or smooth T-spline model) that integrate directly into CAD workflows (Reference Barbieri and MuzzupappaBarbieri & Muzzupappa, 2022). The outcome is an optimized component with the option to export a solid model suitable for subsequent simulations.
Despite these advances, GD outcomes for polymer MEX often underperform expectations when validated by finite element method (FEM) analyses and physical tests (Reference Peckham, Elverum, Hicks, Goudswaard, Snider, Steinert and EikevågPeckham et al., 2024). A central cause is limited material modeling: GD solvers commonly accept isotropic properties, whereas printed polymers are highly anisotropic due to layer-wise deposition (Reference Maydanshahi, Najari, Slatter and MohammadpourMaydanshahi et al., 2024). In practice, it is not possible to directly use orthotropic/anisotropic material definitions in Fusion 360’s GD or topology optimization modules, forcing users to treat the material as isotropic. The reason is that incorporating material anisotropy greatly increases solver complexity. GD for traditional materials considers only geometry optimization under isotropic properties, whereas anisotropic composite materials introduce an entirely new optimization dimension that current tools have not fully implemented (Reference BoissonneaultBoissonneault, 2022). The GD solver is from Autodesk is also based on the Von Mises equivalent failure criteria (Reference Hartomacıoğlu, Kaya, Eker, Dağlı and SarıkayaHartomacıoğlu et al., 2024). The von Mises criterion is fundamentally a metal-yielding theory, derived for isotropic, ductile, homogeneous materials that yield through shear-driven plastic flow. Polymers and polymer-matrix composites violate these assumptions in multiple ways. Polymers do not fail by shear-Driven yielding as assumed in the von Mises criteria. Thermoplastics fail much earlier in tension than compression, resulting in a dramatic variation in strength with hydrostatic stress (Reference Glomsaker, Andreassen, Polanco-Loria, Lyngstad, Gaarder and HinrichsenGlomsaker et al., 2007). Polymers are also viscoelastic and not elastic plastic as assumed by von Mises (Reference Haufe, Du Bois, Kolling, Feucht and HaufeHaufe et al., 2005). Von Mises assumes a rate-independent yield surface, it systematically misrepresents the onset of failure for time-dependent polymer behaviour (Reference Siviour and JordanSiviour & Jordan, 2016). Polymers also often fail by microstructural damage and not yielding as assumed by von Mises (Reference Jiang, Zhang, Yang, Jiang and KangJiang et al., 2017). Von Mises substantially under-predicts tensile failure because it does not represent the true driving force for polymer fracture. In polymers by AM, it is now common to introduce short fibres to improve material properties. Short-fibre composites are highly anisotropic and their mechanisms depend on the stress resolved along fibre directions—not on a scalar shear invariant (Reference Korenczuk, Votava, Dhume, Kizilski, Brown, Narain and BarocasKorenczuk et al., 2017). Lastly AM introduces large-scale anisotropic properties such as layer adhesion, porosity, raster orientation, manufacturing orientation (Reference Garcia, Harper and LuGarcia et al., 2021; Reference Nabavian Kalat, Ziai, Dziedzic, Gradys, Urbański, Zaszczyńska, Díaz Lantada and KowalewskiNabavian Kalat et al., 2025). Von Mises assumes homogeneous, continuous media, but AM microstructures are layered, heterogeneous, and directionally dependent. Therefore, we argue that von Mises predictions can differ from experiments by approximately 50–300% depending on load orientation. The result of the material and failure criteria is that the GD outcome is far from optimized, but with a solid output, proper simulations using proper failure criteria, has the potential to predict load bearing capacity, especially for PLA where the process is better understood and process temperature does not majorly affect the material properties (Reference Tang, Liu, Yang, Liu, Jiang and HaoTang et al., 2020). The GD process can then be iterated by editing preserved, starting, and obstacle geometries, applied loads and constraints, materials, manufacturing method and re-define objectives. To address issues by materials and failure criteria, GD should be treated as a design tool, not the final outcome. One common workaround is inputting an “effective” isotropic material that corresponds to the weakest orientation of the actual anisotropic material. For example, in a recent study of GD with PLA polymer, all teams performed simulations assuming isotropic PLA properties for (Reference Peckham, Elverum, Hicks, Goudswaard, Snider, Steinert and EikevågPeckham et al., 2024) – even though this is acknowledged as unrealistic. By treating GD as a design tool, the solid model output can be simulated by established solvers to fully predict anisotropic component strength allowing for modifications for optimalisation of the design.
For accurate simulation of MEX polymer parts—particularly for certification or safety-critical applications—the CAD model must represent the printed object explicitly; slicer infill abstractions are insufficient, and 100% infill (or explicit modeling of shells and voids) is required so that FEM meshes correspond to the realized structure (Reference Peckham, Elverum, Hicks, Goudswaard, Snider, Steinert and EikevågPeckham et al., 2024). Non-linear (e.g., SOL106-type) anisotropic analyses frequently reveal that nominally “optimal” GD outcomes either over- or under-perform relative to requirements, motivating targeted mass redistribution (Reference Peckham, Elverum, Hicks, Goudswaard, Snider, Steinert and EikevågPeckham et al., 2024).
When a design over-performs and mass must be removed, designers have three principal options. First, re-run the GD study with reduced loads and/or a target weight objective (e.g., stiffness maximization at a specified mass). This can demand multiple cloud-based iterations, each typically requiring on the order of 0.5–4 hours (commonly ≥2 hours) before converging to a satisfactory solution (Reference McClellandMcClelland, 2022). Second, perform manual CAD edits—removing material from low-stress regions and reinforcing predicted fracture sites—an approach that is powerful but skill-intensive and challenging on complex GD geometries. Third, apply a shell (hollow) operation to the GD outcome to remove internal mass while preserving external load paths, then re-simulate to verify requirements (Reference Peckham, Mogg-Walls, Amri, Hicks and GoudswaardPeckham et al., 2025). The shell strategy can be executed in seconds on the initial GD result, enabling rapid iterate-and-simulate cycles. Integrating GD with MEX thus opens both opportunities and challenges. The ability to realize complex internal voids, lattice regions, and variable wall thicknesses enables designs that better follow load paths than is possible with machining or casting (Reference Prajapati, Bhat, Kumar, Verma, Lin and JengPrajapati et al., 2022; Reference Voelkl and WartzackVoelkl & Wartzack, 2021). Conversely, performance depends not only on optimized geometry but also on anisotropic material behavior, slicer fidelity for shells and walls, and tightly controlled process parameters (Reference Peckham, Elverum, Hicks, Goudswaard, Snider, Steinert and EikevågPeckham et al., 2024). Moreover, when the CAD model must mirror the manufactured artifact for FEM, designers must explicitly model internal features rather than relying on slicer-generated infill.
These considerations motivate the present study: Can shell operations applied to GD outcomes be used to efficiently achieve high-performance, weight-critical MEX components without repeated, time-consuming GD iterations? In this paper we investigate the performance of GD structures by physically testing and comparing hollow and solid components printed by MEX using PLA at different weight targets.
2. Method
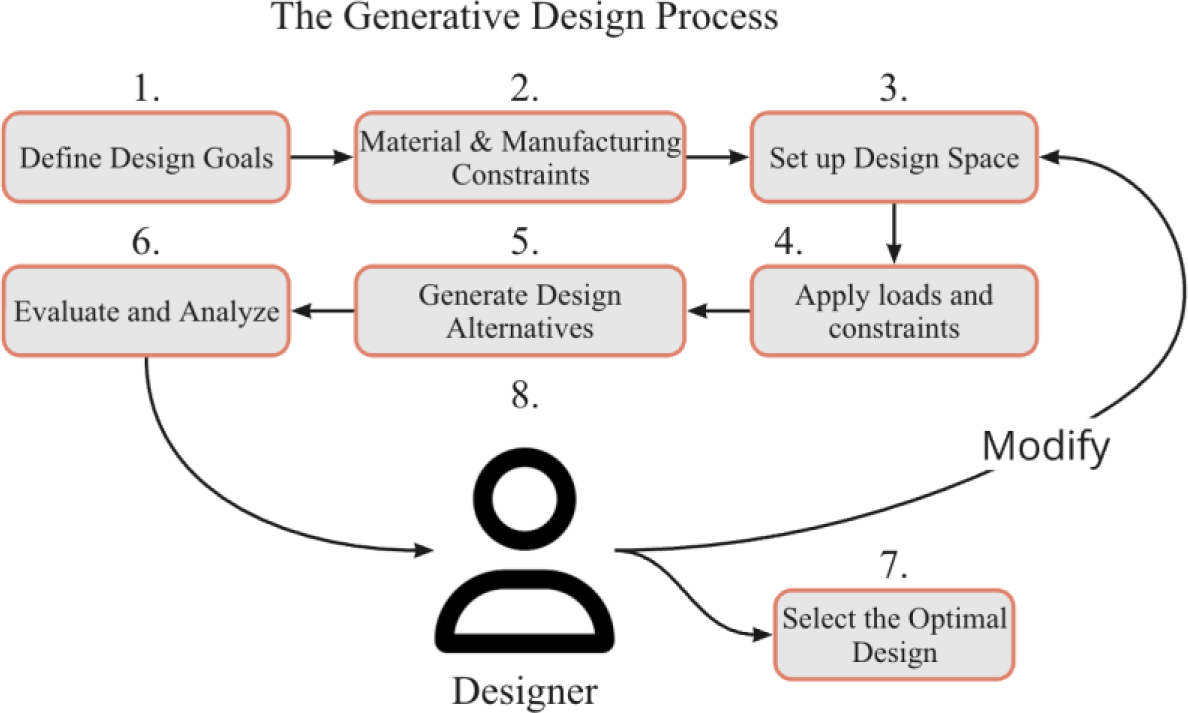
This paper investigates the performance of hollow structures compared to solid infill manufactured by MEX using PLA at different matched mass budgets. The component is inspired by a prosthetic development project where the aim is to rapidly manufacture user specific prosthetics with the load cases provided by the human gait cycle. All components were created using Autodesk Fusion360, Generative Design. The outcomes were printed using RS PRO (United Kingdom, Corby, RS Components) Polylactic Acid (PLA) on a Bambu Lab X1 Carbon (China, Shenzhen, Bambu lab). The generative designs were iterated to hit the target weights for both the hollow and solid structures using the generative design process seen in Figure 1.
Design methodology using generative design to generate and iterate load-bearing structures

2.1. Generative Design (GD)
The target application resembles a prosthetic leg component subjected to heel-strike loads, motivating a compression test at a 30° inclination. A total of 18 load cases with F = 150N were applied to the preserved geometry. The force created via the gait cycle of a human is translated and simplified to 5 different angles of attack: 45°, 22.5°, 0°,−22.5°and − 45° in both the x and y-direction. This, as well as applying the load at the top and bottom preserved geometry, was done to make the generated leg stable in multiple directions. By using the maximize for stiffness at target mass objective, the applied load is irrelevant as long as the proportion between the load cases are corresponding. Therefore, the objective in the GD solver was set to maximize stiffness at the specified mass with a safety factor of 1.0. This configuration yields three solid candidates corresponding to the mass targets. In Figure 2, the first load case includes a fixed constraint in the x, y, and z directions on the top of the preserved geometry with the load applied at a 45◦ in relation to the x-axis on the bottom part of the preserved geometry. Two symmetry planes, XZ and YZ, were also used.
Generative design setup

A total of 10 different design spaces were investigated by the methodology presented in Figure 1, where each output was evaluated and analyzed, resulting in modifying the preserved geometry, the obstacle geometry, the mass target, and the applied load multiple times. The iterations stopped when a satisfactory result was achieved, with a structure capable of maintaining structural integrity during all stages of walking. The designs and mechanical testing setup are presented in Figure 3.
A) 100g test specimen with hollow cross-section B) 150g test specimen with hollow cross-section C) 200g test specimen with hollow cross-section D) Mechanical testing setup

A design of experiments (DOE) was established to explore three mass targets (100 g, 150 g, 200 g) printed both as hollow and solid. For the hollow designs we added additional mass that was intended to be removed using the shell function to hit the target mass. Each design shares the same preserved interface: eight countersunk cylinders dimensioned for M6 fasteners and washers to clamp the part in the test rig for mechanical testing (Figure 3D). Obstacle bodies were added around each cylinder to allow a 45° Allen key sweep, ensuring that generative struts do not block assembly. Manufacturing constraints were loosely defined because MEX can realize complex geometries; overhang checks were handled manually by the designer when reviewing candidate geometries. After solving, candidate sets were reviewed for manufacturability, focusing on clear load paths, continuous material distribution and absence of unsupported features. The selected solid designs for 100 g, 150 g and 200 g exhibited organic networks of curved ribs and fillets connecting the screw interface to the foot region (Figure 3).
2.2. Materials and manufacturing
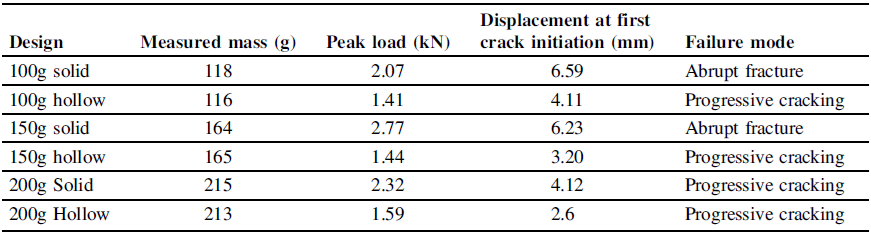
All specimens were manufactured using a Bambu Lab X1 Carbon printer (China, Shenzhen, Bambu Lab) with 1.75 mm diameter PLA filament (black, RS-PRO brand). Print settings were chosen to align with literature on maximizing mechanical performance of PLA. The nozzle diameter was 0.4 mm, with nozzle temperature set to 215 °C and bed temperature to 35 °C. The layer height was 0.16 mm, selected to balance print resolution and throughput. For solid models, infill density was 100 % (no internal voids), and one wall perimeter was used because the geometry itself served as the outer shell. For hollow models, the internal cavity had no infill; only the constant-thickness wall printed also with one outer and inner parameter using rectilinear 100% infill. The printing orientation placed the screw interface at the top, aligning the primary load path with the vertical (Z) direction of the printer to take advantage of continuous filament deposition along the expected compression direction. No support structures were required due to the overhang-compliant nature of the generative design. After printing, specimens were weighed on a precision scale. Measured masses were 118 g, 164 g and 215 g for the solid designs and 116 g, 165 g and 213 g for the hollow designs, corresponding closely to the nominal targets.
2.3. Mechanical testing
A custom steel rig was designed to emulate the 30° heel-strike loading configuration (Figure 3D). The rig consisted of a base plate and an angled plate with threaded holes aligned to the eight screw cylinders in the specimens. Each component was bolted to the angled plate using M6 screws and washers, ensuring a rigid connection. The base plate allowed the assembly to be mounted in an MTS Criterion electromechanical universal testing machine equipped with a 5 kN load cell. The test rig orientation tilted the specimen so that the nominal vertical load applied by the machine created a combination of compression and bending similar to heel-strike loads. Crosshead displacement rate was set to 5 mm/min to achieve quasi-static loading. For each specimen, force and displacement were recorded continuously until fracture onset or severe cracking occurred. Tests of hollow specimens were terminated before catastrophic failure to prevent damage to the rig, whose safe operating limit was approximately 5 kN. Visual inspection and photography captured the fracture process, especially at the transition from the generative ribs to the preserved screw cylinder region. Because only one specimen per configuration was tested, results represent indicative behavior rather than statistically significant averages.
3. Results
The main quantitative findings are presented in Table 1. For each configuration one component was tested, and therefore results should be considered indicative trends. Across all mass levels, solid structures reached higher peak loads than hollow shells when compared at first sign of microcracking. The difference in peak load increased with mass: at 100 g, the solid carried 46 % more load; at 150 g, 92 % more; at 200 g, 46 % more. Hollow specimens nonetheless offered significant load capacity relative to their mass, and they failed in a controlled, progressive manner rather than abruptly.
Testing results

3.1. Qualitative observations and failure modes
During testing, solid specimens displayed abrupt, brittle failure once the peak load was reached. All the fractures are presented in Figure 4. For the 100 g solid specimen, cracking initiated near the foot region where several ribs converged. As the load increased, a major crack propagated through the rib network into the screw-interface area, causing a sudden drop in load and audible snapping. The part separated into multiple pieces, with only the screw cylinders remaining intact. Similar behavior occurred in the 150 g and 200 g solid specimens. In the 150 g solid, the thicker ribs delayed crack initiation, resulting in a higher peak load. However, once the critical stress was reached, failure was catastrophic, with fragments detaching abruptly. In the 200 g solid, evidence of base plate compliance was observed beyond approximately 5 mm displacement; nonetheless, the specimen experienced sudden fracture following crack initiation at around 2.3 kN.
A)100g solid before and after fracture; B) 100g hollow before and after fracture; C) 150g solid before and after fracture; D) 150g hollow before and after fracture; E) 200g solid before and after fracture; F) 200g hollow before and after fracture

Hollow specimens, in contrast, exhibited progressive damage. In the 100 g hollow, microcracks formed in the thin shell slightly below the first generative rib. These cracks extended diagonally across the shell, linking multiple ribs, and a network of crazes appeared at the internal surface. The force–displacement curve showed a serrated plateau as load drops corresponded to audible crack events. The test was halted after a major crack formed but before total collapse. The 150 g hollow specimen displayed a longer plateau region between 1.0 kN and 1.4 kN, with multiple small drops in load. Failure occurred by progressive shell buckling and tearing, leaving the screw cylinders intact. The 200 g hollow specimen experienced a combination of shell buckling and tearing. Cracks initiated near the foot region at around 1.5 kN and propagated upward. The displacement at failure exceeded 6 mm, indicating substantial deformation before collapse. Throughout all hollow tests, fractures avoided the screw cylinders due to the preserved region design; cracks diverted around these features, demonstrating their role as crack arrestors.
3.2. Force–displacement behavior and peak loads
Figure 5 (A)-(C) compares the force–displacement curves for solid and hollow specimens at each mass level.
Mechanical testing result of shell and solid generative designed structures A)100g, B)150g and C) 200G

Figure 5 Long description
Three line graphs compare mechanical testing results of shell and solid generative designed structures at different weights. Panel A: A line graph shows the load versus displacement for 100-gram structures. The x-axis represents displacement in millimeters, and the y-axis represents load in kilonewtons. Two data series are plotted: one for solid structures and one for hollow structures. The graph includes annotations for maximum load and fracture points for both solid and hollow structures. Panel B: A line graph shows the load versus displacement for 150-gram structures. The x-axis represents displacement in millimeters, and the y-axis represents load in kilonewtons. Two data series are plotted: one for solid structures and one for hollow structures. The graph includes annotations for maximum load and fracture points for both solid and hollow structures. Panel C: A line graph shows the load versus displacement for 200-gram structures. The x-axis represents displacement in millimeters, and the y-axis represents load in kilonewtons. Two data series are plotted: one for solid structures and one for hollow structures. The graph includes annotations for maximum load and fracture points for both solid and hollow structures.
In Figure 5, the 100 g pair, the solid specimen attained a peak load of approximately 2.07 kN at around 6.59 mm displacement before dropping sharply. The hollow specimen reached 1.41 kN at roughly 4.11 mm displacement and then displayed a saw-tooth post-peak region as microcracks formed and coalesced. The initial stiffness (slope of the curve at low displacement) was similar between the two designs, indicating that both effectively routed the load along similar paths until cracking occurred. The difference in peak load highlights the effect of removing material: although the total mass remained comparable, the hollow shell redistributed stresses and allowed earlier crack initiation.
For the 150 g specimens (Figure 6), the solid achieved the highest peak load among all tests at about 2.77 kN, followed by a near vertical load drop signalling catastrophic failure. The hollow counterpart reached only around 1.44 kN before the first microcrack occurred, then exhibited multiple load drops as the load increased. This suggests that the hollow design was capable of dissipating energy through progressive cracking. Interestingly, the displacement curve until peak load was similar for both designs, implying comparable stiffness up to the onset of cracking. The difference in peak capacity may reflect the thicker ribs and additional material in the solid design, which provided greater resistance to crack initiation.
In the 200 g pair, the solid specimen reached a peak of 2.32 kN. Beyond 4 mm displacement when the first microcrack the load continued to increase after the initial drop. The hollow specimen achieved 1.59 kN before the first major crack occurred. The force–displacement curve displayed multiple drops, and the displacement at failure exceeded 6 mm.
4. Discussion
In this study, component evaluation by mechanical testing is applied to compare solid and shell structures as different mass targets. The results indicate clear trends towards understanding generative design by polymer additive manufacturing, with a comprehensive component evaluation for both solid as well as shell structures, even with a limited amount of test samples.
The experimental data illustrate a consistent trend across mass levels: solid generatively designed structures deliver higher peak loads than hollow shells, while the latter fail progressively with multiple microcracking events. From a structural mechanics perspective, removing material through a shell operation eliminates redundant load paths and reduces the cross-section available to resist compressive stresses. Consequently, cracks initiate at lower loads, leading to earlier failure. Yet the progression of failure is slower in hollow specimens because the thin walls buckle and crack gradually, redistributing stresses around crack tips and arresting propagation temporarily. This behaviour resembles that of lattice and cellular structures known for their energy absorption properties (Reference Rocha Pereira, Patterson and MessimerRocha Pereira et al., 2020). In applications where damage detection and graceful degradation are advantageous—for example, prosthetic components that should signal impending failure rather than collapse catastrophically—hollow generative designs may offer a safer failure mode. Conversely, when ultimate strength and stiffness retention dominate design criteria, the solid generative designs tested here outperform their hollow counterparts. The higher peak loads observed in the 150 g solid specimen suggest that, within the mass budgets considered, additional material can be used effectively to reinforce high-stress regions. The diminishing difference in mass-specific capacity at higher masses also indicate that simply adding mass does not proportionally increase performance. This non-linear relationship underscores the importance of generative design in distributing material optimally rather than uniformly. If the application tolerates reduced peak load in exchange for controlled, inspectable failure and energy absorption, then hollowing generative designs can provide a beneficial trade-off. For applications requiring maximum load capacity, retain solid regions or strategically reinforce hollow designs near critical interfaces. Rather than simply minimizing mass, designers should consider how mass can be distributed between structural capacity and failure mode control. The similar initial stiffness observed between solid and hollow designs suggests that, up to a point, hollow shells can maintain rigidity while permitting energy dissipation beyond the design load. The preserved screw cylinders in this study acted as crack arrestors, diverting fractures around them and maintaining attachment integrity. Designers should embed such features in generative models to ensure reliable connections and predictable failure paths. The heel-strike configuration used in both the GD solver and the test rig ensured that the optimized geometry was relevant to the intended load scenario. Mismatched load cases can result in designs that perform well in simulation but poorly under actual conditions. Coupon-level data may not capture interactions between geometric features, anisotropy and load distribution. Testing actual components in configurations representative of their use is essential to uncover failure mechanisms and calibrate design assumptions.
In this study, the shelling strategy used an uniform distribution due to available tools in both the CAD software as well as the slicer software. Due to the opportunities towards mass distribution in additive manufacturing, alternative shelling strategies applying multi region control or varying thickness might improve the results from this study. However, more complex shelling strategies require new technologies such as machine learning wish is another time-consuming strategy that is difficult to implement as a designer.
The observed difference between solid and hollow performance aligns with literature on thin-walled structures and lattice materials. Hollow shells typically exhibit lower compressive strength (Reference Rocha Pereira, Patterson and MessimerRocha Pereira et al., 2020). Several limitations temper the generalizability of this study. First, only one specimen per configuration was tested. MEX introduces variability due to filament quality, machine calibration and environmental conditions. More test samples would provide statistical confidence and reveal the spread of performance. Second, the material choice was limited to PLA, a relatively brittle polymer. Engineering thermoplastics such as polyamide, polycarbonate or fibre-reinforced composites may exhibit different balances between strength and progressive failure. Third, only quasi-static compression at a 30° inclination was considered. Real components, especially prosthetic limbs, experience cyclic and multi-axial loads; fatigue testing and dynamic loading would be valuable to assess durability. Fourth, the test fixture exhibited some compliance at higher loads, potentially affecting the 200 g solid response. Future rigs should be designed for greater stiffness and instrumented to decouple fixture deformation from specimen behaviour.
Some differences arise in the mass-dependence of performance. The 150 g solid specimen achieved a higher peak load than the 200 g solid, suggesting that beyond a certain mass the additional material did not contribute effectively to load carrying. This could be due to suboptimal material placement in the generative process at higher masses or to increased sensitivity to manufacturing defects in thicker sections. Similar non-monotonic behaviour has been reported in topology optimization studies where adding volume beyond a threshold yields diminishing returns (Reference SeifertSeifert, 2018). For hollow shells, the peak load increased slightly from 1.41 kN to 1.59 kN as mass increased, but the mass-specific capacity decreased, indicating that thicker walls do not proportionally increase load capacity. Designers should therefore use generative design tools to explore mass allocations rather than assume linear scaling.
5. Conclusion
This paper presented a mass-targeted comparison of solid and hollow generatively designed structures fabricated via material-extrusion additive manufacturing and tested under application-specific loading. Using a design-research approach, three stiffness-maximizing GD solutions were generated at 100 g, 150 g and 200 g and then shelled to create hollow counterparts at the same nominal mass. All six designs were manufactured in PLA and tested in a 30° compression fixture representing heel-strike. The results showed that solid specimens consistently reached higher peak loads—2.07 kN, 2.77 kN and 2.32 kN—while hollow shells reached 1.41 kN, 1.44 kN and 1.59 kN but failed progressively with serrated post-peak responses. The study underscores the importance of explicit modelling of interfaces, application-consistent load cases in generative design, and component-level testing for validating generative solutions in MEX.
When addressing the research question, “Can shell operations applied to GD outcomes be used to efficiently achieve high-performance, weight-critical MEX components without repeated, time-consuming GD iterations?”, the results show that shell structures do not perform as well as their solid counterpart. Using a shell function to save time will not optimize the component. The result will perform better by applying iterations to the GD solver. Performance can further be improved by time consuming, manual material transfer in the CAD model based on simulation results. The findings encourage designers to treat mass as a resource to be allocated judiciously between structural capacity and failure characteristics and to leverage generative tools to explore this allocation.




 Open access

