


1. Introduction
Coordination problems are ubiquitous in economics, management, and industrial organizations, usually modeled as N-person non-cooperative games with multiple pure-strategy Nash equilibria (i.e., coordination games). The multiple pure-strategy Nash equilibria in the coordination games may be Pareto ranked (such as in order statistic games) (Van Huyck et al., Reference Van Huyck, Battalio and Beil1990, Reference Van Huyck, Battalio and Beil1991) or Pareto equivalent (such as in market entry games) (Kahneman, Reference Tietz1988; Rapoport et al., Reference Rapoport, Seale, Erev and Sundali1998). At the Fourth Conference on Experimental Economics, Kahneman Reference Tietz1988 reported a simple experiment for market entry games and noted that “observing the regularity of behavior in these markets was a bewildering experience—to a psychologist, it looked almost like magic” (p. 12). Since then, many experiments for market entry games have shown that such “coordination magic” is common (Duffy & Hopkins, Reference Duffy and Hopkins2005; Erev et al., Reference Erev, Ert and Roth2010; Erev & Rapoport, Reference Erev and Rapoport1998; Rapoport, Reference Rapoport1995; Rapoport et al., Reference Rapoport, Seale, Erev and Sundali1998; Sundali et al., Reference Sundali, Rapoport and Seale1995). However, many coordination game experiments have reported the emergence of coordination failure (i.e., a group of subjects cannot converge to Pareto-dominant equilibrium) in Pareto-ranked coordination games and disequilibrium (i.e., pure-strategy Nash equilibrium cannot predict the aggregate behavior well) in Pareto-equivalent coordination games under strategic uncertainty (Camerer & Lovallo, Reference Camerer and Lovallo1999; Van Huyck et al., Reference Van Huyck, Battalio and Beil1990, Reference Van Huyck, Battalio and Beil1991; Zwick & Rapoport, Reference Zwick and Rapoport2002).
A central question in markets is how individuals coordinate their market entry behavior. The market entry games that have widely been studied, such as in Rapoport et al. Reference Rapoport, Seale, Erev and Sundali(1998), are one-sided, in which the payoffs for entering the market are determined by the number of entrants and market capacity. One-sided market entry games feature symmetric agents, complete information, and zero entry costs.Footnote 1 Also, market capacity is usually predetermined exogenously (Selten & Güth, Reference Selten, Güth, Deistler, Fürst and Schwödiauer1982). Different from one-sided markets, market capacity is usually endogenous in two-sided markets, determined by the number of entrants on both sides (Roson, Reference Roson2005). Examples of two-sided markets are commonplace, including traditional ones, such as newspapers, credit card services, and operating systems (Rysman, Reference Rysman2009), as well as spring-up ones, with the rapid development of new technologies, especially smartphones, such as Uber, Lift, Didi, eBay, and Airbnb (Lian & Van Ryzin, Reference Lian and Van Ryzin2021). For example, in a ride-hailing market, passengers and drivers can decide whether to enter the market or not. Imagine that relatively few passengers enter the market; then, the drivers who decide to enter the market are also few, making the market capacity small, and vice versa. Also, different from one-sided markets with network externalities determined by the actions of agents in the same group (Katz & Shapiro, Reference Katz and Shapiro1985), network externalities in two-sided markets are indirect, depending on the actions of different agents on the opposite-side market (Roson, Reference Roson2005).
A deeper understanding of coordination behavior in the two-sided markets and the underlying mechanism behind the market entry behavior could help on-demand service platforms design appropriate strategies to increase the labor supply and customer demand, thereby increasing their profit and social welfare. In this work, we propose a two-sided market entry game to understand coordination behavior in two-sided markets. The two-sided market entry game is operated by an intermediary monopoly platform serving two sides (i.e., customers and service providers), featuring asymmetric agents and endogenous market capacity. The cross-side network effects in the game are positive; that is, the expected payoffs for entering the two-sided market are monotonically decreasing and increasing in the number of entrants with the same role and the other role, respectively, when at least one service provider enters the market. Fair cost sharing is adopted to determine the expected payoffs of the service providers for entering the market (Liu et al., Reference Liu, Mak and Rapoport2015).
Our analysis of the two-sided market entry game suggests that multiple pure-strategy Nash equilibria can exist, which is a peculiar characteristic of coordination games. However, the proposed two-sided market entry game differs from previous Pareto-equivalent coordination games, such as one-sided market entry games, and Pareto-ranked coordination games, such as order statistic games, in at least three major aspects. First, the proposed game is asymmetric, including two roles with different expected payoff functions for entering the market, whereas the subjects in one-sided market entry games and order statistic games are usually symmetric. Second, a subject’s payoffs for entering the market are determined by not only his/her own actions and the actions of subjects with the same role but also the efforts of subjects with the other role. Third, the multiple pure-strategy Nash equilibria in the proposed game may be Pareto equivalent for one side and Pareto ranked for the other, which could generate tensions between entering and staying out of the market across groups. For the Pareto-equivalent side, the customers (or providers) have the same payoffs under the pure-strategy Nash equilibria. For the Pareto-ranked side, the providers (or customers) who enter the market under the pure-strategy Nash equilibria with some subjects entering (i.e., interior pure-strategy Nash equilibria) have higher payoffs than those under the equilibrium without subjects entering. Also, the secure action in the two-sided market entry game is staying out of the market because the opportunity payoffs for staying out of the market are larger than the smallest expected payoffs for entering it (Van Huyck et al., Reference Van Huyck, Battalio and Beil1991). Secure equilibrium is achieved when all customers and service providers adopt the secure action (i.e., staying out of the market). Compared with other pure-strategy Nash equilibria, such as payoff-dominant equilibrium, secure equilibrium may generate inefficiency.Footnote 2
To investigate whether the “coordination magic” that emerges in one-sided market entry games exists in the proposed two-sided market entry game, we design and conduct a laboratory experiment with repeated interactions involving three treatments, HighHigh Treatment, LowHigh Treatment, and HighLow Treatment, where the first and second High/Low correspond to the willingness of customers and service providers to enter the market, respectively. The three treatments have the same expected payoff functions for entering the market but differ in the opportunity payoffs for staying out of the market. The high and low willingness to enter the market correspond, respectively, to low and high opportunity payoffs for staying out of the market in the experiments. The multiple pure-strategy Nash equilibria that emerge in the three treatments have different Pareto characteristics. In the HighHigh Treatment, the multiple pure-strategy Nash equilibria are Pareto ranked for both sides; however, the multiple pure-strategy Nash equilibria in the other two treatments are Pareto ranked for one side but Pareto equivalent for the other.
Our experiment reveals the following results. First, we observe coordination success in the HighHigh Treatment and coordination failure and disequilibrium in the other two treatments. When the pure-strategy Nash equilibria are strictly Pareto ranked, the tacit coordination between customers and service providers makes the aggregate behavior converge to payoff-dominant equilibrium. However, when the pure-strategy Nash equilibria are Pareto ranked on one side but Pareto equivalent on the other side, no pure-strategy Nash equilibrium can predict the aggregate behavior very well. The aggregate behavior in the LowHigh and HighLow treatments shows significant diversity. Second, although the secure action in the LowHigh and HighLow treatments seems like a well-advised choice, some customers and service providers still choose to enter the market in the two treatments. We classify the individuals according to their market entry behavior, observing a “small market” that forms for some customers’ and service providers’ frequent entry behavior. The payoffs for the frequent entrants are higher than for the other entrants. Third, we observe more stable choice behavior and higher proportions of using the best-response strategy in the HighHigh Treatment than in the other two treatments. Fourth, we find that coordination failure and disequilibrium damage the platform’s profit. In addition, the platform does not always enhance social welfare when customers and service providers cannot successfully coordinate their behavior.
The rest of this paper is organized as follows. Section 2 reviews the literature related to laboratory experiments for group coordination games. Section 2.1 presents the proposed two-sided market entry game. Section 2.2 introduce the experiments. Section 2.3 presents the experimental results. Section 3 provides experimental interpretations of coordination behavior in the two-sided market entry game. Finally, Section 4 concludes the paper and discusses potential research directions.
2. Laboratory experiments for coordination behavior
Coordination games are games with multiple pure-strategy Nash equilibria. Many studies have investigated coordination behavior in coordination games with laboratory experiments. In what follows, we review experimental studies involving two categories of group coordination games: coordination games with Pareto-equivalent equilibria and coordination games with Pareto-ranked equilibria.
2.1. Pareto-equivalent coordination games
Since the one-sided market entry games proposed by Selten & Güth Reference Selten, Güth, Deistler, Fürst and Schwödiauer(1982), many experimental studies have investigated market entry coordination behavior with linear payoff functions, zero entry costs, and binary decisions. There are multiple pure-strategy Nash equilibria, even if the number of (non)entrants is unique at these equilibria under given parameters. In this case, even though the subjects know the number of (non)entrants at equilibria, they are not sure who will enter the market. This uncertainty influences the subjects’ choice behavior. However, these pure-strategy Nash equilibria yield the same payoffs (i.e., Pareto equivalent) because the number of entrants at these equilibria is unique under given parameters (Rapoport et al., Reference Rapoport, Seale, Erev and Sundali1998).Footnote 3 Daniel Kahneman was perhaps the first to experimentally study market entry behavior, together with James Brander and Richard Thaler. Their study found that Nash equilibrium could provide a good explanation of the regularity of behavior, looking “like magic” (Kahneman, Reference Tietz1988). Subsequently, Rapoport Reference Rapoport(1995) conducted three replications of a 20-round market entry game, recruiting highly sophisticated PhD students. He found that the pure-strategy Nash equilibrium predicted aggregate market entry behavior quite well, although no feedback information was provided. Sundali et al. Reference Sundali, Rapoport and Seale(1995) compared market entry behavior with feedback information and with no feedback information. Aggregate behavior converged to pure-strategy Nash equilibrium in both experiments, and convergence was more rapid in the experiment with feedback information than in the one with no feedback information. However, the three abovementioned studies only examined a special case (i.e., v = k) of this market entry game. Also, the payoffs for staying out of the market were guaranteed to be positive in all three studies. Rapoport et al. Reference Rapoport, Seale, Erev and Sundali(1998) further investigated market entry behavior in which negative payoffs for staying out of the market were considered. Consistent with previous market entry experiments, that study also observed “coordination magic” in their experiments, further confirming the earlier findings.
In the two studies by Sundali et al. Reference Sundali, Rapoport and Seale(1995) and Rapoport et al. Reference Rapoport, Seale, Erev and Sundali(1998), the payoff rule was received by the subjects (i.e., complete information conditions). Also, the complete outcome feedback, such as the number of entrants and individual payoff, was provided at the end of each round in some studies. However, if the subjects did not know the payoff rule and the complete outcome feedback, would quick equilibrium convergence still be achieved in one-sided market entry games? Erev and Rapoport Reference Erev and Rapoport(1998) examined the effect of the available information on the equilibrium convergence in one-sided market entry games. Although the payoff rule was unknown to the subjects, that study observed quick convergence to equilibrium. The number of entrants increased when the information concerning other subjects’ payoff was provided because this information could affect the subjects’ reference point. Erev et al. Reference Erev, Ert and Roth(2010) further studied the market entry behavior without disclosing the payoff rule. Their experimental results confirmed the robustness of eight qualitative behavioral tendencies.Footnote 4 Duffy & Hopkins Reference Duffy and Hopkins(2005) conducted market entry experiments with a larger number of repetitions than in the above work. They found that learning was crucial for equilibrium convergence, and their experiment with minimal information began to approach equilibrium after close to 100 periods. By contrast, the experiment with full information quickly converged to pure-strategy Nash equilibrium.
In addition to the coordination success reported in the above experiments, some experiments have also observed disequilibrium in one-sided market entry games. Camerer & Lovallo Reference Camerer and Lovallo(1999) experimentally linked market entry behavior and personal overconfidence, finding that overconfidence could lead to excessive market entry. Zwick & Rapoport Reference Zwick and Rapoport(2002) experimentally investigated market entry behavior with heavy penalties for excess entry. The payoffs for entering the market were first monotonically decreasing, induced by cost sharing, and then there was a fixed negative value for excess entry. In their experiments, market capacity and entry cost significantly affected market entry behavior, and the aggregate behavior did not converge to pure- and mixed-strategy equilibrium solutions, leading to disequilibrium.
One typical extension of one-sided market entry games is route choice in transportation economics. For example, the classical two-route choice problem can be interpreted as a problem in which subjects choose from two markets (i.e., routes) and enter one of them (Selten et al., Reference Selten, Chmura, Pitz, Kube and Schreckenberg2007). In recent decades, many experiments have been conducted to investigate route choice problems (Dixit et al., Reference Dixit, Ortmann, Rutström and Ukkusuri2017). The main objectives examined in the literature regarding route choice include information (Ben-Elia & Avineri, Reference Ben-Elia and Avineri2015; Rapoport et al., Reference Rapoport, Gisches, Daniel and Lindsey2014; Selten et al., Reference Selten, Chmura, Pitz, Kube and Schreckenberg2007), paradoxes (Dechenaux et al., Reference Dechenaux, Mago and Razzolini2014; Mak et al., Reference Mak, Seale, Gisches, Yang, Cheng, Moon and Rapoport2018b), and incentives (Dixit et al., Reference Dixit, Ortmann, Rutström and Ukkusuri2017; Janusch et al., Reference Janusch, Kroll, Goemans, Cherry and Kallbekken2021), among others. Most experimental studies in transportation science have confirmed “coordination magic” in route choice. For example, Selten et al. Reference Selten, Chmura, Pitz, Kube and Schreckenberg(2007) experimentally studied route choices in a two-route congestible network. Although the travel cost functions were not provided to the subjects in the experiment, the aggregate behavior converged to pure-strategy Nash equilibrium.
2.2. Pareto-ranked coordination games
One characteristic of one-sided market entry games is that the pure-strategy Nash equilibria are Pareto equivalent (Erev & Rapoport, Reference Erev and Rapoport1998; Rapoport et al., Reference Rapoport, Seale, Erev and Sundali1998).Footnote 5 Another class of coordination games is those with multiple pure-strategy Nash equilibria that are Pareto ranked. In Pareto-ranked coordination games, at least two-pure strategy Nash equilibria exist. If a game has two Pareto-ranked equilibria, the one with higher payoffs is called the payoff-dominant equilibrium, and the other is Pareto dominated by the payoff-dominant equilibrium (Cooper et al., Reference Cooper, DeJong, Forsythe and Ross1990).
One crucial question that needs to be answered in a Pareto-ranked coordination game is which pure-strategy Nash equilibrium the game will converge to. Many theoretical studies have suggested that the subjects will coordinate their actions to achieve payoff-dominant equilibrium (Harsanyi et al., Reference Harsanyi and Selten1988; Schelling, Reference Schelling1980). However, Cooper et al. Reference Cooper, DeJong, Forsythe and Ross(1990) experimentally found that experimental outcomes did not always achieve payoff-dominant equilibrium in two-person coordination games. Further experiments with two-person coordination games confirmed this finding (Cooper et al., Reference Cooper, DeJong, Forsythe and Ross1992), even applying certain clue methods, such as communication.
Aside from two-person coordination games, many experiments have investigated coordination behavior at the group level with multiple Pareto-ranked equilibria under strategic uncertainty, such as order statistic games (Van Huyck et al., Reference Van Huyck, Battalio and Beil1990; Van Huyck et al., Reference Van Huyck, Battalio and Beil1991), critical mass games (Devetag, Reference Devetag2003; Mak & Zwick, Reference Mak and Zwick2010; Masiliūnas, Reference Masiliūnas2017; Ruffle et al., Reference Ruffle, Weiss and Etziony2015), and mode choice games with externalities (Han et al., Reference Han, Yu, Jia, Gao, Jiang and Zhang2021; Liu et al., Reference Liu, Mak and Rapoport2015; Mak et al., Reference Mak, Seale, Gisches, Yang, Cheng, Moon and Rapoport2018b). Interest in investigating the coordination problem and equilibrium selection in a group with multiple Pareto-ranked equilibria originated from the seminal works of Van Huyck et al. (Reference Van Huyck, Battalio and Beil1990, Reference Van Huyck, Battalio and Beil1991) for order statistic games. In those two works, subjects were required to choose simultaneously from among seven efforts. A subject’s payoffs were determined by his/her effort and the publicly announced order statistics of his/her own and the other subjects’ efforts. Those studies, as well as further experimental and explanatory works, such as Crawford Reference Crawford(1991, Reference Crawford1995), Broseta Reference Broseta(2000), Goeree & Holt Reference Goeree and Holt(2005) and Anderson et al. (Reference Anderson, Goeree and Holt2001), demonstrated the effects of strategic uncertainty and the evolution of individual beliefs on equilibrium selection, revealing factors related to coordination, including the amount of feedback information, number of repetitions, payoff function, group size, attraction basin, and noise.
Positive externalities are a significant characteristic of certain markets, such as microcomputer software (Brynjolfsson & Kemerer, Reference Brynjolfsson and Kemerer1996; Gandal, Reference Gandal1994), causing coordination problems. Easley & Kleinberg Reference Easley and Kleinberg(2010) suggested that “with positive externalities, there exist self-fulfilling expectations and a natural set of outcomes to coordinate on; with negative externalities, any shared expectation of a fixed audience size will be self-negating, and the individuals must instead sort themselves out in much more complicated ways” (p. 536). Many laboratory experiments have investigated the effects of positive externalities in markets using critical mass games. For example, Devetag Reference Devetag(2003) experimentally demonstrated the effects of full information and positive externalities on coordination success. Other factors related to coordination in critical mass games, such as first-round total investment, the size of the critical mass, and action disclosure, were reported in subsequent studies (Mak & Zwick, Reference Mak and Zwick2010; Masiliūnas, Reference Masiliūnas2017; Ruffle et al., Reference Ruffle, Weiss and Etziony2015). Positive externalities can also emerge in travel mode choice. Liu et al. Reference Liu, Mak and Rapoport(2015) experimentally studied coordination behavior in a mode-choice game with externalities, in which positive externalities were induced by cost sharing, generating three Pareto-ranked pure-strategy Nash equilibria. They found that coordination success was facilitated by the existence of intermediate equilibrium. Mak et al. Reference Mak, Seale, Gisches, Yang, Cheng, Moon and Rapoport(2018b) experimentally linked the Braess paradox and coordination behavior in mode choice with externalities. Their experimental results indicated that coordination failure might result in a  $37\%$ travel cost increase in a directed network with positive externalities when adding a new link. Han et al. Reference Han, Yu, Jia, Gao, Jiang and Zhang(2021) experimentally studied mode choice between public transport and private car, finding that descriptive information, historical experience, and the equilibrium transformation barrier significantly affected equilibrium selection and transformation.
2.3. Summary of literature review
In summary, the group coordination experiments described above shed light on the importance of coordination behavior at both aggregate and individual levels and provide many interesting findings, such as “coordination magic,” coordination failure, and disequilibrium. These studies also reveal many factors related to coordination success, coordination failure, and disequilibrium. These studies, however, mainly focused on coordination among individuals within one group. The subjects in these experiments were usually symmetric with the same payoff functions. Coordination behavior between different groups has not been investigated.Footnote 6 Moreover, the multiple pure-strategy Nash equilibria in one game were either Pareto ranked or Pareto equivalent. To the best of our knowledge, few experimental studies have paid attention to the coexistence of Pareto-ranked equilibria and Pareto-equivalent equilibria in one game and how the interactions of the two types of Pareto equilibria influence coordination behavior. The present study, therefore, experimentally provides insights into coordination behavior across groups in two-sided markets by proposing a two-sided market entry game.
3. Two-sided market entry game
We model a two-sided market entry game operated by one intermediary monopoly platform to understand the coordination behavior of customers and service providers in entering the market. Figure 1 illustrates the two-sided market entry game. In the game, when the platform announces its operation strategies (such as the retaining ratio), customers decide whether to accept the platform’s service, and service providers decide whether to provide service on the platform.Footnote 7
Illustration of the two-sided market entry game

Let  $\bar{n}_c$ and
  $\bar{n}_p$ be the number of potential customers and service providers, respectively. The opportunity payoffs of customers and service providers for staying out of the market are assumed to be fixed and larger than zero (i.e.,
  $\Pi_c^O \gt 0$ for each customer and
  $\Pi_p^O \gt 0$ for each service provider). For market entrants, their expected payoffs depend not only on the number of entrants with the same role but also on the number of entrants in the other role (i.e., cross-side network effects). Let nc and np be the number of customers and service providers entering the market, respectively. We assume that customers who enter the market have to pay two types of costs: fixed entry cost (i.e.,
  $C_0 \gt 0$) and variable entry cost (i.e.,
  $C_1(n_c, n_p) \gt 0$).Footnote 8 The variable entry cost is related to the number of customers and service providers entering the market. To be concrete, we assume that the variable entry cost monotonically increases and decreases as the number of customers and service providers entering the market increases (i.e.,
  $\partial C_1/\partial n_c \gt 0$ and
  $\partial C_1/ \partial n_p \lt 0$) when at least one provider chooses to enter the market. The total entry costs of customers who accept the platform’s service are
  $n_c(C_0+C_1)$, which are also assumed to be the total income of service providers and the platform. Further, the game mainly focuses on describing coordination behavior between customers and service providers rather than the matching process. Therefore, we assume that the platform (such as ride-hailing) retains a ratio ρ of the total income and transfers the rest to the service providers who offer the service on the platform. A fair cost-sharing allocation mechanism is used to determine the expected payoffs of service providers for entering the market (Liu et al., Reference Liu, Mak and Rapoport2015), which can be regarded as the underlying protocol of play that determines how much a platform that serves multiple providers will benefit each of them. Such an allocation mechanism has been theoretically investigated in network design and algorithmic game theory in computer science (Anshelevich et al., Reference Anshelevich, Dasgupta, Kleinberg, Tardos, Wexler and Roughgarden2008; Chen et al., Reference Chen, Roughgarden and Valiant2010). Based on the fair cost-sharing mechanism, the expected payoffs of customers and service providers for entering the market, respectively, are denoted as follows:
 \begin{equation}
\left\{
\begin{array}{lll}
\Pi_c(n_c,n_p)=I_0-C_0-C_1(n_c, n_p)\\
\Pi_p(n_c,n_p)=(1-\rho)[C_0+C_1(n_c, n_p)]\frac{n_c}{n_p},\\
\end{array}
\right.
\end{equation}
\begin{equation}
\left\{
\begin{array}{lll}
\Pi_c(n_c,n_p)=I_0-C_0-C_1(n_c, n_p)\\
\Pi_p(n_c,n_p)=(1-\rho)[C_0+C_1(n_c, n_p)]\frac{n_c}{n_p},\\
\end{array}
\right.
\end{equation} where  $I_0 \gt C_0$, and I 0 is the initial perceived payoffs of customers from a service. The platform’s profit is
  $R(n_c,n_p)=\rho n_c[C_0+C_1(n_c, n_p)]$. Social welfare is
  $W(n_c,n_p)=I_0n_c+(\bar{n}_c-n_c)\Pi_c^O+(\bar{n}_p-n_p)\Pi_p^O$. Further, social welfare changes induced by the platform can be denoted as
  $\Delta W = W(n_c, n_p)-W_0$, where W 0 is social welfare in the case in which no customers or service providers enter the market, and
  $W_0=(\bar{n}_c\Pi_c^O+\bar{n}_p\Pi_p^O)$.
For simplicity, when no service providers enter the market, the expected payoffs of customers for entering the market are set to zero (i.e.,  $\Pi_c(n_c,0)=0$), indicating that customers who enter the market cannot get any payoffs when there are no service providers providing service. This setting is also consistent with the case that the expected payoffs of service providers who enter the market are zero when no customers enter the market. Further, for the convenience of calculation and the simplicity of subsequent experimental design, we set the variable entry cost as
  $C_1(n_c, n_p)=\alpha \frac{n_c}{n_p}$, in which α is a positive parameter. This setting reflects the nature of the relationship among variable entry cost, supply, and demand in two-sided markets to some degree, although it may deviate from reality in detail.
4. The experiment
We designed an experiment including three treatments corresponding to three different willingness combinations (i.e.,  $({\rm HW}, {\rm HW})$,
  $({\rm LW}, {\rm HW})$, and
  $({\rm HW}, {\rm LW})$) to investigate coordination behavior in the two-sided market entry game.Footnote 9 In this section, we introduce how we conducted the experiment, including the parameters, subjects, experimental procedure, and experimental hypotheses.
4.1. Parameters in the experiment
In the experiment, customers ( $\bar{n}_c=10$) and service providers (
 $\bar{n}_p=10$) are required to choose whether to enter a two-sided market. The parameters in the expected payoff functions for entering the market are fixed across the three treatments, which are given by
  $I_0=20$,
  $C_0=6$, α = 6, and ρ = 0.2. Supplementary Table S1 lists the expected payoffs of customers and service providers under different entrant number combinations at the given parameters. Figure 2 shows the format of payoffs for the customers and providers in the experiment. The three treatments differ from one another in the opportunity payoffs for staying out of the market (i.e.,
  $\Pi_c^O$ and
  $\Pi_p^O$). The low and high opportunity payoffs for staying out of the market correspond, respectively, to high and low willingness to enter the market. In the HighHigh Treatment, the opportunity payoffs of customers and service providers for staying out of the market are
  $\Pi_c^O=7$ and
  $\Pi_p^O=7$, corresponding to willingness combination
  $({\rm HW}, {\rm HW})$. In the LowHigh Treatment, they are
  $\Pi_c^O=9$ and
  $\Pi_p^O=7$, corresponding to willingness combination
  $({\rm LW}, {\rm HW})$. In the HighLow Treatment, they are
  $\Pi_c^O=7$ and
  $\Pi_p^O=12$, corresponding to willingness combination
  $({\rm HW}, {\rm LW})$. Table 1 summarizes the opportunity payoffs in the three treatments and the corresponding pure-strategy Nash equilibrium and mixed-strategy Nash equilibrium predictions.
The payoffs for the customers and providers in the experiment

Opportunity payoffs in the three treatments and the corresponding pure-strategy Nash equilibrium (PNE) and mixed-strategy Nash equilibrium (MNE) predictions

4.1.1. Pure-strategy Nash equilibrium
Under the given parameters, there are six entrant number combinations at pure-strategy Nash equilibrium (PNE) points in the HighHigh Treatment (i.e.,  $(0,0), (1,1), (2,2), (3,3), (4,4)$, and
  $(10, 10)$), two in the LowHigh Treatment (i.e.,
  $(0,0)$ and
  $(5,6)$), and two in the HighLow Treatment (i.e.,
  $(0,0)$ and
  $(7,6)$). Excluding entrant number combination
  $(0,0)$, the expected payoffs of customers and service providers for entering the market at the other five entrant number combinations in the HighHigh Treatment are 8 and 9.6, respectively. Also, equilibrium point
  $(I,I,...,I)$ strictly Pareto dominates equilibrium point
  $(O,O,...,O)$. If the game converges to equilibrium point
  $(I,I,...,I)$, then the platform’s profit is 24, and the social welfare enhances 60 compared with equilibrium
  $(O,O,...,O)$. The expected payoffs of customers and service providers for entering the market at entrant number combination
  $(5,6)$ in the LowHigh Treatment are 9 and 7.33, respectively, indicating that the pure-strategy equilibria in which the entrant number combination is
  $(5,6)$ weakly Pareto dominates equilibrium point
  $(O,O,...,O)$. In this case, the platform’s profit is 11, and the social welfare enhances 13 compared with equilibrium
  $(O,O,...,O)$. The pure-strategy equilibria in which the entrant number combination is
  $(7,6)$ in the HighLow Treatment also weakly Pareto dominates equilibrium point
  $(O,O,...,O)$ because the expected payoffs of customers and service providers for entering the market at equilibrium point
  $(7,6)$ are 7 and 12.13, respectively. In this case, the platform’s profit is 18.2, and the social welfare enhances 19. We refer to equilibrium
  $(I,I,...,I)$ in the HighHigh Treatment as the high-efficient PNE, equilibrium
  $(O,O,...,O)$ as the secure PNE, and the equilibria where some customers and providers enter the market as the interior PNE points.Footnote 10 The general approach to deriving the PNE can be found in Supplementary Note 1.
4.1.2. Mixed-strategy Nash equilibrium
Apart from PNE, mixed-strategy Nash equilibrium (MNE) may exist in a game (Rapoport et al., Reference Rapoport, Seale, Erev and Sundali1998; Reny, Reference Reny1999). In a mixed-strategy equilibrium, at least one subject plays a randomized strategy, and no subject can increase his/her expected payoffs by playing an alternate mixed approach. We now focus on the case where subjects in the same group adopt the same mixed strategy (i.e., quasi-symmetric MNE). Suppose that a customer enters the market with probability λ, and a service provider enter the market with probability β. At a quasi-symmetric MNE, i.e.,  $(\lambda^*, \beta^*)$, no subject can obtain higher payoffs by unilaterally deviating from this probability combination. We find there is no quasi-symmetric MNE in the HighHigh Treatment, but quasi-symmetric MNE exists in the LowHigh and HighLow treatments. The probabilities of customers and service providers entering the market at MNE in the LowHigh Treatment are 0.732 and 0.920, respectively, and the probabilities of customers and service providers entering the market at MNE in the HighLow Treatment are 0.998 and 0.867, respectively. The general approach to deriving the quasi-symmetric MNE can be found in Supplementary Note 1.
4.2. Subjects
We recruited 300 subjects to participate in a computer-controlled laboratory experiment.Footnote 11 The mean age of the subjects was 22.97 years old, and  $55\%$ were female (see Supplementary Note 2 for descriptive statistics details). The recruited subjects were randomly divided into three treatments, and they received monetary compensation based on their performance. In each treatment, there were five independent sessions, and each session consisted of 20 subjects. There were two roles in the experiment: customer and service provider.Footnote 12 The 20 subjects in one session were equally assigned as customers or service providers, and their roles did not change during the experiment.
4.3. Experimental procedure
The experiment was carried out in batches in a computer laboratory with multiple terminals. Sufficient space between subjects was guaranteed to keep them from glancing at each other’s screens. A subject arriving at the laboratory was randomly assigned a username that determined his/her seating. Also, a protocol regarding the confidentiality of the experiment had to be signed if he/she agreed to participate in the experiment (see Supplementary Note 3 for the experimental consent form). The experiment lasted about one hour for each batch, including a 15-minute slide presentation and a 45-minute formal experiment. During the 15-minute slide presentation, one experimenter introduced the rules of the game and the information provided to the subjects (see Supplementary Note 4 for a sample of the experimental instructions). Subjects’ questions about the experimental procedure were answered by the experimenters individually.Footnote 13 The formal experiment had 200 identical rounds.
Subjects had to choose between options A and B, denoting not entering and entering the market, respectively.Footnote 14 We did not provide the expected payoff functions to the subjects directly and only introduced the essential characteristics of the payoff functions. This setting is similar to that in Erev & Rapoport Reference Erev and Rapoport(1998) and Erev et al. Reference Erev, Ert and Roth(2010), in which the subjects did not receive a description of payoff functions. In our experiment, the subjects were told that the payoffs for staying out of the market were fixed, whereas the payoffs for entering the market decreased and increased as the number of subjects who had the same role and who had the other role entering the market increased. Thus, the cross-side network effects in the experiment were positive (Rochet & Tirole, Reference Rochet and Tirole2004). In each round (except the first round), feedback information from the previous round, including the subject’s own choice, the obtained score, and the cumulative score, was provided to each subject (see Supplementary Note 4 for details). The subjects were required to submit their choices within 20 seconds. After all subjects in one group submitted their choices, the experiment switched to the next round. Cumulative scores in the experiment were converted to Chinese Yuan at a ratio of  $100:3$.Footnote 15
4.4. Experimental hypotheses
In total, the experiment included three independent treatments. The purpose of designing and conducting these three treatments was to test the following hypotheses:
• Hypothesis 1 (Aggregate behavior). Previous experiments in one-sided market entry games (Gary-Bobo, Reference Gary-Bobo1990; Selten & Güth, Reference Selten, Güth, Deistler, Fürst and Schwödiauer1982) showed that market entry behavior was influenced by the opportunity payoffs for staying out of the market (Rapoport et al., Reference Rapoport, Seale, Erev and Sundali1998). Also, based on our theoretical equilibrium analysis, the willingness of customers and service providers to enter the market as well as the cross-side network effects play crucial roles in market entry behavior. Therefore, we posit the following two hypotheses about the effects of the willingness to enter the market and the cross-side network effects on market entry behavior in the two-sided market entry game.
H1a. Subjects in the HighHigh Treatment are more likely to enter the markets than those subjects in the other two treatments.
H1b. Coordination behavior between customers and service providers is significantly influenced by the cross-side network effects.
• Hypothesis 2 (Individual behavior). Previous experimental studies of group decision-making have indicated that choice switches and best responses decreased and increased, respectively, over time (Han et al., Reference Han, Yu, Jia, Gao, Jiang and Zhang2021; Selten et al., Reference Selten, Chmura, Pitz, Kube and Schreckenberg2007). Also, when the game has multiple PNE points and these points are Pareto ranked on one side but Pareto equivalent on the other side, the subjects on the Pareto-equivalent side who enter the market have the same payoffs as they would for staying out of the market. Therefore, we posit the following two hypotheses regarding the effects of the existence of weak Pareto efficiency and strict Pareto efficiency on choice switches and best responses.
H2a. The frequency of choice switches in the HighHigh Treatment is lower than in the other two treatments.
H2b. The proportion of using best responses in the HighHigh Treatment is higher than in the other two treatments.
• Hypothesis 3 (The platform). The market entry behavior of customers and service providers affects the platform’s profit as well as social welfare. Therefore, we posit the following two hypotheses regarding the effects of the willingness to enter the market on the platform’s profit as well as the platform’s effect on social welfare.
H3a. The platform in the HighHigh Treatment has the highest profit among the three treatments.
H3b. The platform enhances social welfare compared with no platform being involved.
5. Experimental results
Based on the proposed hypotheses and previous experimental findings, we investigate aggregate behavior, individual behavior, as well as the platform’s profit and social welfare. Unless otherwise specified, hypothesis testing was performed at the session level to eliminate interaction effects among individuals within one session.
5.1. Aggregate behavior
Table 2 presents the mean proportions of customers and service providers who chose to enter the market in the three treatments. The cross-side network effects were analyzed using the paired-sample Wilcoxon signed-rank test. The results showed no significant differences between the mean proportions of customers and service providers entering the market in the HighHigh and HighLow treatments but revealed a significant difference in the LowHigh Treatment (p = 0.043). The between-treatment effects were analyzed using the Kruskal-Wallis test. The results showed significant differences for both customers (p = 0.009) and service providers (p = 0.004). Customers and service providers in the HighHigh Treatment were more likely to enter the market than those in the other two treatments. This result indicates that willingness to enter the market could affect aggregate market entry behavior, verifying H1a.
Mean proportions of customers and service providers entering the market in the three treatments. Values in brackets denote standard deviations

* p < 0.05,
** p < 0.01.
The opportunity payoffs for customers staying out of the market in the HighHigh and HighLow treatments were the same (i.e.,  $\Pi_c^O=7$). However, the market entry proportion of customers in the HighHigh Treatment was significantly higher than that in the HighLow Treatment (
 $93.3\%$ vs.
  $47.5\%$, Mann-Whitney U test, p = 0.006). A similar result was obtained for service providers in the HighHigh and HighLow treatments (
 $94.8\%$ vs.
  $62.1\%$, Mann-Whitney U test, p = 0.006), in which they had the same opportunity payoffs for staying out of the market (i.e.,
  $\Pi_p^O=7$). These results indicate that the market entry willingness of one side affected the market entry behavior of the other side, providing evidence for cross-side network effects and verifying H1b.
5.1.1. The dynamics of market entry behavior
Next, we studied the effects of the willingness to enter the market on the dynamics of market entry behavior. Figure 3 shows the dynamics of the proportions of customers and service providers entering the market, and Table 3 lists the mean proportions of customer and service provider entrants in the final 10 rounds of each session in the three treatments. As shown in Figure 3(a) and (d), the market entry rates of both customers and service providers increased over time in the HighHigh Treatment. In the final 10 rounds,  $99.2\%$ of customers and
  $99.2\%$ of service providers chose to enter the market. Further, there were six entrant number combinations at PNE points in the HighHigh Treatment. We found that the market entry rates of customers and service providers in the final 10 rounds increased by about
  $37.4\%$ and
  $29.2\%$ compared with the initial 10 rounds. Excluding equilibrium point (
 $O,O,...,O$), both customers and service providers entering the markets have the same expected payoffs at the other PNE points (i.e.,
  $\Pi_c(n_c^*, n_p^*)=8$ and
 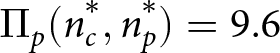 $\Pi_p(n_c^*, n_p^*)=9.6$). However, aggregate market entry behavior approached strictly Pareto-dominant Nash equilibrium (i.e., high-efficient PNE (
 $I,I,...,I$)) over time, indicating that tacit coordination between customers and service providers could promote market entry behavior under strategic uncertainty (Van Huyck et al., Reference Van Huyck, Battalio and Beil1990).
Dynamics of the 10-round moving average proportions of customers and service providers entering the market in the three treatments. The proportions of customers and service providers entering the market in each session are shown in gray, the average values across five sessions are presented in color, and the ranges between the 5th and 95th percentiles are denoted by the shadowed areas. The red triangles present the proportion of customers/providers entering the market at PNE points, and the solid lines denote probabilities of customers and providers entering the market at MNE under different conditions

Mean proportions of customers and service providers entering the market in the final 10 rounds of each session in the three treatments

As shown in Figure 3(b) and (e), however, the proportions of customers and service providers who entered the market decreased over time in the LowHigh Treatment. In the initial 10 rounds,  $59.6\%$ of customers and
  $69.2\%$ of service providers chose to enter the market; in the final 10 rounds, only
  $41\%$ of customers and
  $56.6\%$ of service providers preferred to enter the market. Although the proportion of service providers entering the market was higher than the proportion of customers entering the market in the final 10 rounds, more than
  $30\%$ of service providers did not enter the market, indicating a failure of coordination when the opportunity payoffs of customers for staying out of the market are high. Also, there were two entrant number combinations at PNE points (i.e.,
  $(5,6)$ and
  $(0,0)$) in the LowHigh Treatment. Although the average choice behavior in the final 10 rounds across the five sessions was close to entrant number combination
  $(5,6)$ (one-sample t test, customers: p = 0.191, service providers: p = 0.724), the choice behavior in the final 10 rounds was quite diverse across the five sessions. As shown in Table 3, the mean number of entrants for customers and service providers in the highest-entry session was 5.8 and 7.8, respectively, and 2.7 and 2.8 in the lowest-entry session. Therefore, although the average choice behavior was close to entrant number combination
  $(5,6)$, “coordination magic” did not emerge in some sessions.
Furthermore, as shown in Figure 3(c) and (f), the market entry rates of customers and service providers both decreased over time in the HighLow Treatment. In the initial 10 rounds,  $65.8\%$ of customers and
  $57.8\%$ of service providers chose to enter the market; in the final 10 rounds, only
  $38.0\%$ of customers and
  $34.2\%$ of service providers chose to enter the market. More than
  $60\%$ of customers did not enter the market, indicating a failure of coordination caused by the high opportunity payoffs of service providers for staying out of the market. Also, there were two entrant number combinations at PNE points (i.e.,
  $(7,6)$ and
  $(0,0)$) in the HighLow Treatment. The average choice behavior in the final 10 rounds across the five session deviated from entrant number combination
  $(7,6)$ (one-sample t test, customers: p = 0.012, service providers: p = 0.021). Further, as shown in Table 3, the mean number of customers and providers who entered the market was 6.4 and 5.7, respectively, in the highest-entry session, which is close to entrant number combination
  $(7,6)$; however, the market entry behavior in the other sessions did not reach either of the two entrant number combinations at PNE.
5.1.2. Equilibrium distance
Next, we define the equilibrium distance between aggregate behavior and the (expected) entrant number combination at equilibrium points to measure behavior convergence as follows:
 \begin{equation}
{\rm{ED}}=\sqrt{(n_c-n_c^*)^2+(n_p-n_p^*)^2}.
\end{equation}
\begin{equation}
{\rm{ED}}=\sqrt{(n_c-n_c^*)^2+(n_p-n_p^*)^2}.
\end{equation} Equilibrium distance unifies the gaps between the market entry behavior of customers and service providers and the measured equilibrium point. It is evident that aggregate behavior stabilizes at the measured equilibrium point when equilibrium distance equals zero. Also, we define the one-unit equilibrium distance as  $\sqrt{2}\approx 1.41$, which is calculated from the one customer and one provider differences from the measured equilibrium point.
Table 4 lists the equilibrium distances between the equilibrium points and aggregate market entry behavior in each session in the three treatments. Market entry behavior in three of the five sessions in the HighHigh Treatment stabilized at equilibrium point  $(I,I,...,I)$, and market entry behavior in the other two sessions was very close to equilibrium point
  $(I,I,...,I)$. This further confirms that the aggregate market entry behavior in the HighHigh Treatment converged to strictly Pareto-dominant equilibrium.
Mean equilibrium distances in the final 10 rounds in each session in the three treatments. The first number combinations in the LowHigh and HighLow are the expected numbers of customers and service providers entering the market at MNE. The other number combinations are the numbers of customers and service providers entering the market at PNE

In the LowHigh Treatment, the market entry behavior in four of the five sessions was closer to entrant number combination  $(5,6)$ compared with
  $(0,0)$. However, the equilibrium distances between aggregate behavior and entrant number combination
  $(5,6)$ in the four sessions were larger than one-unit equilibrium distance, indicating that the interior PNE points could not predict aggregate behavior very well. Also, aggregate behavior in Session 5 was located between entrant number combinations
  $(5,6)$ and
  $(0,0)$. As shown in Supplementary Figure S1, the equilibrium distance between aggregate behavior and entrant number combination
  $(0,0)$ decreased across rounds in Session 5, indicating that aggregate behavior was approaching (but did not converge to) equilibrium point
  $(O,O,...,O)$ over time.
Aggregate behavior was more diverse in the HighLow Treatment than in the LowHigh Treatment. In three of the five sessions in the HighLow Treatment, market entry behavior was located between entrant number combinations  $(7,6)$ and
  $(0,0)$. As shown in Supplementary Figure S1, market entry behavior moved from the vicinity of entrant number combination
  $(7,6)$ to the location between entrant number combinations
  $(7,6)$ and
  $(0,0)$ over time. Market entry behavior in Session 1 was closer to entrant number combination
  $(7,6)$ than
  $(0,0)$, and market entry behavior in Session 4 was closer to equilibrium point
  $(O,O,...,O)$. Although market entry behavior in Session 1 and Session 4 was located in the vicinity of entrant number combinations
  $(7,6)$ and
  $(0,0)$, respectively, their equilibrium distances were both larger than one-unit equilibrium distance. Also, as shown in Supplementary Figure S1, market entry behavior in Session 4 moved from the vicinity of entrant number combination
  $(7,6)$ to the vicinity of entrant number combination
  $(0,0)$ over time.
Furthermore, as shown in Figure 3 and Table 4, compared to the interior PNEs, the MNEs were even less able to account for the aggregate market entry behavior in the final 10 rounds in the LowHigh and HighLow treatments. The probabilities of service providers entering the market in the LowHigh Treatment and customers entering the market in the HighLow Treatment at MNEs are 0.920 and 0.998, respectively, indicating that almost all potential service providers in the LowHigh Treatment and all potential customers in the HighLow Treatment should choose to enter the market at MNEs. However, the expected payoffs at MNEs are the same as the opportunity payoffs for staying out of the market. Given this, staying out of the market is a better choice than entering the market for some players. Owning to the cross-side network externalities, the probability of entering the market on one side is reduced, resulting in a reduction in entering the market on the other. Therefore, as shown in Figure 3, the numbers of customers and service providers entering the market decreased and move away from MNEs over time in the LowHigh and HighLow treatments.
The above analysis of equilibrium distance indicates that strictly Pareto-dominant equilibrium could predict market entry behavior extremely well, but weakly Pareto-dominant equilibrium did not predict the market entry behavior very well. In other words, equilibrium that only makes one side’s payoffs for entering the market higher than the opportunity payoffs for staying out of the market cannot stabilize market entry behavior, further verifying H1a and H1b.Footnote 16
5.2. Individual behavior
5.2.1. Individual entry behavior classification
Thus far, we have analyzed aggregate market entry behavior and observed coordination success in the HighHigh Treatment and coordination failure and disequilibrium in the LowHigh and HighLow treatments. Aggregate behavior in the LowHigh and HighLow treatments was not organized very well by PNE points. Although the number of entrants on both sides decreased over time in the LowHigh and HighLow treatments, there were still some customers and service providers entering the market. Therefore, a question arises: Why some customers and service providers still enter the market? To answer this question, we divided customers/providers in the three treatments into three categories—rare entrant, median entrant, and frequent entrant—based on the frequency of entering the market using k-means clustering.
Supplementary Table S2 shows the classification results for customers and service providers in the three treatments. In the HighHigh Treatment, 48 of the 50 customers and 49 of the 50 service providers were classified as frequent entrants, and their market entry frequencies were  $94.9\%$ and
  $95.2\%$, respectively. However, the classification results in the LowHigh and HighLow treatments were different from those in the HighHigh Treatment. The number of frequent entrants in the LowHigh and HighLow treatments was much lower than that in the HighHigh Treatment. For example, only 3 of the 50 customers in the LowHigh Treatment were classified as frequent entrants. Correspondingly, the number of rare entrants and median entrants in the LowHigh and HighLow treatments was much larger than that in the HighHigh Treatment, and a significant number of individuals were classified as median entrants. Supplementary Figure S2 shows the time evolution of market entry behavior in the three categories. Market entry behavior did not show significant differences in the initial choices across different categories. The proportion of entrants in the frequent-entry category and median-entry category slightly increased and decreased, respectively, across rounds. However, the proportion of entrants in the rare-entry category rapidly decreased over time. For example, in the LowHigh Treatment, the mean market entry frequency of rare-entry customers dropped from
  $47.5\%$ in the initial 10 rounds to
  $5.8\%$ in the final 10 rounds. This analysis indicates that individuals showed high diversity in market entry behavior, and the decrease in the market entry rate was mainly caused by gradual exit from the market among a portion of the individuals (i.e., the rare entrants).
Next, we analyze the mean payoffs of customers/providers in the three categories. Since most individuals in the HighHigh Treatment were classified as frequent entrants, we only analyze the payoffs in the LowHigh and HighLow treatments. As shown in Figure 4, the frequent entrants in the two treatments had the highest payoffs. For customers, the median entrants had the lowest payoffs in the two treatments. For service providers, the median entrants had the lowest payoffs in the LowHigh Treatment but had nearly the same payoffs as the rare entrants in the HighLow Treatment. The customers and service providers who persisted in entering the market could form a “small market,” thereby earning more payoffs than the other individuals. This is the underlying reason why there were still some customers and service providers who preferred to enter the market as time evolved. Compared with frequent entrants, the individuals who frequently switched between entering the market and staying out of it usually could not obtain high payoffs. Supplementary Figure S3 shows the time evolution of average payoffs in the three categories. The average payoffs of the frequent entrants fluctuated across rounds, and their relatively high payoffs were from the “peak” values in the time evolution.
Mean payoffs of customers and service providers in each category in the LowHigh and HighLow treatments

5.2.2. Choice switch
The final market entry behavior could not be reached without the choice switching process from round to round. It is necessary, therefore, to analyze the choice switches to understand the evolution of individuals’ market entry behavior under strategic uncertainty.
Table 5 presents the mean proportions of choice switches in the three treatments. The results showed that there were no significant differences for choice switches across the two sides, indicating that the cross-side network effects made the choice switches of customers and service providers similar. Also, the opportunity payoffs for staying out of the market influenced the choice switches of both customers (p = 0.009) and service providers (p = 0.018). The frequency of choice switches for customers and service providers in the HighHigh Treatment was much lower than in the other two treatments, thus verifying H2a. A detailed analysis of the time evolution of choice switches can be found in Supplementary Note 5, Supplementary Figures S4–S5, and Supplementary Tables S3–S4. Supplementary Table S5 presents the frequency of choice switches based on the individual classification results in the LowHigh and HighLow treatments. The choice switch frequencies of median entrants were significantly higher than those of the other two kinds of entrants because they were more likely to switch between entering the market and staying out of it.
Mean percentages of choices switches for customers and service providers in the three treatments. Values in brackets denote standard deviations

*  $^{*}p \lt 0.05$,
**  $^{**}p \lt 0.01$.
5.2.3. Best response
One way to check whether the choice behavior in one game has reached Nash equilibrium is to analyze the subjects’ best-response behavior (Ellison, Reference Ellison1993). Nash equilibrium is reached when each player in a game has selected the best response. Also, the analysis of best-response behavior can reflect interactions among individuals, which were neglected in the analysis of choice switches. The (myopic) best response in repeated games can be examined according to whether an individual maximizes his/her payoffs taking others’ strategies in the previous round as given (Han et al., Reference Han, Cao, Shen, Zhang, Wang, Cressman and Stanley2017; Liu et al., Reference Liu, Mak and Rapoport2015).
Table 6 presents the mean percentages of best responses in the three treatments. The paired-sample Wilcoxon signed-rank test for the best responses between customers and service providers showed no significant differences. The Kruskal-Wallis test for the best responses among the three treatments showed significant differences for both customers (p = 0.009) and service providers (p = 0.009). The percentages of best responses in the HighHigh Treatment were significantly higher than those of the other two treatments, verifying H2b. More than  $50\%$ of choices in the LowHigh and HighLow treatments did not belong to the best response. This result indicates that the individual choice behavior did not satisfy the mutual best-response property of equilibrium, demonstrating the failure of Nash equilibrium prediction in the two treatments. A detailed analysis of the time evolution of best responses can be found in Supplementary Note 6, Supplementary Figures S6–S7, and Supplementary Tables S6–S7. Supplementary Table S8 shows the best response frequencies in the three categories for customers and service providers in the LowHigh and HighLow treatments. For customers, the frequent entrants had the highest best response frequencies among the three kinds of entrants. For service providers, however, the low entrants were more likely to adopt the best responses than the other two kinds of entrants. These results indicate that entering the market is more likely to be the best response for customers while staying out of the market might be better than entering it for service providers. When opportunity payoffs for staying out of the market were high for one side but low for the other, this inconsistency in response patterns may induce coordination failure between customers and service providers, thereby making it difficult to achieve market convergence to the Pareto-dominant PNE points.
Mean ratios of using best responses for customers and service providers in the three treatments. Values in brackets denote standard deviations

**  $^{**}p \lt 0.01.$
5.3. The platform
Thus far, we have investigated the market entry behavior and individual behavior of customers and service providers. Next, we analyze the platform’s profit and social welfare to further understand the effects of market entry behavior on the market.
Table 7 presents the platform’s profit and statistical results related to social welfare in the three treatments. The platform’s profit in the HighHigh Treatment was significantly higher than that in the other two treatments. This result is consistent with H3a, indicating that the platform needs to coordinate customers and service providers to improve its profit. Furthermore, the platform significantly improved social welfare in the HighHigh Treatment compared with no platform involved. In the HighLow Treatment, however, social welfare only improved  $3.95\%$ compared with no platform involved, and the one-sample t-test did not reject the null hypothesis (t = 2.68, p = 0.056). We also found that social welfare in the session with the lowest market entry rates (customer:
  $25.5\%$, provider:
  $25.9\%$) was 186.4, which was lower than the social welfare achieved without a platform (i.e., 190). This result is inconsistent with H3b, indicating that the platform did not always improve social welfare compared with no platform involved. When customers and service providers cannot coordinate successfully, the platform can even reduce social welfare. A more detailed analysis of the time evolution of the platform’s profit and social welfare can be found in Supplementary Note 7 and Supplementary Figures S8–S9.
The platform’s profit and statistical results related to social welfare in the three treatments

6. Discussion
Like many one-sided market entry games with limited prior information (Erev et al., Reference Erev, Ert and Roth2010; Erev & Rapoport, Reference Erev and Rapoport1998), we observed coordination success in the two-sided market entry game when customers and service providers are highly willing to enter the market. However, coordination failure and disequilibrium might emerge when customers or service providers have a low willingness to enter the market in the two-sided market entry game. Here we offer some possible interpretations of the coordination success in the HighHigh Treatment and coordination failure in the LowHigh and HighLow treatments.
When customers and service providers are highly willing to enter the market, the PNE points are efficient ranking. As a result, subjects of the two sides in the HighHigh Treatment can coordinate via error-and-trial and stabilize at the high-efficient PNE despite lacking global information. However, when one of the two sides has a low willingness to enter the market, the PNE points are not efficient ranking for both sides. For example, in the LowHigh Treatment, the payoffs of customers who enter the market under the interior PNE points have the same payoffs as under the secure PNE. In this case, staying out of the market is a secure action for customers, and achieving coordination is hard although converging to the interior PNE points in the LowHigh Treatment can benefit the service providers who choose to enter the market.
Further, in the HighHigh Treatment, the high-efficient PNE is Pareto optimal and unique (i.e., everyone enters without multiplicity), so we observed a convergence to that equilibrium. However, in the LowHigh and HighLow treatments, the feasible equilibria are interior and require that, among subjects in the same role, some enter and some stay out. A huge multiplicity of equilibria ensues: for example, in the LowHigh Treatment, there are  $52,920$ different combinations of players each of which constituting an interior PNE. The multiplicity of interior PNE points therefore potentially leads to coordination failure and disequilibrium.
Also, as shown in Figure 3, the proportions of customers and service providers entering the market in the initial 10 rounds were significantly higher than  $50\%$, indicating that the experimental instruction triggered high initial entry rates for both sides. However, only in the HighHigh Treatment this initial behavior is stable. In the other two treatments, the proportions of customers and service providers entering the market decayed as time evolved. The joint effect of the initial propensities of entering the market induced by the experimental instruction and the learning process through the feedback information may generate different coordination outcomes in the three treatments (Erev & Rapoport, Reference Erev and Rapoport1998; Roth & Erev, Reference Roth and Erev1995).
Apart from the difference in coordination behavior between the HighHigh Treatment and the other two treatments, we also observed relatively better convergence to interior PNE points in the LowHigh Treatment than in the HighLow Treatment. The LowHigh and HighLow treatments have three same characteristics at interior PNE points: (1) the customers who enter the market have the same payoff as those who stay out of the market; (2) the service providers who enter the market have a higher payoff than those who stay out of the market; (3) the entrant numbers of service providers are the same in the two treatments. However, to achieve an interior PNE, more customers are needed to enter the market in the HighLow Treatment compared to the LowHigh Treatment. Therefore, compared to the LowHigh Treatment, converging to an interior PNE is more difficult in the HighLow Treatment. As time evolved, the aggregate behavior in the HighLow Treatment deviated more from an interior PNE than the LowHigh Treatment. As shown in Figure 4, the payoffs of rare-entrant and frequent-entrant customers did not show a significant difference (p = 0.457) in the LowHigh Treatment. However, in the HighLow Treatment, the frequent-entrant customers significantly benefited more compared to the rare-entrant customers (p = 0.002). This is also due to the relatively better convergence to an interior PNE in the LowHigh Treatment than in the HighLow Treatment because the customers entering the market have the same payoff as those who stay out of the market when converging to interior PNE points in both treatments. Also, the relatively higher payoffs of the frequent entrants in the HighLow Treatment make some customers and service providers willing to stay in the market, maintaining the existence of the “small market” in that treatment.
7. Conclusion remarks
In this study, we propose a two-sided market entry game to investigate coordination behavior of customers and service providers with regard to entering the market. Unlike one-sided market entry games, market capacity in this two-sided market entry game is endogenous and determined by the number of entrants on both sides. The two-sided market entry game also features asymmetric subjects, cross-side network externalities, and multiple pure-strategy Nash equilibria.
We conduct a laboratory experiment to check whether the “coordination magic” seen in one-sided market entry games with limited prior information also exists in the two-sided market entry game (Erev et al., Reference Erev, Ert and Roth2010; Erev & Rapoport, Reference Erev and Rapoport1998). The experiment involved three treatments, corresponding to a scenario in which the pure-strategy Nash equilibria are Pareto ranked on both sides (i.e., the HighHigh Treatment) and two scenarios in which the pure-strategy Nash equilibria are Pareto ranked on one side but Pareto equivalent on the other (i.e., the LowHigh and HighLow treatments). The subjects did not receive a precise description of payoff functions. Also, their feedback information was limited to the payoff they received after each round. Our experimental results not only enrich the findings of previous studies of group coordination but also have some innovative outcomes. First, coordination success between customers and service providers is possible when the pure-strategy Nash equilibria are Pareto ranked on both sides. However, coordination failure and disequilibrium may occur when the pure-strategy Nash equilibria are Pareto ranked on one side but Pareto equivalent on the other. This result highlights the effects of cross-side network externalities on coordination behavior in two-sided markets. The “coordination magic” seen in many one-sided market entry games may disappear in two-sided market entry games. This highlights the importance for marketing researchers and intermediary platforms of assessing rather than assuming the rationality of market entry behavior in two-sided markets. Second, although reducing the number of service providers entering the market (such as through increasing the retaining ratio ρ) is one possible way to enhance the platform’s profit, this could generate coordination failure and disequilibrium, thereby harming the platform’s profit. For example, intermediary platforms usually subsidize customers and service providers in the early days to attract more market participants (Lian & Van Ryzin, Reference Lian and Van Ryzin2021). However, when there are enough market participants, some platforms increase their retaining ratios, thereby forcing some service providers to exit the markets. In the long run, such an operation strategy may lead to coordination failure. A thriving two-sided market should get both sides on board. Therefore, intermediary platforms should enact operation strategies to coordinate customers and service providers to maintain sustainable operations. Third, compared with the HighHigh Treatment, individuals’ market entry behavior showed significant diversity in the other two treatments. Coordination failure and disequilibrium were mainly caused by a part of customers and service providers retreating from the market over time. However, some customers and service providers still preferred to enter the market. The frequent entrants formed a “small market,” making their payoffs higher than those of the other individuals who had the same role. Therefore, to maintain the operation of a thriving two-sided market, it is crucial to attract rare and median entrants to stay in the two-sided market.
This study has some limitations that can highlight directions for further investigation. In the two-sided market entry game, we use a proportional relationship to describe the tension between demand and supply and a fair cost-sharing allocation mechanism to determine the expected payoffs of service providers for entering the market. However, some other types of payoff functions, such as linear demand and inelastic supply (Hagiu & Spulber, Reference Hagiu and Spulber2013), need to be further investigated. We observed coordination failure and disequilibrium when the multiple pure-strategy Nash equilibria were Pareto ranked on one side but Pareto equivalent on the other. Promoting coordination is crucial for many economic activities and for organizational performance. Many previous studies have verified the effects of certain mechanisms—such as communication (Cooper et al., Reference Cooper, DeJong, Forsythe and Ross1992), teams (Feri et al., Reference Feri, Irlenbusch and Sutter2010), social identity (Chen & Chen, Reference Chen and Chen2011), gradualism (Ye et al., Reference Ye, Zheng, Nikolov and Asher2020), and information feedback (Brandts & Cooper, Reference Brandts and Cooper2006; Devetag, Reference Devetag2003)—on overcoming coordination failure and promoting coordination. Therefore, another research direction would be to test whether these mechanisms help promote coordination in two-sided market entry games. Our experiment was small-scale, with only 10 customers and 10 service providers in each session. Van Huyck et al. Reference Van Huyck, Battalio and Beil(1990) found that group size significantly affects coordination behavior in order statistic games. Coordination success is difficult to achieve in large groups compared with small groups. Therefore, a third research direction would be to conduct large-scale experiments to investigate the effects of group size on coordination behavior. Also, the effects of other factors, such as historical experience and initial belief, should be further investigated. Fourth, the subjects in our experiment made choices independently and simultaneously in each round. Such an experimental setting provides no information about choice observability among subjects. Previous theoretical studies have reported that sequential participation significantly affects choice behavior, such as market entry behavior in two-sided markets (Hagiu & Spulber, Reference Hagiu and Spulber2013) and route choices in transportation networks (Acemoglu et al., Reference Makhdoumi, Malekian and Ozdaglar2018). Also, Mak et al. Reference Mak, Seale, Gisches, Rapoport, Cheng, Moon and Yang(2018a) experimentally found that a limited extent of sequential choice observability could result in efficient coordination. Therefore, investigating how the sequential observability of market entry behavior affects coordination behavior in two-sided markets is another potential direction for future research.
Fifth, Rapoport et al. Reference Rapoport, Seale, Erev and Sundali(1998) reported that PNE could predict aggregate behavior extremely well whether payoffs for staying out were positive or negative in one-sided market entry games. However, whether this is true in two sided-market is still an open question. Also, constrained by the proportional relationship used in the payoffs of customers entering the market, the payoffs of the customers entering the market are negative when there are too many customers but few service providers entering the market. Although we found that the domain of negative payoffs rarely appeared in the experiments ( $0\%$ in the HighHigh Treatment,
  $0.41\%$ in the LowHigh Treatment, and
  $2.03\%$ in the HighLow Treatment), the negative payoffs may matter in coordination behavior in the two-sided market entry game. Therefore, the fifth research direction is to conduct more experiments under pure gains or losses to confirm our findings. Our coordination incentives for the Pareto-ranked side in the HighLow and LowHigh treatments were relatively small. However, incentives usually play a crucial role in cooperation and coordination (Potters & Suetens, Reference Potters and Suetens2020). Whether high incentives on one side can overcome coordination failure and make the aggregative behavior converge to the Pareto-dominate equilibrium is still an open question. Therefore, the sixth research direction is to conduct experiments under different coordination incentives to further understand coordination behavior in two-sided markets. Seventh, similar to the experimental settings in Erev & Rapoport Reference Erev and Rapoport(1998) and Erev et al. Reference Erev, Ert and Roth(2010), we did not provide a precise description of the payoff structure in the experiments. Previous experimental studies for the one-sided market entry games found that quick convergence to equilibrium was achieved whether providing the payoff structure or not (Rapoport et al., Reference Rapoport, Seale, Erev and Sundali1998; Erev & Rapoport, Reference Erev and Rapoport1998). However, whether this is true in the two-sided market entry game should be further experimentally investigated. Also, Erev et al. Reference Erev, Ert and Roth(2010) found that subjects were highly sensitive to forgone payoffs in the one-sided market entry game experiments. This also should be further investigated in the two-sided market entry game. Furthermore, more experiments should be conducted to understand whether disclosing more feedback information, such as the number of entrants and the payoffs of the other side, could improve coordination success and accelerate the convergence to equilibrium. Last but not least, as pointed out by Roth & Erev Reference Roth and Erev(1995): “No one can look widely at experimental data without noticing that experience matters.” (p. 164). Given that learning is essential, many reinforcement learning models, such as the Roth-Erev model, were proposed to understand and predict the coordination behavior in experimental data (Roth & Erev, Reference Roth and Erev1995; Erev & Rapoport, Reference Erev and Rapoport1998). Therefore, extending these reinforcement learning models to reproduce the major features of experimental results in the two-sided market entry game should also be guaranteed in further studies.
Supplementary material
The supplementary material for this article can be found at https://doi.org/10.1017/eec.2024.2.
Replication materials
The replication material for the study is available at https://doi.org/10.17605/OSF.IO/CMS5Z.
Acknowledgements
We extend our gratitude to Roberto Weber, Ido Erev, and three anonymous referees for their insightful feedback. We also thank Xiqun Chen, Hai Yang, Xiao Liu, and Yunzhe Qiu for their valuable comments.
Funding statement
This work is partially supported by grants from the National Natural Science Foundation of China (Nos. 72288101, 72371016, 71931002, 72103021, 72131003, and W2411064) and the Beijing Natural Science Foundation (No. Z220001).
Competing interests
The authors have no conflicts of interest to declare.


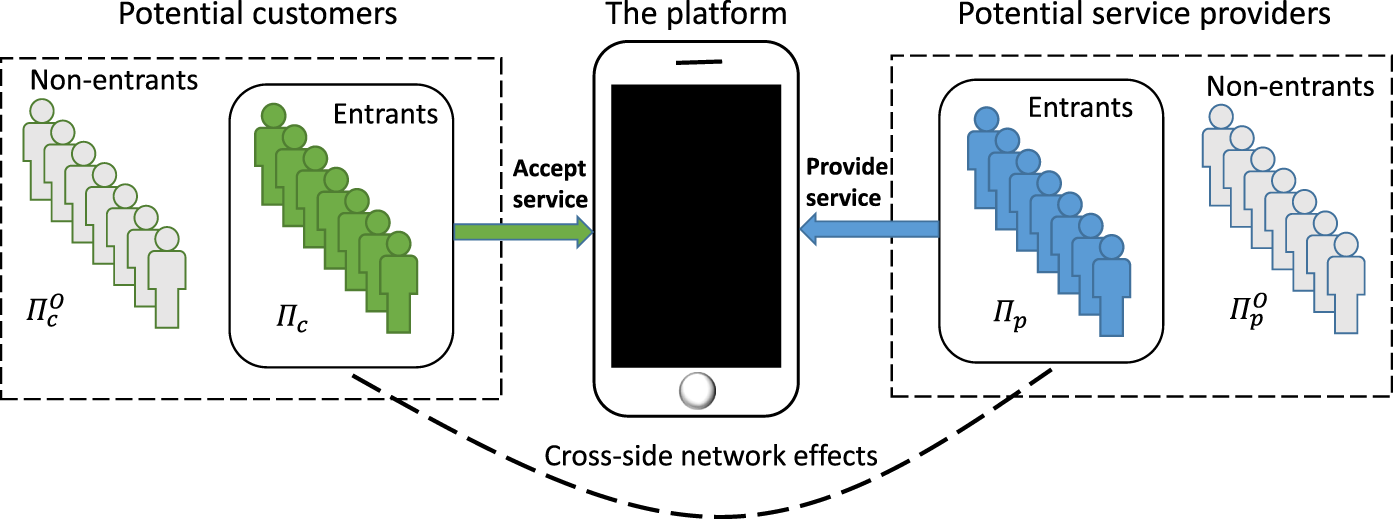
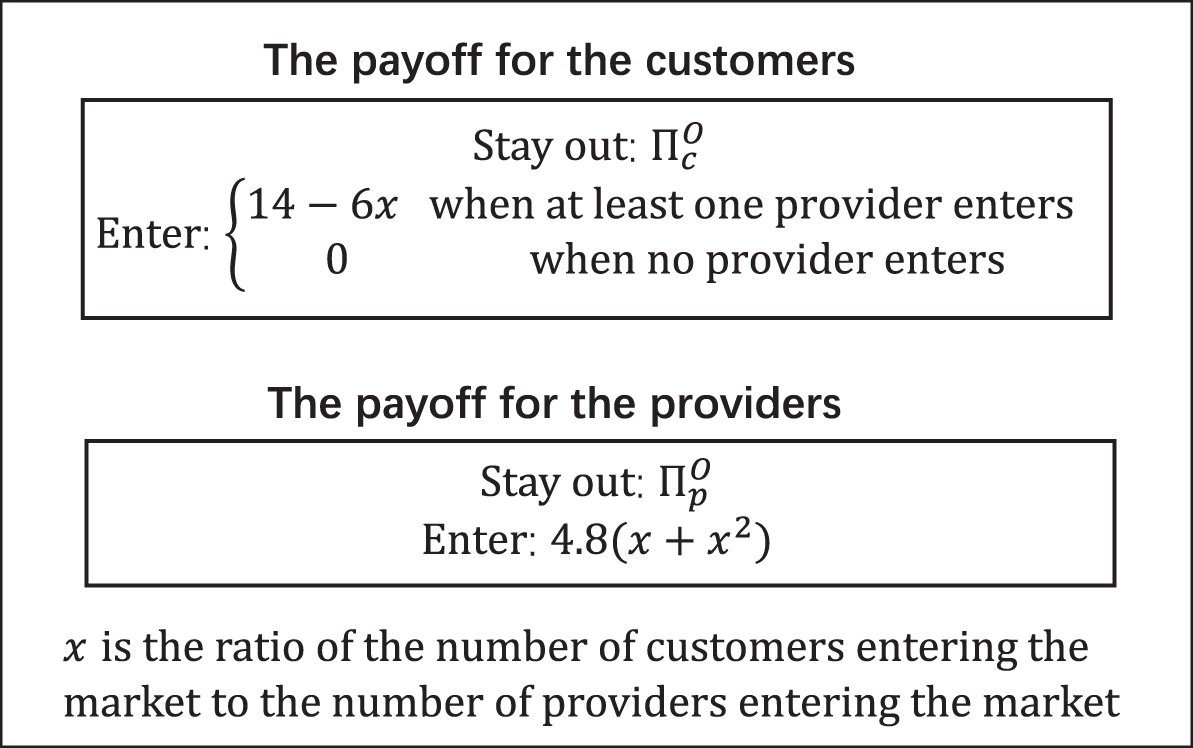


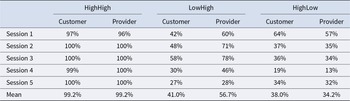

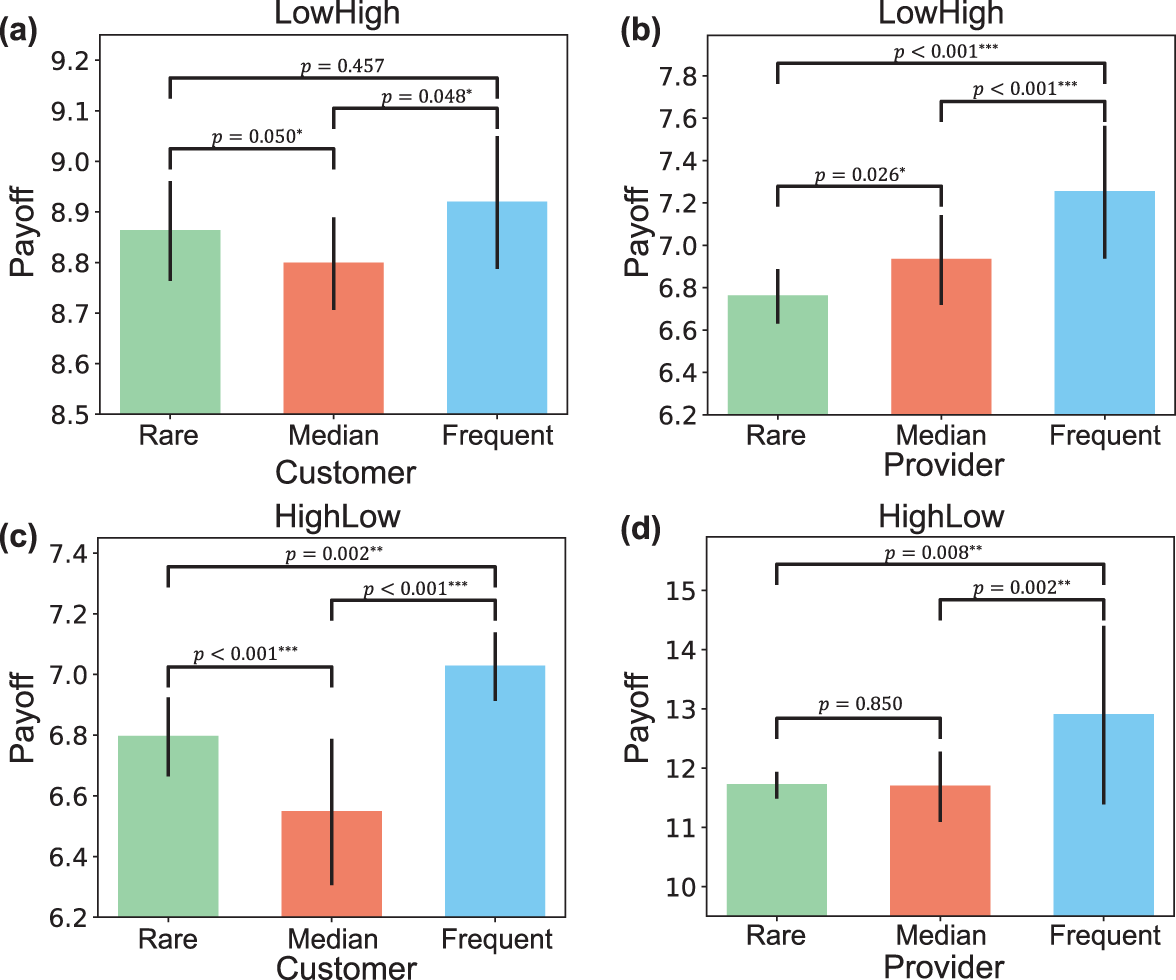


 Open access