

1. Introduction
The continental lithosphere of the southwestern part of the Gondwana supercontinent was consolidated towards the end of Proterozoic time (for details, see Ramos, Reference Ramos1988; Ramos, Cristallini & Pérez, Reference Ramos, Escayola, Mutti, Vujovich, Dilek and Moores2000). This process introduced a planar anisotropy in the basement that controlled the development of Phanerozoic basins in Argentina. The accretion of terranes to the Pacific margin of Gondwana during the early Palaeozoic era reactivated these anisotropies and created others, mainly during the Ordovician–Silurian periods (Ocloyic deformation phase). Mesozoic basins with two extensional styles were accommodated by NE and NW planar structural fabrics that affected the metamorphic basement in the Río de la Plata and Pampean domains, facing the Atlantic and Pacific continental margins, respectively (Fig. 1; Martino, Guereschi & Carignano, Reference Martino, Guereschi and Carignano2012).
Schematic map of southern South America showing the Mesozoic extensional basins in Argentina (modified from Uliana, Biddle & Cerdan, Reference Uliana, Biddle, Cerdan, Tankard and Balkwill1989; Rossello & Mozetic, Reference Rossello and Mozetic1999; Chebli et al. Reference Chebli, Spalletti, Rivarola, de Elorriaga, Webster, Chebli, Cortiñas, Spalletti, Legarreta and Vallejo2005; Martino et al. Reference Martino, Guereschi, Carignano, Calegari, Manoni, Martino and Guereschi2014). These are accomodated on structural planar fabrics orientated NW and NE, affecting the metamorphic basement in the Pampean and Río de la Plata domains (separated here by the dashed line). In the Pampean domain, two lineaments that controlled the Cretaceous basins are recognized – the Valle Fértil lineament (VFL) and the Eastern Pampean lineament (EPL) – today reactivated and forming the Sierra Chica fault. These two lineaments correspond respectively to two sutures, the Palaeozoic accretion of Cuyania (C) to the Pacific Gondwana margin (VFL) and the assembly of the Río de la Plata craton with the Pampia terrane in Precambrian times (EPL). The latter and the Sierra Chica fault are probably the surface expression of the true suture which is situated towards the east at lower structural levels of the lithosphere, where it has been geophysically detected.

In the Pampean domain, two lineaments that controlled the Cretaceous basins in the central mainland of Argentina (Fig. 1) are recognized: the Valle Fértil lineament; and the Eastern Pampean lineament. The latter is reactivated today and forms the current Sierra Chica fault in the Eastern Sierras Pampeanas (Uliana, Biddle & Cerdan, Reference Uliana, Biddle, Cerdan, Tankard and Balkwill1989; Rossello & Mozetic, Reference Rossello and Mozetic1999; Chebli et al. Reference Chebli, Spalletti, Rivarola, de Elorriaga, Webster, Chebli, Cortiñas, Spalletti, Legarreta and Vallejo2005; Richardson et al. Reference Richardson, Ridgway, Martino, Gilbert, Anderson, Carignano and Enkelmann2009). These two lineaments are sutures: the Valle Fértil lineament is the Palaeozoic suture marking accretion of the Cuyania terrane (Precordillera plus Western Sierras Pampeanas; Ramos et al. Reference Ramos, Jordan, Allmendinger, Mpodozis, Kay, Cortés and Palma1986) to the Pacific Gondwana margin; and the Eastern Pampean lineament is the suture assembly of the Río de la Plata craton with the Pampia terrane in Precambrian times.
Tertiary Andean compression, recording arrival of the Nazca plate with low-angle subduction, produced inversion of Cretaceous basins (Schmidt et al. Reference Schmidt, Astini, Costa, Gardini, Kraemer, Tankard, Suárez and Welsink1995), block-faulting and clockwise-tilting (relative to present-day north), resulting in the current landscape of the Sierras de Córdoba (Gordillo & Lencinas, Reference Gordillo, Lencinas and Turner1979). The uplift of these blocks and the landscape of tilted blocks impressed one of the first geologists who systematically studied the Argentinian territory (Stelzner, Reference Stelzner1875). The natives called the high plains ‘pampas’ and, because of the common appearance of the ‘sierras’ and ‘pampas’ landscape, Stelzner gave these ranges the name ‘Pampinas’ which became ‘Pampeanas’.
The Sierras de Córdoba are the easternmost group of the Sierras Pampeanas geological province. They consist of a Neoproterozoic–Palaeozoic basement arranged in N–S-aligned mountain ranges, limited by Tertiary W-vergent reverse faults and thrusts (Fig. 2).
(a) Panoramic view to the ENE of the Sierras Pampeanas of Córdoba. The linearity of the mountain ranges separated by reverse faults and basement thrusts are evident. In the foreground, the NW corner of the Achala batholith, Sierra Grande, and in the background, Sierra de Cuniputo and Sierra Chica on the horizon. The point of maximum height is the Cerro Uritorco (1950 m a.s.l.). (b) View toward ESE in the foreground showing the Pampa de Pocho and a small dark range named La Sierrita, composed of mylonitic rocks from the Ambul–Mussi ductile shear zone, with the La Sierrita fault at its foot. Silhouetted against the horizon are the Sierra Grande block and its southwards prolongation into the Sierra de Comechingones. (c) View SE from the central part of the Achala batholith towards the scarp of the Sierra de Comechingones fault. The point of maximum height is the Cerro Champaquí (2884 m a.s.l.). In the central part of the escarpment, it is the horst-like elevation of the Pampa de Achala shown in Figure 9.

A first version of the Tertiary structure of the Sierras de Córdoba was a sketch published by Beder (Reference Beder1922), reproduced here as Figure 3. The first to address the problem of block uplift was González Bonorino (Reference González Bonorino1950). In a pioneering work this author suggested that the uplift faults, reflecting shallow brittle deformation as a result of compression, would become horizontal at depth: plastic deformation absorbs brittle deformation and the upper crust would be displaced in the lower crust along roughly horizontal planes, anticipating the concept of brittle–ductile transition applied to lithospheric deformation. Cuerda (Reference Cuerda1973) applied the concept of ‘pillar-bridge horse’ to the sinking towards the ends of the raised blocks, with maximum displacement in their central parts.
Sketch of the Tertiary tectonic structure (block uplift) of the Sierras de Córdoba published by Beder (Reference Beder1922).

Briefly, according to Jordan & Allmendinger (Reference Jordan and Allmendinger1986) uplift of the basement blocks in the Sierras de Córdoba would have started about 10 Ma ago, but today there is evidence of rising as old as the Carboniferous period (Ramos, Reference Ramos1988; Jordan et al. Reference Jordan, Zeitler, Ramos and Gleadow1989; Coughlin et al. Reference Coughlin, O'sullivan, Khon and Holcombe1998; Löbens et al. Reference Löbens, Bense, Wemmer, Dunkl, Costa, Layer and Siegesmund2011; Martino, Guereschi & Carignano, Reference Martino, Guereschi and Carignano2012; Richardson et al. Reference Richardson, Ridgway, Gilbert, Martino, Enkelman, Anderson and Alvarado2013). Block uplift could be produced by: (1) low-angle reverse faults (thrusts, Kraemer et al. Reference Kraemer, Martino, Giambastiani and Sfragulla1988; Kraemer, Escayola & Martino, Reference Kraemer, Escayola and Martino1995), modified locally to higher angles by stacking of the underthrusting wedge (Kraemer & Martino, Reference Kraemer and Martino1993); and (2) reactivation by inversion of high-angle normal faults of the Cretaceous rift (Schmidt et al. Reference Schmidt, Astini, Costa, Gardini, Kraemer, Tankard, Suárez and Welsink1995). Other older faults oblique to the current dominant trend (probably related to a pan-Gondwanan trend; Daly, Reference Daly1988; Tankard et al. Reference Tankard, Uliana, Welsink, Ramos, Turic, França, Milani, Brito Neves, Eyles, Skarmeta, Santa Ana, Wiens, Cirbián, López Paulsen, Germs, de Wit, Machacha, Miller, Tankard, Suárez Soruco and Welsink1995) have also been reactivated. The role of the oblique lineaments has been little considered in the nucleation and development of the Tertiary faulting.
Two main deformational events have been established based on these styles of faulting ((1) new; and (2) reactivation and inversion), using stratigraphic evidence and regional correlation (Martino et al. Reference Martino, Kraemer, Escayola, Giambastiani and Arnosio1995). These occurred at c. 2 Ma (event B) and c. 0.8 Ma (event A).
Magmatism associated with the Andean orogenic cycle is represented by Tertiary volcanic rocks in the NW margin of the Sierras de Córdoba (Pocho Volcanic Complex, 7.9–4.7 Ma, Kay & Gordillo, Reference Kay and Gordillo1994; Arnosio et al. Reference Arnosio, Popridkin, Báez, Bustos, Martino and Guereschi2014) and in the Sierra de San Luis (e.g. Sierra del Morro, 2.6±0.7 and 1.9±0.2 Ma; Ramos, Munizaga & Kay, Reference Ramos, Munizaga and Kay1991). Quaternary movements are recognized in the El Molino fault near Merlo, and in the Sierra Chica fault (Costa & Vita-Finzi, Reference Costa and Vita-Finzi1996; Costa et al. Reference Costa, Murillo, Sagripanti and Gardini2001). Seismological and seismic risk data linked to the latest deformation have recently been reviewed by Fatala & Martino (Reference Fatala and Martino2012), Perarnau et al. (Reference Perarnau, Gilbert, Alvarado, Martino and Anderson2012), Costa et al. (Reference Costa, Massabie, Sagripanti, Brunetto, Coppolecchia, Martino and Guereschi2014) and Caro Montero, Martino & Guereschi (Reference Caro Montero, Martino and Guereschi2015). Richardson et al. (Reference Richardson, Ridgway, Gilbert, Martino, Enkelman, Anderson and Alvarado2013) evaluated the depth of the Mohorovicic discontinuity and presented (U–Th)/He thermochronometric data from apatite and zircon, which gave ages of Permian – Early Jurassic cooling, suggesting that subsequent exhumation has been less than 2–3 km. An even older age (Carboniferous) has been proposed, so the current relief could have Palaeozoic and Mesozoic relicts and not only have been produced by the Andean orogeny (Jordan et al. Reference Jordan, Zeitler, Ramos and Gleadow1989; Coughlin et al. Reference Coughlin, O'sullivan, Khon and Holcombe1998; Löbens et al. Reference Löbens, Bense, Wemmer, Dunkl, Costa, Layer and Siegesmund2011; Martino, Guereschi & Carignano, Reference Martino, Guereschi and Carignano2012).
The objectives of this work are: (1) to describe and interpret the faults and thrusts of the Sierras de Córdoba basement produced during the Andean orogeny; and (2) to evaluate the influence of pre-Andean tectonics in Andean structures. Both objectives are integrated into a synthesis of thick-skinned deformation affecting the Sierras de Córdoba and their tectonic evolution.
2. Geological setting
The Sierras Pampeanas province of central Argentina is a region of large mountain ranges of crystalline basement and intervening broad valleys. The ranges are blocks raised by the deformation of the current Andean foreland, over 700 km from the Chilean trench, coinciding with a sector of low-angle inclination of the Nazca plate beneath the South American plate. The ‘flat-slab’ geometry of the subducted Nazca plate and the deformation of the upper plate (South American), by coupling between them, have been compared with the Laramide orogeny in North America and elsewhere (Jordan et al. Reference Jordan, Isacks, Allmendinger, Brewer, Ramos and Ando1983a , b; Rodgers, Reference Rodgers1987; Marshak, Karsltrom & Timmons, Reference Marshak, Karsltrom and Timmons2000). The Pampean flat-slab occurs between 27° and 34°S and had existed from 20 Ma to the present (Yañez et al. Reference Yáñez, Ranero, von Huene and Díaz2001; Ramos, Christallini & Pérez, Reference Ramos, Cristallini and Pérez2002). In a review, Ramos & Folguera (Reference Ramos, Folguera, Murphy, Keppie and Hynes2009) constrained the activity from 12 Ma to present. Basement deformation (thick-skinned tectonics) affected an area of about 800 × 600 km. The deformation is of Cenozoic age and the mountain ranges were uplifted mainly by reverse faulting and folding locally.
The Sierras de Córdoba are the most eastern group of the Sierras Pampeanas. They consist of a polydeformed metamorphic basement (Gordillo & Lencinas, Reference Gordillo, Lencinas and Turner1979; Martino & Guereschi, Reference Martino, Guereschi, Martino and Guereschi2014) of Neoproterozoic – early Palaeozoic ages (Rapela et al. Reference Rapela, Pankhurst, Casquet, Baldo, Saavedra, Galindo, Fanning, Pankhurst and Rapela1998; Siegesmund et al. Reference Siegesmund, Steenken, Martino, Wemmer, López de Luchi, Frei, Presnyakov and Guereschi2010). The outcropping metamorphic basement is predominantly composed of large migmatitic massifs with minor gneisses, amphibolites and marbles. Pressure and temperature conditions reached granulite facies with anatexis (7–8 kb, 700–800°C; Guereschi & Martino, Reference Guereschi, Martino, Martino and Guereschi2014). Low-grade rocks crop out only locally, such as phyllites in the western edge of the Sierra de Pocho. The metamorphic basement is affected by a highly penetrative metamorphic foliation called S2 (Neoproterozoic–Cambrian age), which exerted a strong control on the deformation as many authors have highlighted (Gordillo & Lencinas, Reference Gordillo, Lencinas and Turner1979; Kraemer et al. Reference Kraemer, Martino, Giambastiani and Sfragulla1988; Massabie & Szlafsztein, Reference Massabie and Szlafsztein1991; Kraemer & Martino, Reference Kraemer and Martino1993; Simpson et al. Reference Simpson, Whitmeyer, De Paor, Gromet, Miro, Krol, Short, Holdsworth, Strachan and Knipe2001; Martino, Guereschi & Carignano, Reference Martino, Guereschi and Carignano2012; Martino et al. Reference Martino, Guereschi, Carignano, Calegari, Manoni, Martino and Guereschi2014).
The metamorphic basement was imbricated by contractional ductile shear zones during Ordovician–Silurian and Devonian–Carboniferous times (Martino, Reference Martino2003; Steenken et al. Reference Steenken, Wemmer, Martino, López de Luchi, Guereschi and Siegesmund2010) and intruded by Palaeozoic granitoids (e.g. the Achala batholith; Figs 4, 5).
Geological map of the Sierras de Córdoba, showing the traces of the main brittle Cenozoic structures (modified from Martino, Guereschi & Caro Montero, Reference Martino, Guereschi, Caro Montero, Martino and Guereschi2014).

Geological sections A–A′ and B–B′ orientated ESE, crossing the main brittle Cenozoic structures in the Sierras de Córdoba (see Fig. 4 for locations). In addition to the observable surface geology, the main faults and thrusts that uplifted the ranges are represented as interpreted in depth based on geophysical data obtained by Favetto et al. (Reference Favetto, Pomposiello, López de Luchi and Booker2008), Perarnau et al. (Reference Perarnau, Gilbert, Alvarado, Martino and Anderson2012) and Orozco et al. (Reference Orozco, Favetto, Pomposiello, Rossello and Booker2013). Focal mechanism calculated by the International Seismological Center (see details in Fig. 14).
The metamorphic basement of the Sierras de Córdoba was exhumed by denudation and has remained essentially exposed since middle Palaeozoic time (Ramos, Reference Ramos1988; Simpson et al. Reference Simpson, Whitmeyer, De Paor, Gromet, Miro, Krol, Short, Holdsworth, Strachan and Knipe2001; Whitmeyer, Reference Whitmeyer2008; Steenken et al. Reference Steenken, Wemmer, Martino, López de Luchi, Guereschi and Siegesmund2010; Bense et al. Reference Bense, Löbens, Dunkl and Wemmer2013). On the western margin of the mountains, minor outcrops of Carboniferous–Permian continental sedimentary rocks are recognized at the foot of the Sierra de Pocho. To the east in the Sierra Chica, Cretaceous continental sedimentary rocks crop out associated with basaltic flows and dykes (Lagorio, Vizán & Geuna, Reference Lagorio, Vizán, Geuna, Martino and Guereschi2014).
The uplift in asymmetric blocks of the Sierras Pampeanas of Córdoba is arranged in N-striking mountain ranges, limited by Tertiary reverse faults, mainly W-vergent high-angle faults and low-angle faults (thrusts). It has a steep western flank, while the eastern flank is gentle (e.g. 10–12° slope, Sierra Chica). From west to east (Figs 3–5), the ranges are: Sierra de Pocho; Sierra Grande–Sierra de Comechingones; Sierra Chica; and Elevación Pampeana. These mountain ranges are separated by intermountain valleys with Cenozoic continental sedimentary rocks. Palaeogene deposits are scarce, but late Eocene – Oligocene synorogenic deposits in the Sierra Chica are evidence of early uplift (Lencinas & Timonieri, Reference Lencinas and Timonieri1968). Neogene deposits are more widespread in the intermountain valleys and foothills, related to major uplift of the mountains in the late Miocene period (Jordan & Allmendinger, Reference Jordan and Allmendinger1986). In the northwestern area, Neogene volcanic and pyroclastic rocks (Pocho Volcanic Complex) overlie the landscape of E-tilted blocks. The whole of the Sierras de Córdoba emerges from the Chaco-Pampean plain of Quaternary age, with abundant Mesozoic and Cenozoic deposits in depth.
3. Basement faults and thrusts
A new map with the trace and the interpretation of the main faults and thrusts recognized in the basement of the Sierras Pampeanas of Córdoba is shown in Figure 4.
It should be noted that the term ‘fault scarp’ is used here in the sense of Stewart & Hancock (Reference Stewart and Hancock1990), who defined it as a matching geoform coincident or grossly coincident with a fault plane that has affected the surface of the ground. This criterion has been used in tracing the faults and thrusts on the map of Figure 4.
The main structures recognized in the Sierras de Córdoba were also traced on satellite images combined with a digital elevation model (Fig. 6). The bow-and-arrow method (Elliot, Reference Elliott1976) was applied to some typical thrusts, measuring the length L of the exposed faults on the map to estimate the maximum displacement D and the tectonic transport direction (see Section 6 below).
Main traces of thrust faults recognized in the Sierras de Córdoba highlighted on Landsat 7 satellite images, with 8 bands (1–7: resolution 30 m, 8: pancromatic resolution 15 m) from EarthExplorer (http://earthexplorer.usgs.gov/ containing information from https://lta.cr.usgs.gov/LETMP) on a digital elevation model (DEM), resolution 45 m, from the Instituto Geográfico Nacional of Argentina (http://ign.gob.ar/node/987). The bow-and-arrow method (Elliot, Reference Elliott1976) was applied to the main curved, low-angle thrust faults (interpreted here as new Cenozoic faults), measuring the length L of the exposed faults on the map, to estimate the maximum displacement D and the tectonic transport direction (arrows). The results are displayed in the table and diagram of D versus L (in kilometres).

From the geological map (Fig. 4), two new sections transverse to the Sierras de Córdoba (Fig. 5) were made. They are representative of the morphology of the brittle Cenozoic tectonics affecting these ranges. In addition to the observable surface geology, the main faults and thrusts that deform and uplift the ranges were represented and interpreted in depth in both sections based on geophysical data obtained by Favetto et al. (Reference Favetto, Pomposiello, López de Luchi and Booker2008), Perarnau et al. (Reference Perarnau, Gilbert, Alvarado, Martino and Anderson2012) and Orozco et al. (Reference Orozco, Favetto, Pomposiello, Rossello and Booker2013). Both sections are described and interpreted in Section 7.
Based on seismic activity (databases taken from Instituto Nacional de Prevención Sísmica in Argentina, United States Geological Survey and T. Richardson, unpubl PhD thesis, Purdue University, 2011), epicentres and hypocentres of recorded earthquakes are represented in a particularly active area as it is the western zone of section B–B' (Figs 4, 5). From May 1923 to August 2015, a total number of 585 earthquakes were recorded (115 > 40 km depth and 470 < 40 km depth). Two focal mechanisms were obtained from the International Seismological Center. Most of the recorded magnitudes (M b) vary between 2 and 4 (80%). Several sections perpendicular to the La Sierrita fault, the Ojo de Agua lineament and the Ciénaga del Coro fault were made. Analysing these sections, hypocentres were interpolated using the Natural Neighbour method. The results are described and interpreted in Sections 4 and 7.
In the following sections, the main faults and thrusts recognized in the basement of the Sierras Pampeanas of Córdoba are described from west to east, from oldest to youngest, following the deduced direction of deformation propagation toward the buttress of the Río de la Plata craton (see Section 6).
3.a. Sierra de Pocho fault
This fault scarp borders a large block that raised the basement c. 1000 m above the Chancaní Valley. As a result, from north to south the Sierras de Guasapampa, Pocho and Altautina were formed, describing a large arc convex to the west (Fig. 4). To the south, this fault probably continues parallel to the El Molino fault (Costa et al. Reference Costa, Massabie, Sagripanti, Brunetto, Coppolecchia, Martino and Guereschi2014), covered by modern deposits in the Conlara Valley. The Sierra de Pocho fault is the longest fault in the Sierras Pampeanas; to the north of the Sierras de Córdoba between 26° and 33°S latitudes it extends by almost 700 km, striking c. N 350º.
The geological map of the central part of the Sierra de Pocho and a detailed section of this fault is shown in Figure 7a–c. The hangingwall consists of Cambrian metamorphic rocks, such as the La Mermela phyllites and mylonitic rocks of the Los Túneles ductile shear zone (Martino, Reference Martino2003). The footwall, coincident with the Chancaní Valley, is represented by a large, W-vergent, asymmetric synformal fold (a drag fold?) in Permian–Carboniferous sedimentary rocks, partially covered by modern sediments and profuse vegetation.
(a) Detailed geological map of the Sierra de Pocho (modified from Martino, Guereschi & Sfragulla, Reference Martino, Guereschi and Sfragulla2002), showing the Sierra of Pocho fault (SPF) and the La Mermela fault zone (LMFZ) connected by a rejoining splay (Boyer & Elliott, Reference Boyer and Elliot1982). (b) Geological cross-section showing the 3D effect of these structures, forming the horse of the La Mermela phyllites. (c) Detailed geological section of the La Mermela fault zone, at the contact between the Los Túneles ductile shear zone (LTSZ) and the La Mermela phyllites. The reverse LMFZ is nucleated in rocks from LTSZ, producing strong crushing and Fe-loss from biotite. Two tabular sheets of cataclasites of decimetric thickness, consisting of gouge (N5°/53°E) and a breccia (N350°/75°E), and a strong subhorizontal fracture cleavage (N305°/30°N) are also recognized. (d) Photograph showing pseudotachylite veins generated by brittle deformation superimposed on the Los Túneles shear zone, east of the La Mermela fault zone.

The La Mermela phyllites form a lenticular body on the map, limited by the Sierra de Pocho fault to the west and by the La Mermela fault zone to the east, both of reverse-type and brittle regime (Martino, Guereschi & Sfragulla, Reference Martino, Guereschi and Sfragulla2002). On the map, both structures are connected by a rejoining splay (in the terminology of Boyer & Elliot, Reference Boyer and Elliot1982) which has the 3D shape of a horse fault composed of the La Mermela phyllites (Fig. 7a, b). The La Mermela fault zone produced intense grinding and Fe-loss from biotite in the mylonitic rocks of the Los Túneles shear zone. Tabular cataclasite bands of decimetre thicknesses are recognized (Fig. 7c), consisting of gouge (N5°/53°E) and breccia (N350°/75°E) and a strong subhorizontal fracture cleavage (N305°/30°N).
To the east beyond the La Mermela fault zone the Los Túneles shear zone has brittle deformation superimposed on the ductile deformation, evidenced by minor conjugated thrusts, cataclasis with pseudotachylite generation (Fig. 7d) and calcite–chlorite veins.
Minor conjugated thrusts (Fig. 8a) are two sets of low-angle faults (<30°): one set strikes N340–345°, E-dipping by 4–17°, and the other strike N235–277°, with 15–27°N dip (Martino, Guereschi & Sfragulla, Reference Martino, Guereschi and Sfragulla2002). These thrusts affected both the Los Túneles ductile shear zone and the La Mermela phyllites, cutting the dominant E-dipping foliation in both lithologies but producing different structures depending on the angular relationship between the two planes (α). When the angle between thrusting and foliation was low (α <40°, E-dipping thrusts), drag folds were produced; while when the angle was high (α ≈ 60°, N-dipping thrusts), asymmetric kink-bands, Z-shaped facing north, were generated. The N-dipping thrusts are penetrative and spaced at 1–10 m. Using these conjugates thrusts, the approximate orientations of the axes of shortening Z = N312°/10°, intermediate Y = N43°/4° and lengthening X = N161°/80° (Fig. 8b; Martino, Guereschi & Sfragulla, Reference Martino, Guereschi and Sfragulla2002) were determined following Marrett & Allmendinger (Reference Marrett and Allmendinger1990). These coincide with axes assigned to Event A (Kraemer et al. Reference Kraemer, Martino, Giambastiani and Sfragulla1988) of probable Pliocene age, discussed by Martino et al. (Reference Martino, Kraemer, Escayola, Giambastiani and Arnosio1995).
(a) Vertical west–east sketch showing minor conjugate thrust faults associated with the Sierra de Pocho fault, east of the La Mermela fault zone. These minor faults affected the fracture cleavage of the La Mermela phyllites and the mylonitic foliation (S m) of the Los Túneles ductile shear zone (LTSZ) and are the result of brittle deformation superimposed on ductile deformation (drag folds and kink-bands, respectively), depending on the α angle between S m and the faults. (b) Diagrams showing the kinematics and dynamics deduced from the conjugate thrusts (see text). (c) Anastomosed fault plane affecting mylonites and amphibolites. (d) Diagram showing structural relationships from (c). Both outcrops are located along Road 28 across the uplifted block of the Sierra de Pocho (see text for explanation). TTD – tectonic transport direction. See also Figure 7a.

At kilometre 827 of Provincial Route 28 (Fig. 8c) which crosses the Sierra de Pocho, anastomosing fault planes (0.20–6 m of damaged area) displaced mylonitic foliation (S m = N330°/60°E with a stretching lineation L s = N50°/54°) and intercalated amphibolite, the latter with epidote growth on the fault plane whose orientation is N308°/9°NE with striations N60°/8°. This fault is reversed, with tectonic transport direction to c. N240° (Fig. 8d). This faulting coincides with Event B (Kraemer et al. Reference Kraemer, Martino, Giambastiani and Sfragulla1988) of probable pre-Pliocene age, as discussed by Martino et al. (Reference Martino, Kraemer, Escayola, Giambastiani and Arnosio1995).
The brittle deformation suffered by the Los Túneles ductile shear zone developed cataclasis parallel to the main mylonitic foliation (plane C), producing a millimetre-thick brecciation, fracture cleavage and pseudotachylite generation. The latter forms concordant veins (< 7 cm thick), black to greenish, with discordant ramifications and a tree-like appearance. They contain clasts with mylonitic foliation and have mostly reverse kinematics (Martino, Guereschi & Sfragulla, Reference Martino, Guereschi and Sfragulla2002). Millimetre veins are also recognized, filled with calcite and chlorite, subperpendicular to the dominant foliation C.
Based on overlapping relationships as observed in the outcrops, the relative order of the recognized structures is: first the fracture cleavage, second the La Mermela fault zone, then the conjugated thrusts with concomitant development of kink-bands and drag folds in phyllites and mylonites and, finally, discordant veins (Martino, Guereschi & Sfragulla, Reference Martino, Guereschi and Sfragulla2002). Cataclasis and pseudotachylites parallel to the foliation C are associated with the conjugated thrusts. Whitmeyer (Reference Whitmeyer2008) argued that the minimum age of the Los Túneles pseudotachylites is c. 340–350 Ma, so that brittle deformation may have begun in the Carboniferous period. Reactivation of this structure also in a brittle regime, with development of gouge and brecciation, is probably linked to the Cenozoic deformation that produced the uplift of the sierras of Guasapampa and Pocho. The origin of the large asymmetrical synformal fold in sedimentary rocks (a drag fold?) could be a concomitant event.
3.b. Ciénaga del Coro – La Sierrita fault
The Ciénaga del Coro fault is a c. N175°-striking, 40–50° E-dipping fault, curving eastwards in its southern section which uplifted the eponymous range over the Sierra de Guasapampa (Figs 4, 5). It is profusely covered with vegetation, in both the hangingwall and the footwall, making it difficult to access and study the materials involved. In the hangingwall, tonalitic rocks have a foliation N330°/40–83°E and the fault trace is parallel to it, indicating a strong control on their nucleation. Mylonitized rocks and circulation of fluids that precipitated iron oxides and aragonite along the fault plane have been recognized (Lucero Michaut & Olsacher, Reference Lucero Michaut and Olsacher1981). This is a reverse fault with an impressive escarpment in its northern section which becomes lower and less steep towards its southern section, disappearing beneath the Tertiary volcanic rocks (Pocho Volcanic Complex, Fig. 4). Here the fault is probably combined at depth with the Ojo de Agua lineament (Caro Montero, Martino & Guereschi, Reference Caro Montero, Martino and Guereschi2015; see Section 4), which in turn combines with the La Sierrita fault forming a single structure with a sigmoidal trace on the map.
The La Sierrita fault uplifted a small NNW-striking block, slightly oblique to the Sierra Grande, with low-dip (30–40°) to the east. Internally the La Sierrita block (Fig. 2b) consists of mylonites and associated rocks from the Ambul–Mussi ductile shear zone. To the south, this fault ends at the Nono fault.
3.c. Cumbre de Gaspar – Nono fault
The traces of these two faults form opposed arcs on the map: the Cumbre de Gaspar fault is convex to the east and the Nono fault is convex to the west (Fig. 4). Together these are the only E-vergent faults (antithetical) in the Sierras de Córdoba, unlike all other faults (synthetic) described in this paper (Fig. 9a). The Cumbre de Gaspar minor block is raised by the eponymous fault to the east and flanked by the Sierra Grande fault (see following section) to the west, with a throw of c. 100 m on both sides. Near the river that runs along the Cumbre de Gaspar fault, gneisses have retrograded bands of red gouge, oriented N10°/45°W, crossed by vertical extensional quartz veins. These fault zones clearly cut the dominant S2 foliation in gneisses and migmatites, oriented here N305°/38°E. The Cumbre de Gaspar fault is active at its northern end near Villa de Soto, with several earthquakes from 1997 to date with magnitudes of 2.5–4.5 on the Richter scale (see Instituto Nacional de Prevención Sísmica de Argentina, http://www.inpres.gov.ar/seismology/xultimos.php). It is noted here that the major morphogenetic faults in the Sierras de Córdoba have thin cataclastic zones that do not match, at first sight, with kilometre uplift of the respective blocks. Here, only decimetric fault zones are recognized as in the case of the Sierra de Pocho fault.
(a) View to the south of the scarp of the Cumbre de Gaspar fault. This is the only W-dipping fault in the Sierras de Córdoba. Note that the footwall and the hangingwall slope gently to the west. This fault continues southwards to the Nono fault. (b) Oblique aerial view to the SE of the scarp of the Sierra de Comechingones fault. At the top in light colours is the gentle E-sloping Pampa de Achala horst-like elevation. Towards the footwall, the minor scarp of the Nono fault and the elbow of the Los Sauces river forming the reservoir of the La Viña dam are seen. (c) Detail from (b) showing the Pampa de Achala, with both sides limited by a series of reverse faults, E-dipping faults on the western flank and W-dipping faults on the eastern flank (see Fig. 4).

The Nono fault (Fig. 9b) was described by Kraemer et al. (Reference Kraemer, Tauber, Schmidt and Ramé1993) and Richardson et al. (Reference Richardson, Ridgway, Gilbert, Martino, Enkelman, Anderson and Alvarado2013) in the eastern margin of the Devonian Achalita pluton (below ‘NF’ in Fig. 4), which was raised 17 m above the Cenozoic fluvial sediments of the Nono valley. This is a thrust whose plane is oriented N331°/41°W. The fault zone is c. 2 m thick with anastomosed geometry, and contains a breccia with intercalated clays. These rocks are striated and, along with other movement indicators, reveal the kinematic and temporal evolution of the fault. Sedimentary materials record two fault movements (late Pliocene and late Pleistocene) and two deformation events: (1) a more recent event, with shortening axis Z = N293°/3° and lengthening axis X = N43°/81° (recorded in breccia), and (2) another with shortening axes X = N20°/2° and lengthening axis X = N190°/74° (the older, of uncertain age).
The Nono fault was interpreted by Kraemer et al. (Reference Kraemer, Tauber, Schmidt and Ramé1993) as a backthrust of the Sierra de Pocho fault (Fig. 4). This backthrust is interpreted here as continuing to the north in the Cumbre de Gaspar fault. Together they form an uplifted block with rocks belonging to the middle crust of the San Carlos massif (c. 1000 km2 of anatectic rocks), indicating that part of the uplift of the entire massif was Tertiary which, in combination with the Sierra de Pocho fault (throw c. 1000 m), forms a regional pop-up structure (P on the map in Fig. 4).
3.d. Sierra Grande – Sierra de Comechingones fault
This major fault uplifted the central range of the Sierras de Córdoba (Fig. 4), the Sierra Grande, located between the Sierra Chica (east) and the Sierra de Pocho (west), and its southern continuation in the Sierra de Comechingones (Fig. 9b). It is a N-striking, straight trace, high-angle (45–55°E) reverse fault, extending more than 250 km at approximately longitude 65°W.
In the central section, coinciding with the southern portion of the Achala batholith, it is divided into a series of parallel faults forming tectonic steps. The southern portion of the Achala batholith can therefore be interpreted as a horst-like elevation, limited on both flanks by a series of reverse faults E-dipping in the western flank and W-dipping in the eastern flank. The result is a high plain called Pampa de Achala, sloping slightly to the east (Fig. 9c) and probably of Palaeozoic origin (Schmieder, Reference Schmieder1921; Jordan et al. Reference Jordan, Zeitler, Ramos and Gleadow1989). The vertical throw caused by the faulting in the western flanks of the Sierra Grande and Sierra de Comechingones is 1800–2000 m, while on the eastern slope of these ranges it is c. 1500 m. To the north, the Sierra Grande fault decreases in vertical throw and almost disappears. In the central area of the map (Fig. 4) and in the geological section A–A' (Fig. 5), the horst-like structure is labelled H and the tectonic steps with numbers.
The morphotectonic steps raised the highest peaks in the granitic rocks of the Achala batholith (Cumbre de Achala) in the Sierra Grande. To the south in the Sierra de Comechingones the highest peaks were produced in high-grade metamorphic rocks, including the Cerro Champaquí (2884 m a.s.l.), the highest elevation in the Sierras de Córdoba. Red cataclastic zones derived from granite, 300–500 m thick, are identified in a few of these faults, sometimes cemented by ferruginous silica solutions and calcareous material. To the south, the Sierra de Comechingones fault also decreases in vertical throw and is divided into three minor reverse faults, forming small ranges of oblique arrangement which together form a horsetail end (Fig. 4).
In the Sierra de Comechingones fault, the main trace is located at the intersection of the escarpment with the piedmont covered by modern sediments; descriptions of outcrops are therefore not available to date. Inside the piedmont however, low scarps parallel to the main scarp are recognized and defined as piedmont forelands (Bull, Reference Bull2007). These geomorphological features are an expression of Quaternary fault activity; one of them, the El Molino fault near Merlo town (Fig. 4), was dated by optically stimulated luminescence (OSL) techniques as 7.1±0.4 ka and 350±40 ka BP (Costa et al. Reference Costa, Massabie, Sagripanti, Brunetto, Coppolecchia, Martino and Guereschi2014).
The Sierra de Comechingones fault is a structure that could have a significant Palaeozoic vertical displacement of several kilometres based on magnetic data at its southern end (Chernicoff & Ramos, Reference Chernicoff and Ramos2003). Bense et al. (Reference Bense, Löbens, Wemmer, Dunkl, Costa, Layer and Siegesmund2011) proposed early Carboniferous fault activity followed by Permian–Triassic and Jurassic events, based on K–Ar fault gouge data. Considering this together with the neotectonic activity the structure seems to have been active from ancient times, and the current high relief was probably not entirely caused by the effect of the Andean flat-slab.
3.e. Sierra de Cunuputo fault
This is a minor fault compared with the other major faults, but raised the important eponymous range in the northern part of the Sierra Grande (Fig. 2a). In its northern third it shows a Y-shape on the map with a branch called the San Marcos fault, which raised a small block known as the Sierra Baja de San Marcos. The Sierra de Cunuputo fault has experienced neotectonic activity in two stages during late Holocene time, evidenced by changes in the drainage network, terraces and lacustrine deposits (Massabie, Reference Massabie1982; Massabie et al. Reference Massabie, Sanguinetti, Lo Forte and Cegarra2003; Costa et al. Reference Costa, Massabie, Sagripanti, Brunetto, Coppolecchia, Martino and Guereschi2014).
3.f. Sierra Chica fault
This is one of the most important and best-studied faults in the Sierras de Córdoba (Fig. 4). Its fault scarp extends for more than 200 km from Capilla del Monte, in the northern Punilla Valley to near the Los Cóndores lineament. From here the fault branches into a series of lineaments, among which the Elena lineament, with a curved trace, which is the western margin of the Sierra de Las Peñas (Martino, Guereschi & Carignano, Reference Martino, Guereschi and Carignano2012). Its highest elevation is Cerro Uritorco, east of Capilla del Monte (1950 m a.s.l., Fig. 2a).
The trace of the Sierra Chica fault consists of straight and curved segments. The straight segments are high-dipping faults (50–60°E) that form the boundary of Cretaceous deposits, and are therefore interpreted as reactivated Cretaceous normal faults. In contrast, the curved segments are low-dipping reverse faults (≈ 30°E), not associated with any particular deposit, and are interpreted as new Tertiary faults (Schmidt et al. Reference Schmidt, Astini, Costa, Gardini, Kraemer, Tankard, Suárez and Welsink1995; Painceyra, Reference Painceyra1998); they were defined as basement thrusts by Martino et al. (Reference Martino, Kraemer, Escayola, Giambastiani and Arnosio1995).
The hangingwall of the Sierra Chica fault is composed of the metamorphic basement, mainly gneisses and migmatites more or less altered, for example in the Santa Rosa area (Figs 10c, 11) where the metamorphic basement is strongly altered and brecciated, losing the primary structure of the rocks (metamorphic foliation S2).
(a) Oblique aerial photograph of the scarp of the Sierra Chica fault at the latitude of the city of Alta Gracia; view towards the SE. Note the curvature of the fault trace. Main outcrops of the Sierra Chica fault: (b) El Tanque quarry, Villa Carlos Paz area, east–west profile; (c) Santa Rosa area, east–west profile; and (d) Potrero de Garay area, west–east profile. In (b) and (c), the metamorphic basement rides over Cenozoic sedimentary rocks. In (d), the fault affected recent soils (hammer scale in the ellipse). See text for details.

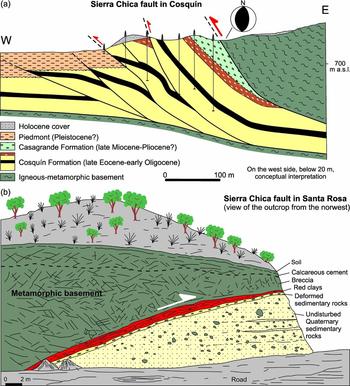
Detailed geological sections of the Sierra Chica fault. (a) In the Cosquín area, the igneous–metamorphic basement is thrust over Tertiary sedimentary sequences, imbricated by the latest activity of the Sierra Chica fault. High angles in the fault planes are interpreted as the result of translation and progressive back-rotation of the basement as the imbrication of the sedimentary wedge occurred below, implying the steepening of the main fault plane (bold arrow; modified from Kraemer & Martino, Reference Kraemer and Martino1993). (b) In the Santa Rosa area the metamorphic basement, formed mainly by gneisses and migmatites, is thrust over Quaternary sediments along a gentle E-dipping fault plane (modified from Kraemer et al. Reference Kraemer, Martino, Giambastiani and Sfragulla1988). See text for details and Figure 12 for location and kinematic analysis.
Throughout its sinuous trace, the Sierra Chica fault thrust rocks of different lithologies and depositional ages. In the area of La Cumbre town it affects Cretaceous conglomerates; in the Cosquín area, it thrusts Tertiary strata of the Punilla Valley (Fig. 11a) partially over Pleistocene fanglomerates in the Villa Carlos Paz area (Fig. 10b) and over Quaternary conglomerates (Figs 10c, 11) in the Santa Rosa area (Castellanos, Reference Castellanos1944, Reference Castellanos1951; Gross, Reference Gross1948; Schlagintweit, Reference Schlagintweit1954; Lencinas & Timonieri, Reference Lencinas and Timonieri1968; Massabie Reference Massabie1976, Reference Massabie1987; Gordillo & Lencinas, Reference Gordillo, Lencinas and Turner1979; Kraemer et al. Reference Kraemer, Martino, Giambastiani and Sfragulla1988; Massabie & Szlafstein, Reference Massabie and Szlafsztein1991; Kraemer & Martino, Reference Kraemer and Martino1993; Martino et al. Reference Martino, Kraemer, Escayola, Giambastiani and Arnosio1995; Schmidt et al. Reference Schmidt, Astini, Costa, Gardini, Kraemer, Tankard, Suárez and Welsink1995). In the Potrero de Garay area (Fig. 10d), the Sierra Chica fault rides over recent soils (Costa et al. Reference Costa, Massabie, Sagripanti, Brunetto, Coppolecchia, Martino and Guereschi2014). The overthrust relationship southwards on younger sedimentary rocks and then soils indicates diachronism in fault propagation in this direction.
In the Cosquín area (Fig. 4) in particular there is a sequence of synorogenic Tertiary sedimentary rocks (Fig. 11a) with two formations in relative structural concordance, separated by a calcrete horizon (Linares, Timonieri & Pascual, Reference Linares, Timonieri and Pascual1960; Lencinas & Timonieri, Reference Lencinas and Timonieri1968). The lower sequence of late Eocene – early Oligocene age (Cosquín Formation, age based on mammals fossils) is composed of clasts of granitic material from the Achala batholith (located to the west), indicating a provenance from Sierra Grande which was rising west along its eponymous fault. The upper sequence of probable late Miocene – Pliocene age (Casagrande Formation) is paraconformable and composed of clastic material from the metamorphic basement typical of Sierra Chica (gneisses, pegmatites, granodiorite and tonalite). This synorogenic sequence evidences the uplift of the Sierra Grande block before Sierra Chica, indicating the relative timing of activity of the eponymous faults. In Figure 11a, these sedimentary sequences are shown imbricated by the latest activity of the Sierra Chica fault. The imbrications of the sedimentary sequences allow the steepening of the main fault plane (thrust rotation) to be deduced. The main fault started as a basement thrust and, as the deformation progressed, the synorogenic sedimentary sequences became involved by successive underthrusts propagating towards the west. Consequently, a stacking of the underthrusting wedge, with progressive back-rotation of the succesive faults, was produced. Older faults therefore have an angle progressively higher than the younger faults. This mechanism is illustrated in Figure 11a.
At more regional scale, Sierra Chica intercepts drainage from Sierra Grande by deviating or maintaining its original course and pattern (antecedent rivers). This also implies that the uplift of Sierra Chica post-dated the uplift of Sierra Grande (Gordillo & Lencinas, Reference Gordillo, Lencinas and Turner1979).
Along the Sierra Chica fault zone, there is variable development of brittle deformation along with chemical changes in the rocks. At the latitude of Quebrada Honda (Fig. 12a), cataclasites associated with the Sierra Chica fault zone are recognized: 2–4 m of microbreccias with red and green fault gouge, followed by 10–30 m of breccias. To the east, the fault affected the regional metamorphic rocks in a belt 200–400 m thick, reworking the foliation of the gneisses and retrograding biotite to chlorite ± muscovite. In the Villa Carlos Paz area rocks related to the fault zone are phyllonitic, intensely chloritized and with secondary muscovite, with a strong orientation that defines a lineation N70°/45° on the foliation plane. Acid igneous material is intercalated in three patterns: (1) deformed lenses, parallel to the main foliation plane; (2) asymmetrical folds; and (3) normally displaced pegmatite.
(a) Interpretive map of the brittle structure of the Sierra Chica (modified from Martino, Guereschi & Carignano, Reference Martino, Guereschi and Carignano2012) showing different areas of outcrops of the Sierra Chica fault (SCF). Arrows TTD – tectonic transport direction. (b) Shortening and lengthening directions deduced for deformation events A and B in the Cosquín area (Kraemer & Martino, Reference Kraemer and Martino1993). (c) Detailed map of the structure and structural data (lower-hemisphere Schmidt net) for the Villa Carlos Paz area. (d) Directions of shortening and lengthening deduced for deformation events A (Z axis NW shortening direction = N288° and X axis subvertical lengthening direction) and B (Z axis NE shortening direction = 53° N and X axis close to horizontal lengthening direction) in the Santa Rosa area (Kraemer et al. Reference Kraemer, Martino, Giambastiani and Sfragulla1988). (e) Detailed map of the structure and structural diagram data in the Potrero de Garay area. (f) Cross-cutting relationships between the dominant metamorphic foliation S2 and fault planes in the areas of Villa Carlos Paz and Potrero de Garay. (g) Scheme showing the expanding front of the basement thrust sheet from the Sierra Chica fault, with minor associated fracturing (not marked on the map) for example between the Quebrada Honda and Soconcho lineaments, which behaved as lateral ramps.
In a few locations, the outcrops allow kinematic analysis of the fault plane. At the latitude of Villa Carlos Paz (Fig. 12a, c) south of Quebrada Honda, kinematic and dynamic analysis of minor faults associated with the main faults revealed two mutually orthogonal compressive events. For Event A, the shortening axis is Z = N106°/11° and for Event B it is Z = N15°/3° (Painceyra, Reference Painceyra1998). Further north in the Cosquín area (Figs 11a, 12b), the kinematic analysis of minor faults in the hangingwall shows two populations of faults: a well-developed reverse-type with shortening axis Z = E to SSE (Fig. 12b); and another strike-slip component poorly represented with shortening axis Z = NE, similar to results in other areas of the Sierras de Córdoba. A deformation event post-dating the piedmont deposits is clearly recognized (Fig. 11a). However, the sedimentary record supports the existence of at least two previous reactivation events, without a precise time location, revealing the complex history of this structure in which shortening is produced by reverse faults (Kraemer & Martino, Reference Kraemer and Martino1993).
Particularly interesting due to its proximity to the Río Tercero dam and nuclear power plant is the description of the Sierra Chica fault near the Santa Rosa. Here the metamorphic basement, formed mainly of gneisses and migmatites, is thrust over Quaternary sediments along a gentle E-dipping fault plane (Fig. 11b). This structure, known locally as the Santa Rosa fault, was first described by Massabie (Reference Massabie1987), whereas Kraemer et al. (Reference Kraemer, Martino, Giambastiani and Sfragulla1988) made the first kinematic and dynamic study. The local strike of the fault is N340°, E-dipping between 30° and 40° (Figs 2, 10c). The hangingwall consists of highly altered, brecciated, dark-green quartz-feldspar gneisses, fractured such that the rock is divided into irregular polyhedrons having lost its primary structure (metamorphic foliation S2). The footwall is formed of pale yellow sedimentary rocks with coarse stratification, composed of clasts of variable size (10–120 cm diameter) within a conglomeratic sandy matrix, interpreted as piedmont cenoglomerates produced by debris flows coming from the east. A red clay zone is identified in the fault plane with a thickness varying over the range 10–80 cm, which shows cataclastic foliation with striations and push marks clearly revealing the relative motion of the blocks. Upwards above the fault plane, the basement rocks are intensely fractured and contain minor faults and kinematic indicators. The sedimentary rocks below the fault plane are weakly deformed within a layer no thicker than 20 cm, with carbonate cement in which clasts of metamorphic rocks were reorientated parallel to the fault plane (Fig. 11b). The analysis of minor faults allows recognition of two deformation events (Fig. 12d): Event A, with shortening axis Z NW (N288°) and subvertical lengthening axis X; and Event B, with shortening axis Z NE (N53°) and near-horizontal lengthening axis X.
The minimum age of deformation on the Sierra Chica fault depends on the age assigned to the sedimentary sequences overthrust by the basement. Based on the correlation of similar rocks in different areas in the Sierras de Córdoba, these are probably middle–late Pleistocene in age. Event A is clearly recognized in clay levels along the fault plane as the last movement of the structure, so its age would be post-middle Pleistocene (late Pleistocene?). Event B is recorded in the thrust basement relatively far from the fault plane and is considered as a previous event of uncertain age. By correlation with faults in other studied areas, a late Pliocene (?) age is assumed.
3.g. Elevación Pampeana fault
As for the other morphogenetic fractures in the Sierras Pampeanas, this is a N-striking, E-dipping reverse fault (Figs 4, 5) with a short range from Río Ceballos to the Soconcho lineament (Bodenbender, Reference Bodenbender1929; Gordillo & Lencinas, Reference Gordillo, Lencinas and Turner1979). This fault is the western limit of the Cretaceous red strata on the eastern flank of Sierra Chica. To the east, the boundary of these sedimentary rocks is erosive or they underlie recent deposits of the Chaco-Pampean plain. The fault is therefore also interpreted as a normal fault inverted during the Tertiary Andean orogeny. It is the final thrust fault of that age that limits the Sierras de Córdoba with the Chaco-Pampean plain, defining the landscape morphology. Although the age of the last movement of the Elevación Pampeana fault is unknown, it is estimated that its formation is more recent than that of the Sierra Chica fault.
The small Elevación Pampeana range is composed of biotite gneisses, amphibolites and calcic marbles, intruded by aplitic and pegmatitic acid igneous rocks. In the La Calera area, a zone of crushed gneisses (c. 50 m thick) grades to finer materials until it becomes a brown fault gouge with rounded and polished clasts of different size. Rotated blocks of marble are observed in some quarries, intensely brecciated and with widespread friction marks.
The predominant style of the Sierras Pampeanas, with a steep western scarp and gentle eastern slope, is also recognized. Altitude increases northwards from 590 m a.s.l. (Alta Gracia) to 700 m a.s.l. (Cerro Largo, La Calera, Fig. 4). The fault movement produced the ESE-tilting of the hangingwall at an angle of 10–12° near the fault, decreasing to 4–5° towards the city of Córdoba. The regional tilting of the basement determined the ESE topographic slope that controls the flow of the main rivers at this latitude (Fig. 6).
4. Oblique lineaments
Gross (Reference Gross1948) drew attention to large linear features oblique in the Sierras de Córdoba, >100 km long in some cases and of maximum width 100 m, suggesting they had a profuse pattern of internal fracturing. However, in most cases there is no visible deformation other than the linear geomorphological feature. Petrographically, retrograde biotite replaced by muscovite and chlorite is commonly observed. In several cases, ductile shear zones producing mylonites are linked to these lineaments (Martino, Reference Martino2003).
A set of lineaments 2.5–5 km apart occurs in the northwestern sector of the Achala batholith (Fig. 4; Martino, Toledo & Guereschi, Reference Martino, Toledo and Guereschi2012): Candelaria, Corral del Carnero, Rincón Grande, Guasta and Retamito (Fig. 13). These lineaments are NNW-striking, almost vertical planes; the traces are straight to slightly bent and a few of them have minor Y-shaped branches (e.g. the Candelaria lineament). They define deep V-shaped valleys and segment the Achala batholith and the northwestern metamorphic host rocks in a series of elongate NNW blocks (Fig. 2). Paleocene olivine nephelinite dykes occur along the Guasta lineament (Gordillo, Linares & Daziano, Reference Gordillo, Linares and Daziano1983).
View to the SE of Quebrada Retamito, where the eponymous lineament raised the granite block of Cerro Los Gigantes (right in the picture silhouetted against the horizon). Cataclastic rocks occur along this lineament.

One that stands out is the Retamito lineament (Fig. 4) that cuts across the San Carlos massif, the Achala batholith and its southeastern metamorphic host rocks. In the central area, it uplifted the granite block of Cerro Los Gigantes (2400 m a.s.l., Fig. 13). In combination with reverse faults, this structure generated significant metallotects (e.g. uranium; Blasón, Reference Blasón and Zappettini1999). Another important structure is the seismically active Ojo de Agua lineament (Fig. 4); to the SE it continues in the Soconcho lineament, forming a single structure at regional scale with a total length of c. 120 km. This structure has a branch to the Retamito lineament. On the surface, zones of mylonitic rocks parallel to the Ojo de Agua lineament, currently under study, have been recognized. Brittle faulting controlled by these zones of mylonites and by the lineament is also produced. Based on seismic activity, Caro Montero, Martino & Guereschi (Reference Caro Montero, Martino and Guereschi2015) defined an almost vertical planar structure which coincides with the Ojo de Agua lineament (Fig. 14 a, b). Both the La Sierrita fault and the Ciénaga del Coro fault merge into this lineament forming a single structure, whose merging area is the most seismically active in the region. Analysing several perpendicular sections, the depth of this structure reaches c. 84 km (Fig. 14 b, c) with sinistral transpressive kinematics (see Section 7).
Study of the epicentre and hypocentre locations of earthquakes in a northwestern sector of the Sierras de Córdoba (Caro Montero, Martino & Guereschi, Reference Caro Montero, Martino and Guereschi2015). (a) Digital elevation model (DEM) on which the earthquakes recorded in the area, from May 1923 to August 2015, are classified by depth. Total number of earthquakes: 585 (115 at >40 km depth and 470 at <40 km depth). Database from Instituto Nacional de Prevención Sísmica in Argentina, United States Geological Survey and T. Richardson (unpub. PhD thesis, Purdue University, 2011). Two focal mechanisms obtained from the International Seismological Center. (b) Cross Section 3 perpendicular to the Ojo de Agua lineament. Equal vertical and horizontal scales. (c) 3D representation of the Ojo de Agua lineament by interpolating earthquakes in 10 sections, showing the trend observable in Cross Section 3. Circle chart and table show the magnitudes (M b) of the earthquakes that have been included in this study.

Another notable lineament is the La Higuera–Dos Pozos lineament (Fig. 4) in which a Tertiary reverse fault was nucleated, with the hangingwall towards the NE and the footwall towards the SW. The footwall is coincident with the homonymous ductile shear zone developing mylonites. Auriferous quartz veins occur along the lineament.
With the same features of the La Higuera–Dos Pozos lineament, but with the ductile shear zone in the hangingwall, is the Pachango lineament (Fig. 4). This reworked the homonymous ductile shear zone and juxtaposed high-grade rocks and the Los Túneles ductile shear zone with medium-grade rocks cropping out to the south in Sierra de Altautina (Fig. 7a). In the last range, several lineaments are recognized (e.g. La Cocha, La Viña). In the Nono Valley, exceptional illite deposits (>1 km long) produced by hydrothermal alteration of schists have been recognized (Bertolino & Murray, Reference Bertolino and Murray1992). A vertical throw of 15–30 m is associated with this oblique faulting (Olsacher, Reference Olsacher1972).
As with the above-described lineaments, in the Sierra Chica oblique lineaments are associated with ductile and brittle shear zones with complex deformational histories. From north to south, they are the Deán Funes, Carapé and Soconcho lineaments (Figs 4, 12), among others.
Using the receiver function method, Perarnau et al. (Reference Perarnau, Gilbert, Alvarado, Martino and Anderson2012) and Richardson et al. (Reference Richardson, Ridgway, Gilbert, Martino, Enkelman, Anderson and Alvarado2013) obtained data from 16 seismographs throughout the Eastern Sierras Pampeanas. Information on discontinuities in the crust and the upper mantle at the latitude of the Sierras de Córdoba revealed NE shifting and relative sinking (c. 3 km, Figs 4, 5) of the Mohorovicic discontinuity, coincident with the oblique lineaments recognized in Sierra Chica and its prolongation to the NE.
One of the most important is the Deán Funes lineament (Fig. 4), which extends for more than 200 km with a width of the order of kilometres. This lineament is coincident with one of the most marked structural trends in the Cretaceous tectonics of Argentina and extends towards the Atlantic margin in the Salado basin (Fig. 1). The current sinistral movement with a normal component (transtensive or oblique divergent shear) is recognized to a depth of more than 40 km, where it displaces the Mohorovicic discontinuity (Gilbert et al. Reference Gilbert, Richardson, Anderson, Alvarado, Martino, Beck, Zandt and Gans2010) by 3 km (see Section 7).
The Carapé and Soconcho lineaments (Fig. 4) are linked to Cretaceous tectonics as limits of the pull-apart extensional basins of the sierras of Pajarillo, Copacabana and Masa and Sierra de Los Cóndores, respectively (Martino et al. Reference Martino, Guereschi, Carignano, Calegari, Manoni, Martino and Guereschi2014). The Soconcho lineament can be continued to the NW, integrating with the Ojo de Agua lineaments with a branch to the Retamito lineament as described earlier in this section. These lineaments form a segmented crustal discontinuity on the map, with a more or less straight trace indicating high-dipping. In some places, the main trace can be resolved in several parallel or overlapping traces such as between the Ojo de Agua and Soconcho lineaments (Fig. 4).
Both Carapé and Soconcho lineaments also show at depth a vertical shifting of the Mohorovicic discontinuity (Perarnau et al. Reference Perarnau, Gilbert, Alvarado, Martino and Anderson2012; Richardson et al. Reference Richardson, Ridgway, Gilbert, Martino, Enkelman, Anderson and Alvarado2013) similar to the Deán Funes lineament (see Section 7).
In general it is noted that the oblique lineaments are associated with brittle deformation, in some cases Tertiary age as in the La Higuera–Dos Pozos and Pachango lineaments. The Ojo de Agua lineament has also current seismic activity. Another important point is that several lineaments are very deep (Ojo de Agua, Deán Funes, Carapé, Soconcho), and some of them shift the Mohorovicic discontinuity. In other cases brittle deformation would be older, associated with Cretaceous tectonics as in the Soconcho and Carapé lineaments. This brittle deformation is associated with Palaeozoic ductile shear zones both in the hangingwall and in the footwall of the current faults.
One possible interpretation is that these lineaments, or parts of them, are probably ancient features inherited from pan-Gondwanan structures (Daly, Reference Daly1988; Tankard et al. Reference Tankard, Uliana, Welsink, Ramos, Turic, França, Milani, Brito Neves, Eyles, Skarmeta, Santa Ana, Wiens, Cirbián, López Paulsen, Germs, de Wit, Machacha, Miller, Tankard, Suárez Soruco and Welsink1995), which worked in a protracted time period, controlling the Palaeozoic, Mesozoic and Cenozoic deformation.
5. Fault-related folds
Tertiary folds are recognized in Eocene sedimentary rocks (Linares, Timonieri & Pascual, Reference Linares, Timonieri and Pascual1960) in the footwall of the Sierra Chica fault in the Punilla valley, near the town of Cosquín (Fig. 12a). These rocks have a homoclinal arrangement but in same places are folded, probably in relation to the basement uplift. Hectometre-sized open folds, with E-dipping axial planes and subhorizontal axes dipping both north and south (Lucero Michaut, Reference Lucero Michaut1976) can be assigned to drape folds.
At the latitude of Villa Carlos Paz (Fig. 12a), W-vergent, asymmetric drag folds and upwardly open gentle folds, both metre-scale, are recognized in cataclastized gneisses in the hangingwall of the Sierra Chica fault (oriented here N40°/30°E).
Other drag folds are clearly visible in the contact of the Los Túneles ductile shear zone with the La Mermela phyllites, reflecting the effect of the Sierra de Pocho fault. Chevron folds, with subhorizontal axes and axial planes oriented N10°/42°W, affect the dominant foliation in phyllites, which outside the contact area is oriented N0°/40°E (Fig. 7c).
A W-overturned open syncline, hundreds of metres wide and long, with an E-dipping axial plane and subhorizontal axis, is recognized in the piedmont of the Sierra de Pocho near Chancaní (Fig. 7a). This fold is formed by drag on the footwall of the Sierra de Pocho fault in subhorizontal Carboniferous sedimentary rocks (sandstones of the Chancaní Formation, Fig. 7b). This is one of the largest folds recognized due to Tertiary deformation in the Sierras de Córdoba.
6. Estimation of uplift, maximum displacement and tectonic transport direction of main thrusts
Elliott (Reference Elliott1976) published a figure showing the maximum displacement in thrust faults as a function of length along strike. The relationship between the maximum displacement D and fault length L is usually considered to be of the form D = γ L C, where γ is the proportionality constant and C has a value between 1 and 2 (Cowie, Reference Cowie, Buck, Delaney, Karson and Lagabrielle1998; Groshong, Reference Groshong2008). The precise relationship seems to depend on many factors, including mechanical stratigraphy and nature of the interactions between overlapping faults. For a practical estimate of this relationship in a map interpretation, we assumed C = 1, leading to γ = D/L. Ratios of 1:8 to 1:33 are common, regardless of location, size or type of fault.
Displacement on the main faults of the Sierras de Córdoba has not yet been measured but it is possible to apply the bow-and-arrow rule of Elliott (Reference Elliott1976) to some typical thrusts, measuring the length of the exposed faults on the map, in order to estimate the maximum displacement and the tectonic transport direction. We have selected only the main low-dipping (thrusts) and curved trace faults that we interpret as new reverse faults produced by Cenozoic deformation.
The results are displayed in Figure 6 and the inset table, indicating that the maximum fault displacement decreases eastwards, ranging between 8.8 km and 3.2 km. The displacement/length ratio varies between 1:12 and 1:6, with an average of 1:8.4 (γ = 0.13). The deduced tectonic transport direction (TTD) is relatively constant towards the west (c. N260–270°).
In the Sierras de Córdoba, block uplift over the surrounding valleys and plains (c. 300–400 m a.s.l.) and the highest elevations in each range decrease from west to east: Sierra de Pocho (Cerro Agua de la Cumbre, 1577 m a.s.l.); Sierras of Comechingones–Grande (Cerro Champaquí, 2884 m a.s.l.); Sierra Chica (Cerro Uritorco, 1950 m a.s.l.) and Elevación Pampeana (Cerro Largo, La Calera, 700 m a.s.l.).
In addition, the synorogenic deposits in the piedmont of the Sierra Chica fault (Fig. 11a) clearly indicate an uplift of Sierra Grande prior to that of Sierra Chica uplift, demonstrating the relative timing of activity of the eponymous faults.
In summary, Cenozoic block uplift, the maximum displacement of the fault thrusts and the age of faulting all decrease from west to east (sequentially faulted hangingwall). It follows that faulting propagated from west to east. In this context, we suggest that the Río de la Plata craton, which lies at depth beneath the Chaco-Pampean plain, acted as a buttress to Andean compression in the Eastern Sierras Pampeanas (backwards propagation faulting).
7. Faulting depth
How faults extend at depth is a major problem. González Bonorino (Reference González Bonorino1950) proposed that the Sierras Pampeanas faults that produced block uplift would become horizontal with depth, brittle deformation at shallow depths being a result of compression. Downwards plastic deformation absorbs brittle deformation and would result in upper crust displacement over the lower crust along roughly horizontal planes. Geophysical data (Introcaso, Lion & Ramos, Reference Introcaso, Lion and Ramos1987; Alvarado et al. Reference Alvarado, Beck, Zandt, Araujo and Triep2005; Alvarado, Machuca & Beck, Reference Alvarado, Machuca and Beck2005, Perarnau et al. Reference Perarnau, Gilbert, Alvarado, Martino and Anderson2012; Richardson et al. Reference Richardson, Ridgway, Gilbert, Martino, Enkelman, Anderson and Alvarado2013) confirm the correctness of the intuition and geological and mechanical knowledge of González Bonorino (Reference González Bonorino1950). Perarnau et al. (Reference Perarnau, Gilbert, Alvarado, Martino and Anderson2012) and Richardson et al. (Reference Richardson, Ridgway, Gilbert, Martino, Enkelman, Anderson and Alvarado2013) carried out detailed studies showing the intracrustal structure of the Eastern Sierras Pampeanas, including estimates of crustal thickness and its variation as well as the location and displacement of Mohorovicic discontinuity.
The geological section A–A' (Fig. 5) cuts across the middle of the Sierras de Córdoba at about 31°50′S, crossing the main N-striking faults that uplifted the sierras of Pocho, Grande, Chica and Elevación Pampeana and the NW lineaments that obliquely intersect the section. Favetto et al. (Reference Favetto, Pomposiello, López de Luchi and Booker2008) performed a magnetotelluric survey over 450 km through the Sierras de Córdoba, obtaining data to a depth of 200 km. Subsequently, Orozco et al. (Reference Orozco, Favetto, Pomposiello, Rossello and Booker2013) complemented this study with another section that included the Precordillera, the Sierras Pampeanas and the Chaco-Pampean plain. In both studies, the boundary between the Río de la Plata craton and the Pampia terrane is located to the east of Sierra Chica, as a subvertical discontinuity marked by the difference between the resistivities of rocks in the two domains.
The Río de la Plata craton of Palaeoproterozoic age (2200–1700 Ma, Rapela et al. Reference Rapela, Pankhurst, Casquet, Fanning, Baldo, Gonzalez-Casado, Galindo and Dahlquist2007), covered by several thousand metres of sediments from the Chaco-Pampean plain, acted as a rigid wall which was unaffected by Andean orogenic compression. Therefore, we propose that the suture between the Pampia terrane and Río de la Plata craton is the origin of the different take-off levels of the most important thrusts. Although this craton apparently reaches depths far greater than those established for the Mohorovicic discontinuity by Perarnau et al. (Reference Perarnau, Gilbert, Alvarado, Martino and Anderson2012), we assume an average crustal thickness of 40 km or less as defined by satellite gravimetry and crustal thickness modelling for the continent (Assumpção, Feng & Julià, Reference Assumpção, Feng and Julià2013; Van der Meijde, Julià & Assumpção, Reference Van der Meijde, Julià and Assumpção2013). The depth of brittle–ductile transition zone is between 20 and 25 km, according to data obtained by Perarnau et al. (Reference Perarnau, Gilbert, Alvarado, Martino and Anderson2012), with the depth of the Mohorovicic discontinuity between 38 and 40 km. These estimates are consistent with global geophysical studies for the South American continent (Assumpção, Feng & Julià, Reference Assumpção, Feng and Julià2013; Van der Meijde, Julià & Assumpção, Reference Van der Meijde, Julià and Assumpção2013) and, more locally, for the Andes (Gilbert, Beck & Zandt, Reference Gilbert, Beck and Zandt2006; Heit et al. Reference Heit, Yuan, Bianchi, Sodoudi and Kind2008; Perarnau, Alvarado & Saez, Reference Perarnau, Alvarado and Saez2010). The take-off level of these thrusts is defined as at 23 km, with slight variations caused by a major oblique lineament (Soconcho). These very pervasive lineaments cause an almost vertical shifting of the Mohorovicic discontinuity by 2.5–3 km (see fig. 4b in Perarnau et al. Reference Perarnau, Gilbert, Alvarado, Martino and Anderson2012).
As for section A–A', section B–B' (Fig. 5) is transverse to the Sierras de Córdoba in the northern part (at c. 31°20′S). As in the previous section, we have interpreted the boundary between Pampia Terrane and Río de la Plata craton as the place where the take-off levels of the main thrusts were generated. The zone of brittle–ductile transition is established at the same depth as in section A–A' (20–25 km), as is that of the Mohorovicic discontinuity (40 km or less), according to data obtained by Perarnau et al. (Reference Perarnau, Gilbert, Alvarado, Martino and Anderson2012). To the east, near the end of the section, an almost vertical displacement of this discontinuity by nearly 3 km is caused by another important lineament affecting the Sierras de Córdoba (Carapé, see fig. 5b in Perarnau et al. Reference Perarnau, Gilbert, Alvarado, Martino and Anderson2012).
Crustal thickness ranges from 38 km in the west to 35 km in the east, and there are small variations in morphology of the Mohorovicic discontinuity (Perarnau et al. Reference Perarnau, Gilbert, Alvarado, Martino and Anderson2012) showing displacements of c. 3 km near the Soconcho, Carapé and Deán Funes lineaments. Two planar intracrustal structures are detected throughout the Sierras de Córdoba (remnants of hidden Cambrian crust?), displaced at depth by the main faults described in this paper. These faults have a listric, concave-up geometry, and are rooted between 22 km in the east and 27 km in the west over a ductile aseismic area c. 8–10 km above the Mohorovicic discontinuity (Perarnau et al. Reference Perarnau, Gilbert, Alvarado, Martino and Anderson2012). Geological sections (Figs 4, 5) were performed, integrating geophysical surface and depth information (Favetto et al. Reference Favetto, Pomposiello, López de Luchi and Booker2008; Perarnau et al. Reference Perarnau, Gilbert, Alvarado, Martino and Anderson2012; Orozco et al. Reference Orozco, Favetto, Pomposiello, Rossello and Booker2013). The crustal structure shown is consistent with such data from other areas (Snyder, Ramos & Allmendinger, Reference Snyder, Ramos and Allmendinger1990; Comínguez & Ramos, Reference Comínguez and Ramos1991; Cristallini et al. Reference Cristallini, Cominguez, Ramos, Mercerat and Mc Clay2004). Shallow seismicity data at c. 25 km (Richardson et al. Reference Richardson, Ridgway, Gilbert, Martino, Enkelman, Anderson and Alvarado2013) indicate that the Sierras de Córdoba are accommodating current deformation in the most distant foreland portion of the Chilean trench. The presence of melted material associated with the Miocene magmatism and subsidence of the Pampia terrane – Río de la Plata craton interface is also detected (Booker, Favetto & Pomposiello, Reference Booker, Favetto and Pomposiello2004).
In the west section B–B' (Fig. 5), a seismically active, almost vertical, planar structure which coincides with the Ojo de Agua lineament (Fig. 14a) is recognized based on seismic activity (Caro Montero, Martino & Guereschi, Reference Caro Montero, Martino and Guereschi2015). This lineament reaches a depth of c. 84 km, with sinistral transpressive kinematics (Fig. 14b, c). Despite the error range for hypocentral earthquake location of 3–5 km (depending on the database where data were obtained), such a structure is clearly detected although with a depth much greater than expected. In addition, from focal mechanisms calculated by the International Seismological Center for earthquakes located along this structure, a different kinematic style above and below the Mohorovicic discontinuity was deduced. The Ojo de Agua lineament has a transpressional nature with sinistral movement below this limit (c. 40 km) and reverse-type above it. This behaviour is possibly related to the rheological change between the lithosphere and the upper mantle. The same geometry is followed by the other oblique lineament on the east of section B–B' (Carapé).
The existence of ancient deep lineaments calls into question the geometry at depth, previously known or inferred, of the Sierras de Córdoba faults (Perarnau et al. Reference Perarnau, Gilbert, Alvarado, Martino and Anderson2012; Richardson et al. Reference Richardson, Ridgway, Gilbert, Martino, Enkelman, Anderson and Alvarado2013; Martino, Guereschi & Caro Montero Reference Martino, Guereschi, Caro Montero, Martino and Guereschi2014, among others).
8. Regional interpretation: the case of the Sierra Chica fault
Although there are many studies still to be carried out on faults in the Sierras de Córdoba, one of the most studied faults, the Sierra Chica fault, can be taken as representative of the faulting affecting this part of the Sierras Pampeanas. In the Santa Rosa and El Tanque areas (Fig. 10b, c) there are excellent examples of basement thrusts produced during the Cenozoic deformation in the Sierras de Córdoba.
The brittle deformation in Sierra Chica produced a series of faults and lineaments with complex relationships (Fig. 3a). This complexity is due to the control exerted by previous fabrics such as the regional metamorphic foliation S2 and locally the mylonitic foliation in ductile shear zones, to which two overlapping brittle tectonic events can be added: the Cretaceous extensional tectonics and the Tertiary compressional tectonics.
The brittle deformation affected metamorphic rocks of Neoproterozoic–Cambrian ages (Rapela et al. Reference Rapela, Pankhurst, Casquet, Baldo, Saavedra, Galindo, Fanning, Pankhurst and Rapela1998; Siegesmund et al. Reference Siegesmund, Steenken, Martino, Wemmer, López de Luchi, Frei, Presnyakov and Guereschi2010) with a strong planar anisotropy that is very pervasive regionally (main metamorphic foliation S2). This foliation has a general orientation N310–340°/30–50°NE in Sierra Chica. The foliation S2 is a plane of weakness and, in some places, acted as the main fault plane of the Sierra Chica fault (e.g. in the Santa Rosa area, Fig. 10c). The strong control exerted by the S2 fabric of metamorphic rocks on the orientation of Tertiary brittle structures in the Eastern Sierras Pampeanas has been highlighted by many authors (Gordillo & Lencinas, Reference Gordillo, Lencinas and Turner1979; Kraemer et al. Reference Kraemer, Martino, Giambastiani and Sfragulla1988; Massabie & Szlafsztein, Reference Massabie and Szlafsztein1991; Kraemer & Martino, Reference Kraemer and Martino1993; Schmidt et al. Reference Schmidt, Astini, Costa, Gardini, Kraemer, Tankard, Suárez and Welsink1995; Simpson et al. Reference Simpson, Whitmeyer, De Paor, Gromet, Miro, Krol, Short, Holdsworth, Strachan and Knipe2001; Martino, Guereschi & Carignano, Reference Martino, Guereschi and Carignano2012). However, in other places the plane S2 was cut at a low angle by the Sierra Chica fault plane (e.g. Villa Carlos Paz and Potrero de Garay areas, Fig. 12c, e). This case could also be interpreted as a shortcut imposed mechanically by a too-steep S2 geometry, without significant rotation from inherited steeper faults to the shallow-dipping fault.
At the mountain scale, in the basement of Sierra Chica the fabric S2 is cut by three N330°-striking main oblique lineaments named, from north to south, Carapé, Quebrada Honda and Soconcho (Fig. 12a). These lineaments have a subvertical, straight trace on the map, and internally show an old mylonitic fabric and a superimposed new brittle fabric. The old fabric could be Devonian or older and later reactivated in a brittle regime during the Cretaceous and Tertiary tectonics. When the Tertiary compression occurred these lineaments were reactivated as dextral strike-slip faults, with an extensional component (divergent oblique shear = transtensive) generating drag and rotation of the fabric S2 in the Quebrada Honda lineament and formation of cleavage superimposed on S2 in the Carapé and Soconcho lineaments.
The oblique lineaments are here assigned to an old deformation, named pan-Gondwanan, which affected the South American and African plates (Daly, Reference Daly1988; Tankard et al. Reference Tankard, Uliana, Welsink, Ramos, Turic, França, Milani, Brito Neves, Eyles, Skarmeta, Santa Ana, Wiens, Cirbián, López Paulsen, Germs, de Wit, Machacha, Miller, Tankard, Suárez Soruco and Welsink1995). As stated in Section 4, the relationship between the lineaments and the ductile shear zones is not clear; although they are commonly associated, not all the lineaments have mylonitic rocks linked to them. This is an open question currently under study.
The northern end of the Sierra Chica fault would have nucleated along the NW extension of the Carapé lineament (Fig. 12a). This would have been one of the main controls of the Cretaceous basin of the sierras of Pajarillo, Copacabana and Masa, because it is interpreted as the take-off listric normal fault (detachment or sole fault; Martino et al. Reference Martino, Guereschi, Carignano, Calegari, Manoni, Martino and Guereschi2014), then inverted during the Tertiary tectonics. An eroded harpoon-like structure (McClay & Buchanan, Reference McClay, Buchanan and McClay1992) affecting the basal sedimentary sequence of the Cretaceous basin is recognized here and is one of the best places in the mountains to analyse the inversion of Cretaceous basins by Tertiary deformation. The Carapé and Guacha Corral–Pachango ductile shear zones (Fig. 4) are the two most important crustal boundaries in the Sierras de Córdoba, subsequent to the metamorphic peak and the beginning of exhumation of the Pampean orogen at this latitude (Martino, Reference Martino2003).
High angles observed in some segments in the Sierra Chica fault plane, manifested as straight traces on the map (e.g. at the latitude of Cosquín, Fig. 12a), are interpreted as the result of translation and progressive back-rotation of the main fault as the imbrication of the sedimentary wedge occurred below (Fig. 11a). This implies an essentially non-rigid basement behaviour strongly influenced by the geometry of the footwall (Kraemer & Martino, Reference Kraemer and Martino1993). Other straight segments of the Sierra Chica fault, that mark the boundaries of the Cretaceous basins sierras of Pajarillo, Copacabana and Masa in the north and Sierra de los Cóndores in the south (Fig. 4), are interpreted as Cretaceous normal faults today reversed by Tertiary tectonics. The curved segments are therefore new low-angle reverse faults (basement thrusts) caused by Tertiary tectonics, while the straight segments are rotated thrusts or reverse reactivations of previous faults as postulated in the Introduction section of this paper. Taken together, all segments are interconnected forming the current Sierra Chica fault.
In the segments between the oblique lineaments, the current Sierra Chica fault has a curved trace, convex westwards (salient S in Fig. 12a), while at the latitude of the lineaments the fault reverses becoming concave eastwards (recess R in Fig. 12a). The convex segments, limited by oblique lineaments, produced the segmentation of the Sierra Chica fault into at least three large thrusts sheets. During Tertiary compression, such sheets were displaced mainly towards the NNW (c. N330°), while the lineaments acted as lateral ramps. The convex shape should be the effect of low-angle reverse faulting associated with the expansion of the front of the thrust sheet, a mechanism analogous to that recognized in the nappes (spreading nappes, Fig. 12g). The central fault segment between the Quebrada Honda and Soconcho lineaments can be taken as an example of the latter process and geometry. The thrust plane is slightly wavy, so locally the tectonic transport direction (arrows TTD in Fig. 12a) deviated from the main NNW-striking trend and veered to the west and SW. This gentle undulation of the fault plane is also observed at the latitude of Villa Carlos Paz, where it can be interpreted as a gently folded subvertical fault plane (Fig. 12c). An undulating fault plane is another factor that explains the various cross-cutting relationships observed with respect to the foliation plane S2 (Fig. 3f).
Kinematic analysis of minor faults in the areas of Cosquín, Villa Carlos Paz and Santa Rosa (Kraemer et al. Reference Kraemer, Martino, Giambastiani and Sfragulla1988; Kraemer & Martino, Reference Kraemer and Martino1993; Painceyra, Reference Painceyra1998) indicates that there are two common directions of shortening that belong to different deformation events, NW and NE, corresponding to events A and B, respectively (Fig. 12b, d). It is worth noting that recent focal mechanisms, deduced by P and S waves, are coincident with the event A since a component of NW shortening and subvertical lengthening (Richardson et al. Reference Richardson, Ridgway, Martino, Gilbert, Anderson, Carignano and Enkelmann2009) is determined. This dynamic also coincides with the determined main direction of tectonic transport (TTD arrows, Fig. 12a) for the various blocks of the Sierra Chica limited by the Carapé, Quebrada Honda and Soconcho lineaments.
The Tertiary reverse fault of Sierra Chica was nucleated and reactivated, and then inverted a Cretaceous normal fault related to the deformation that led to the opening of the Atlantic Ocean (Schmidt et al. Reference Schmidt, Astini, Costa, Gardini, Kraemer, Tankard, Suárez and Welsink1995). This coincides with the Eastern Pampean lineament (Fig. 1) corresponding to the suture produced by the assembly of the Río de la Plata craton with the Pampia terrane in Precambrian times. The latter lineament and the current fault are probably the surface expression of the true suture, now in lower structural levels of the lithosphere but geophysically detected (Booker, Favetto & Pomposiello, Reference Booker, Favetto and Pomposiello2004; Gilbert et al. Reference Gilbert, Richardson, Anderson, Alvarado, Martino, Beck, Zandt and Gans2010).
Based on geobarometric data obtained from metamorphic rocks of the blocks exhumed on both sides of the Sierra Chica fault, Martino, Guereschi & Carignano (Reference Martino, Guereschi and Carignano2011) estimated a throw of between c. 5 km at Alta Gracia (31°36′S) and c. 12 km at La Calera (31°21′S). This present-day geobarometric difference is an effect of Cretaceous extensional tectonics that was not compensated by the Tertiary inversion.
9. Considerations about the age of faulting
Based on thermochronological data that indicate activity as early as during the Carboniferous period, the inversion of the Cretaceous basin and Cenozoic synorogenic deposits affected by subsequent faulting, it can be deduced that block uplift resulted from different orogenic cycles from the Palaeozoic era to present times. It should be noted that the modern mountain uplift is not recorded by thermochronological data, but it can be constrained based on stratigraphic evidence from the overthrust sequences and their regional correlation. The information available is fragmentary, the Sierra de Pocho, Sierra de Comechingones and Sierra Chica faults being the best studied to date.
Based on radiometric dating in pseudotachylites from the Sierra de Pocho fault (Fig. 4), the deformation could have been active from the early Carboniferous period (c. 350–340 Ma, Whitmeyer, Reference Whitmeyer2008). Brittle reactivation of this structure with development of gouge and brecciation is probably linked to the Cenozoic deformation that produced the uplift of the sierras of Guasapampa and Pocho. The origin of the large asymmetrical synformal fold in sedimentary rocks (a drag fold?) could be a concomitant event. The magmatism associated with the Andean orogenic cycle, represented by the Pocho Volcanic Complex (7.9–4.7 Ma; Kay & Gordillo, Reference Kay and Gordillo1994; Arnosio et al. Reference Arnosio, Popridkin, Báez, Bustos, Martino and Guereschi2014) and in the Sierra del Morro at San Luis (2.6±0.7 Ma and 1.9±0.2 Ma; Ramos, Munizaga & Kay, Reference Ramos, Munizaga and Kay1991). The Pocho volcanic rocks overlying the eastern flank of the Sierra de Pocho show strong erosion on the west side near the top of the sierra. This would indicate that these rocks were tilted to the east, probably as a result of the reactivation of the Sierra de Pocho fault during Pliocene–Pleistocene times.
For the Sierra de Comechingones fault, based on the results of K–Ar fault gouge dating, Bense et al. (Reference Bense, Löbens, Wemmer, Dunkl, Costa, Layer and Siegesmund2011) set the onset of brittle deformation as early Carboniferous (c. 340 Ma) followed by Permian–Triassic and Jurassic events. Löbens et al. (Reference Löbens, Bense, Wemmer, Dunkl, Costa, Layer and Siegesmund2011) proposed that the current structural relief was achieved after the late Cretaceous exhumation (c. 80–70 Ma, based on thermochronological data). This fault also recorded Quaternary activity dated at 7.1±0.4 ka and 350±40 ka BP (the El Molino fault, Fig. 4; Costa et al. Reference Costa, Massabie, Sagripanti, Brunetto, Coppolecchia, Martino and Guereschi2014).
The Sierra Chica fault is a Tertiary reverse fault that was nucleated and reactivated and then inverted a normal fault of the Cretaceous rift. To date, thermochronological data are not available to constrain previous brittle activity. The age of the Cenozoic deformation depends on the age assigned to the sedimentary sequences overthrust by the basement. In the Cosquín area, the Eocene–Oligocene Cosquín Formation is separated by a calcrete horizon from the Miocene–Pliocene Casagrande Formation, and both sequences were imbricated by reverse-faulting (Fig. 11a) during the Pliocene–Pleistocene periods. In the Santa Rosa area (Fig. 11b), deformation event A is clearly recognized in clay levels in the fault plane suggesting that it was the last episode of movement, probably post-Pliocene (early Pleistocene?). Event B is recognized in the basement relatively far from the fault plane and is considered as a previous event of uncertain age (pre-late Pliocene?, Kraemer et al. Reference Kraemer, Martino, Giambastiani and Sfragulla1988). Both events coincide approximately with the Pliocene–Pleistocene imbrication of the Cosquín and Casagrande formations. According to Schmidt et al. (Reference Schmidt, Astini, Costa, Gardini, Kraemer, Tankard, Suárez and Welsink1995), deformation developed after the Pliocene period based on the inversion of the Cretaceous basins. Based on stratigraphic evidence in the Sierras de Córdoba and correlation with structural analysis in the Puna and northwestern Sierras Pampeanas (Allmendinger, Reference Allmendinger1986; Marrett & Allmendinger, Reference Marrett and Allmendinger1987), Martino et al. (Reference Martino, Kraemer, Escayola, Giambastiani and Arnosio1995) proposed that the two deformational events occurred during the Pleistocene, at c. 0.8 Ma (event A) and c. 2 Ma (event B). In addition, very recent (Holocene?) displacements have been recognized (Costa et al. Reference Costa, Massabie, Sagripanti, Brunetto, Coppolecchia, Martino and Guereschi2014) based on geomorphology and observations of soil horizons affected by the faulting (e.g. in the Potrero de Garay area). Reactivation of the Sierra Chica fault therefore developed during late Pliocene – Pleistocene – Holocene times. In addition, southwards diachronism in fault propagation is recognized based on the overthrust relationship over younger sedimentary rocks to soils in that direction.
The age of the reactivation of the easternmost Elevación Pampeana fault is unknown, but it is estimated to be more recent than the Sierra Chica fault. Other authors (Costa & Vita-Finzi, Reference Costa and Vita-Finzi1996; Costa et al. Reference Costa, Murillo, Sagripanti and Gardini2001) believe that it is a Holocene uplift but with variable uplift rates.
Seismological and seismic risk features linked to the latest deformation have been recently reviewed by Fatala & Martino (Reference Fatala and Martino2012), Perarnau et al. (Reference Perarnau, Gilbert, Alvarado, Martino and Anderson2012), Costa et al. (Reference Costa, Massabie, Sagripanti, Brunetto, Coppolecchia, Martino and Guereschi2014) and Caro Montero, Martino & Guereschi (Reference Caro Montero, Martino and Guereschi2015). The Ciénaga del Coro fault, Ojo de Agua lineament, La Sierrita fault, northern segments of the Cumbre de Gaspar and Sierra Chica faults all exhibit present-day seismic activity, with magnitudes of 2–4 (M b).
The synorogenic deposits in the piedmont of the Sierra Chica fault (Fig. 11a) and the interception of drainage from Sierra Grande by Sierra Chica provide clear evidence of uplift of the Sierra Grande prior to that of Sierra Chica through its eponymous faults.
Based on thermochronometric data of apatite and zircon (U/Th)/He ages, Richardson et al. (Reference Richardson, Ridgway, Gilbert, Martino, Enkelman, Anderson and Alvarado2013) postulated Permian – Early Jurassic cooling in the basement of the Sierras de Córdoba, suggesting that exhumation has been less than 2–3 km since then. Faulting and uplift in the Sierras Pampeanas of Córdoba is diachronous from north to south, based on the overthrusting relationship in sedimentary sequences and thermochronological data. This suggests discrete block uplift, reflecting segmentation produced partly by the oblique lineaments and partly by other ancient faults. The fault reactivation would have formed mountain ranges internally composed of blocks that rose diachronously.
The direction of propagation of the main faults with a dominant westerly vergence was from west to east (backwards propagation), with the Río de La Plata craton acting as a buttress. The present topography is the result of the Permian – Early Jurassic exhumation (according to (U/Th)/He data) plus the Pliocene–Quaternary uplift of c. 2–3 km, not detected by thermochronometric data as in most of the Sierras Pampeanas. In addition, palaeoclimatic and geomophological observations allow the remnants of pre-Cenozoic landforms to be recognized (Rabassa et al. Reference Rabassa, Zarate, Partridge, Maud, Cioccale and Carignano1997; Carignano, Cioccale & Rabassa, Reference Carignano, Cioccale and Rabassa1999).
10. Concluding remarks
The Sierras Pampeanas de Córdoba are the easternmost uplift blocks related to current Andean foreland deformation, over 700 km from the Chilean trench and coinciding with a region of low inclination and shallowing of subduction of the Nazca plate beneath the South American plate (the Pampean flat-slab). By coupling between the two plates, this phenomenon has been compared to the Laramide orogeny of North America and elsewhere in the world (Jordan et al. Reference Jordan, Isacks, Ramos and Allmendinger1983b ; Rodgers, Reference Rodgers1987; Marshak, Karsltrom & Timmons, Reference Marshak, Karsltrom and Timmons2000). In the Sierras Pampeanas, it occurs between 27° and 34°S latitude and was active from 12 Ma to the present (Ramos & Folguera, Reference Ramos, Folguera, Murphy, Keppie and Hynes2009), causing thick-skinned tectonics over an area of about 800×600 km.
At the latitude of the Sierras de Córdoba, the top of the Nazca plate is located at a depth of c. 175 km (Cahill & Isacks, Reference Cahill and Isacks1992; Booker, Favetto & Pomposiello, Reference Booker, Favetto and Pomposiello2004), as detected by seismic and magnetotelluric surveys. These studies also suggested that, towards the east of Sierra Chica (Alta Gracia, Fig. 4), almost vertical sinking of the Nazca plate would occur, probably related to the presence of the western boundary of the Río de la Plata craton (Rapela et al. Reference Rapela, Pankhurst, Casquet, Fanning, Baldo, Gonzalez-Casado, Galindo and Dahlquist2007).
The asymmetric uplift blocks of the Sierras de Córdoba are arranged in N–S-aligned ranges limited by E-dipping reverse faults, both high- and low-angle, with a steep western flank and a gentle eastern flank (e.g. 10–12° for Sierra Chica). Looking to the north, there is clockwise tilting. Four blocks are distinguished from west to east: Sierra de Pocho; Sierra de Comechingones–Grande (highest elevation Cerro Champaquí: 2884 m a.s.l.); Sierra Chica (Cerro Uritorco: 1950 m a.s.l.); and Elevación Pampeana. Between the blocks are Mesozoic and Cenozoic basins, the latter partitioned by the deformation that uplifted the blocks from c. 10 Ma ago (Jordan et al. Reference Jordan, Zeitler, Ramos and Gleadow1989; Schmidt et al. Reference Schmidt, Astini, Costa, Gardini, Kraemer, Tankard, Suárez and Welsink1995; Ramos, Reference Ramos and Caminos1999). These basins were covered by Pleistocene rocks and Holocene soils in turn. Data from depth of the Mohorovicic discontinuity and thermochronometric dating indicate Permian – Early Jurassic cooling, suggesting that exhumation has been less than 2–3 km since then (Richardson et al. Reference Richardson, Ridgway, Gilbert, Martino, Enkelman, Anderson and Alvarado2013). An even older age (Carboniferous) has been proposed, so the current relief could have partial Palaeozoic and Mesozoic inheritance and was not only produced by the Andean orogeny (Jordan et al. Reference Jordan, Zeitler, Ramos and Gleadow1989; Coughlin et al. Reference Coughlin, O'sullivan, Khon and Holcombe1998; Löbens et al. Reference Löbens, Bense, Wemmer, Dunkl, Costa, Layer and Siegesmund2011; Martino, Guereschi & Carignano, Reference Martino, Guereschi and Carignano2012).
The controls on the Andean deformation by faulting in the Sierras de Córdoba are varied: (1) the dominant basement metamorphic fabric S2 (Kraemer et al. Reference Kraemer, Martino, Giambastiani and Sfragulla1988; Kraemer, Escayola & Martino, Reference Kraemer, Escayola and Martino1995; Martino, Guereschi & Carignano, Reference Martino, Guereschi and Carignano2012); (2) the reactivation of suture zones (Schmidt et al. Reference Schmidt, Astini, Costa, Gardini, Kraemer, Tankard, Suárez and Welsink1995); and (3) the reactivation of Cretaceous normal faults (Martino, Guereschi & Carignano, Reference Martino, Guereschi and Carignano2012). We recognize two further factors. (4) Based on geological and geophysical data, we propose that oblique lineaments are another kind of control on the nucleation and development of Tertiary faulting. These lineaments are old, probably correlated with the pan-Gondwanan trend (Daly, Reference Daly1988; Tankard et al. Reference Tankard, Uliana, Welsink, Ramos, Turic, França, Milani, Brito Neves, Eyles, Skarmeta, Santa Ana, Wiens, Cirbián, López Paulsen, Germs, de Wit, Machacha, Miller, Tankard, Suárez Soruco and Welsink1995) and deeply affect the crust, shifting the Mohorovicic discontinuity (Perarnau et al. Reference Perarnau, Gilbert, Alvarado, Martino and Anderson2012). They worked in a transtensional way (= divergent oblique shear) during the Cretaceous period, uplifting high-grade metamorphic rocks in their highest parts during Cenozoic tectonics (Martino, Guereschi & Carignano, Reference Martino, Guereschi and Carignano2012). These lineaments are also the locus of magmas represented by Paleocene olivine nephelinites dykes and serve as metallotects for gold and uranium mineralization. The Ojo de Agua lineament (Fig. 4), one of these ancient lineaments, extends to the SE into the Soconcho lineament, forming a single structure at regional scale, with deep current seismic activity below the Mohorovicic discontinuity to c. 80 km (Caro Montero, Martino & Guereschi, Reference Caro Montero, Martino and Guereschi2015). (5) Finally, there is clear control exerted by Palaeozoic ductile shear zones in both the hangingwall and footwall on the Tertiary brittle deformation. As an example, the Pachango lineament and the eponymous ductile shear zone (Fig. 7a) make the southern boundary of the large Los Túneles shear zone and put rocks with contrasting metamorphic grades into contact.
According to observations in many places, it has been traditionally considered that in the Sierras Pampeanas high-angle reverse faults limit mountain range blocks (González Bonorino, Reference González Bonorino1950; Gordillo & Lencinas, Reference Gordillo, Lencinas and Turner1979). However, in some places very-low-angle reverse faults (thrusts) also produced block uplifts. The block of the Sierra Chica is an example of these different angles of faulting. As described, the Sierra Chica fault has a sinuous trace with straight and curved segments. The straight segments have high angles and are associated with inverted Cretaceous basins, whose remains lie on top of the uplifted blocks. Other straight segments would be rotated basement thrusts as the result of translation and progressive back rotation of the main fault, as the imbrication of the sedimentary wedge occurs below (Fig. 11a). This implies a basement behaviour that is essentially non-rigid and strongly influenced by the geometry of the footwall (Kraemer & Martino, Reference Kraemer and Martino1993). All straight segments are connected by curved segments, which have a lower angle, are younger and are where true basement thrust is recognized (e.g. areas of Villa Carlos Paz and Santa Rosa; Fig. 6).
Dominantly W-vergent with sequential hangingwall faulting propagated from west to east (backwards faulting propagation), with the Río de la Plata craton as a buttress located to the east and deep in the Chaco-Pampean plain.
The overthrust relationships in sedimentary sequences and thermochronological data indicate discrete block uplift, reflecting segmentation produced partly by the oblique lineaments and partly by ancient faults. Fault reactivation formed mountain ranges internally composed of blocks that rose diachronously.
The uplift of the blocks and the maximum displacement estimated by the bow-and-arrow method (Elliott, Reference Elliott1976) decrease in the same direction, from 8.8 km in the west to 3.2 km in the east, with a displacement/length ratio varying from 1:12 and 1:6 and with an average value of 1:8.4 (γ = 0.13). The tectonic transport direction is relatively constant, with values of N260–270°.
Quaternary movements are recognized in the El Molino fault near Merlo and in the Sierra Chica fault (Costa & Vita-Finzi, Reference Costa and Vita-Finzi1996; Costa et al. Reference Costa, Murillo, Sagripanti and Gardini2001). The fault that uplifted the Sierra Baja de San Marcos provides evidence for neotectonic activity in two stages during late Holocene time (Massabie, Reference Massabie1982; Massabie et al. Reference Massabie, Sanguinetti, Lo Forte and Cegarra2003); for a detailed review of the neotectonic activity see Costa et al. (Reference Costa, Massabie, Sagripanti, Brunetto, Coppolecchia, Martino and Guereschi2014). At the present time, the latest deformation is registered by seismic activity, showing magnitudes (M b) of 2–4.
Acknowledgements
The CONICET, FONCyT, SECyT–UNC and Secretaría de Minería of the Province of Córdoba (Argentina) institutions are thanked for supporting our research over the years. Formal revisions by two referees, V. Ramos and an anonymous reviewer, and the editorial assistance of O. Lacombe are acknowledged for their contributions which significantly improved the manuscript. Language revision by R. J. Pankhurst is gratefully acknowledged.


