


INTRODUCTION
There are good reasons to suspect that epidemics of infectious diseases first appeared in agrarian societies, i.e. societies of which agriculture and/or animal husbandry were the main forms of subsistence, setting the pulse of the entire community [Reference Fenner and Boyden1–Reference McMichael3]. The geographical and chronological evolution of these epidemics is fairly well established but whether or not these outbreaks occurred uniformly over time has never been shown. This paper provides the first quantitative description of the evolution of the burden of epidemics over the last 2000 years in agrarian China.
Absence of epidemics in foraging societies
Prehistoric foragers, i.e. populations which existed before the Neolithic revolution, subsisting mainly by gathering, hunting and fishing [Reference Kelly4], suffered from infectious diseases, but probably not from epidemics. Archeological skeletons reveal signs of non-specific periostitis (osteomyelitis), treponematoses, leprosy, and tuberculosis [Reference Cohen5]. In a tropical environment, parasitism, such as malaria, hookworm, bilharzias, and sleeping sickness must have been endemic [Reference Fenner and Boyden1, Reference McNeill2 (pp. 10, 25, 42), Reference Cohen5]. On the other hand, the nomadic mode of life of prehistoric foragers was a major obstacle to the spread of diseases, such as smallpox, measles, influenza, and the common cold, all of which depended on rapid and continuous transmission of the agent to new human hosts. The small size of nomadic foraging clans could not sustain infections and allow their dissemination. Mobility also facilitated the isolation of new cases: people moved, leaving the sick and deceased behind, and in doing so avoided contagion and ended the outbreak [Reference Cohen5, Reference Morabia6]. In the absence of trade, nomadic foragers had very little contact with each other, limiting the opportunities to contaminate other clans. The lack of immune defence against modern pathogens in contemporary foragers further attests their unfamiliarity with many infectious diseases, which became epidemic in agrarian societies, especially respiratory diseases (e.g. measles, smallpox, tuberculosis), but also venereal diseases (e.g. gonorrhoea and syphilis). This could explain the huge mortality observed in contemporary foragers subsequent to their first contact with modern humans [Reference Hill and Hurtado7–Reference Bailey9].
First epidemics in agrarian societies
Around 10 000 b.c.e. foraging was progressively abandoned. Communities became sedentary, stored food, traded, and communicated with each other. They began to subsist mainly on agriculture and/or animal husbandry. Two characteristics of these agrarian societies set the stage for the emergence of epidemics: the closeness between humans and domesticated animals, and the increase in population density. Animal domestication created favourable conditions for animal parasites to contaminate human beings, and to evolve and adapt to the human organism. Up until 3000 b.c.e., measles, tuberculosis, and smallpox may well have come from cattle, flu from pigs and ducks, and whooping cough from pigs and dogs [Reference McNeill2, Reference Diamond10, Reference Wolfe, Dunavan and Diamond11].
The situation in Mesoamerica before the Spanish Conquest corroborates the thesis that both people and animals were necessary to trigger epidemics. None of the Mexican Codices describing life under the Aztecs mention epidemics [Reference Soustelle12, p. 58], even though the total population of Central Mexico reached a great density: probably 25·2 million by 1518, just before the Conquest [Reference Mann13, p. 144]. The capital of the Aztecs, Tenochtitlan, within today's Mexico City, had about 200 000 inhabitants. It was one of the largest cities in the world. However, they had no domesticated animals besides the dog and the turkey, both of which they raised as a food resource [Reference Soustelle12, p. 180].
In the Old World, the increasing concentration of human beings and domesticated animals triggered epidemics, first around 2000 b.c.e. in Ancient Sumer, when its population approached half a million, a size sufficient to sustain infectious chains like those of modern childhood diseases (particularly measles) [Reference McNeill2, p. 55]. From then on, ancient texts mention pestilences suggestive of infectious disease epidemics in Babylon and Egypt (ca 2000 b.c.e.), in China (from about 1300 b.c.e.), and in the Biblical Book of Exodus (between 1000 and 500 b.c.e.) [Reference McNeill2, p. 71].
Geographical and chronological evolution of epidemics
Historical and archeological records have allowed for the relatively precise identification of the nature of the successive waves of epidemic diseases [Reference McNeill2]. From 3000 to 500 b.c.e., diseases such as measles, smallpox (India), influenza, typhoid, dysentery, and dengue probably became installed and eventually epidemic in the Middle East, China, India and the Mediterranean. From 500 b.c.e. to 1200 c.e., these disease pools probably started to merge [Reference McNeill2, p. 119]. In the 7th century c.e., leprosy appeared in Egypt and Western Europe. During the first half of the second millennium, measles and smallpox became childhood diseases in Asia and Europe, while the Black Death, a plague pandemic, spread from Asia to Europe, killing a substantial fraction of the population of the Old World [Reference Gottfried14]. Between 1500 and 1700, transoceanic exchanges stimulated the extension of epidemics to America. Childhood and other diseases of the Old World produced catastrophic epidemics upon reaching the New World. The population of Central America may have declined from 25 million in 1518 to 700 000 a century later [Reference Mann13, p. 144]. The Atlantic slave trade may have brought malaria and yellow fever to the Americas [Reference McMichael3]. Syphilis is one of the rare diseases which may have travelled from the New to the Old World [Reference Harper15]. During the 14th century, syphilis and tuberculosis displaced yaws and leprosy. Typhus ravaged Europe between 1500 and 1900 [Reference Zinsser16]. Pandemics of cholera began in the early 19th century [Reference McNeill2].
Open questions about epidemics in agrarian societies
Epidemics of infectious diseases first appeared around 2000 b.c.e. in centres of unusually dense human populations where there existed domesticated animals [Reference McNeill2, p. 55]. However, the magnitude of the burden of epidemics on people's everyday life is not well known, especially before 1800. There are, to my knowledge, no report of how frequent the outbreaks were and whether their density evolved across time. In other words, there is no description of how the pressures of epidemics on societies grew over the last 4000 years. This knowledge deficit stems mainly from a lack of accurate long-term monitoring of epidemic outbreaks in most regions of the world. However, there is a major exception: a catalogue of dates and places of outbreaks of epidemic diseases is available for China between 243 b.c.e. and 1911 c.e., i.e. over about 2000 years. The records encompass the entire duration of the Chinese Empire, from the ‘First Emperor’ of the Qin (Qin Shi Huangdi – from 221 to 206 b.c.e.), to the last Emperor of the Manchu or Qing Dynasty (1644–1911).
This invaluable source of data about the history of epidemics has not yet been exploited to its full potential. This paper shows a quantitative analysis of these data, revealing that epidemic density, at least in China, seems to have followed a clear historical evolution.
MATERIAL AND METHODS
The list of epidemics in China was prepared from previous compilations by Joseph H. Cha, Professor of Far Eastern History at Quincy College, MA, USA. It has been published as an appendix to Plagues and People [Reference McNeill2, pp. 259–269]. The data provided by McNeill were converted into an Excel file and analysed using statistical software R [17].
The map of China (Fig. 1) was drawn with reference to a historical map [Reference Ward, Proth and Benians18] and the State Bureau of Surveying and Mapping, China (www.sbsm.gov.cn).
Map of China indicating the most frequently reported locations of epidemics. Both the spelling reported by McNeill and the modern Pinyin spelling (in parentheses) are given. The conventional boundary between north (dots 1–5, 12) and south China (dots 6–11, 13–15) is the line of the Han River and the Huai River, not shown on this map but located between the Yellow River and the Yangtze River.
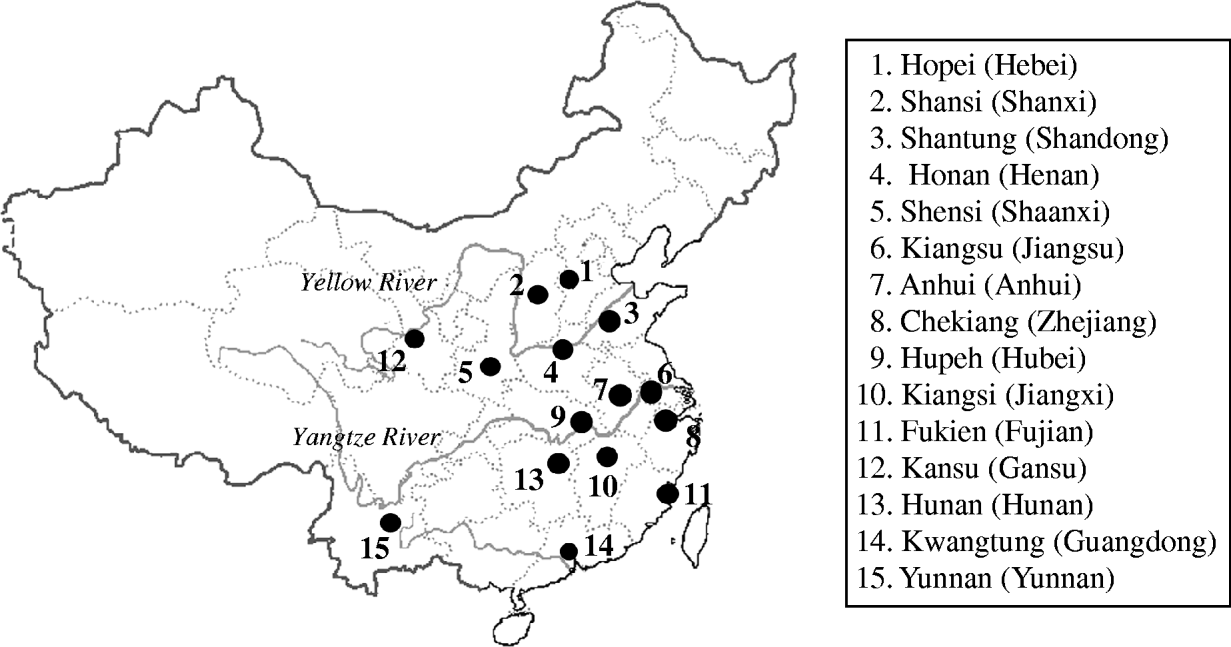
Locations were classified as belonging to the north or the south according to a geographical line made by the part of the Han River, going west to east, before it dips south, and the Huai River. That line of the Han and the Huai rivers sets a boundary, dividing the grain-growing agriculture of Northern China and the rice-based agriculture of Southern China.
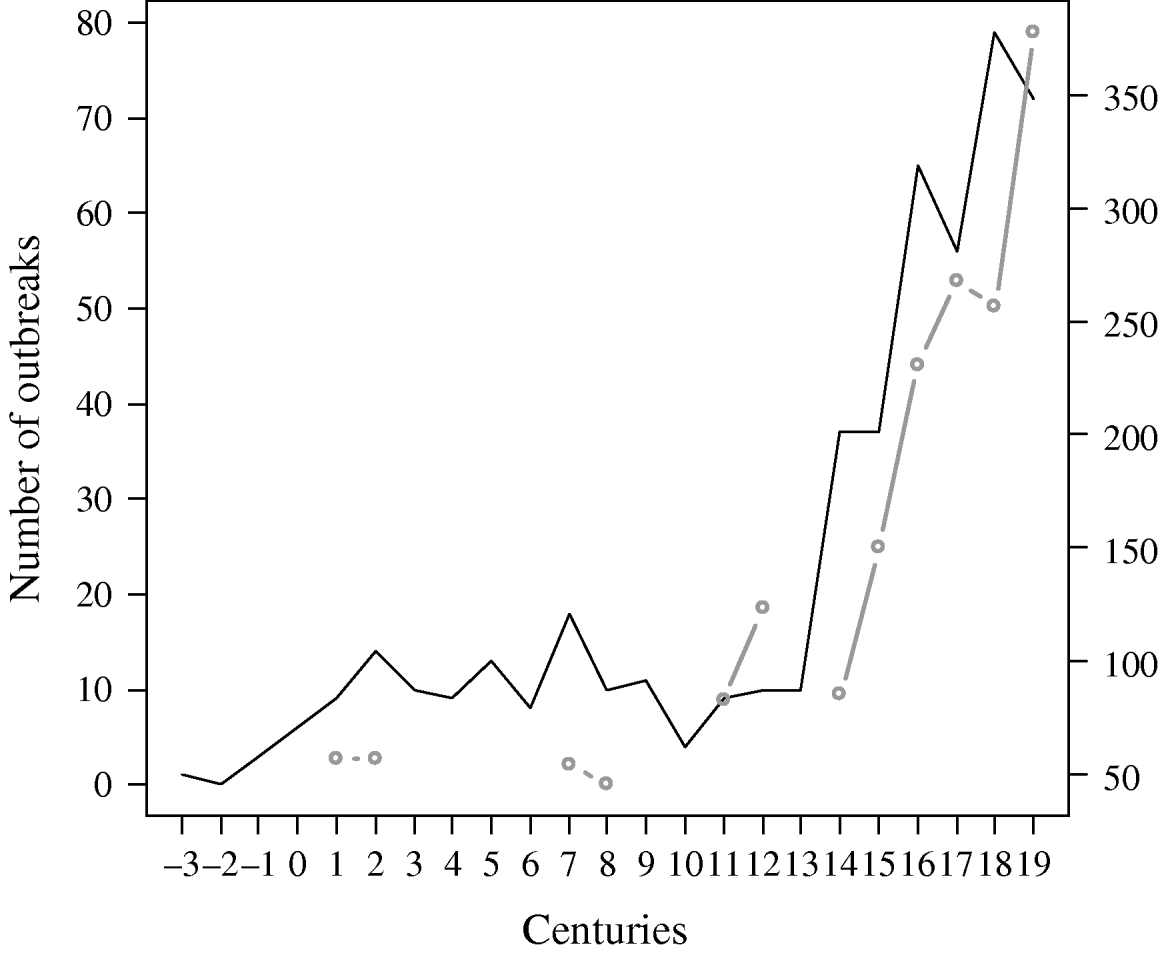
The demographic expansion of China between 2 c.e. and 1911 c.e. was taken from the critical analysis by Durand [Reference Durand19] of the so-called Chinese ‘censuses’, except for the Ming dynasty (1368–1644). According to Mote [Reference Mote20, p. 745], a recent study by Heijdra [Reference Heijdra21] provides more convincing figures than the older estimates reported by Durand. Century averages of population estimates, which Durand and Mote retained as most accurate, are plotted in Figure 2.
Number of epidemic outbreaks by century reported between 300 b.c.e. and 1911 c.e. in China (solid line; source: McNeill [Reference McNeill2]) and population size (grey dotted line; sources: Durand [Reference Durand19], Mote [Reference Mote20]).
RESULTS
The dataset comprised 488 outbreaks between 243 b.c.e. and 1911 c.e. Half of them occurred before 1544. The locations were provided by Cha in an older Romanization form but the spelling according to the more modern Pinyin system is given in parentheses. The 15 locations most commonly mentioned in the list are shown in Figure 1. They include Chekiang (Zhejiang, 55 outbreaks), Hopei (Hebei, 40 outbreaks), Hupeh (Hubei, 35 outbreak), Shansi (Shanxi, 37 outbreaks), and Kiangsu (Jiangsu, 31 outbreaks). Outbreaks were more common in the south (n=252) than in the north (n=218). Eighteen outbreaks occurred in unidentified locations. Two of the outbreaks, in 243 b.c.e. and 468 c.e., were described as Chinese pandemics and I counted them as having occurred both in the north and the south.
Century averages of epidemic outbreaks and population estimates are plotted in Figure 2. The frequency of outbreaks per century has been increasing over time, with three distinct phases. (1) Outbreaks were rare before 100 c.e. (2) A plateau occurred at about 10 outbreaks per century between 100 and 1100 c.e. (3) After 1100 c.e., outbreaks grew rapidly, reaching 80 outbreaks per century after 1800.
The dotted line in Figure 2 shows the demographic expansion (in millions). The line is interrupted when there is no reliable population estimate for the specific century. The demographic expansion closely matches the rise in outbreak frequency, even though there are two notable troughs in the 14th and 17th centuries.
Figure 3 indicates that exponential growth of outbreaks after 1100 c.e. occurred simultaneously in Southern and Northern China, even though in absolute number, epidemics were more common in the south.
Number of epidemic outbreaks by century reported between 300 b.c.e. and 1911 c.e. in the north (grey dotted line) and south of China (solid line). See Figure 1 for geographical boundaries. (Source: McNeill [Reference McNeill2].)
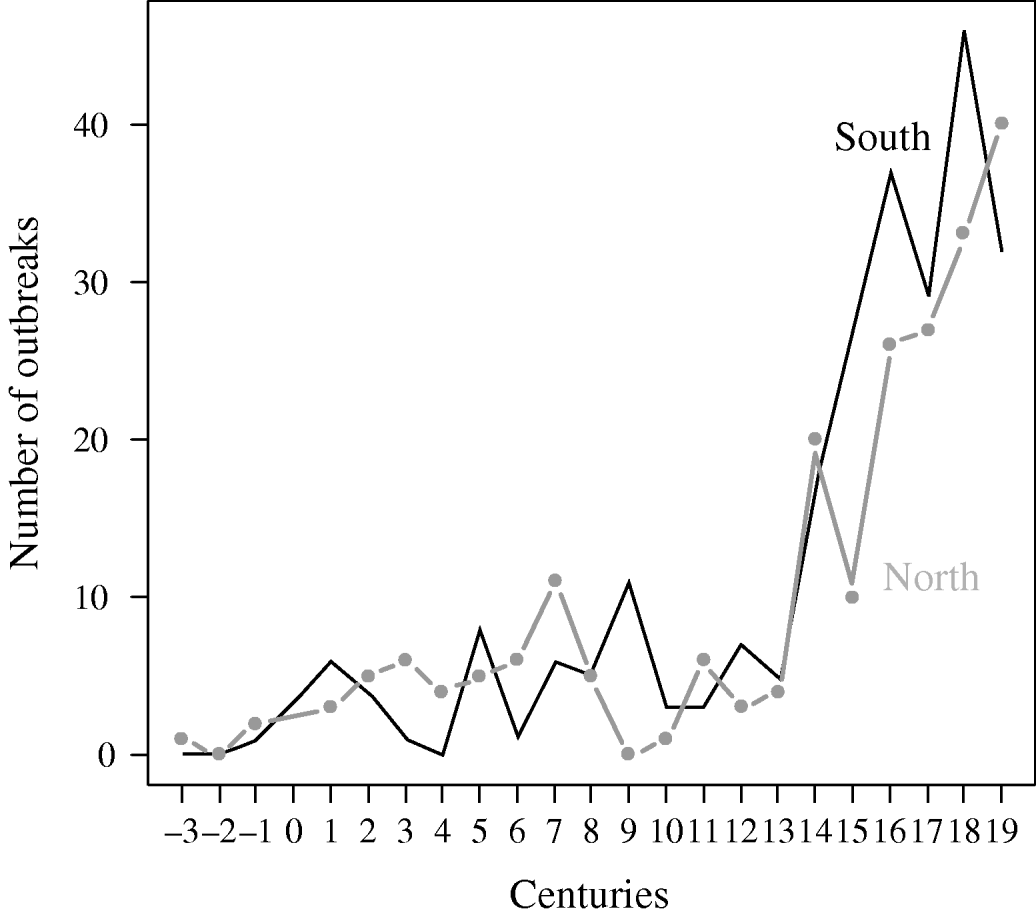
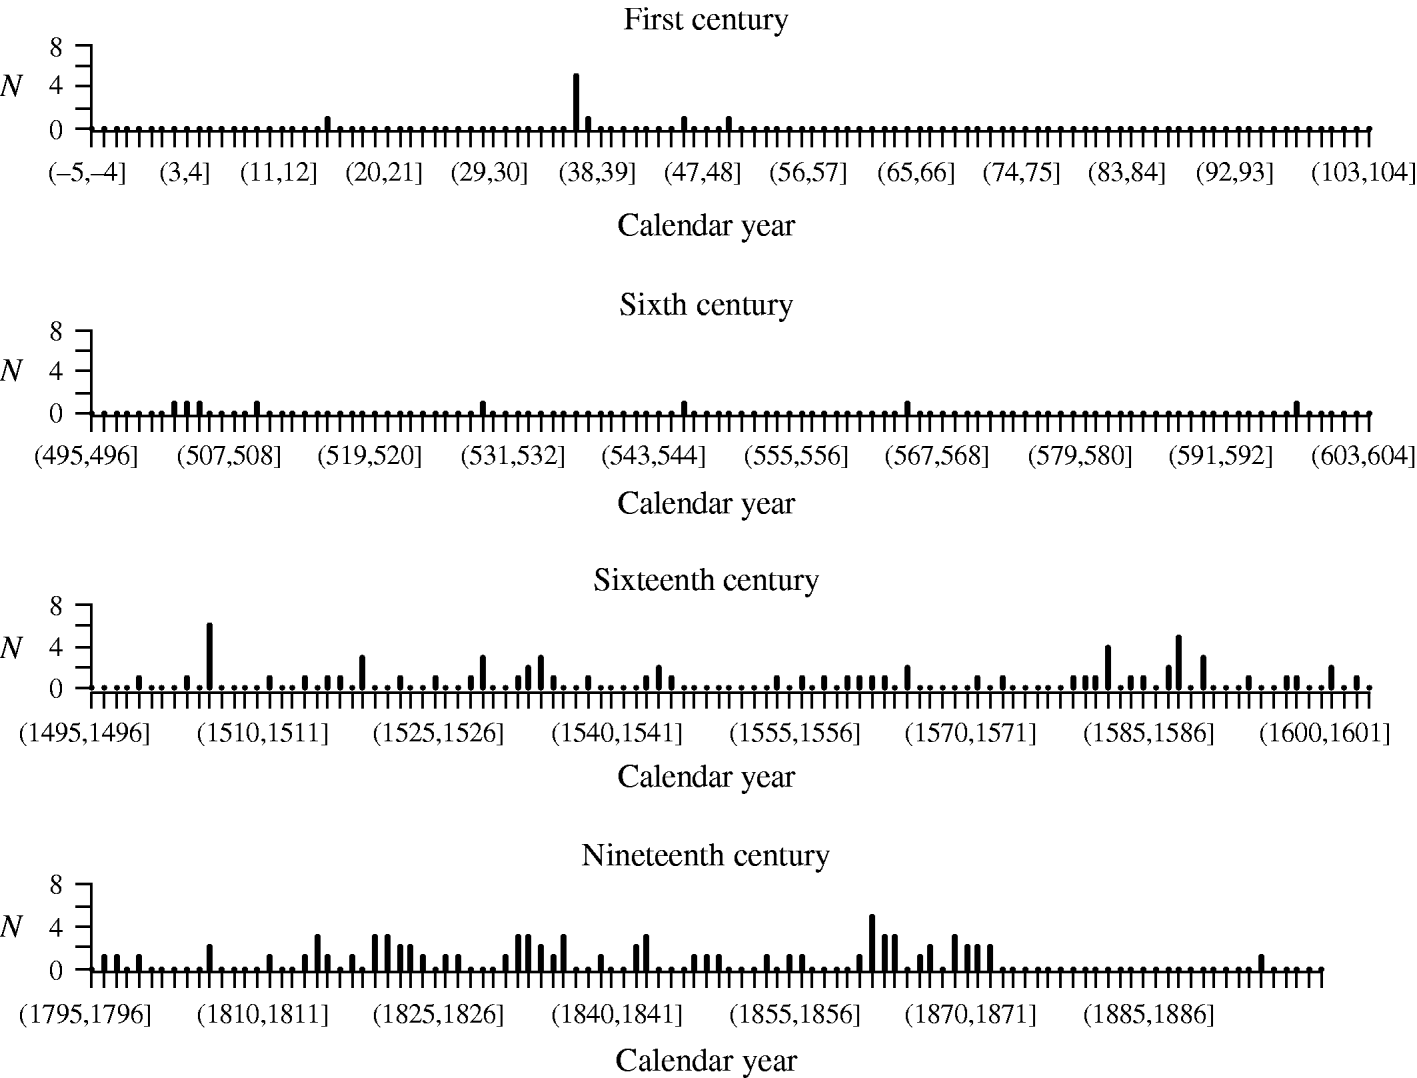
Figure 4 compares the density of outbreaks in the 1st (5 outbreak years), 6th (8 outbreak years), 16th (44 outbreak years) and 19th (42 outbreak years) centuries, for the whole of China. There were several decades free of outbreaks in the 1st century. Outbreaks were quasi-decennial in the 6th century. During the 16th century there was an outbreak every couple of years. The same held true during the 19th century, but outbreaks were simultaneous and occurring in more locations. The median (mean) numbers of locations per outbreak year for the 1st, 6th, 16th and 19th centuries were, respectively, 1 (1), 1 (1), 1 (1·6) and 1·5 (1·8).
Yearly density of epidemic outbreaks reported in China during four different centuries. (Source: McNeill [Reference McNeill2].)
DISCUSSION
The catalogue of major epidemics during the 2000 years that the Chinese Empire lasted provides a unique perspective on how their burden evolved in an agrarian society. Its quantitative analysis indicates that their importance grew across time and that epidemics became rapidly recurrent only during their last centuries of existence. There is a striking parallel between the evolution of population size, and that of epidemic frequency and density. The burden of epidemic diseases seems to have grown at the same rate as the population enumeration throughout the Chinese Empire.
As stressed by Durand, the demographic data available for China are ‘the only series of statistics on the population of any country that can be traced back more than a century or two in to the past’ [Reference Durand19, p. 210]. An equivalent statement can be made for Cha's epidemic catalogue. Even though both sources of data can be affected by serious biases discussed thereafter, they still deserve, for their uniqueness, our full attention: for the period of the Chinese Empire it is the only known historical opportunity to correlate the evolution of people and epidemics over 20 centuries.
The epidemic catalogue
Several limitations of this compilation of epidemic events can impact the validity of these results. First, McNeill did not specify how the dataset was generated. According to Hymes:
McNeill did employ a research assistant, Dr. Joseph Cha, who extracted mentions of epidemic disease from Ch'en Kao-yung's 1940 historical tables of natural disasters in China. The data for the middle and modern periods in Ch'en's table, as McNeill notes, came largely from the great Ch'ing [Qing] encyclopedia Ku chin t'u-shu chi-ch'eng, which drew them in turn in about equal measure from the dynastic histories and from provincial gazetteers of Ch'ing [Qing] date' [Reference Ch'en22, Reference Hymes23].
Outbreaks were probably initially recorded in local, prefectural and provincial geographical registries called gazetteers. Compiled lists appeared in dynastic histories and in the great 18th-century Imperial Encyclopedia. Exploring the genesis of the dataset would be a worthy endeavour given the unique perspective it provides on the history of epidemics. Scholars with expertise in the history of Chinese medicine and public health, and knowledge of Asian languages still need to trace the origin of the data in original local sources and draw more definitive conclusions.
It is important to note that McNeill rules out that the increased density of disease outbreaks is due to an improved recording system, possibly resulting in the spurious impression that there were more outbreaks across time, when in reality they were only more often reported and recorded: ‘It seems unlikely that major disease disasters escaped being here recorded. Crude indications of major turning points ought therefore to be detectable from the list’ [Reference McNeill2, p. 260].
This notion of ‘major’ vs. non-major disease disasters is therefore key to interpret the content of the catalogue. Goldschmidt [Reference Goldschmidt24] found in dynastic histories 37 ‘large scale epidemics which could conceivably have affected the course of life in the empire’ during the Northern Song dynasty (960–1127). Fifteen of the 37 outbreaks are mentioned in Cha's catalogue. In his investigation of the history of bubonic plague in China, and in particular, Southwestern China since 1772, Benedict [Reference Benedict25] found many more epidemic outbreaks in gazetteer compilation and materials collected by the Chinese Academy of Sciences than identified by Cha. As an example, from 1772 to 1830, Benedict reports 65 outbreaks of, presumably, bubonic plague for the Yunnan Province only [Reference Benedict25, pp. 18–20]. During the same period, Cha found 36 outbreaks for all of China, one of which took place in 1790 in Yunnan, Southwest of China, and seven of which took place in Chekiang, which is on the Southeast coast. Therefore, there must have been some criteria, unknown to me, by which outbreaks were deemed ‘major’ enough to be reported centrally.
An additional source of error could have occurred if the names of modern provinces did not coincide with ancient regional names. Some outbreak locations may have been arbitrary. This is unlikely, however. Thanks to the continuous geographical indexing activity of the local gazetteers Chinese locations can be pinpointed with reasonable accuracy throughout the imperial period. Moreover, such misclassification of locations would not have modified the overall temporal trends.
The population data
The Chinese mode of enumeration of the population is ordinarily referred to as ‘censuses’, but in reality, they were not always periodic counts of all the inhabitants of the Empire's territory. The Jing dynasty (1115–1234) performed triennial enumeration [Reference Ho and Aubin26], but for the Southern Song (1127–1279), the Ming (1368–1644), the Qing (1644–1911) and probably earlier dynasties, it was more a method of permanent population registers than of censuses which was used:
A record of all households and their members was supposed to be kept in each locality and brought up to date periodically by recording the changes due to births, deaths, and inward and outward movements' [Reference Durand19, p. 214].
In many ways, it is harder to maintain accurate population registries than to launch period counting campaigns, especially over such long periods of time during which dynastic successions, wars, invasions, and profound changes in country leadership occurred. Moreover, the definition of a countable person fluctuated. People could possibly have been omitted because they did not pay taxes, were not Chinese, were women or girls, or had reasons to conceal their existence to escape taxation, military service or labour draft [Reference Ho and Aubin26].
The demographic data of the Ming period (1368–1644) are for various reasons, highly suspicious [Reference Mote20, pp. 746–74]. The quality of the Ming population statistics deteriorated in the 15th and 16th centuries [Reference Durand19, p. 233]. The official figures of about 60–65 million people throughout the Ming dynasty are surely too low and probably worthless as an indication of population trends [Reference Durand19, p. 234]. Therefore, I used more recent estimates which are compatible with an even and sustained growth of the Ming population throughout the dynastic period [Reference Mote20, Reference Heijdra21].
Still, two troughs in the population growth appear in Figure 2. The first spans grossly between 1200 and 1400, i.e. the period of the Mongol domination by the Yuan dynasty (1272–1378), and the second between 1650 and 1750, i.e. the first period of the Manchu Qing dynasty (1644–1734). Major population losses may have occurred following the Mongol and Manchu conquests, due to warfare and subsequent destruction of the economy, but not necessarily due to epidemic diseases [Reference Mote20, pp. 353, 905]. Administrative failures to record during troubled times may have exaggerated the apparent losses [Reference Mote20, p. 353].
It is, however, important to note with Hymes, that ‘the early Ming looks in some ways like a black hole’ in Chinese demography, offering wide space for speculation [Reference Hymes23]. At face value, the official statistics indicate that the early Ming population was about half that of the late Song population (60 millions in 1381 vs. 123 millions in 1193–1195). These statistics combined with evidence of reduced economic activity can be used to build a case for a massive and rapid population destruction during the transition from the Mongol Yuan to the early Ming dynasties in the 14th century, corroborating theories which place the origin of the Black Death in China [Reference McNeill2, Reference Gottfried14 (pp. 33–35), Reference Hymes23]. Cha's catalogue rarely provides the number of casualties associated with each outbreak and can therefore not be used to arbitrate these conflicting opinions.
Consistent evolution of epidemic frequency and population size
In these conditions, neither the population nor the epidemic data can be trusted in terms of absolute numbers, but both McNeill, for the epidemic data [Reference McNeill2, p. 260], and Durand for the demographic data [Reference Durand19, p. 210], believe that they are still valuable for showing the general form of long-term trends. Actually, the striking consistency between the evolution of epidemic density and of population size, from two independent sources of information, suggests that the observed trends may be the reflection of some common underlying phenomenon.
The slow growth of the outbreak frequency before the 12th century occurred during a time when the total population was relatively stable: below 100 million. In contrast, the intensification of epidemic outbreaks seems to be paralleled by the almost uninterrupted growth of the Chinese population during the second millennium of the Common Era. Even though the population grew much more in the south than in the north of China, the trends in epidemic frequency are similar in both parts of the country. By the 12th century, the dense commercial connections between the north and south facilitated the dissemination of infectious agents across the country.
Epidemics and population density
Paradoxically, epidemics became more common when the population grew. Overall, larger numbers should have increased the likelihood of massive casualties. However, it is well established that population growth can coexist with an increasing burden of epidemics [Reference McNeill2].
By the later part of the 10th century, Chinese populations, like those of northwestern Europe, seem to have achieved a successful accommodation to new infections, such as smallpox and measles, especially in the Yangtze Valley and regions further south. This removed an important obstacle to population growth. ‘Only then could the teeming million of rice paddy farmers fill up the relatively vast spaces of central and southern China’ [Reference McNeill2, p. 122]. Nutrition improved following the spread, in the 11th and 12th centuries, of early rice strains making two harvests a year possible [Reference Braudel27 (p. 159), Reference Ho28]. Moreover, the Empire's administration began to leave a larger fraction of their product to the Chinese peasants [Reference McNeill2, p. 122]. The conjunction of these factors could have sustained a natural increase of the Chinese population over several generations, each new generation bringing its lot of susceptible individuals necessary to support the cyclical recurrence of epidemics.
Future research should investigate whether the association between population size and epidemic density can be extrapolated to the European agrarian societies in which a flourishing rural economy was also able to support the steady expansion of cities and urban activities.
CONCLUSIONS
This first quantitative analysis of Cha's catalogue reveals several clear-cut patterns in the emergence of major epidemic outbreaks across time and place between 300 b.c.e. and 1911 c.e. in China. The consistency between the demographic and the epidemiological evolution, both in Northern and Southern China suggests that what was true for China may also have been true for other agrarian societies.
ACKNOWLEDGEMENTS
I am indebted to Dr Hiroshi Nishiura for preparing Figure 1, to Hiroshi Nishiura and Stephen Boyanton for their insightful comments on earlier versions of this paper, and to Richard Hymes for allowing me to cite his unpublished manuscript [Reference Hymes23].
DECLARATION OF INTEREST
None.



