


Introduction
Strong temporal variations in glacier flow with at least a two-fold increase in surface velocities over a time period of a few days have been observed on a number of glaciers (Reference WhalleyWhalley, 1971; Reference FlotronFlotron, 1979; Reference Iken, Röthlisberger, Flotron and HaeberliIken and others, 1983; Reference Harrison, Raymond and MacKeithHarrison and others, 1986; Reference Raymond and MaloneRaymond and Malone, 1986; Reference Kamb and EngelhardtKamb and Engelhardt, 1987; Reference RaymondRaymond, 1987; Reference Hooke, Calla, Holmlund, Nilsson and StroevenHooke and others, 1989, Reference Hooke, Pohjola, Jansson and Kohler1992; Reference Jansson and HookeJansson and Hooke, 1989; Reference Naruse, Fukami and AniyaNaruse and others, 1992; Reference Hanson and HookeHanson and Hooke, 1994; Reference Raymond, Benedict, Harrison, Echelmeyer and SturmRaymond and others, 1995; Reference JanssonJansson, 1997; Reference Hanson, Hooke and GraceHanson and others, 1998; Reference Anderson, Fernald, Anderson and HumphreyAnderson and others, 1999; Reference Gudmundsson, Bassi, Vonmoos, Bauder, Fischer and FunkGudmundsson and others, 2000; Reference Mair, Nienow, Willis and SharpMair and others, 2001). These motion events can be clearly distinguished from other common temporal variations in flow, such as diurnal or seasonal velocity changes. A water influx into the subglacial drainage system that is too large to be discharged without a major readjustment of the system has been suggested as a possible trigger for these events (Reference Humphrey, Raymond and HarrisonHumphrey and others, 1986; Reference Raymond, Benedict, Harrison, Echelmeyer and SturmRaymond and others, 1995; Reference Anderson, Fernald, Anderson and HumphreyAnderson and others, 1999; Reference Gudmundsson, Bassi, Vonmoos, Bauder, Fischer and FunkGudmundsson and others, 2000). The extra water input may result from various sources such as a strong rainfall event, an extended period of strong surface melting, or from release of water from storage such as marginal lakes. An overview of observations of interannual variations in glacier motion is given by Reference WillisWillis (1995).
A prime motive for investigating motion events is to understand the processes affecting and leading to a coupling between subglacial hydraulics and ice motion. Observations suggest that duration and amplitudes of motion events are similar for different glaciers (e.g. Reference WillisWillis, 1995; Reference Mair, Nienow, Willis and SharpMair and others, 2001; Reference Truffer, Echelmeyer and HarrisonTruffer and others, 2001). Both horizontal and vertical velocity components are affected, giving rise to anomalous surface velocities that can be a few times the mean surface velocities. On a number of occasions, the initial anomalous upward vertical ice displacement at the surface has been observed not to be equal to the subsequent anomalous subsidence and this has been interpreted in terms ofa net increase or decrease in the volume of basal cavities (Reference Iken, Röthlisberger, Flotron and HaeberliIken and others, 1983; Reference Humphrey, Raymond and HarrisonHumphrey and others, 1986; Reference SturmSturm, 1995).
Relating anomalous vertical displacement of ice at the surface to storage of water is difficult because spatio-temporal variations in horizontal flow velocities during a motion event affect the vertical strain-rate regime, which in turn affects surface velocities. The size of this contribution has previously been estimated in an indirect way from measurements of horizontal strain rates, by making assumptions about the relationship between horizontal and vertical strain. It has not been possible in previous studies to directly measure anomalous vertical strain over most of the ice thickness during a motion event. Vertical strain in the uppermost 7–15 m has, however, been measured with a high temporal resolution (Reference Raymond, Benedict, Harrison, Echelmeyer and SturmRaymond and others, 1995) using permanently installed strainmeters (Reference Harrison, Echelmeyer and EngelhardtHarrison and others, 1993).
The anomalous vertical speeds can be caused by temporal variations in vertical deformation of the ice column, perturbations in vertical movements of the basal ice, or a combination thereof. Formation of basal cavities will take place if the basal water pressure rises locally above the separation pressure, causing vertical movement of ice as the cavities grow in size. If the glacier sits on a deformable bed, changes in basal water pressure may lead to temporal and spatial basal motion variations and corresponding changes in vertical deformation of the ice column, without concomitant vertical movements of the basal ice.
In this paper, measurements of vertical strain-rate variation made in spring 1996 and 1997 on Unteraargletscher, Bernese Alps, Switzerland, are presented and analyzed. By coincidence, the measurement period in spring 1996 coincided with a motion event, making it possible to estimate directly the contribution of vertical strain to anomalous vertical surface speeds. Simultaneous measurements of surface velocities give a fairly complete picture of temporal changes in horizontal surface strain. During the motion event, the strain-rate regime was profoundly affected. Hence, the glacier motion did not correspond to a rigid-body movement. To further illustrate the unusual character of the strain-rate regime in the course of the motion event, the measurements from spring 1996 are contrasted with a similar set of measurements made in spring 1997 at the same location but during a time period of normal flow.
Previous Observations of Motion Events on Unteraargletscher
Motion events frequently take place on Unteraargletscher (Reference Iken, Röthlisberger, Flotron and HaeberliIken and others, 1983; Reference Gudmundsson, Bassi, Vonmoos, Bauder, Fischer and FunkGudmundsson and others, 2000). The first observations of these events were made by Reference FlotronFlotron (1979) using an automated camera. These displacement measurements were initiated in 1969 and continued until 1976. One of the most interesting aspects of the temporal evolution of the glacier motion was observations of anomalous vertical movements of the ice at the surface. After the average annual rate of upward vertical ice motion at the surface was subtracted, two different patterns of vertical motion could be identified. Over a period of several weeks during the active spring/summer period, a higher-than-average upward vertical ice motion was observed, which was followed by a corresponding lower-than-average vertical motion in late summer. The resulting “bulge” had an amplitude of around 60 cm. Superimposed on this general pattern of vertical movements were a number of short-term “surface uplift events”, each taking place over an interval of a few days. The anomalous vertical displacement was on the order of 10 cm and was accompanied by a sharp increase in horizontal surface speed by more than a factor of two. These measurements by Reference FlotronFlotron (1979) of distinctive and repetitive short-term velocity variations were the first measurements of what has since been realized to be a quite common feature of glacier motion.
Because the interval at which photographs were taken was comparable to the observed duration of the motion events, the data gave a somewhat smeared-out picture of the actual events. Theodolite measurements were later used to obtain more detailed information about the temporal velocity variation. One particularly well documented example of a motion event, with about a four-fold increase in horizontal velocity and an uplift of about 15 cm, was observed in June 1975 (Reference Iken, Röthlisberger, Flotron and HaeberliIken and others, 1983). The velocity pulse lasted for about 2 days, but the subsequent lowering was slow compared to the initial uplift and took place over several days.
Reference Iken, Röthlisberger, Flotron and HaeberliIken and others (1983) referred to these short-term changes in glacier flow as “uplift events”, but here the more general term “motion event” will be used. The “surface uplift” was detected through repeated surveying of stakes drilled a few meters into the ice. These measurements gave the motion of the material particles at the surface. Strictly speaking, the observational quantity was therefore not vertical surface motion (surface uplift) but the vertical positions of material particles at the surface at different times.
In their analysis, Reference Iken, Röthlisberger, Flotron and HaeberliIken and others (1983) carefully discussed a number of possible causes for the anomalous vertical motion of the ice particles at the surface, such as spatiotemporal variations in longitudinal and transverse strain rates, crevasse formation, swelling of veins at grain edges, volume change of subglacial sediments, and water storage at the bed. After having considered these alternative explanations, they concluded that a hydraulic-jack mechanism at the bed was the most likely explanation for the observed vertical and horizontal velocity variations.
The contribution of vertical stretching of the ice column to the anomalous vertical motion could not be observed directly, and had to be estimated indirectly from longitudinal strain rates calculated over distances of about seven mean ice thicknesses. Because the relation between depth-averaged strain rates and surface strain rates may be complex and even counter-intuitive (Reference Balise and RaymondBalise and Raymond, 1985; Reference BaliseBalise, 1987; Reference VonmoosVonmoos, 1999), direct measurements of vertical strain would have given more confidence in the estimated values of basal water storage.
Field Site and Methodology
Unteraargletscher is a temperate valley glacier. It is within the ablation zone of a small system of glaciers. The two main tributaries of Unteraargletscher are Lauteraar- and Finsteraargletscher. Unteraargletscher is around 7 km long, has an average slope of about 4°, and its maximal thickness in the confluence area is 370 m (Fig. 1). Ice thicknesses are known from radio-echo soundings (Reference Funk, Gudmundsson and HermannFunk and others, 1995). Descriptions of the general flow characteristics of the glacier, with a special emphasis on the confluence area, are found in Reference Gudmundsson, Iken and FunkGudmundsson and others (1997). Seismic soundings (Reference Knecht and SüsstrunkKnecht and Süsstrunk, 1952) suggest that Unteraargletscher is mostly underlain by a layer of unconsolidated material (Reference Röthlisberger and VögtliRöthlisberger and Vögtli, 1967; Reference Funk and RöthlisbergerFunk and Röthlisberger, 1989), but the thickness of this layer across the glaciated area is not known in detail.
Map of Unteraargletscher showing both surface (dashed contour lines) and bed (solid contour lines) topography. The contour interval is 50 m. A, B, C and Z indicate the locations (crosses) of the GPS measuring sites in spring 1996 referred to in the text.

GPS measurements
In spring 1996 and spring 1997, carrier-phase differential global positioning system (GPS) measurements were made over a period of a few weeks at four different locations on Unteraargletscher. In both spring 1996 and 1997, four GPS receivers were permanently installed on the glacier approximately along the central flowline. One receiver was located at the drilling site (B), and two were situated about 460 m and 700 m down- and up-glacier from the drilling site, respectively (A and C). In spring 1996 the fourth receiver was set up within the confluence area (Z), whereas in spring 1997 this receiver was positioned somewhat closer down-glacier towards the drilling site (D). The locations of the GPS receivers are shown in insets of Figures 1 and 5. The horizontal distance between the reference station and the rover receivers A–C was about 1 km, and the vertical height difference between the reference station and the rovers ranged from 200 to 260 m. All rovers were situated slightly to the south of the medial moraine on a debris-free section of the surface. They were attached to 6.5 m long aluminum poles drilled about 6 m into the ice.
Up to eight data-collection intervals, referred to as timer missions, were defined per day, with each mission lasting 30 min. Both the L1 and L2 carrier-phase signals were collected. The data were downloaded onto a portable computer every 3–4 days. Data processing was done using the Leica SKI GPS software (Version 2.2). Timer missions were scheduled according to satellite availability, with, on average, one mission every 3 hours. Each calculated position, therefore, represents a temporal average over the duration of the corresponding mission (30 min). Selected subsets of the data were later processed with the Bernese GPS Software using precise satellite ephemeris parameters (Reference Rothacher and MervartRothacher and Mervart, 1996; Reference MeinckMeinck, 1998). The difference in calculated coordinates using SKI 2.2 and the Bernese GPS Software turned out to be negligible.
Measurements of vertical strain
Vertical strain was measured in boreholes by observing the relative displacements of magnetic rings located at the bottom of the boreholes with respect to a reference mark fixed to the ice at the surface (Fig. 2). The boreholes were drilled with a hot-water drill, and one magnetic ring was installed at the bottom of each hole. The holes containing the magnetic rings were drilled to specific depths. At the surface, horizontal bars attached to two aluminum poles drilled 5 m into the ice served as individual reference marks for each of the holes. These reference marks moved with a velocity equal to that of the ice at the surface. The aluminum poles were frozen into the ice using a mixture of ice, water and table salt. The depths towards the magnetic rings were measured with a magnetic field sensor attached to a 300 m long high-precision measuring tape. All holes were located within a few meters of each other.
Vertical strain-rate variation with depth is measured by installing a magnetic ring at the bottom of a borehole. The magnetic ring is attached to the upper end of a ∼1 m long tube. Using a probe sensitive to changes in magnetic field, the relative distance between the ring and a reference mark at the surface of the glacier is determined.

The distance down the boreholes, from the reference mark at the surface down to the magnetic rings, was measured once or twice a day. The readings could be taken with a resolution of about 1 mm, but the overall accuracy of the measurements was, because of various factors (bending of the aluminum poles with time, tilting of the magnetic rings in the holes, etc.), only about 2.5 mm. Since the holes were filled with water, the measuring tape was always exposed to the same constant temperature during the measurements. Distance was measured positive downwards from the reference markers at the surface.
Temporal changes in the distance between the surface marker and the magnetic ring at the end of the borehole are evidently, in general, not caused by vertical strain alone, but by a combination of vertical extension/compression and surface-parallel shear. The relative importance of vertical strain as compared to horizontal shear was estimated by generating synthetic borehole-elongation time curves. These were calculated for a given velocity field and a given initial borehole tilt. The velocity field at the drilling site was calculated using the following approximation


where u and w are the horizontal and vertical components of the velocity field, respectively, u b the basal velocity, and h the mean ice thickness. The origin of the coordinate system is at the glacier surface with the x axis parallel to the mean surface and the z axis pointing upwards. It is assumed that the forward velocity component varies with depth as it does in a uniformly inclined slab. The assumption is justified by the fact that the geometry of the glacier at the drilling site is relatively simple (Reference Funk, Gudmundsson and HermannFunk and others, 1995), and by results obtained with a numerical three-dimensional flow model (Reference GudmundssonGudmundsson, 1999). The parameter c 1 was determined from the measured surface flow velocity, and the basal motion velocity u b from measurements of borehole tilt made at a nearby site (Reference Gudmundsson, Bauder, Lüthi, Fischer and FunkGudmundsson and others, 1999). The parameter c 2 was determined from measurements of longitudinal strain. In Equation (2), w = 0 at the bed (z = −h). This is a good approximation for site B where the slope of the bed is small (Fig. 1). The synthetic curves were calculated by a forward integration in time of Equations (1) and (2).
The Short-Term Motion Event in Spring 1996
During the measurement period in spring 1996 the glacier was covered with about 1–2 m of snow. The melting season had started a few weeks earlier and a network of supraglacial water channels had already formed. The snow cover was wetted throughout its thickness, and considerable melting took place during the day. On 1 May it started to snow, and there was > 1 m of snowfall during the night of 2 May. This fresh snow layer disappeared through melting within a few days.
Surface velocities
Measured surface velocities are shown in Figure 3, together with the locations of the GPS rovers. Data from the whole measurement period 27 April–15 May are depicted. Data at site A are only available for the time period 1–11 May. The symbols (cross, star, triangle and square for sites A, B, C and Z, respectively) stand for individual measurements of position or estimates of velocities. The curves are smooth cubic-spline interpolations of horizontal and vertical movements.
Vertical stake positions (a), horizontal speed (b) and vertical speed (c) in spring 1996 at four different locations at the surface as a function of time. The inset map (c) and Figure 1 show the locations of the measurement sites. In (a) a constant rate of vertical movement equal to 1.09 cm d−1 has been subtracted from all the curves. The origin of the ordinate in (a) is arbitrary. The vertical lines (long-short-short dashes, long dashes) show the timing of maximal horizontal speeds at sites B and C, respectively. The speeds are calculated from the slopes of smoothly interpolated displacement curves.

Figure 3a shows vertical material speeds, with reference to the mean altitude of each rover, over the whole measurement period, as a function of time, after the observed average vertical speed of 1.09 cm d−1 has been subtracted. The most conspicuous feature of Figure 3a is the increase in anomalous vertical surface speeds observed at sites B and C between 11 May and the end of the measurement period on 14 May. On 12 May, anomalous vertical displacements of about 7 and 13 cm were observed at sites B and C, respectively. For logistic reasons, measurements could not be continued beyond 14 May. At site C, maximum anomalous vertical displacement is reached at around 1500 h on 12 May, and at site B about 4 hours later. Where data are available, a close correlation exists between anomalous vertical surface motion with time at sites B and C and site A.
A close inspection of Figure 3a reveals a diurnal variation in the calculated vertical positions having an amplitude of about 1 cm. Analysis of these diurnal variations by Reference MeinckMeinck (1998) demonstrated that they are artifacts caused by tropospheric delays.
Temporal and spatial variations in horizontal surface speeds ( , where u and v are the two horizontal velocity components), shown in Figure 3b, follow a similar pattern to that of anomalous vertical surface motion. From 12 to 14 May a motion event is observed at sites B and C with up to four- to five-fold increases in horizontal speed. No similar speed-up is seen at site Z, and data are missing for this period at site A. A maximum horizontal speed of 32 cm d−1 is reached at site B at 1400 ± 1.5 h on 12 May. At site C a maximum horizontal speed of 29 cm d−1 is reached at 0700 ± 1.5 h, or about 7 hours earlier than at site B. Prior to the event, on 8 May, there is a marked increase in horizontal speed at both locations. The slow increase in horizontal speed at site Z, from about 8.2 cm d−1 to about 15 cm d−1, presumably reflects a gradual transition from winter to summer velocities at that location.
Anomalous vertical speeds are shown in Figure 3c. These are time derivatives of the curves in Figure 3a from which a constant rate of vertical movement equal to 1.09 cm d−1 has been subtracted. During the motion event, maximum anomalous vertical speeds of 15 and 7 cm d−1 are observed at sites B and C, respectively (Fig. 3c). Vertical speeds (w) become negative at 1600 h on 12 May at site C, but not until 0700 h on 13 May, or more than 1 day later at site B. The lowering at both sites B and C is presumably not finished at the end of the observation period. The increase in w with time seen on 13 May is too close to the end of the observational period to be well constrained.
Vertical-strain variation with depth
Figure 4 depicts temporal changes in the distance between two magnetic rings and the two corresponding reference markers at the surface. The magnetic rings were situated roughly 50 and 100 m below the surface, and are referred to as m50 and m100, respectively. They were installed in two separate boreholes located only a few meters from the GPS receiver at site B.
Distance down to two magnetic rings, located about 50 and 100 m below the glacier surface, as a function of time. The left ordinate gives the distance along the borehole down to the magnetic ring labeled m50 with respect to a reference mark at the surface. The right ordinate denotes the corresponding distance for the magnetic ring m100 situated in a nearby borehole. Two reference marks at the surface, which both move with the ice at the surface, serve as origins for the distance axis (the right and the left ordinates). Increasing values indicate that the distances along the two boreholes from the magnetic rings to the corresponding reference markers at the surface increase with time. The average vertical speeds, as determined from the slopes of the dot-dashed lines shown, are listed in Table 1.

The contribution of vertical deformation of the ice column was estimated by calculating synthetic borehole-elongation time curves for a given velocity field and a given initial borehole profile as described above. For the depth range in question (0–100 m) essentially all of the length changes shown in Figure 4 are due to vertical extension or compression. This result did not depend on the exact values used for the initial tilt of the borehole or the parameters c 1 and u b in Equation (1), nor on the assumption of constant vertical strain. Most of the shearing motion takes place below the uppermost 100 m, and corrections for the effects of shear on the elongation changes of the holes can be neglected.
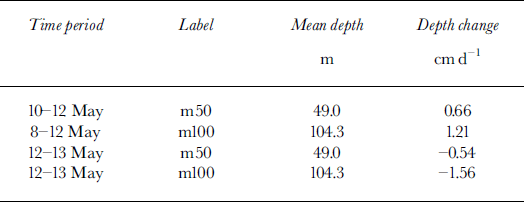
The most noteworthy feature of Figure 4 is the temporal reversal in the direction of depth change observed on 12 May for both m50 and m100. Prior to the timing of this strain-rate reversal, the depths of m50 and m100 increase with time at an average rate of 0.66 cm d−1 for m50, and 1.21 cm d−1 for m100 (dot-dashed curves in Fig. 4). After the strain-rate reversal on 12 May, the depths decrease with time with an average rate of −0.54 cm d−1 for m50, and −1.96 cm d−1 for m100. This reversal in vertical strain coincided, within the temporal resolution of the vertical strain-rate measurements, with the maximum in horizontal and vertical surface speeds. Thus, vertical strain rates are positive (extension) in the upper 100 m of the glacier at site B leading up to the maximum velocity, and become negative (compression) after the maximum in surface velocities is reached. Table 1 lists the average rate of changes in borehole depths for the two boreholes prior to and after the strain-rate reversal.
Changes in borehole depths at site B in spring 1996
Timing
Around 8 May, a significant increase in both horizontal and vertical velocities is observed at sites A–C, or 3 days prior to the much faster rate of increase starting on 10 May. Over this 3 day period, vertical velocities remained more or less the same (Fig. 3c), while horizontal speed gradually increased (Fig. 3b). The data suggest that the large increase in flow velocities on 11 May started a few hours earlier at site C than at site B, but a data gap at site C makes it difficult to make a definite statement. However, maximum horizontal speed is undoubtedly reached about 6 hours earlier at site C than at site B. This suggests a propagation velocity of about 0.11 km h−1 The exact timing of the maximum of both anomalous vertical material displacement and anomalous vertical material speed at the surface depends somewhat on the calculated average value of these quantities. Nevertheless, it is certain that the maximum anomalous vertical material displacement at the surface was reached earlier at site C than at site B, and a time difference of 6 hours is considered the most likely estimate.
The maximum of both the horizontal and the vertical components of the material surface velocities at both sites B and C is, within the time resolution of the data, reached at the same time. The possibility that the maximum in vertical speed was reached a few hours earlier than the maximum in horizontal speed can, however, not be ruled out. As expected, the maximum anomalous vertical material displacement at the surface is reached after the maxima in horizontal and vertical speeds.
Surface Velocities and Vertical Strain-Rate Variation in Spring 1997
The measurements of the vertical velocity variation with depth coincided with a motion event and therefore reflect, in this respect, an anomalous situation. A similar dataset was collected at the same site in spring 1997.
During the observation period in April 1997, surface melting took place, but not to the extent that supraglacial streams could form. The snow cover became wetted throughout only towards the end of the month.
Surface velocities
Figure 5 shows the results from GPS measurements of vertical movements and surface velocities during the time period 5–27 April, 1997. Sites A–C are located within a few tens of meters of those of the previous year. Limited data are available from site D, and no measurements were carried out at site Z. Sites A–D are shown in the inset in Figure 5c.
Vertical movements (a), horizontal speed (b) and vertical speed (c), in spring 1997 at four different locations as a function of time. In (a) a constant rate of vertical movement equal to 1.09 cm−1 has been subtracted from all the curves. The origin of the ordinate of (a) is arbitrary.

Relatively constant vertical surface speeds of 1–2 cm d−1 are observed at sites A–C. The horizontal surface speed increases somewhat from about 4.6 cm d−1 to 5.1 cm d−1 at site A, and from 5.5 cm d−1 to 6.4 cm d at site B. At site C an increase of only 0.1 cm d−1 takes place during the course of these measurements. At all three sites, velocities are significantly smaller than in late April and early May of 1996.
Vertical strain
Vertical movements of magnetic rings with respect to the surface at approximately 50, 100, 140 and 200 m depths were measured during the second half of April 1997 at site B. Corresponding to their approximate depth below the surface, the magnetic rings are referred to as m50, m100, m140 and m200. For every magnetic ring, a roughly linear increase in distance to the surface over time was observed (Fig. 6a). Although, plotted as functions of time, the data points in Figure 6a do not fall exactly on straight lines, there are, nevertheless, clearly no major temporal changes in the vertical strain-rate regime during the observation period in line with the strain-rate reversal of spring 1996.
(a) Temporal changes in distance (measured along boreholes ) from the surface towards four magnetic rings at depths of 51.7 (m50), 99.8 (m100), 140.3 (m140), and 194.4 m (m200) in spring 1997. The origin of the ordinate is arbitrary, (b) Relative vertical speed with respect to the surface as a function of depth. Crosses denote vertical speed estimates based on the data in (a).The data point to the lower right is the difference between measured vertical motion of the ice at the surface and estimated vertical motion of the basal ice assuming no formation of basal cavities.

Discussion
If the size and shape of the material velocity anomaly do not change with time, its spatial scale can be estimated from the propagation velocity and the time it took it to pass by the measurement site. Because the motion event observed in 1996 took place over a time period of about 2.5 days (ignoring the premonitory much smaller velocity increase prior to the main speed-up) and propagated with a velocity of about 0.1 km h−1, it had a spatial scale of about 6 km. This seems too large given that no increase in velocity was observed at site Z, a distance of only 2 km up-glacier from site C, although the wave would have traveled this distance within 1 day. This suggests that the motion event was initiated from a location well below the confluence area, and that it did not have the form of a shape-conserving traveling wave.
Large changes in vertical and horizontal strain-rate regime were associated with the motion event in spring 1996. This can be seen from both measurements of horizontal speeds at sites A–C, and from the vertical strain-rate measurements at site B. Figure 7 summarizes these findings. Prior to the short-term speed-up and until about the time that the maximum in horizontal speed is reached at site C, horizontal strain rates are negative (compression) over both the distances AB and BC. During this time, speeds increase in an up-glacier direction from A to B to C  . From around 0400 h on 12 May until the end of the measurement period at 1300 h on 13 May,
  is larger than
  , and horizontal strain rates therefore positive (extension) over the distance BC. Because of the limited temporal resolution of the measurements, the timing of the reversal in vertical strain rates
  cannot be determined as precisely as the timing of the reversal in longitudinal surface strain rates. In particular, it cannot be determined from the data if the reversal in vertical strain rate coincided in time with the reversal in longitudinal strain rates at 0400 h or with the maximum vertical displacement at the surface at site B at 1900 h on 12 May.
Temporal changes in horizontal and vertical strain-rate regime during the motion event on Unteraargletscher in spring1996. (a) From 30 April until about 0400 h on 12 May, average longitudinal strain rates along the surface are negative (compression) and vertical strain rates in the uppermost 100 m positive (extension). (b) Subsequently, there is a reversal in strain-rate regime; longitudinal strain rates become positive and vertical strain rates negative.

As compared to spring 1997 (Fig. 6b; Table 1), positive vertical strain rates in the uppermost 100 m are anomalously large during the time period 9–12 May 1996. The mean vertical velocity for m100 was 1.21 cm d−1 for this time period (Table 1) or about twice as large as the measured vertical velocity for m100 in spring 1997 which was 0.68 cm d−1. For m50 the corresponding values are 0.66 cm d−1 and 0.26 cm d−1 for the years 1996 and 1997, respectively. Assuming linear velocity variation with depth, vertical extension of the ice column accounts for roughly 3 cm d−1 of the measured vertical rate of displacement of surface ice. This is comparable to the rate of vertical motion measured at the surface from 9 to 11 May, but considerably smaller than the rate observed on 12 May which, for most of that day, was >10 cm d−1. Because the bed slope is small (about 0.5°), the vertical displacement of the basal ice during the motion event in the absence of cavitation is small as compared to the observed vertical ice motion at the surface and can effectively be ignored. To the total vertical motion of 13 cm that took place on 12 May, vertical extension may have contributed roughly 20%. The remaining part, about 10 cm, may be due to cavity formation. The estimate of the magnitude of cavity formation, however, depends critically on the assumption of a constant strain rate throughout the glacier thickness. If strain rates increased towards the glacier bed, which may be considered likely given the fact that the flow anomaly presumably originated from the bed, the contribution of vertical strain to the vertical motion at the surface may have been considerably larger than 20%.
Figure 8 shows both average longitudinal surface strain rates over the distances AB and BC, as well as average vertical strain rates at site B. The vertical strain rates are derived from the slopes of the interpolated curves seen in Figure 4. Leading up to the observed maximum horizontal velocities, longitudinal strain rates become increasingly negative with time over both the distances AB and BC. A negative value of about −0.03 a−1 is reached prior to the strain-rate reversal. Based on the displacements of m50 and m100 a considerably larger vertical extension of about 0.045 a−1 is observed over the same period of time. After the strain-rate reversal, the discrepancy between the estimates of average longitudinal strain rates and vertical strain rates is even larger. Vertical strain rates are presumably not constant with depth following the strain-rate reversal. This fact brings out the uncertainties involved with the estimate of the amount of basal cavitation, given above. The average strain rates in the uppermost 50 and 100 m are around −0.043 a−1 and −0.055 a−1, respectively.
Average longitudinal strain rates along the surface over the distances AB and BC, and average vertical strain rates in the upper 50 and 100 m of the glacier thickness. Measurements of vertical strain rates are available for a much shorter period of time than are measurements of longitudinal strain rates.

The data in Figure 8 allow a comparison to be made between observed horizontal and vertical strain rates. The significant difference between observed average longitudinal and average vertical strain rates seen in this figure shows that accurately estimating vertical strain from horizontal strain, attempted in studies of glacier flow, can be difficult.
Figure 6b shows vertical speeds as a function of depth at site B. These vertical speeds are shown with respect to a coordinate system having its origin at the glacier surface and moving with the ice particles at the surface. Positive velocities denote an increase in vertical distance with respect to the surface with time, that is extension. The vertical speeds shown in Figure 6b were calculated from linear least-squares approximations to the data points seen in Figure 6a, and corrected for borehole elongation due to shearing. The contribution of shearing to the borehole elongation was estimated by calculating synthetic borehole-elongation time curves as described above. This correction is relatively small for all the data points in Figure 6b.
If the basal ice does not lose contact with the glacier bed at any time, the vertical motion of the basal ice is given by the bed slope and the rate of (horizontal) forward basal motion. The bed slope at site B is much smaller than the surface slope, or only about 0.5° (Fig. 1). Reference Gudmundsson, Bauder, Lüthi, Fischer and FunkGudmundsson and others (1999) estimate that the basal motion accounts for about 50% of the total forward motion at site B. Together with the measured forward velocities at site B in spring 1997, this gives an expected vertical basal motion of 0.03 ± 0.01 cm d−1 in the absence of cavitation. This is a rather small value compared to the 1.1 ± 0.1 cm d−1 vertical ice motion at the surface. The difference in vertical surface and basal ice motion is equal to the integrated vertical stretching of the ice through the thickness. Measured with respect to the moving ice particles at the surface, the vertical motion of the basal ice is equal to the difference w surf – w bed. If observed vertical motion of the basal ice with respect to the surface differs significantly from this value, the vertical extent of basal cavities might be changing with time.
No measurements of vertical ice motion of the basal layer with respect to the surface could be made. The lowermost measurement was performed about 50 m above the bed. However, by extrapolating the measured vertical velocity profile downwards toward the bed, and comparing with the difference w surf – wbed, one can estimate the likely rate of basal cavity formation.
The data points in Figure 6b were fitted with polynomial curves of different degrees using weighted least squares. Standard statistical tests show that the variation of vertical speed with depth is not linear. A polynomial curve of degree two or higher is needed for a reasonable fit. A second-degree polynomial fit is shown in the figure. Interestingly, based on this fit, strain rates decrease with depth, with  close to the surface and about
  close to the bed.
The difference between measured vertical surface motion and estimated vertical basal ice motion in the absence of basal cavitation is shown as a further data point at 260 m depth in Figure 6b. This difference is a reasonable visual extrapolation of the borehole data. There is thus no need to resort to bed separation to explain the vertical movements measured in spring 1997.
Conclusions and Outlook
The motion event followed a period of intense surface melting in early spring at a time when the drainage system was not well developed. It was not triggered by strong rainfall like some previously observed motion events on Unteraargletscher (Reference Gudmundsson, Bassi, Vonmoos, Bauder, Fischer and FunkGudmundsson and others, 2000). Although the source and the magnitude of the extra water input were different, in its duration and amplitude the event was very similar to these other motion events. The defining aspect of motion events, both the velocity increase and duration, is therefore insensitive to the volume of the extra water input or the state of the drainage system. This suggests that it is the rate of extra water input in relation to the capacity of the drainage system, rather than the volume of water alone, which determines the possibility of a motion event taking place. A triggering through a combination of high subglacial pressures and a relatively large storage of water as compared to the capacity of the drainage system seems possible.
Strong temporal changes in the strain-rate regime accompanied the motion event. At first, longitudinal strain rates were compressive, vertical strain rates extensile, and anomalous vertical motion of ice at the surface directed upwards. This was followed by a period of extensile longitudinal strain rates, vertical compression and downward surface ice movement. Vertical strain contributed to presumably more than 20% of the total vertical ice displacement at the surface, with the remaining part possibly being related to basal cavitation. An exact estimate of the relative importance of vertical strain and water storage at the bed is, however, difficult to obtain because measurements of vertical strain did not cover the whole glacier thickness of 260 m, but only the uppermost 100 m, and because of the uncertainties involved in calculating vertical strain-rate variations associated with short-scale basal perturbations.
The anomalous character of the vertical strain-rate distribution during the motion event becomes even more evident when the data from spring 1996 are compared to a similar set of data collected at the same location 1 year later. During the observation period in spring 1997 no motion event was observed. Vertical strain rates were measured to be positive (extension) over the uppermost 200 m, and presumably were so throughout the whole glacier thickness. Vertical velocities as measured in spring 1997 did not vary linearly with depth. The data suggest an increase in vertical strain going from bed to the surface. In spring 1997, vertical strain rates were equal to about 0.027 a−1 at the surface where they were largest. Much larger strain rates, or around 0.05 a−1, were observed during the motion event, demonstrating further the degree of internal ice deformation associated with the event.
Acknowledgements
The data presented and discussed in this work were acquired during the 1996 and 1997 field seasons. I would like to thank all those who helped with collecting the data during this time period, especially A. Bauder, U. H. Fischer, J. Luthiger, M. Lüthi, B. Nedela and M. Funk. Comments by U. H. Fischer, P. Jansson, M. Nolan, R. C. A. Hindmarsh, D.Vaughan and C. F. Raymond resulted in substantial improvements to the manuscript. In particular, I would like to thank the editor, W. D. Harrison, for numerous valuable comments and his interest in this work. This work was partially supported by the Swiss National Science Foundation grant No. 2100-407095.96/1.



