


Introduction
Characterizing the nature and evolution of economic policy is a central objective of modern political economy. A significant challenge in this regard is that economic policy is a multi‐faceted concept, the dimensions of which may be encapsulated in large bodies of text which can be hard to reduce to econometric data. To tackle this challenge, this paper takes advantage of the accessibility of two important archival sources on economic policy from the United Kingdom and uses unsupervised learning techniques for textual data to provide a quantitative analysis of evolutions in their content over the past four decades.
The first source is the set of all Command Papers filed by the British executive with Parliament between 1983 and mid‐2021. These are official documents used by executives to present policy initiatives and to summarize the activities of government departments. Command Papers have been described by the National Archives (2022) as ‘[providing] a continuous record of government thinking since the mid‐nineteenth century’ and have been widely used by historians as records of governments’ policy approaches (e.g., Parker, Reference Parker2009). The second source is the set of all minutes of cabinet meetings between 1983 and 1997 – the latest date by which they have been declassified at the time of writing. These minutes serve as a guide for action for ministers and the civil service after each cabinet meeting. They, too, have received attention in the historical literature, but have not yet been analysed using text‐as‐data methods. A major advantage of both types of documents when compared to other forms of discourse related to policy is that they constitute the policy content seen by ministers in their day‐to‐day work.Footnote 1 To further illustrate the robustness of the conclusions emerging from this text‐as‐data analysis, I validate them by using a more traditional econometric analysis of detailed budgetary data.
The analysis shows that the economic policy agenda of the British executive has been dominated, in both cabinet minutes and Command Papers, by a relatively limited set of concerns relating to public finance, economic competitiveness, and managing the public services. The analysis also indicates substantial changes over time in the approaches taken regarding these policy areas. Confirming arguments put forward by authors such as Schmidt and Woll (Reference Schmidt, Woll, Schmidt and Thatcher2013) or Faucher‐King and Le Galès (Reference Faucher‐King and Le Galès2010), a ‘liberalization’ era prevalent in the first part of the observation period can be distinguished from a ‘public service’ era, arising in the 1990s, in which policy became focused on the reorganization of public services to make them more customer‐oriented. This was in its turn supplanted by the rise of a policy focus on government support for particular sectors – often knowledge‐intensive ones – arising after the late 2000s and becoming dominant in the 2010s. While an emerging stream of academic contributions has either advocated for, or noted the emergence of, this new industrial policy approach (Chang & Andreoni, Reference Chang and Andreoni2020; Cherif & Hasanov, Reference Cherif and Hasanov2019; Mazzucato, Reference Mazzucato2015), rigorous quantitative evidence for its occurrence has so far been lacking and its identification is one of the novel contributions made here. The analysis also shows that these evolutions cannot be easily connected to changes in government but do parallel shifts in the frequency of references to employers, consumers and businesses in the corpus.
Theoretical discussion
Jones and Baumgartner (Reference Jones and Baumgartner2012) define the executive's policy agenda as the focus of its organizational attention at a given moment. A natural first question is what topics may have been present on the agenda in this case. The political economy literature has discussed a wide variety of aspects related to economic policy, which could be featured in the documents. Some theories, for example, focus on processes which vary over the long run and deal with the supply side of the economy – the manner in which the productive process is organized. These approaches include the highly influential institutionalist tradition as well as the varieties‐of‐capitalism literature. Other approaches, such as Baccaro and Pontusson's (Reference Baccaro and Pontusson2016) growth models, examine long‐run variation on the demand side, focusing on topics such as debt, wages, consumption or exports. Aspects related to the supply side, but at a smaller scale and on shorter time horizons, have also received attention in the literature, both in terms of general patterns (Boix, Reference Boix1997a, Reference Boix1997b; and see also the review by Potrafke, Reference Potrafke2017), but also in terms of case studies of particular industrial sectors or public services. Another group of issues, related to shorter‐term variation on the demand side, focusing on governments’ strategic use of monetary and fiscal policy, has also been widely studied (e.g., Franzese, Reference Franzese2002). While it should be obvious that all aspects, highlighted above, are relevant for understanding economic policy, the extent to which topics related to either may be dealt with directly by executives, needs examining before evaluating over‐time evolutions.
The main research question deals with changes over time in the economic policy content. The political economy literature provides relatively limited guidance on expected evolutions over the time frames analysed here, especially towards the end of the observation period. Institutions‐focused approaches could suggest substantial stability over the past few decades, arising from the persistence of the institutional features of the British political system and of the United Kingdom's liberal market economy. On the same note, literature analysing the shift from the post‐War consensus to the post‐industrial era, while not disallowing variation in economic approaches within the latter period, also gives limited guidance on what form that variation may take (Baccaro & Pontusson, Reference Baccaro and Pontusson2016; Hallerberg, Reference Hallerberg2004; Iversen & Soskice, Reference Iversen and Soskice2019; Iversen & Wren, Reference Iversen and Wren1998). Much of this literature uses equilibrium‐based rational choice models that find it hard to accommodate change in the absence of exogenous shocks. Changes in government are one obvious source of potentially exogenous shocks – Jones and Baumgartner (Reference Jones and Baumgartner2012) term this elections‐driven change hypothesis the ‘standard model’ – but the evidence for substantial policy change arising as a result of government turnover in broad cross‐country settings is quite weak (Potrafke, Reference Potrafke2017).
By contrast, separate literature focusing on the study of governments' policy agendas has provided theoretical arguments for changes in policy focus in the absence of major exogenous shocks (see summary in Jones & Baumgartner, Reference Jones and Baumgartner2012; True et al,. Reference True, Jones, Baumgartner and Sabatier2019) and has identified various policy changes in the United Kingdom during our observation period using evidence from budgetary data (John & Margetts, Reference John and Margetts2003), legislative output (John & Bevan, Reference John and Bevan2012) or legislative agenda speeches (John & Jennings, Reference John and Jennings2010). According to this theoretical approach, policy systems can display nonlinear dynamics in which long periods of stability or gradual evolution can be interrupted by significant and relatively rapid changes arising from the accumulation of tensions between various components of the system. Elements that favour stability include the domination of policy areas by small groups of specialized actors such as bureaucrats; as well as the limited ability of political systems to process multiple policy issues concurrently, arising from bounded rationality and the resultant limits on the extent of the agenda space (Jones & Baumgartner, Reference Jones and Baumgartner2012). Conversely, increased mobilization of groups not normally involved in the policy process can lead to particular issues rising on the public agenda. This can lead to policy systems exhibiting positive‐feedback dynamics in which small changes in the objective conditions trigger large policy effects. Building on this theoretical framework, several works have identified policy punctuations taking place in the post‐1980 period in the United Kingdom. Using evidence from the Queen's Speech, John and Jennings (Reference John and Jennings2010) identify the year 1991 as one of the two major turning points in the United Kingdom policy agenda between 1945 and 2005, which they link to a shift from economic stabilization and the Cold War to an increasingly heterogenous mix of policy areas, without analysing the substantive details. Looking at legislative output, John and Bevan (Reference John and Bevan2012) also identify several important punctuations taking place in the period up to 2005, in a variety of policy areas.
The theoretical claims and empirical results from the policy agendas literature lead to several outstanding issues. First, a more in‐depth examination, combining quantitative approaches with qualitative insights would be necessary to evaluate the substance of any policy evolutions that may be identified (John & Bevan, Reference John and Bevan2012). Following from that, it would be useful to examine whether changes in the policy agenda suggest coherent and substantively relevant patterns, such as particular policy periods or eras that may have been suggested in the literature or in the public debate. Third, it would be useful to examine evolutions in the very recent period for which relatively limited literature exists.
Some authors within the political economy tradition have made substantive claims regarding the nature of policy evolutions in this era, which can be tested using our data. Schmidt and Woll (Reference Schmidt, Woll, Schmidt and Thatcher2013), for example, see a distinction between 1980s liberalization attempts, which were predicated on rolling back the state, and the rise in the 1990s of efforts to coopt the power of the state towards implementing liberal economic ideals (see also Faucher‐King & Le Galès, Reference Faucher‐King and Le Galès2010; Dunleavy et al., Reference Dunleavy, Margetts, Bastow and Tinkler2006). Going further, an emerging and influential strand of the literature from the past decade has advocated for the development of various market‐supporting interventionist strategies that run counter to many of the core precepts of the liberalization era. Rodrik (Reference Rodrik2004) and Mazzucato (Reference Mazzucato2015, Reference Mazzucato2018) are highly cited arguments for a renewed attention to industrial policy as a solution to some of the maladies of liberal capitalism and to ‘wicked problems’ such as climate change (see also the summary in Cherif & Hasanov, Reference Cherif and Hasanov2019). Chang and Andreoni (Reference Chang and Andreoni2020) note that industrial policy is now ‘back in fashion, both in academia, but also, more importantly, in the real world’. Similarly, some influential commentators (see Stephens, Reference Stephens2021, as an example) have argued that in the 2010s British policymakers have abandoned the liberalizing approach of the post‐1980 era and have shifted to an activist, even interventionist, economic policy. While convincing, these arguments have so far received only qualitative illustrations. The text‐as‐data methodology employed here aims to provide a quantitative analysis of primary evidence regarding this debate.
Data and methods
Data sources
Operationalizing the theoretical concepts related to economic policy discussed in the previous section is challenging, as many aspects related to them are not amenable to quantitative measurement. One approach, commonly used by historians, is to rely on the policy‐related textual content that emerges from the day‐to‐day work of governments, including public and private discourse as well as official documents. The United Kingdom is particularly suited for using such documentary evidence, as important aspects of the policy‐making process are recorded in a standardized manner. Since at least the mid‐nineteenth century, British governments have been required to file with Parliament Command Papers, which present various aspects of the policy‐making process. The most widely known of these are White Papers that provide context and justification for major policy initiatives and may accompany important bills. Green Papers present policy proposals and solicit public comments. Other, more generic, policy papers present and justify various aspects of the government's approach. Government bodies also submit annual reports on their activities, and independent committees of inquiry submit the results of their work. Command Papers are generally written by officials in government departments and are often signed by the cabinet minister responsible. Online Appendix 1 presents several examples of better known Command Papers from our sample. Governments also submit all international treaties as Command Papers, but as these have a highly legalistic nature, they have been filtered out of the sample. Between 1983 and mid‐2021, governments have submitted 4366 Command Papers. excluding international treaties.
The use of documents discussing policy as indicators of the policy approaches actually enacted can be justified in several ways in our case. The policy agendas literature has shown that the discourse contained in a single document outlining policy priorities – the Speech from the Throne – has substantial predictive power for legislation actually enacted (Jennings et al., Reference Jennings, Bevan and John2011). The Command Papers corpus used here is much larger and contains documents that carry substantial legal weight – for example, yearly reports from government bodies, independent reports and consultation results. Second, results from the public Command Papers corpus will be compared for part of the observation period to results from a corpus of confidential cabinet minutes, which have direct policy relevance as they serve as a guide for action for top civil servants. Moreover, in this confidential setting, many of the factors that may lead to a divergence between policy and public discourse would be attenuated. Third, the results are validated against spending data, which is a direct indicator of policy priorities.
Records of cabinet meetings, which are generally secret in most political systems, would represent an even more direct piece of evidence regarding the executive's policy work. The United Kingdom is an example of relative transparency in this regard, as relatively recent records of cabinet debates have been declassified. At the time of writing, minutes of cabinet meetings up to December 1997 are publicly available. The 30–40 cabinet meetings taking place each year are an opportunity for cabinet ministers to come together, be informed of important policy decisions, report on departmental business and participate in debates (Cabinet Manual, 2011, 4.12–4.30, Popa, Reference Popa2022, Seldon & Meakin, Reference Seldon and Meakin2016). The meetings provide crucial evidence on the executive's policy approaches, as they present the arguments and logic that went into policy decisions, together with the affected parties in a manner that would rarely be heard in public and they provide a picture of the government's private agenda as seen by the ministers (Cabinet Manual, 2011, 4.30).
Only the domestic affairs portion of the cabinet minutes has been included in the analysis to parallel the Command Papers sample. Each weekly file is organized by the writer (the cabinet secretary) by discussion item – for example, ‘Council tax’ or ‘Transparency in monetary policy’. Each item contains a summary of the presentation or debate and its conclusions. At the time when these documents were written, there was an expectation of 30 years of confidentiality, but a gradual reduction towards 20 years began in 2001. Each such discussion item will form a unit of analysis for the topic model, leading to a corpus with 2034 documents.
It would also be instructive to examine whether conclusions emerging from the two sets of documents, which contain discourse related to policy rather than policy outcomes, are replicated using a direct quantitative indicator of policy priorities, namely budgetary allocations. Detailed spending data, using a common international standardFootnote 2 is available only after 1995 in the United Kingdom. These data record yearly spending in 70 budgetary categories, grouped into 10 larger scale items. ( e.g., ‘Social protection’, comprising ‘Sickness and disability’, ‘Unemployment’, ‘Old age’, etc. – see the complete classification in online Appendix 1). While these detailed data are not available before 1995, I have reconstructed time series for several theoretically relevant categories using printed data from a Command Paper (Cm. 3901, table 3.2).
Text‐as‐data methods
Both textual corpora have been processed using the Quanteda R package (Benoit et al., Reference Benoit, Watanabe, Wang, Nulty, Obeng, Müller and Matsuo2018) and a set of commonly used procedures, detailed below. Denny and Spirling (Reference Denny and Spirling2018) show that the initial processing steps can affect the conclusions emerging from unsupervised methods, so a series of robustness checks on the most important choices are presented in online Appendix 2. Command Papers have been trimmed at 100,000 characters (approximately 20,000 words), and the mean document length is 79,163 characters (approximately 16,000 words, standard deviation approximately 6200 words).Footnote 3 The average document length in the cabinet minutes corpus is 450 words. Punctuation and a standard set of common words have been removed, and the texts have been tokenized at the level of the word. The information in each corpus was recorded for analysis as a document‐feature matrix that counts word frequencies by document. As commonly done, the long tail of words that appear in less than 0.5 percent of the documents was removed, which improves estimation performance and interpretation, as it filters out words which are unlikely to lead to meaningful topics.Footnote 4
The structural topic model (STM) approach (see Roberts et al., Reference Roberts, Stewart, Tingley, Lucas, Leder‐Luis, Gadarian, Albertson and Rand2014, Reference Roberts, Stewart and Tingley2019, for a full presentation) is a statistical technique that seeks to identify both the topics emerging from a collection of documents, as would be the case in the traditional topic modelling approach, as well as their relations to covariates. Intuitively, topics are defined as clusters of words which are likely to co‐occur in a document. Each document is assumed to be a mixture of topics, with some more prevalent than others. Topics can be characterized by lists of representative words, calculated through several algorithms, but also by their most representative documents, which can be consulted to gain an in‐depth understanding of the subject matter. The identified topics can be used to test hypotheses relating to the content of debates, while the relations to the covariates can be used to test hypotheses relating to the evolution of the content over time.
There is no generally accepted criterion for the number of topics to be generated, and there is not a right amount of topics for any problem (Grimmer & Stewart, Reference Grimmer and Stewart2013), with a trade‐off between brevity and comprehensiveness always present. Roberts et al. (Reference Roberts, Stewart and Tingley2019) recommend anywhere between 5 and 50 topics for corpora the size of ours. The measure of semantic coherence developed by Mimno et al. (Reference Mimno, Wallach, Talley, Leenders and McCallum2011) has been shown experimentally to predict expert human judgments of optimal topic numbers, and will therefore be used to guide model selection. This measure reaches a maximum for K = 20 (Table A.2.2 in online Appendix 2) in the Command Papers sample, and this number of topics will be used for the main results. As a robustness check, however, results using K = 15 and K = 25 are also presented in online Appendix 2, with little change to the substantive conclusions.
Another important concern is the validity of the substantive characterizations of the topics (Grimmer & Stewart, Reference Grimmer and Stewart2013). Boussalis and Coan (Reference Boussalis and Coan2016) propose several approaches to testing the validity of topic models, two of which have been employed here. I first tested the concurrent validity of the model by using two expert coders to match a sample of 100 Command Paper documents to the topic perceived by them as most prevalent (see Section 2.8 in online Appendix 2). The accuracy measures we obtained (64 percent match with the first topic selected by the model, and 80 percent for the first or second topic) are similar to those in Boussalis and Coan and are very encouraging for the validity of the model. Additionally, I examined connections between topics to evaluate the semantic validity of the model, with encouraging results as well. (See Sections 2.7 and 4.4 in the online Appendix).
Results
Topics and evolutions in the Command Papers corpus
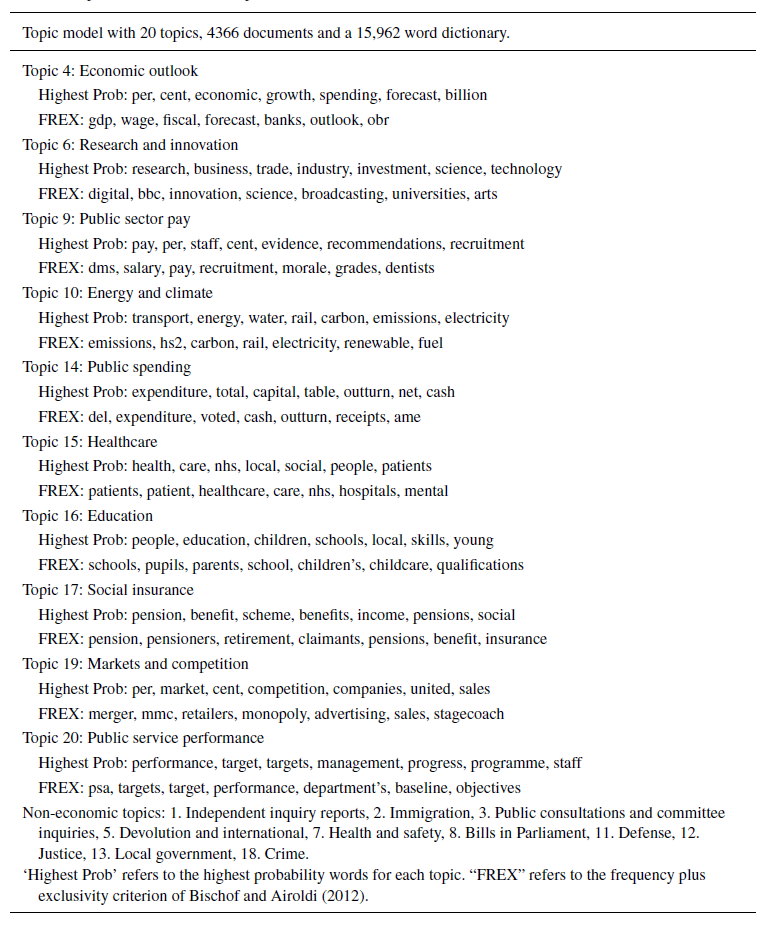
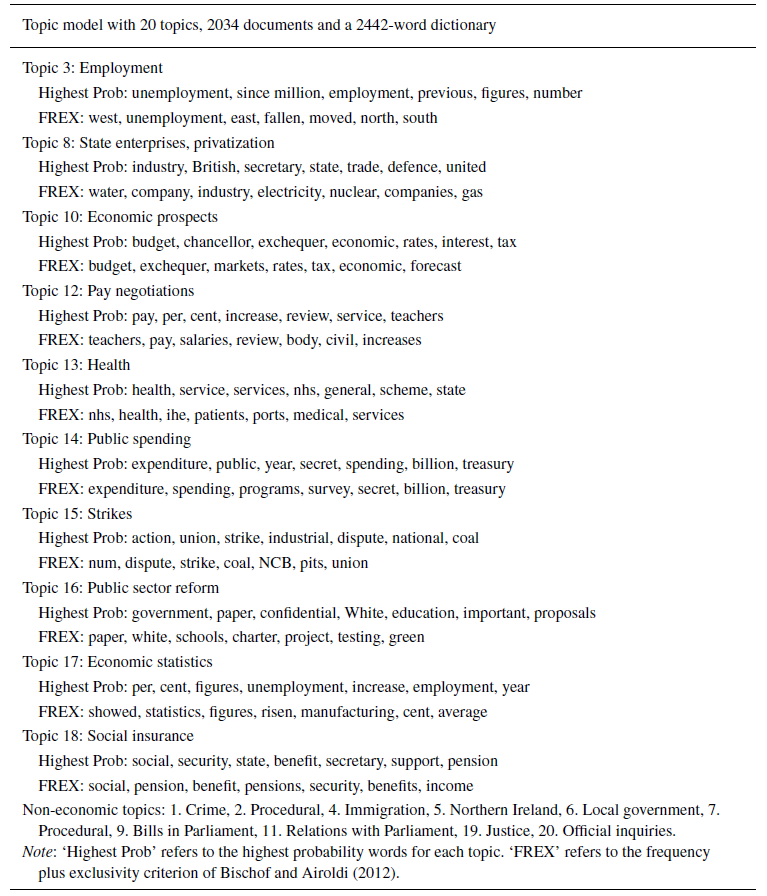
Table 1 summarizes the results of the topic model for the Command Papers corpus. Ten of the twenty topics are relevant to economic policy and are presented in more detail. (Note that the topics emerge in random order.) The most characteristic words according to two commonly used measures are presented for each topic. Online Appendix 2 presents these results in more detail, including broader characterizations of the topics and the documents identified as most representative for each by the STM algorithm. I have also labelled each topic with a descriptive title on the basis of the characteristic words and the most representative documents, with further clarifications and the two validity checks on the labels presented in online Appendix 2.
Topics in the Command Papers

The economic topics from Table 1 can be grouped into three policy areas. A first group deals with aspects of public finance (4: Economic outlook, 9: Public sector pay, 14: Public spending, 17: Social insurance). A second group deals with interactions with the private and public sectors, including through regulation (19: Markets and competition) and subsidizing research and development (6: Research and innovation, 10: Energy and climate). A third group of topics deals with the management of the public sector in which the ministers participate as de‐facto chief executives of the organizations providing public services (15: Healthcare, 16: Education; 20: Public sector performance). These topic modelling results provide a sense of what was present on the agenda of policymakers in this case but do not give any insights into whether the content related to either of the issues evolved over time.
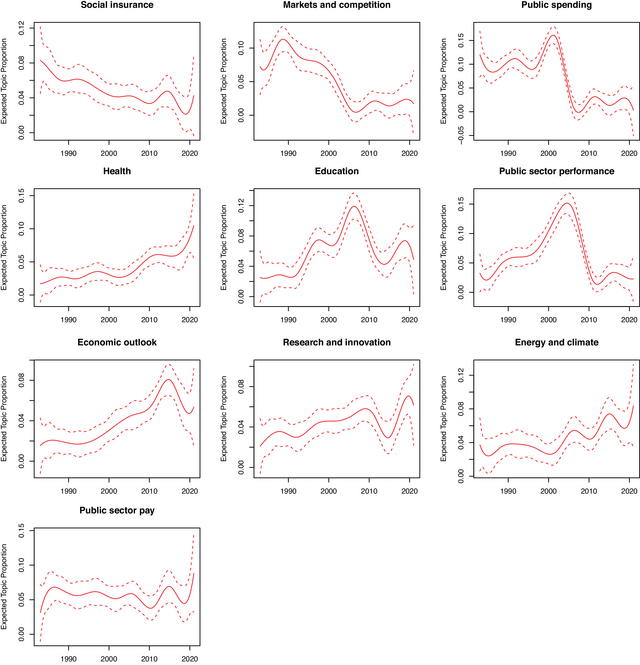
To test for changes over time, I have first followed the recommendations in Roberts et al. (Reference Roberts, Stewart and Tingley2019) and modelled time using a flexible 10‐degree polynomial, in Figure 1.Footnote 5 Doing this allows the data to speak for itself in terms of evolutions but does not allow for easy hypothesis testing, so I have also used the fitted values from these models to formally test for differences in topic prevalence close to the beginning (1985), middle (2005), and end (2020) of the observation period, together with 95 percent confidence intervals, in Figure 2. (Using slightly different points in time provides the same substantive conclusions).
Evolution in topic prevalence over time, Command Papers. [Colour figure can be viewed at wileyonlinelibrary.com]
Note: Top row presents topics with a downward trend; the middle row topics with a mix of behaviours; the third row topics with an upward trend; the bottom row topics with a constant trend. Autocorrelation tests are given in Section 2.6 in online Appendix 2.

Topic prevalence change 2005 versus 1985 (upper)and 2020 versus 1985 (lower).
Note: Figure presents estimates of topic prevalence change derived from models presented in Figure 1.
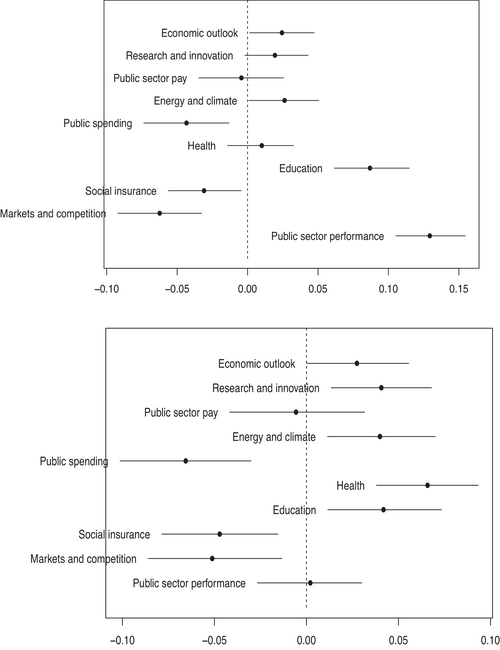
Both sets of models indicate the same conclusion – there is strong evidence for substantial change in topic prevalence over time. Figure 1 shows that, with the exception of the public sector pay topic, which tends to appear in recurrent yearly reports from various departments, all other topics have seen large changes over time, some increasing or decreasing their magnitude several times over. (Note that the total prevalence of the 10 economic strategy topics has remained approximately constant over time at around 50 percent.) Figure 2 shows that seven out of 10 topics showed significantly different prevalence in the middle period versus the early period and that nine out of 10 showed differences between the later part of the observation period and the early years. The differential evolution of topics illustrated in Figure 1, as well as the patterns identified in Figure 2, suggest three historical periods as discussed below.
Period I. In the first part of the observation period, the topics presented in the first row of Figure 1 ‐ public spending (14), markets and competition (19), and social insurance (17) – were relatively more prevalent. While gradual evolutions in the topics make it hard to establish thresholds for the historical periods, it is clear that the 1980s saw a high in the prevalence of these three topics, which declined in importance throughout the 1990s and 2000s.
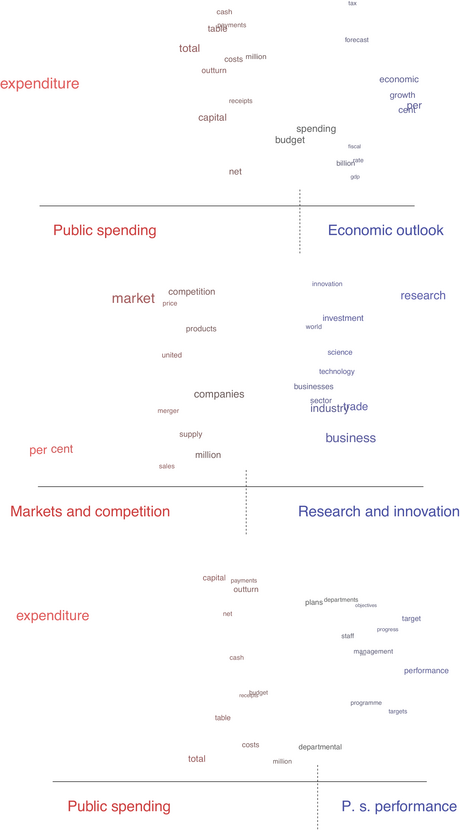
The public spending topic (14) deals with the management of fiscal resources with a clear emphasis on spending control rather than uses of the funds. The most representative documents for it come from the 1980s and refer to spending estimates for various government bodies. The nature of this public spending topic can be further examined by exploring the differences in language between it and another topic dealing with public finance, economic outlook (4), which became prevalent in the 2010s. To do so, Figure 3 presents differences in the frequencies of the most probable words between pairs of topics, calculated using the method implemented by Roberts et al. (Reference Roberts, Stewart, Tingley, Lucas, Leder‐Luis, Gadarian, Albertson and Rand2014). The upper section of the figure suggests that the relative focus of fiscal debates in the earlier period was on controlling expenditure versus economic growth in the more recent period.
Contrast between topics. [Colour figure can be viewed at wileyonlinelibrary.com]
Note: For each topic, the top 12 most probable words are selected and the difference in probabilities for each such word between the two topics is calculated. The width of the graph is scaled to the largest such differences on each side, and the horizontal axis indicates the relative size of the difference for each term. Larger fonts indicate higher relative frequency in the corpus.

The markets and competition topic (19), also prevalent in the 1980s, deals with efforts towards deregulation and increased competition between private companies. Its most representative documents are various reports on anti‐trust policy. Figure 3 (middle) illustrates the change in language between this topic and another business‐related topic, which became dominant in the 2010s. The latter (topic 6) focuses on research, investment, science and technology rather than liberalization.
The social insurance topic (17), which was important in the 1980s and declined gradually afterwards, again deals with spending control in the context of various types of social benefits. The topics, characteristic of the 1980s, are therefore clearly indicative of a liberalizing and small‐state drive and correspond to historical perceptions of the era.
Period II. The second row in Figure 1, as well as the first panel in Figure 2, shows that the middle of the observation period is characterized by the rise of topics dealing with the public services: public service performance (20), education (16), as well as healthcare (15), which shows a gradual upward trend. While again it would be hard to impose cutoff points on the gradual evolutions emerging from the models, the 1990s and 2000s are the most representative decades for these developments. These topics are quite distinct from the liberalization topics but also do not point towards any rejection of liberalism (see also Schmidt & Woll, Reference Schmidt, Woll, Schmidt and Thatcher2013). The change in the treatment of the public sector is evident from a contrast, presented in Figure 3 (lower), between the earlier public spending topic (14) and the public sector performance topic (20), which focuses on performance targets, management inspired by the private sector and responsiveness to the consumer. Representative documents for the public sector performance topic relate to efforts by both the Major and Blair governments to reshape the relationship between the public services and citizens to more closely resemble the relationship between the private sector and consumers, paralleling ideas from the theory of new public management. These developments have been documented in the qualitative literature (e.g., Ferlie et al., Reference Ferlie, Fitzgerald and Pettigrew1996) and can be linked to quantitative results on policy agenda entropy in John and Jennings (Reference John and Jennings2010), but the extent to which they could be distinguished from earlier developments from the 1980s in terms of policy content was not evaluated in quantitative terms. These results suggest that changes in the policy agenda have been relatively rapid, providing support for the punctuated equilibrium hypothesis, but also that these changes have led to relatively coherent policy eras in which complementary developments across multiple areas took place simultaneously, a point which will be echoed in the multiple results throughout the rest of the analysis.
Period III. The third row of Figure 1, and the second panel in Figure 2, also suggests that in the later part of the observation period, a continued focus on two key public services, health and education, was supplemented by a rise in interest in three topics dealing with innovation (6), economic growth (4) and climate, transport and energy policy (10), which became dominant in the 2010s.
The documents identified as most representative for these third‐period topics reflect a significant change in perceptions of the relation between the state and the economy and suggest support for the hypothesis of the rise of a more activist economic strategy. For example, Prime Minister May says in a representative policy paper from 2017 that ‘[…] one of my first actions as Prime Minister was to begin the development of a modern Industrial Strategy […]. At its heart it epitomises my belief in a strong and strategic state that intervenes decisively wherever it can make a difference’ (Cm 9528). And Prime Minister Johnson says that the formula for economic success is ‘[s]trong and active government investing massively in science and technology, coupled with a dynamic enterprise economy […]‘(CP 401).
Papers which are identified by the model as representative for the research and innovation topic discuss regulatory changes to promote the growth of industries such as artificial intelligence and biotech (CP 111); increases in government funding of R&D (CP 111); and [identifying] ‘industries that are of strategic value to our economy and [working] to create a partnership between government and industry to nurture them’ (Cm. 9528). The Johnson government's most important White Paper on economic strategy (CP 401) similarly focuses on four key pillars: government investment in infrastructure (which overlaps with decarbonization goals); technical skills; innovation and applied research. These documents often draw upon experiences such as those of the American DARPA research agency or the Japanese Ministry of International Trade and Industry and discuss the setting up of a number of government bodies to provide funding. The contrast between these approaches and earlier representative documents on research and innovation (when the topic itself was much less prevalent) is substantial. A 1992 White Paper on innovation (Cm. 2250) emphasizes that the key to innovation is ‘individual scientists’, not ‘councils and departments’ and that ‘the Government recognizes that the key to success is frequent and productive informal contacts between scientists and firms’.
Similar content can be encountered in the second distinctive topic of the 2010s – which refers to energy, decarbonization and infrastructure (10). A common theme in documents related to this topic is the subsidization of green energy and of research related to it (Cm. 7686), including a major commitment to hydrogen (CP 475), but also to natural gas (Cm. 8407), and high‐speed rail (Cm. 8508). The third dominant topic of the 2010s, economic outlook (4) shows a distinct contrast to earlier approaches to public spending, as illustrated in Figure 3. The focus in the 2010s is on both economic growth and fiscality, rather than on expenditure control, as was the case in the earlier period.
Topic evolution and government changes. To test for a connection between topic evolution and government changes, Table 2 summarizes the results of two sets of models evaluating changes in topic prevalence between pairs of subsequent prime ministers. The first model does not include any time trend controls and simply estimates $E\;[ {{\mathrm{prop}}{{( k )}_{dt}}} ] = {\beta _0}\; + {\beta _1}P{M_t}$, where $P{M_t}$ refers to the prime minister in office at time $t$. This is useful for establishing a baseline for the systematic differences that may exist, on average, between prime ministers. If such differences are identified, an immediate question is whether they can be explained by long‐run trends as opposed to being linked to changes in government. The second model, therefore, includes a moderately flexible, third‐power polynomial time trend and estimates $E\;[ {{\mathrm{prop}}{{( k )}_{dt}}} ] = {\beta _0}\; + {\beta _1}P{M_t} + s( {t,3} )$, where s(t,3) signifies a third‐degree polynomial function of time. Table 2 summarizes the findings in these models, by listing only the topics that saw significant changes between subsequent prime ministers, with and without time trends.
Topic prevalence changes given government changes
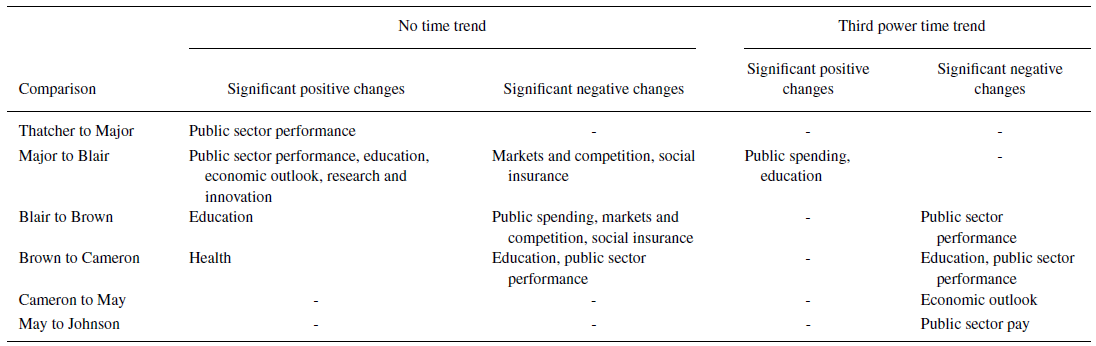
Note: The table summarizes linear models in which topic proportions are modelled as a function of prime minister indicator variables and a third‐degree time trend in the second part. The topics listed feature significant coefficients at the 0.95 levels.
Some differences between subsequent prime ministers are identified in the models without time trends – for example, the focus on public sector performance was on average higher during the Major years than during the Thatcher years. However, it is hard to distinguish between discrete effects from changes in government and long‐run trends, as controlling for the time trend removes most of the differences between subsequent governments. The results in Section 2.4 in online Appendix 2, in which average topic proportions are estimated for each prime minister also suggest relatively smooth trends in the evolutions of the topics rather than discontinuities given by government changes. Given all this, the evidence for a government effect on topic prevalence is weak and inconclusive, echoing similar conclusions from the policy agendas literature (John & Jennings, Reference John and Jennings2010). This conclusion is also supported by the documents themselves – representative documents for the three historical periods suggest some continuity between subsequent governments. For example, the most representative document identified for the new research and innovation drive (6) comes from the first Cameron government and already displays the activist ethos discussed (Cm. 8239). A representative document for the decarbonization drive (topic 10) comes from the last years of the Labour government (Cm. 7686), and the basic approach laid out then appears to have been pursued by all subsequent governments.
Other robustness tests. Section 2.5 in online Appendix 2 presents a further robustness check on the conclusions related to the three policy periods, by analysing the frequency of mentions of various types of economic agents – employees, consumers, and businesses – in the documents, using a method that is independent of any topic modelling. The results there show that references to employees declined throughout the observation period and were first supplanted by an early increase in references to consumers, especially as consumers of public services and a later increase in references to private firms, which become the most important group by the end of the observation period. These patterns suggest that evolutions in the topics identified by the model are closely paralleled by evolutions in the agents mentioned in the documents, which provides further support for the validity of the topic modelling approach.
Topics and evolutions in the cabinet minutes corpus
Table 3 presents the results of a structural topic model with the same choice of K = 20 on the cabinet minutes sample. The topics present in this sample can be classified in the same broad areas of public finance (10: Economic prospects, 12: Pay negotiations, 14: Public spending, 17: Economic statistics, 18: Social insurance), interactions with state‐owned and privatized companies (8: SOEs and privatization, 12: Pay negotiations, and 15: Strikes, for the most part) and the public sector (13: Health and 16: Public sector reform).
Topics in the cabinet minutes

Topic correspondence between the two sources. Validating conclusions from the Command Papers would require, first, a correspondence between economic topics from that sample and this one and, second, similar over‐time evolutions up to 1997. On the first point, Table 4 presents a possible mapping between all 10 economic topics from the Command Papers and all 10 economic topics from the cabinet minutes, using two criteria for defining a match. The criterion used in the ‘cosine similarity' column is overlap between the lists of the 50 highest probability terms, based on a cosine similarity score of at least 0.15. (For reference, the coefficient between the two health topics, the lowest treated as a match, is 0.18). Additionally, the column‐labelled ‘qualitative’ lists topics for which a qualitative connection to the Command Paper topic and, more broadly, to the policy era at hand can be argued but without clear overlap in the list of characteristic terms. For example, the public sector performance topic from the cabinet minutes features representative documents referring to initiatives such as the Citizen's Charter and the Government Information Service, which indicate a focus on the same aspects of public sector performance as in the Command Papers topic. The same topic contains language as well as representative documents dealing with educational reforms, which can be connected to the education topic in the Command Papers. Considering such indirect matches in our analysis is useful for testing the robustness of conclusions regarding over‐time changes, as we would expect topics associated with the first period to decline and those associated with the second period to see an increase in the cabinet minutes sample. Two topics that relate to periodic reports by the Chancellor on the economic situation and on economic statistics are most closely connected to the economic outlook topic from the Command Papers. Both of them will be shown to have a constant level throughout the period up to 1997, much like the economic outlook topic (see Figure 1), but whether their evolution paralleled that of the Command Papers topic in the third period cannot be tested in this sample.
Topics in Command Papers and cabinet minutes
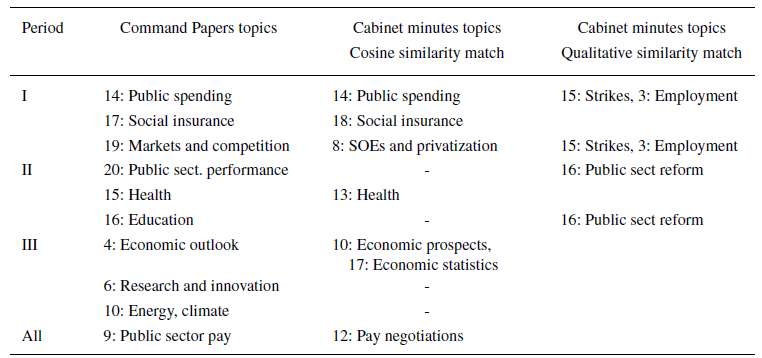
Note: The second column lists Command Papers topics, by the period most closely associated with. The third column lists cabinet minutes topics matched to the Command Papers’ topics with a cosine similarity between the top 50 most probable words of more than 0.15. The fourth column lists cabinet minutes topics which are not matched using the cosine similarity criterion but show clear substantive overlap.
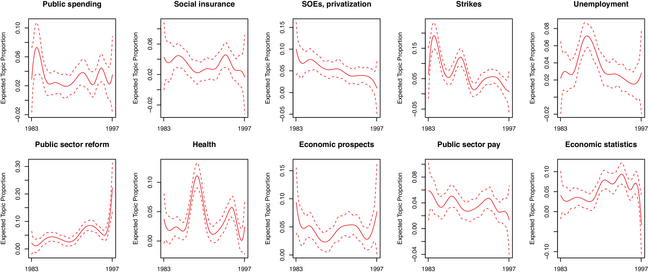
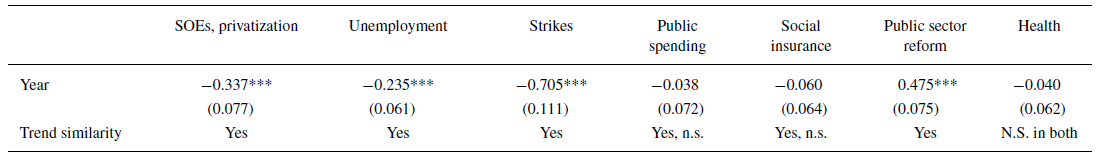
Evolutions over time in the cabinet minutes. Figure 4 presents the flexible over‐time modelling of topic evolutions in the cabinet minutes.Footnote 6 The top row presents the cabinet minutes topics associated with the first period, according to Table 4, which are hypothesized to decline. The second row presents two topics associated with the second historical era, according to Table 4, and also the three remaining topics for which no strong hypotheses can be formulated. Trends in these figures match expectations arising from the Command Papers sample: The five categories in the top row, which are hypothesized to decline do indeed show a downward trend, the public sector reform category does indeed show a sharp increase; and the health category, which did not show a clear trend in the Command Papers in this period does not show one here either. (Additionally, the public sector pay category stays constant, as in the Command Papers). Because the statistical significance of these evolutions is not immediately apparent, I have estimated two additional measures of topic evolution. One, presented in Figure A.4.2 in online Appendix 4, is given by differences in topic prevalence between two time points situated towards the ends of the observation period. Another measure, presented in Table 5, is given by a linear model of topic evolution of the form $E\;[ {{\mathrm{prop}}{{( k )}_{dt}}} ] = {\beta _0}\; + {\beta _1}t$, which tests whether the hypotheses regarding positive or negative evolutions are validated. Four of the categories in Table 5 show significant linear trends and behave as expected given evolutions of corresponding topics in the Command Papers. Additionally, the social insurance and public finance categories show decreases just like in the Command Papers sample but do not reach statistical significance. The health category does not show significant evolutions in either the Command Papers or cabinet minutes sample. These results suggest substantial support for the similarity in topic evolutions across the 1983–1997 period in the two sources.
Flexible modelling of topic evolutions, cabinet minutes. [Colour figure can be viewed at wileyonlinelibrary.com]
Note: Top row presents topics associated with the first period. First two topics in the bottom row are associated with the second period; last three topics from the bottom row have unclear associations. Autocorrelation tests are given in Section 4.3 in online Appendix 4.

Effect of time on topic prevalence in cabinet papers, linear model

Note: The table presents marginal effects of a one‐year period on the prevalence of the selected categories in percentage points. Autocorrelation tests are presented in Figure A.4.3.2 in online Appendix 4 and show the standard error on the strikes topic may be underestimated due to autocorrelation. The trend similarity is based on a match between the coefficient for the given topic and evolution for the corresponding Command Papers topic, as estimated in Figure 2 (upper). Topic correspondence according to Table 4. ‘N.s.’ stands for ‘not significant’.
Results on spending data
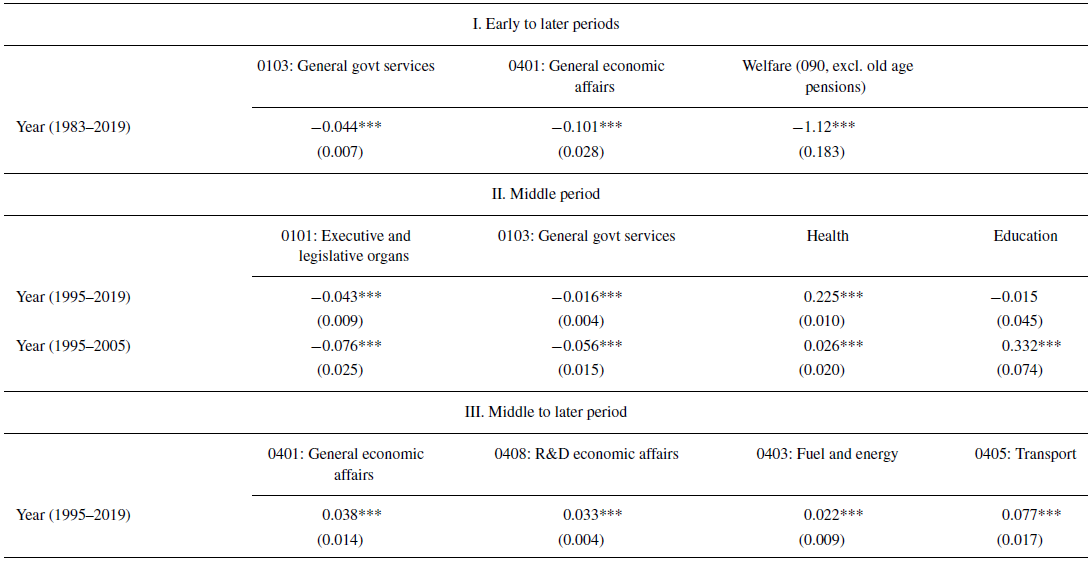
The patterns identified in the textual data have implications for evolutions in various components of the 70‐part COFOG classification of spending. This section presents statistical tests using time series regressions relevant to the three periods, and the online Appendix illustrates graphically the evolutions of relevant COFOG categories. Table 6 presents linear time trends estimated over the full 1983–2019 period to illustrate evolutions from the first, liberalization, period to subsequent periods and over the 1995–2019 period to illustrate evolutions from the middle period into the third period. These linear models provide simple tests of hypotheses regarding increases and decreases in the various expenditure categories that emerge from evolutions in the textual data.
Spending patterns over time

Note: Table 6 presents the effect of 1 year on the percentage of total government spending allocated to a given category. Models are linear regressions with Newey West standard errors using a two‐period lag. Upper section: categories hypothesized to decline throughout the observation period. Middle section: categories hypothesized to have changed disproportionately in the middle period. Lower section: categories hypothesized to have increased in the third period.
Period I. Given the focus on liberalization and spending cuts identified in the textual data for the first part of the period, we would expect to see associated declines in government spending related to company support, to government functions and to welfare, when comparing the early part of the observation period to both the middle and the later part. The upper section of Table 6 tests this hypothesis by presenting regression results on the evolution of the COFOG categories that capture these three expenditure types – general economic affairs (of which subsidies are a major component), general government services (spending on the government bureaucracy) and welfare over the entire 1981–2019 period.Footnote 7 Very large decreases are identified in all, and the graphical illustrations in online Appendix 3 give a sense of the magnitude and timing of these changes.
Period II. Spending patterns are not as easily connected to the public service delivery era, as core objectives in this period included not only the government doing more with less, but also expanding the provision of certain public services. To evaluate whether there was anything distinctive in terms of spending patterns in this era, we can compare evolutions in the 1995–2005 period, at the height of the public service era, with evolutions over the longer time period (1995–2019). Results in the middle panel show that the 1995–2005 period saw outsized cuts when compared to the longer 1995–2019 period in spending on government bureaucracy and the central executive and legislative apparatus, as reflected in substantially more negative coefficients on the time trend in both cases. At the same time, this middle period also saw large increases in spending on education and healthcare. This suggests a reorientation of priorities away from government employees and the government bureaucracy and towards the provision of public services. The fact that education spending patterns map almost perfectly (Section 3.1 of online Appendix 3) on the prevalence of the education topic (Figure 1) again suggests that conclusions from the policy papers are reflective of actual government behaviour.
Period III. Spending data is perhaps most useful in testing claims regarding the rise of a more activist industrial strategy era. If the claims made in White Papers on innovation, energy and climate are to be believed, they would have to be reflected in substantial increases in the COFOG categories most closely reflective of those policy priorities: general government subsidies, R&D funding, energy subsidies and infrastructure spending. Table 6, the third section, presents tests of the evolution of these four COFOG categories over the 1995–2019 period and shows large increases. Note that the rate of increase in general subsidies, category 0401, over the 1995–2019 period, does not make up for the much larger decline when looking over the four‐decade observation period. For a sense of the importance of these changes, versus other evolutions in the 70 classes of spending, Section 3.2 in online Appendix 3 ranks the linear coefficients on the 1995–2019 trends for all components of the COFOG classification. The top of the rankings in that table is dominated by categories related to industrial strategy: the categories capturing transportation investment, general business support, applied R&D, and energy spending/subsidies are all in the top 12, and other types of R&D spending also show large increases. These patterns support the conclusions emerging from the topic modelling of the policy papers and confirm the reorientation of government policy towards such topics in the recent period.
Discussion
This section reviews some implications of the findings and briefly discusses potential explanations for these evolutions. The analysis shows that substantial variation in economic policy approaches did take place over the observation period, and the nature of this variation suggests important qualifications on the simple hypothesis of a relatively undifferentiated liberal period after 1980. The second period identified here, with its focus on public service delivery, already shows significant differences from the strategies prevalent in the 1980s. The departure from the liberal approach in the third period appears to be even greater. The results show that, far from being a sudden development associated with the Johnson or May governments, the key components of this evolution have been at work for some time. These include increases in R&D topics and associated spending (which started noticeably increasing as early as 2000 and increased strongly, in relative terms after 2010), decarbonization (which has been a priority at least since the Brown years) and a preoccupation with the United Kingdom's disappointing economic growth performance (visible since the beginning of the first Cameron government).
While the objectives and preferences of the particular governments in power undoubtedly had some effect on the occurrence of these policy periods, the results also show that such an effect is hard to pin down in the data, and, moreover, the question of what may lead governments to have those preferences in the first place remains open. One set of explanations may relate to the agents whose interests are claimed to be promoted by the policies. The rise of the public service delivery period can be connected to increases in references to citizens‐as‐consumers (and a relative decline in mentions of the employees providing the services), as evidenced in Section 2.5 in the online Appendix 2. The emergence of the industrial policy period can also be connected to a rise in mentions of private business, the support of which began to be seen as a legitimate government responsibility. While there is obvious endogeneity between certain topics rising on the agenda and groups related to those topics receiving more mentions, there is also a possibility that shifts in the political importance of broad groups may be an important impetus behind these developments.
We can also speculate on other explanatory factors to be more rigorously explored in future work. The influence of academic developments in economics on policies in the Thatcher years has been discussed by Parker (Reference Parker2009), and the public service delivery period can be readily connected to the academic theory of new public management (Ferlie et al., Reference Ferlie, Fitzgerald and Pettigrew1996). Several papers on industrial strategy from the more recent period (e.g., Cm. 8239, Cm. 9528, CP111, CP401) also make references to academic literature, especially on endogenous growth and the economics of innovation. Cm. 9528, for example, cites influential works on economic growth and industrial policy by Mazzucato (Reference Mazzucato2018), Bloom and Van Reenen (Reference Bloom and Van Reenen2007) and Haldane (Reference Haldane2017). Policy papers also make references to international comparisons and to examples from abroad in justifying policies. A paper on innovation and growth from 2011 (Cm. 9528) cites four examples of innovation ecosystems to learn from – the United States, Germany, Japan and Sweden. Comparative statistics from international organizations, such as the Global Innovation Index, are also frequently presented (CP111, CP401). These examples should motivate further exploration of the intellectual origins of the recent policy developments.
Another important challenge for future research is disentangling the causal connection between the topics that feature on the day‐to‐day policy agendas of governments and longer‐term outcomes, such as institutional quality, growth models, or varieties of capitalism. Similarly, it would be important to examine whether findings regarding the three policy periods can be extended to settings other than the United States as well as to explore the relative importance of policy aspects that did evolve compared to those which may have stayed constant during the post‐1980 era. Sources of archival data such as the ones employed here, together with rapidly developing statistical learning techniques, can make an important contribution to these efforts.
Acknowledgements
Many thanks to colleagues at Bristol and elsewhere who have helped me develop this project, especially to Mark‐Wickham Jones who contributed his expert knowledge to the validation exercise.
Archival sources
National Archives. 2022. Types of Parliamentary Paper. Available at: https://www.nationalarchives.gov.uk/information‐management/producing‐official‐publications/parliamentary‐papers‐guidance/types‐parliamentary‐paper/
Cm. 2250. Realising our Potential: A Strategy for Science, Engineering and Technology/ 1993.
Cm. 3901. Expenditure Plans ‐ Statistical analyses 1998/99. 1998.
Cm. 7686. The UK Renewable Energy Strategy. 2009.
Cm. 8239. Innovation and Research Strategy for Growth. 2011.
Cm. 8407. Gas Generation Strategy. 2012.
Cm. 8508. High Speed Rail. 2013.
Cm. 9528. Industrial Strategy: Building a Britain Fit for the Future. 2017.
CP. 111. Regulation for the Fourth Industrial Revolution. 2019.
CP. 401. Build Back Better – Our Plan for Growth. 2021.
CP. 475. UK Hydrogen Strategy. 2021.
CAB 128. Cabinet Minutes. 1983–1997.
Online Appendix
Additional supporting information may be found in the Online Appendix section at the end of the article:
Appendix
Supplementary information


 Open access