

Introduction
W. E. B. Du Bois ([1899] Reference Du Bois1996) was among the first scholars to identify and document the relationship between skin tone and socioeconomic status. In The Philadelphia Negro, a masterful 1899 study of the social and economic conditions of the Black community, Du Bois observed a four-level class system with lighter-skinned Blacks largely serving in the professional class (e.g., doctors, lawyers, professors, etc.), while comparatively darker-skinned Blacks comprised the middle class, working class, and poorer segments (i.e., “submerged tenth”) of the Black community. Sociologist Elijah Anderson (Reference Anderson2000) used the term “colortocracy” to draw attention to Du Bois’s depiction of the upper crust of this stratification system, many of whom were the progeny of slaves and slave owners who became the de facto leaders of the Black community.
As in the United States, extensive research confirms that skin tone is a major stratifying social force throughout Latin America owing to the deep, ongoing legacy of racism, slavery, and colonial ideology (Dixon and Telles, Reference Dixon and Telles2017) that privileges Whiteness over Blackness and lightness over darkness, forming what Latin American scholars have referred to as a “pigmentocracy” (Lipschutz Reference Lipschutz1944; Telles Reference Telles2014).Footnote 1 While we view the terms colortocracy and pigmentocracy as ideological twins, with either being appropriate to describe stratification systems associated with skin color regardless of the country under consideration, we use the former throughout this article to pay homage to the originality of Du Bois’s contribution to this unique literature, which has influenced scholarship in this area in the United States and Latin America. For our purposes, a colortocracy is any country or system that exhibits a “preference for Whiteness” as evidenced by a strong association between lighter skin tone and socioeconomic status (i.e., lighter-skinned people on top while gradations of successively darker-skinned individuals reside in the middle and lower ranks of the stratification order) (Anderson Reference Anderson2000; Telles et al., Reference Telles, Flores and Urrea-Giraldo2015).Footnote 2 In this context, skin tone intersects with discrimination and inequality to forge differential socioeconomic life chances among people of the same race and ethnic backgrounds (Dixon and Telles, Reference Dixon and Telles2017; Du Bois [1899] Reference Du Bois1996). Research shows that lighter-skinned Latin Americans enjoy higher achievement levels than their darker-skinned counterparts in educational attainment, occupational status, income, and wealth acquisition (Bailey et al., Reference Bailey, Fialho and Penner2016; Espino and Franz, Reference Espino and Franz2002; Monk Reference Monk2016, Reference Monk2019; Painter et al., Reference Painter, Noy and Holmes2020; Rosenblum et al., Reference Rosenblum, Darity, Harris and Hamilton2016; Telles and Paschel, Reference Telles and Paschel2014; Telles et al., Reference Telles, Flores and Urrea-Giraldo2015; Villarreal Reference Villarreal2010). An added complexity to this literature is the observation that racial identification is often fluid in Latin America—individuals have been known to “whiten” themselves to elude the designation of Black, or as a mechanism to rise above their mixed-race status (Davenport Reference Davenport2020; Degler Reference Degler1971; Howard Reference Howard2001; Roth et al., Reference Roth, Solís and Sue2022; Roth Reference Roth2013; Schwartzman Reference Schwartzman2007). These findings are consistent with the proposition that there is a “preference for Whiteness” in Latin America (Painter et al., Reference Painter, Noy and Holmes2020) and among Latinos in the United States (Darity et al., Reference Darity, Dietrich and Hamilton2005). However, as important as this research is, more work is needed to determine whether skin tone and self-designated race are associated with inequality across a broad region of Latin America and, if so, the extent to which such associations may vary by socioeconomic indicator.
Beyond these seminal findings, the literature has been instructive about best practices for estimating inequality. Most of the research on ethnoracial inequality relies upon self-classified race data; however recent scholarship, based on single-country analysis or a small number of countries, has shown that interviewer-rated skin tone designations are not only empirically distinct from self-identified census-based racial categories, but they are often stronger predictors of socioeconomic outcomes (Bailey et al., Reference Bailey, Fialho and Penner2016; Flores and Telles, Reference Flores and Telles2012; Monk Reference Monk2016; Telles Reference Telles2014; Telles and Paschel, Reference Telles and Paschel2014; Telles et al., Reference Telles, Flores and Urrea-Giraldo2015). Despite its importance, surprisingly little is known about whether these patterns play out across many Latin American countries or just a select few. A chief aim of this study is to fill this gap using data from the 2018 Latin American Public Opinion Project (LAPOP). We examine the empirical links between (1) skin tone, race/ethnicity, and occupational status, and (2) skin tone, race/ethnicity, and material wealthFootnote 3 in sixteen Latin American countries. The nationally representative data cover about 90% of the Latin American population, or approximately 578 million people (World Bank 2019). Specifically, we build on what was previously known about the social stratification properties of skin tone and racial identity in Latin America in five ways. First, under the logic that different indicators of socioeconomic status may paint different pictures of inequality, we use two distinct measures of social stratification: material wealth and occupational status. We argue that material wealth and occupational status are conceptually distinct measures of social stratification that reveal substantially different degrees of inequality in Latin America.
Second, prior research has enhanced our understanding of the virtues of interviewer-rated skin tone measures compared to census-based, self-designated race categories for predicting variations in socioeconomic outcomes. Scholars have observed that skin color and race are erroneously used interchangeably among average citizens (Monk Reference Monk2016; Telles Reference Telles2012), even though research shows the two terms can lead to radically different conclusions about the degree of inequality in some Latin American countries (Monk Reference Monk2016). As a result, a growing chorus of scholars have either implicitly or explicitly advanced the use of multiple indicators of race when possible. Notwithstanding the importance of these studies, most of them are limited to single countries, such as Brazil (Monk Reference Monk2016) or Mexico (Flores and Telles, Reference Flores and Telles2012; Villarreal Reference Villarreal2010, Reference Villarreal2012), or to a small number of countries (Telles Reference Telles2014). We contribute to this literature by employing multiple identifiers (census-based race categories, binary indicators, and continuous skin color designations), and by showing that the empirical distinctions between these concepts prevail across a broader array of Latin American countries than previously observed. We further explore the extent to which the answer depends on the outcome measure in question (occupational status or material wealth). As we report below, we find relatively little evidence that interviewer-rated skin tone is a stronger predictor than self-designated race categories when the outcome measure is occupational status, but very strong supporting evidence across Latin America for predicting material wealth. This nuanced finding strongly suggests that the predictive strength of visible phenotypic traits over self-identified racial categories largely depends on the socioeconomic indicator in question.
Third, only a small handful of studies have attempted to draw an empirical link between interviewer-rated skin tone, census-based racial categories, and occupational status cross-nationally. Of these, a few compare multiple Latin American countries simultaneously, as this study sets out to accomplish. These studies reveal occupational-based skin color inequality in some Latin American countries (Telles Reference Telles2004, Reference Telles2014; Telles and Paschel, Reference Telles and Paschel2014), particularly in Brazil (Monk Reference Monk2016) and Mexico (Flores and Telles, Reference Flores and Telles2012; Villarreal Reference Villarreal2010), where lighter skin yields better occupational outcomes than darker skin. However, the extent to which this pattern is evident across an extensive array of Latin American countries is an empirical question yet to be fully answered. This gap in the literature prompts the question: How prevalent are occupational-based colortocracies across Latin America? We find that they are present in only four of the sixteen Latin American countries we analyze.
Fourth, our article further contributes to prior literature in its use of material wealth as an indicator of respondents’ social class status. Despite the importance of wealth as a measure of socioeconomic status, few studies have examined the link between skin tone stratification and wealth inequality in Latin America. In most cases, these studies conceptualize wealth as a determinant of skin tone (Schwartzman Reference Schwartzman2007; Telles and Paschel, Reference Telles and Paschel2014; Twine Reference Twine1998) as opposed to a consequence of skin tone, as our study sets out to do. Matthew Painter and colleagues (Reference Painter, Noy and Holmes2020) provide one exception to this pattern as they draw on three indicators of material wealth: home, car, and motorcycle ownership. They find, among other things, moderate support for the preference for Whiteness hypothesis in that respondents with darker skin tones had more difficulty than their lighter-skinned counterparts acquiring motor vehicles but less trouble securing homeownership. Finding considerable variation in the relationship between skin tone and their indicators of wealth throughout Latin America, Painter and colleagues (Reference Painter, Noy and Holmes2020) call for additional research to “examine how and whether these inequalities map onto other measures of wealth” (p. 3915). Heeding their call, we use an index of material wealth that captures more household assets than that employed in the Painter et al. (Reference Painter, Noy and Holmes2020) study. Specifically, our index includes measures of indoor plumbing (drinkable water), indoor bathroom, television, refrigerator, conventional telephone, cell phone, washing machine, microwave oven, internet access, computer, and number of vehicles (Córdova Reference Córdova2009).Footnote 4 Importantly, a respondent may own a home as in the Painter et al. (Reference Painter, Noy and Holmes2020) study, but it may lack basic amenities such as indoor plumbing. Hence, we believe the additional indicators provide a more reliable and comprehensive measurement of wealth.
As a final contribution to the literature, we employ more recent data than previously examined, along with new analysis of previously excluded Latin American countries to track cross-national variation in the preference for Whiteness across the region.Footnote 5 Such an analysis is warranted given the well-documented finding that racial systems operate differently across Latin America (McNamee Reference McNamee2020; Telles and Flores, Reference Telles and Flores2013).Footnote 6 On the one hand, it is reasonable to expect European settled countries, steeped in a historical ideology of Whiteness with a potent opposition toward Blackness and indigeneity (e.g., Argentina, Chile, Uruguay, Costa Rica), to exhibit a stronger preference for Whiteness relative to countries with a history of racially mixed ideology, also known as mestizaje (e.g., Colombia, Mexico, Paraguay, Peru) (McNamee Reference McNamee2020; Telles Reference Telles2014). On the other hand, a preference for Whiteness may be so deeply embedded throughout Latin America that regardless of whether a country was dominated by White settlers or whether it came to promote a national ideology of mestizaje (McNamee Reference McNamee2020)—a strong, positive association between light skin color and socioeconomic status may still prevail. Our data, which allows us to adjudicate between these two perspectives, supports the latter interpretation but the strength of the evidence largely depends on the outcome measure in question.
With these contributions in mind, we begin with a brief discussion of the historical context that gave rise to skin tone and racial stratification throughout Latin America. We then review the literature delineating the association between skin tone, racial identification, and various indicators of socioeconomic status. Following a presentation of our data, analytical strategy, and results, we conclude by discussing the implications of our study for future research.
Background and Literature Review
Race, Ethnicity, and Skin Tone Stratification in Latin America
The history of race, ethnicity, and skin tone stratification in Latin America begins with European colonists and their quest to enslave and subsequently appropriate the free labor of Africans and their descendants. Scholars report that fifteen times more Africans were kidnapped and taken to Latin America than to the United States (Eltis Reference Eltis2011; Telles and Paschel, Reference Telles and Paschel2014). They note how free and enslaved Blacks, Mulattos,Footnote 7 and MestizosFootnote 8 came to constitute most of the populations in Brazil, Venezuela, Puerto Rico, Cuba, the Dominican Republic, and Panama and about one-third of the population in Argentina and Colombia circa 1800 (Andrews Reference Andrews2004; Telles and Paschel, Reference Telles and Paschel2014). Drawing on prior research, Edward E. Telles and Tianna Paschel (Reference Telles and Paschel2014) observed that “Spanish and Portuguese immigration during the colonial period consisted mostly of men without families who procreated (often forcibly) with indigenous, black, and mulato women” (p. 867), giving rise to a large mixed-race population (Degler Reference Degler1971; Nobles Reference Nobles2000). Even though mestizaje (racial mixing) was prevalent, Iberian colonization spawned a style of governance in which only a few European descendants possessed great power and wealth, while Afro and mixed-raced descendants, despite being the majority in some countries, were exploited by the White elite (Valente Reference Valente2013).
Racial oppression overlay racial and skin tone inequality throughout Latin America, and both are informed by the history of slavery and contemporary White racist attitudes (Schwarcz Reference Schwarcz1999; Skidmore Reference Skidmore1993; Valente Reference Valente2013). In this environment, socioeconomic opportunities were not equally distributed, and a preference for light skin and European phenotypic characteristics were—and continue to be—common in Latin America (Telles and Paschel, Reference Telles and Paschel2014). Brazil, like other countries, promoted the myth of racial democracyFootnote 9 while placing its faith in the whitening of its population, with the unequivocally racist intention of purging the presumably negative influence of Black blood (Skidmore and Smith, Reference Skidmore and Smith1997; Valente Reference Valente2013). As a result, many African descendants and the population in general, have adopted a preference for Whiteness, the ideal of whitening, and the myth of racial democracy, believing that lighter skin tone and more European features (e.g., hair texture, nose, and mouth size) are superior to darker skin and African features (Almeida Reference Almeida, Kingstone and Power2008). Thus, a close examination of the historical record reveals that at the foundation of all aspects of Latin American society––its cultural, political, social, and economic systems––lies a colortocracy whereby skin tone and racial identity play significant roles in excluding and discriminating against darker-hued African descendants (Telles Reference Telles2014; Telles and Paschel, Reference Telles and Paschel2014; Valente and Berry, Reference Valente and Bryan2020).
Skin Tone and Socioeconomic Status
Beyond denoting ingroup distinctions, colortocracies can also refer to Black-White differences in authority attainment in the workplace (Smith Reference Smith2003), or any organized system of socioeconomic inequality that is associated with skin tone and race wherein a preference for Whiteness (or lightness) enhances the life chances of lighter-skinned (or White individuals) over those of their darker-skinned (or Black) counterparts.
Since Du Bois’s (1899) masterful study, a large body of research has confirmed that skin tone is associated with many indicators of socioeconomic status, including education, income, occupational status, prestige, wealth (Espino and Franz, Reference Espino and Franz2002; Hersch Reference Hersch2011; Hunter Reference Hunter2005; Keith and Herring, Reference Keith and Herring1991; Monk Reference Monk2014, Reference Monk2016, Reference Monk2019; Rosenblum et al., Reference Rosenblum, Darity, Harris and Hamilton2016; Villarreal Reference Villarreal2010), health (Monk Reference Monk2015; Perreira and Telles, Reference Perreira and Telles2014), marital chances (Hamilton et al., Reference Hamilton, Goldsmith and Darity2009; Hunter Reference Hunter2005), and the likelihood of being sentenced to death (Eberhardt et al., Reference Eberhardt, Davies, Purdie-Vaughns and Johnson2006). For the purposes of this study, we concentrate on two important socioeconomic indicators: occupational status and material wealth. Both have garnered scant empirical attention when it comes to examining skin tone stratification and racial inequality throughout Latin America. Because we view these indicators as conceptually and empirically distinct, we discuss their relationship to skin tone and racial inequality separately below, drawing on Latin American and U.S.-based studies to foreshadow our expectations.
Occupational Status and Skin Tone
The bulk of scholarship examining the relationship between skin tone and occupational status focuses on the United States (Davila et al., Reference Davila, Mora and Stockly2011; Dixon and Telles, Reference Dixon and Telles2017; Espino and Franz, Reference Espino and Franz2002; Gullickson Reference Gullickson2005; Goldsmith et al., Reference Goldsmith, Hamilton and Darity2006; Han Reference Han2020; Keith and Herring, Reference Keith and Herring1991; Seltzer and Smith, Reference Seltzer and Smith1991). Slavery fundamentally shaped contemporary patterns linking skin tone to occupational status. Compared to darker-skinned slaves, lighter-skinned slaves were given more desirable jobs (for instance, as house slaves), were more likely to learn a skilled trade or receive some schooling, and were more likely to be manumitted (Dixon and Telles, Reference Dixon and Telles2017; Drake and Cayton, Reference Drake and Cayton1993; Reuter Reference Reuter1917; Russell et al., Reference Russell, Wilson and Hall1992). After the Civil War, newly freed slaves of mixed-race parentage (mulattos) achieved greater upward mobility in terms of wealth, occupational status, income, educational attainment, and social network connections (Frazier Reference Frazier1957; Herring et al., Reference Herring, Keith and Horton2004).
The findings of the U.S.-based empirical literature are fairly consistent across time, data sets, statistical controls, and occupational measures: lighter-skinned Blacks have higher levels of occupational attainment than their darker-skinned counterparts. Verna Keith and Cedric Herring (Reference Keith and Herring1991), for example, found that very light individuals were more likely to be employed as professional and technical workers than those with darker complexions. By contrast, those with very dark complexions were more likely than all others to be laborers. Using data from the General Social Survey (GSS), Richard Seltzer and Robert C. Smith (Reference Seltzer and Smith1991) uncovered class stratification based on skin tone among Black communities in the United States, with lighter-skinned Blacks exhibiting higher levels of occupational attainment than darker-skinned Blacks. Similarly, Ellis P. Monk (Reference Monk2014) employed data from the National Survey of American Life (2001–2003) and found that darker-skinned respondents were more likely to have less prestigious occupations than all other subjects. Aaron Gullickson (Reference Gullickson2005) has argued that the importance of skin tone has declined substantially over time among the Black community in the United States, to the point of no longer being associated with occupational status and educational attainment; however, his findings have been challenged on methodological grounds (Goldsmith et al., Reference Goldsmith, Hamilton and Darity2006).
Eduardo Bonilla-Silva (Reference Bonilla-Silva2004) noted that census data showed that “White” U.S. Latinos were fifty to 100 percent more likely than dark-skinned Latinos to be represented in managerial, professional, and technical occupations. Similarly, Alberto Davila and colleagues (Reference Davila, Mora and Stockly2011) discovered that “fair-complexioned” Mexican immigrant workers in the United States were more likely than their darker skinned counterparts to have white-collar occupations and less likely to work in agricultural and blue-collar occupations. JooHee Han (Reference Han2020) examined the occupational achievement of multiple immigrant groups in the United States and found that darker-skinned immigrants experience steeper downward mobility upon arrival in the United States and slower subsequent upward mobility compared to light-skinned immigrants, controlling for nationality. Overall, these studies suggest that the effects of skin tone on the occupational chances of darker-skinned Blacks and Latinos in the United States are forged by the historical legacy of slavery, racism, and contemporary mechanisms that perpetuate occupational discrimination against people of darker skin tones.
Compared to the United States, studies examining the link between skin tone and occupational status in Latin America are scarce. As with the United States, scholars have traced the contemporary relationship between skin tone and occupational status in Latin America to the slavery and colonial periods (Bailey et al., Reference Bailey, Fialho and Penner2016; Telles Reference Telles2004; Telles and Paschel, Reference Telles and Paschel2014). Several studies home in on the specific link between skin tone and occupational status in Latin America (Espino and Franz, Reference Espino and Franz2002; Flores and Telles, Reference Flores and Telles2012; Villarreal Reference Villarreal2010; Reference Villarreal2012). Andrés Villarreal’s (Reference Villarreal2010) study of Mexico revealed occupational segregation by skin tone, with lighter-skinned workers disproportionately represented among the higher occupational ranks while darker-skinned workers were clustered at the lower end of the occupational hierarchy.
René D. Flores and Edward E. Telles’s (Reference Telles2012) replication of Villarreal’s study, using “a more objective measure of skin color” (p. 492), provided marginal evidence supporting the contention that darker skin is associated with being in professional occupations.Footnote 10 The authors also note that parents’ occupation or class origin serves as the primary determinant of respondent occupational attainment, suggesting a high level of intergenerational transmission of status. In responding to Flores and Telles (Reference Flores and Telles2012), Villarreal (Reference Villarreal2012) did not find significant evidence that parents’ occupation explains color differences in respondents’ occupational status. Whereas Villarreal (Reference Villarreal2012) and Flores and Telles (Reference Flores and Telles2012) focused their analytical lenses on Mexico, Rodolfo Espino and Michael Franz’s (Reference Espino and Franz2002) study showed that the strength of the link between skin tone and occupational status varies depending on the country under consideration. They found that “darker skinned Mexicans and Cubans face significantly lower occupational prestige scores than their lighter skinned counterparts” (p. 212) even after controlling for important background factors, but this pattern was not evident among Puerto Ricans.
In this study, we explore Espino and Franz’s (Reference Espino and Franz2002) assumption across a broader array of Latin American countries than previously examined. Further, since research shows that interviewer-rated skin tone is a stronger predictor of occupational status than self-identified census race categories in Brazil (Monk Reference Monk2016), we also aim to determine the extent to which this pattern is prevalent throughout Latin America. Given prior literature, it is reasonable to expect lighter skin to be positively associated with higher occupational status, darker skin to be associated with lower occupational status, and interviewer-rated skin to be a stronger predictor of inequality than self-designated race. But whether these patterns hold in just a few or in each of the sixteen Latin American countries we analyze is an important empirical question yet to be answered. In the analysis to follow, we show that the strength of the association between occupational status and skin tone varies significantly by country in a manner not previously observed.
Skin Tone, Material Wealth, and a Preference for Whiteness
Far fewer studies have examined the relationship between skin tone and wealth throughout Latin America. What little we know echoes findings from the skin tone-occupational status literature. That is, regardless of how wealth is measured or the countries under investigation, and notwithstanding the manner in which skin tone is conceptualized and ultimately operationalized for quantitative research, lighter-skinned individuals tend to have more wealth accumulation than people with darker skin tone in the United States (Bodenhorn Reference Bodenhorn2006; Bodenhorn and Ruebeck, Reference Bodenhorn and Ruebeck2007; Herring and Hynes, Reference Herring, Hynes, Martin, Horton, Herring, Keith and Thomas2017; Painter et al., Reference Painter, Holmes and Bateman2016) and in many countries in Latin America (Painter et al., Reference Painter, Noy and Holmes2020).
Several theories have been advanced to explain why light skin is associated with greater wealth. In the case of the United States, scholars theorize that the root cause of skin tone stratification among Blacks resides in slaveholder preferences for the lighter-skinned slaves they produced through forced sexual encounters with slave women. These unions, which often produced Black slaves of lighter complexions (Azibo Reference Azibo2014), provided a specialized labor market trained to work in intimate settings with slaveholding families as household servants, butlers, cooks, maids, and so on, while darker-skinned slaves toiled outside in harsher conditions in the fields (Frazier Reference Frazier1957). Although lighter-skinned household slaves were more exposed to the risk of sexual and other forms of abuse, working in their masters’ households increased their chances of building both their human capital (e.g., reading, writing, broader education, trade skills, etc.) and social capital (e.g., network access to jobs and entrepreneurial pursuits as farmers), which in turn deepened the socioeconomic chasm between them and darker-skinned slaves (Bodenhorn Reference Bodenhorn and Kauffman2003; Bodenhorn and Ruebeck, Reference Bodenhorn and Ruebeck2007; Du Bois [1899]Reference Du Bois1996; Frazier Reference Frazier1957; Horton and Horton, Reference Horton and Horton1998). Importantly, one of the central mechanisms used by lighter-skinned Blacks to perpetuate their status advantage over darker-skinned Blacks was “complexion homogamy,” that is, mate selection based on skin color (Bodenhorn Reference Bodenhorn2006). According to Howard Bodenhorn (Reference Bodenhorn2006), in the mid-nineteenth century the practice of complexion homogamy produced households comprised of light-skinned spouses (e.g., mulattos) with between 30% and 90% more wealth than households with one Black spouse. Bodenhorn further estimated that even after accounting for differences in age, occupation, education, and nativity, Mulatto homogamous households still had twice the amount of wealth as “complexion heterogeneous” marriages.
Scholars have referred to this kind of “colorism” as a “preference for Whiteness” (Darity et al., Reference Darity, Dietrich and Hamilton2005; Painter et al., Reference Painter, Holmes and Bateman2016; Painter et al., Reference Painter, Noy and Holmes2020). A test by Painter and colleagues (Reference Painter, Holmes and Bateman2016) of the preference for Whiteness hypothesis as it relates to wealth inequality by skin tone using U.S.-based data on Asian, Black, Latino, and White immigrants from the New Immigrant Survey is notable. Using a skin tone gradient to predict net wealth, the authors found support for the preference for Whiteness hypothesis: darker skin tone was associated with less wealth than lighter skin tone. In fact, the authors reported that “each skin shade darker is associated with 18 percent or $216 less wealth” (p. 1166). To show that skin tone is related to but very distinct from race/ethnicity, the authors added race/ethnicity to their skin tone models and found that progressively darker skin shades yielded “11 percent or $134 less wealth” for immigrants (p. 1166). Additional analyses by Painter et al. (Reference Painter, Holmes and Bateman2016) revealed that among immigrants, darker skin is an impediment to acquiring cash accounts, mortgages, and stocks.
In a follow-up study, Painter and colleagues (Reference Painter, Noy and Holmes2020) extended their test of the preference for Whiteness hypothesis using unique data from the 2014 and 2016 waves of the Latin American Public Opinion Project (LAPOP) to assess the association between skin tone and wealth attainment, where wealth is defined by three separate material assets: homeownership, car ownership, and motorcycle ownership. They find, among other things, that respondents with darker skin tones have more difficulty than their lighter-skinned counterparts acquiring motor vehicles but less trouble acquiring houses. Painter and colleagues (Reference Painter, Noy and Holmes2020) uncovered a considerable amount of cross-national variation in support of the preference for Whiteness hypothesis throughout Latin America. When it comes to homeownership, the preference for Whiteness hypothesis was only supported in three of the eighteen (17%) countries they examined, and for motorcycle ownership and car ownership the hypothesis was supported in 28% and 44% of the countries they studied, respectively. Thus, among the three indicators of wealth they employ, the car ownership/skin tone relationship most closely supported the preference for Whiteness hypothesis. Based on their findings, Painter and associates called for additional research to “examine how and whether these inequalities map onto other measures of wealth” (p. 3915). To that end, we extend the work of Painter et al. (Reference Painter, Noy and Holmes2020) beyond the examination of three material assets (houses, cars, and motorcycles) by using a more comprehensive and robust measure of wealth that considers a fuller array of respondents’ household characteristics and material possessions. Specifically, as we detail below, we employ a composite wealth measure comprised of multiple material assets. We regard this composite wealth measure as more comprehensive than the three individual assets studied by Painter et al. (Reference Painter, Noy and Holmes2020), and likely more sensitive to contextual variation across Latin American countries (Córdova Reference Córdova2009; Telles and Paschel, Reference Telles and Paschel2014), a common concern in cross-national comparative research.
Finally, we also build on Painter and colleagues’ (Reference Painter, Noy and Holmes2020) work in that they use data from the 2014 and 2016 waves of the Americas Barometer surveys drawn from the Latin American Public Opinion Project (LAPOP), whereas we employ a more recent 2018 wave of the data that includes surveys from Mexico and Brazil, two major Latin American countries examined in prior research (Campos-Vazquez and Medina-Cortina, Reference Campos-Vazquez and Medina-Cortina2019; Flores and Telles, Reference Flores and Telles2012; Monk Reference Monk2016; Villarreal Reference Villarreal2010), but missing from the Painter et al. (Reference Painter, Noy and Holmes2020) study. We agree with Painter and associates’ expectation that an analysis of these missing countries would “provide valuable insight into skin tone stratification and wealth inequality” (p. 3915). As such, we include the missing countries in our analysis. Based on the Painter et al. (Reference Painter, Noy and Holmes2020) study, we expect to find––and the data bear this out––strong support for the preference for Whiteness hypothesis as it relates to the skin tone/wealth association throughout Latin America—including, as we establish for the first time, Mexico and Brazil. This is particularly noteworthy given that both Mexico and Brazil are countries in which high status dark elites have adopted a system of racial mixture (or mestizaje) over Whiteness while simultaneously diminishing the significance of African and indigenous heritage (McNamee Reference McNamee2020). While we do not offer specific predictions for each country, we are mindful of variation in the effects of colonization and slavery, racial self-classification, nation-building narratives, mestizaje, and the fluidity of whitening and darkening in the region (McNamee Reference McNamee2020; Roth et al., Reference Roth, Solís and Sue2022; Telles Reference Telles2014; Telles and Paschel, Reference Telles and Paschel2014).
Data and Methods
We draw on unique data from the 2018 Latin American Public Opinion Project (LAPOP), a cross-sectional, nationally representative, face-to-face survey in twenty-six countries. We restrict our analysis to sixteen countries for which detailed information is available on respondents’ occupational status, material wealth, and other factors described below. These sixteen countries represent 90% of the Latin American population (World Bank 2019).
Analytical Strategy
We first analyze all sixteen Latin American countries combined, then individually. The number of participants in each country is as follows: Mexico (1,580), El Salvador (1,511), Honduras (1,560), Nicaragua (1,547), Costa Rica (1,501), Panama (1,559), Colombia (1,663), Ecuador (1,533), Bolivia (1,682), Peru (1,514), Paraguay (1,515), Chile (1,638), Uruguay (1,581), Brazil (1,425), Argentina (1,528), and the Dominican Republic (1,516), rendering a total of 24,853 respondents. Our analytical strategy is to report, for each country, any statistically significant association between census-based race categories, interviewer-rated skin tone, and our two dependent variables (occupation and wealth), while also reporting instances of non-significance. In some countries the association may be strong, but in others it may be weak or nonexistent. Our goal is to report these differences when they occur to offer a fuller picture of these relationships.
To explore how social stratification is shaped by race and skin color in Latin America, we examine two variables: occupational status and wealth. The correlation between occupational status and wealth is .330 across all countries, suggesting that they tap into different dimensions of socioeconomic status.
Dependent Variable 1: Occupational Status
Our first dependent variable is occupational status, coded as a categorical measure that includes high-level white-collar positions (directors and managers, professionals, scientists, intellectuals, associate professionals), mid-level occupational positions (administrative support staff, service workers, armed occupations) and lower-level manual positions (mechanical, craft, trade, plant machine operators, farmers and agriculture, and elementary occupations).Footnote 11 This measure fully captures the occupational distribution of the formal economy found in all Latin American countries.
Dependent Variable 2: Material Wealth
Our second dependent variable is an indicator of respondents’ material wealth. The 2018 LAPOP survey asked respondents about their householdFootnote 12 characteristics, including indoor plumbing, an indoor bathroom, and a host of durable assets, such as a television, refrigerator, conventional telephone, cell phone, washing machine, microwave oven, internet access, computer, and number of vehicles (1–3). From these questions, we created a wealth index, following Córdova (Reference Córdova2009).Footnote 13 In 2010, the LAPOP implemented a weighting system for constructing wealth indexes based on assets that rely on Principal Component Analysis (PCA). PCA allows the wealth index to be sensitive to contextual variation in terms of both urban versus rural differences and variations across countries that may intersect with skin tone. This includes a wealthy country like Argentina versus a poorer country such as Bolivia.Footnote 14 Deon Filmer and Lant Pritchett (Reference Filmer and Pritchett2001) popularized the use of PCA to estimate wealth levels by replacing income or consumption data with asset indicators. Many other studies, particularly in the fields of economics and public policy, have followed Filmer and Pritchett’s lead by employing PCA to estimate wealth effects (Alkire and Santos, Reference Alkire and Santos2011; Labonne et al., Reference Labonne, Biller and Chase2007; McKenzie Reference McKenzie2005; Minujin and Bang, Reference Minujin and Bang2002; Vyass and Kumaranayake, Reference Vyass and Kumaranayake2006). Importantly, the wealth index derived from LAPOP data has strong internal validity and is a more comprehensive measure of wealth than a single indicator.Footnote 15 Using multiple indicators to measure a construct enhances its reliability by minimizing random error associated with individual items (Carmines and Zeller, Reference Carmines and Zeller1979, Nunnally and Bernstein, Reference Nunnally and Bernstein1994, DeVellis Reference DeVellis and Thorpe2021). Our composite measure includes over ten different material assets, including car and motorcycle ownership, providing a more comprehensive and accurate predictor of wealth than used in previous studies (e.g., Painter et al., Reference Painter, Noy and Holmes2020). We then computed quintiles of wealth indexes for each country to examine the wealth status of respondents.
Supplemental Analysis: Occupational Status and Material Wealth
To our knowledge, only Painter and colleagues (Reference Painter, Noy and Holmes2020) have employed a measure of respondents’ material assets to study the extent of skin tone and racial inequality throughout Latin America. By way of extension, and for the first time, we compare the effects of self-identified census-based race versus interviewer-rated skin tone ratings on occupational status and wealth. It is important to conceptually distinguish occupational status from material wealth as a measure of socioeconomic status. As units of analysis, researchers have employed each indicator in the comparative study of social mobility both within countries and cross-nationally. To be sure, while both measures serve as indicators of a person’s location within the social stratification system, they tap into very different dimensions of social status. An occupation, for example, is “a cluster of job-related activities constituting a single economic role that is usually directed toward making a living” (Hodson and Sullivan, Reference Hodson and Sullivan1995, p. 49). Occupations can be measured in a myriad of ways. To be consistent with prior literature, we employ Monk’s (Reference Monk2016) operationalization of occupational status. Wealth, on the other hand, may be defined as “property; it is the value of things people own” and it is typically calculated by subtracting a person’s total liabilities from their total assets (Keister Reference Keister2000, p. 6). As noted above, we build on prior research that has demonstrated the utility of an alternate measure of wealth that has been used to study socioeconomic inequality and its relationship to skin tone and self-identified race throughout Latin America (Painter et al., Reference Painter, Noy and Holmes2020). While occupations can be used to produce wealth—especially material assets, the two are conceptually and, as we show below, empirically distinct. That is, as a proxy for one’s position within the social stratification order, material wealth captures far more inequality rooted in skin tone and self-identified race than occupational status in most of the Latin American countries we observe. In addition to our descriptive analysis, we use ordered logit models to predict occupational status and material wealth. This approach is consistent with prior examinations of the skin tone/occupational status relationship, as is the use of weighted models to maintain national representativeness within countries (Monk Reference Monk2016).Footnote 16
Focal Predictors
We employ two focal predictors. First, for the interviewer-rated skin tone measure, interviewers were asked to use a color chart consisting of eleven skin tone colors ranging from very light (1) to very dark (11) to match the facial skin tones of each respondent. This type of skin tone indicator has been used in multiple race-based studies in the United States and Latin America (Gullickson Reference Gullickson2005; Keith and Herring, Reference Keith and Herring1991; Keith et al., Reference Keith, Lincoln, Taylor and Jackson2010; Massey and Sanchez, Reference Massey and Sanchez2010; Monk Reference Monk2015, Telles et al., Reference Telles, Flores and Urrea-Giraldo2015). However, we acknowledge the possibility of interviewer bias in ratings across skin tones and genders given what we know about the propensity to classify women as White more so than men (Telles Reference Telles2014; Telles and Flores, Reference Telles and Flores2013; Roth et al., Reference Roth, Solís and Sue2022). To be consistent with prior studies (e.g., Monk Reference Monk2016), we also collapsed the eleven-category skin tone variable into five categories: white (1, 2), light brown (3, 4), medium brown (5, 6), dark brown (7, 8, 9), and black (10, 11). By merging this measure into five categories, we account for any possible noise in the data caused by interviewers choosing between ratings that are similar on the skin color scale. However, for comparison purposes, we also included the original eleven-category variable in our models and found the results to be comparable, albeit stronger for the five categories on the skin tone coefficient.
Second, we also employ census-based self-identified race categories, which are the most used measures of ethnoracial identity in Latin American countries. Respondents were asked to self-classify themselves as pardo (Brown), preto (Black), branco (White), Indigenous or other. Because interviewers are instructed to match the respondents’ facial skin color to the color palette at the beginning of the survey, interviewer-rated skin color measures are said to be more objective than other measures of skin color (Flores and Telles, Reference Flores and Telles2012), including self-identified census-based measures. One of our chief goals is to determine which identity measure provides a stronger effect when examining occupational status and material wealth throughout Latin America net of statistical controls.
Control Variables
Consistent with prior research, we control for age and gender (Telles et al., Reference Telles, Flores and Urrea-Giraldo2015). Age is a continuous variable from sixteen to ninety-seven, and gender is coded 1 = female; 0 = male. Education is a continuous measure ranging from zero to eighteen years. We also control for marital status using a dummy variable, where 1 = married, civil union, and common law marriage, and 0 = single, widowed, or divorced. We consider employment status as well, where 1 = working, and/or not working but have a job. In addition, we control for place of residence (1 = rural, 0 = urban), given its role in prior skin color studies (Monk Reference Monk2016), and for regional location/strata (estrapopri). Finally, we are sensitive to the problem of reverse causality between skin color, race, and socioeconomic status (Telles Reference Telles2004; Telles and Paschel, Reference Telles and Paschel2014). Previous research has identified factors that can affect interviewers’ appraisals of skin color or ethnoracial classification, including interviewers’ own skin color and socioeconomic status. Our data only provides information on the interviewer’s skin tone and gender, which we included in our models, and found more robust results when adding interviewers’ characteristics as controls.
Missing from our analysis is control for parents’ socioeconomic status (SES). The importance of parent’s SES as a predictor of respondent’s socioeconomic outcomes has been well established in the social stratification literature based on both U.S. and Latin American samples (Blau and Duncan, Reference Blau and Dudley1967; Behrman et al., Reference Behrman, Gaviria, Székely, Birdsall and Galiani2001; Flores and Telles, Reference Flores and Telles2012; Torche and Spilerman, Reference Torche and Spilerman2009). Indeed, including such measures allows researchers to pinpoint two types of discrimination: one based on previous generations (via parents SES effects), the other based on contemporary discrimination (via respondent’s SES effects), however, the distinction is not completely clear-cut (Villarreal Reference Villarreal2012). Absent a measure of parental SES, researchers have confined their inquiries to the total effect of skin color (via respondent’s SES) which is assumed to be an accumulation of both previous and present discrimination (Villarreal Reference Villarreal2012). In line with this precedent, we are interested in measuring the total effect of skin color (and race) on two socio-stratification outcomes (occupational status and wealth)—an inquiry that does not require distinguishing between previous and contemporary forms of discrimination. As with prior research, we use ordered logistic regression as our primary multivariate technique (Flores and Telles, Reference Flores and Telles2012; Hunter Reference Hunter2005; Keith and Herring, Reference Keith and Herring1991; Monk Reference Monk2016; Villarreal Reference Villarreal2010). We perform the same multivariate analyses for both dependent variables. As a robustness check, we also ran OLS regression models for both outcomes and the results were comparable. We begin by assessing census-based race categories (Table 1, model 1), then examine interviewer-rated skin tone with two different specifications—its original eleven categories in model 2, and the modified measurement with five categories in model 3. In models 4 and 5, we repeat this exercise but include census-race categories as controls. In model 6, we examine how nonwhite affects the dependent variable without controlling for other race or skin tone variables, and then we control for skin tone in models 7 and 8. All analyses are weighted to take into account the complex design of the survey, as recommended by LAPOP. The coding scheme, summary statistics, and additional robustness tests are shown in Appendices A1-A4.
Ologit Regression Coefficient Output for Occupational Status, Latin America

Table 1. Long description
Content flagged by safety filters.
Standard errors in parentheses.
*** p<0.001, ** p<0.01, * p<0.05, + p<0.10.
Note: controls not shown in all models include age, gender, marital status, employment status, education, rural/urban location, interviewer’s skin color, interviewer’s gender, and fixed-effects for country.
Findings
Occupational Status, Skin Tone, and Self-Designated Race
Figure 1 displays the percentage of respondents in each occupational category classified as White, light Brown, medium Brown, dark Brown, and Black. Consistent with prior literature, we found a relatively linear relationship between skin tone and occupational status in Latin America: lighter skin is associated with higher occupational status and darker skin with lower occupational status. For example, 28.82% of directors and managers (the highest occupational category) are White, compared to 12.37% of workers in elementary occupations (lowest occupational category).
Skin tone by occupational status for 16 Latin American countries.

Figure 1. Long description
From top to bottom, the y axis lists Directors and Managers, Professionals Scientists Intellectuals, Technicians Associate Professionals, Administrative Support Staff, Service Workers and Sales Worker, Armed Forces Occupations, Mechanical Craft Related Trade Workers, Plant Machine Operators Assemblers, Farmers and Skilled Agricultural, and Elementary Occupations. The x axis is labeled Percent of Respondents by Occupation, ranging from 0 to 100. Each occupation is represented by a horizontal bar divided into five segments by skin color, coded by the PERLA palette: White (1 2), Light Brown (3 4), Medium Brown (5 6), Dark Brown (7 8 9), and Black (10 11). Directors and Managers, Professionals, and Technicians have the largest proportions of White and Light Brown segments, with very small Black segments. As the list moves downward, the proportion of Medium Brown, Dark Brown, and Black segments increases, with Elementary Occupations and Farmers and Skilled Agricultural showing the largest shares of Dark Brown and Black. The legend at the bottom explains the skin color codes.
Relative to their White, light Brown, and medium Brown counterparts, fewer dark Brown and Black respondents occupy white-collar occupational positions. Finally, Figure 1 shows a surprisingly small proportion of respondents classified as either dark Brown or Black throughout the entire occupational structure compared to lighter skin tone classifications.
Next, we turn to our ordered logistic regression models, designed to test the expectations that skin tone is positively associated with occupational status (preference for Whiteness), and that interviewer-rated skin tone is a stronger predictor of occupational status than self-classified race, net of important background factors.
Our findings corroborate, but also extend, prior research in several respects. First, the results of the ordered logistic regression analysis presented in Models 1 and 4 of Table 1 indicate that census-based, self-classified race categories are not significantly associated with a respondent’s occupational status when controlling for educational attainment and other sociodemographic characteristics (e.g., gender, age, marital status, and region). By comparison, as in prior studies, interviewer-rated skin tone strongly predicts a respondent’s occupational status, as illustrated in Model 2 (b = −0.0516, p < .001) and Model 3 (b = −0.100, p < .001). In fact, even when census-based race categories are included together in the same model, interviewer-rated skin tone remains statistically significant (see Model 4, b = −0.0477, p < .001; and Model 5, b = −0.0872, p < .01). Further, the results in Table 1 (Model 2) show that for each one-unit increase in skin tone (from lighter to darker), the odds of being in a higher category of occupational status decrease by 5.03 percent (1- exp(β1) = 1-exp [−0.0516]) when looking at the original eleven interviewer-rated skin tone categories. For comparison purposes, we collapsed the skin tone measure into five categories (Model 3) and found that the odds of being in a higher occupational category decrease by 9.52 percent for each one-unit increase in skin tone (1 light to 5 dark).
To gain more insight into the occupational status/skin tone connection, we estimated the relative odds of being in a higher occupational category based on the interviewer’s rating of respondent’s facial skin tone for each of the eleven skin tone categories net of background factors (e.g., age, gender, marital status, education, region; see Monk Reference Monk2016). We estimated exp(β1) and the multiplicative effect of each one-unit increase in
$ \chi $
 , adjusting for the other variables. The result of this procedure, displayed in Figure 2, reveals a more sobering interpretation of the skin tone/occupational status association than previously uncovered. In particular, Figure 2 shows that the ordered logic regression results have a multiplicative effect: the predicted odds of having a high-status occupation decrease dramatically for darker-skinned individuals net of all statistical controls. The darkest respondents in our sample (category 11) are 40.31% less likely than the lightest respondents (reference category) to be in a higher occupational position. Said differently, as skin tone darkens, the relative odds of being in a higher position of occupational status decrease precipitously.
Relative odds of being in a higher occupational status category by skin tone.

In further support of our expectation, we found that the measure of interviewer-rated skin tone is also a stronger predictor of occupational status than the binary, nonwhite variable. Thus, when looking at people’s skin tone instead of using their self-selected census category, there is a more accentuated racial disparity in occupational status that is obscured when census categories combine Black and Pardo respondents of different skin tones in the “nonwhite” category. These results echo previous research suggesting that a singular focus on self-identified racial categories or binary variables (nonwhite) misses important dimensions of socioeconomic inequality (Bailey et al., Reference Bailey, Saperstein and Penner2014; Monk Reference Monk2016; Telles et al., Reference Telles, Flores and Urrea-Giraldo2015). Finally, additional robustness tests revealed that the effect size for interviewer-rated skin tone is much larger and significant in comparison to census-based categories (see Appendix A4).Footnote 17 This is particularly true in model 4 and 5, when controlling for census-categories, but even when comparing the use of skin tone (models 2 and 3) with census-based categories (model 1), we see that the effect size for skin tone is about twice the effect of the census-based race categories.
Variation by Country
An important contribution of this study is our multi-country analysis, which is rooted in the assumption that the relationships we uncover may vary from one Latin American country to another. As scholars have noted, such heterogeneity may be driven by a host of factors including between-country differences in nation-building narratives, multiculturalism, and the influence of Black/indigenous mobilization (McNamee Reference McNamee2020; Telles and Flores, Reference Telles and Flores2013; Telles and Paschel, Reference Telles and Paschel2014; Roth et al., Reference Roth, Solís and Sue2022). To explore this possibility, in Figure 3, we display the association between skin tone and occupational status in each of the sixteen Latin American countries, holding constant respondents’ age, gender, education, marital status, rural/urban location, subnational region, and interviewers’ gender and skin tone. Each point represents the predicted change in occupational status when skin tone is changed from its minimum value (0, the lightest skin tone) to its maximum value (1, the darkest skin tone).Footnote 18
Occupational status by skin tone net of background factors (Model 2 of Table 2).
Note: Horizontal bars represent 95% confidence intervals; if the horizontal confidence interval does not cross the vertical line at zero, then the effect of skin tone is statistically significant at p<.05 or lower.

Figure 3. Long description
The chart is a horizontal dot plot with the y axis listing 16 countries from top to bottom: Nicaragua, Chile, Panama, Colombia, Ecuador, El Salvador, Honduras, Brazil, Paraguay, Costa Rica, Peru, Bolivia, Dominican Republic, Uruguay, Mexico, and Argentina. The x axis is labeled Effect, ranging from negative four to one. Each country has a red diamond representing the estimated effect of skin tone on occupational status, with a horizontal black line indicating the 95 percent confidence interval. The vertical dashed line at zero marks the threshold for statistical significance. Nicaragua, Chile, Panama, Colombia, Ecuador, El Salvador, and Honduras have effects near zero with confidence intervals crossing zero. Brazil, Paraguay, Costa Rica, Peru, Bolivia, Dominican Republic, Uruguay, Mexico, and Argentina show increasingly negative effects, with Argentina having the most negative effect. For several countries, the confidence intervals do not cross zero, indicating statistically significant negative effects of skin tone on occupational status.
Figure 3 shows that when comparing individual countries, there is limited support for the preference for Whiteness hypothesis, in that, the association between skin tone and occupational status is mixed at best. In only four of the sixteen countries (25%) is there a positive association between skin tone and occupational status. Interestingly, this pattern prevails in countries that have a strong history of White identification (Uruguay and Argentina), and countries that have embraced both Mulatto identity (Dominican Republic) and indigenous and multicultural identification (Mexico). In Mexico, even when controlling for self-selected census categories, skin tone is significant (p < .05), with a one-unit increase in the darkness of a respondent’s skin tone corresponding to 13.50 percent lower odds of having a higher-status occupation compared to others in Mexico (see Appendix A3). This result is consistent with those of Espino and Franz (Reference Espino and Franz2002), Villarreal (Reference Villarreal2010), and Telles (Reference Telles2014), who found that in Mexico, a country that adopted a national ideology of mestizaje, respondents with darker skin tone had significantly lower occupational status. The added contribution here is that our data shows that this finding extends to other countries with heterogeneous colonial legacies, in that, a one-unit increase in darkness of a respondent’s skin tone corresponds to 14.02% lower odds in Uruguay, 20.23% lower odds in Argentina, and 9.69% lower odds in Dominican Republic, of having a high-status occupation compared to others in those countries (Figure 3).Footnote 19
Interviewer-Rated Skin Tone versus Self-Classified Ethnoracial Identification by Country
As previously discussed, studies confirm that interviewer-rated skin tone is a stronger predictor of socioeconomic status than self-classified racial categories. As important as these studies are, they tend to be restricted to a single country or to a relatively small set of Latin American countries. Our analysis of sixteen Latin American countries largely comports with prior research, but there are key exceptions to this pattern that underscore the importance of our multi-country analysis.
To illustrate the variation, in Figure 4, we show the relationship between interviewer-rated skin tone versus self-classified racial categories and occupational status in each country, holding constant respondents’ gender, age, education, marital status, rural/urban location, subnational region, and interviewer skin color and gender. As in Figure 3, the horizontal bars represent 95% confidence intervals, this time however for both skin tone and self-designated race. Figure 4, illustrating Model 2 point estimates from Table 1, shows that interviewer-rated skin tone is a stronger predictor of occupational status than self-classified racial categories in two out of five countries in Central America,Footnote 20 five out of nine countries in South America,Footnote 21 plus Mexico and the Dominican Republic,Footnote 22 for a total of nine out of sixteen (56%) of the Latin American countries observed.Footnote 23 However, we find that skin tone is a statistically significant predictor of occupational status in only four countries.
Occupational status by race and skin color for Latin American countries net of background factors.
Note: Horizontal bars represent 95% confidence intervals; if the horizontal confidence interval does not cross the vertical line at zero, then the effect of skin color and/or designated racial categories is statistically significant at p < .05.

Figure 4. Long description
From top to bottom, the y-axis lists Argentina, Mexico, Uruguay, Dominican Republic, Bolivia, Peru, Costa Rica, Paraguay, Brazil, Honduras, El Salvador, Ecuador, Colombia, Panama, Chile, and Nicaragua. For each country, horizontal bars with markers represent estimated effects for racial categories and skin color, plotted along the x-axis labeled Effects, which ranges from negative four to positive two. Marker shapes are defined in the legend: open square for pardo, open diamond for black, open triangle for mestizo, x for indigenous, plus for other, and filled circle for skintone. Each marker is centered on a point estimate, with a horizontal line extending to indicate the ninety-five percent confidence interval. The vertical line at zero marks the threshold for statistical significance. If a confidence interval does not cross zero, the effect is statistically significant at p less than point zero five. Most effects cluster near zero, but some categories in countries such as Argentina, Mexico, and Brazil show intervals that do not cross zero, indicating significant occupational disparities by race or skin color. The distribution and length of intervals vary by country and category, with some countries showing wider intervals and others more tightly clustered estimates.
In sum, a positive association between light skin tone and occupational status is only present in 25% of the Latin American countries in our study—suggesting modest support at best for the preference for Whiteness hypothesis, and thereby limited evidence of widespread occupational-based colortocracies. Interviewer-rated skin tone is a more consistent and stronger determinant of occupational status than self-designated racial categories, and this pattern remains robust in nearly 70% of the Latin American countries in our data.
Material Wealth
Given the novelty of our wealth indicator, we begin by exploring how material wealth is related to skin tone. Using our eleven-point skin tone scale, cross-classified by our mean wealth index, Figure 5 shows that the lightest respondents in our sample enjoy the highest levels of wealth, while the darkest respondents register negative wealth. In Figure 5, we see clear evidence of a color fault line, whereby respondents who are coded 1 to 3 (lighter) on the skin tone scale experience positive mean wealth, while respondents coded 4 (darker) and above experience negative wealth.Footnote 24
Wealth by skin color in Latin America.

Having established a baseline association between material wealth and skin tone, we now examine whether the association remains once important control variables are considered. Thus, we turn to our ordered logit results that focus on the main effect of skin tone on wealth, employing (first together, then separately) self-identified census race categories and two versions of our interviewer-designated skin tone measure (i.e., eleven categories and five categories). The results, displayed in Table 2, provide strong support for the preference for Whiteness hypothesis: the expectation that lighter skin is associated with higher wealth and darker skin with lower wealth, net of control variables. In Model 1, we see that there is a strong association between self-classified race (i.e., Pardo/Brown, Black, Indigenous, other) and wealth. In particular, self-classified Whites (reference category) enjoy higher odds of having more wealth than their Brown, Black, Indigenous, and other race counterparts, even after controlling for sociodemographic background factors and interviewer skin color.
Ologit Regression Coefficient Output for Wealth Quintiles, Latin America

Table 2. Long description
Beginning at the top row, the VARIABLES column lists Pardo, Black/negro, Mestizo, Indigenous, Other, Skincolor, 5 cat skin tone, Nonwhite, Observations, and Country Dummies. For each variable, coefficients and standard errors are provided across eight models. Pardo shows coefficients of minus 0.285 (standard error 0.0651, p less than 0.001) in model 1, minus 0.109 in model 4, and minus 0.120 plus in model 5. Black/negro has minus 0.374 (0.0653, p less than 0.001) in model 1, minus 0.0499 in model 4, and minus 0.0750 in model 5. Mestizo displays minus 0.0497 in model 1, 0.0739 plus in model 4, and 0.0681 plus in model 5. Indigenous records minus 0.608 (0.0705, p less than 0.001) in model 1, minus 0.434 (0.0714, p less than 0.001) in model 4, and minus 0.440 (0.0715, p less than 0.001) in model 5. Other yields minus 0.371 (0.0753, p less than 0.001) in model 1, minus 0.217 (0.0778, p less than 0.01) in model 4, and minus 0.226 (0.0774, p less than 0.01) in model 5. Skincolor coefficients are minus 0.127 (0.00991, p less than 0.001) in model 2, minus 0.116 (0.0113, p less than 0.001) in model 4, and minus 0.125 (0.0109, p less than 0.001) in model 7. 5 cat skin tone coefficients are minus 0.251 (0.0194, p less than 0.001) in model 3, minus 0.225 (0.0219, p less than 0.001) in model 5, and minus 0.245 (0.0213, p less than 0.001) in model 8. Nonwhite coefficients are minus 0.170 (0.0336, p less than 0.001) in model 6, minus 0.00178 in model 7, and minus 0.0104 in model 8. Observations range from 20,274 to 21,436 across models. Country Dummies are marked Yes for all models. Significance levels are denoted by asterisks: three for p less than 0.001, two for p less than 0.01, one for p less than 0.05, and plus for p less than 0.10. Controls not shown include age, gender, marital status, employment status, education, rural or urban location, interviewer’s skin color, interviewer’s gender, and fixed-effects for country.
Standard errors in parentheses.
*** p<0.001, ** p<0.01, * p<0.05, + p<0.10.
Note: controls not shown in all models include age, gender, marital status, employment status, education, rural/urban location, interviewer’s skin color, interviewer’s gender, and fixed-effects for country.
With respect to interviewer-rated skin tone, the results in Model 2 (Table 2) indicate that for every one-unit increase in skin tone (from lighter to darker), the odds of being in a higher wealth quintile decrease by 11.93 percent (1- exp(β1) = 1-exp [−0.127]). This pattern, which is cumulative, increases substantially as skin tone darkens. To further illustrate this point, we calculated the relative odds of being in a higher wealth quintile by skin tone. The result of this procedure, displayed in Figure 6, shows a precipitous decline in the relative odds of being in a higher wealth quintile as skin tone darkens, net of all background factors. For example, the odds of being in a higher wealth quintile for someone in the darkest skin tone category are decreased by 72 percent (-71.92%).
Relative odds of being in a higher wealth quintile category by skin tone.

Consistent with prior research, when skin tone is reduced from eleven to five categories, there is an even greater incremental effect illustrated by the percentage gap. For example, Model 3 (Table 2) shows that a one-unit increase from lighter to darker skin tone decreases the odds of being in a higher wealth quintile by 22.74 percent (1-exp [−0.251]) net of all background factors. Further, the findings of Models 4 and 5 demonstrate that the relationship between race and wealth disappears for self-classified Blacks and Pardos once a respondent’s skin tone is considered. The same phenomenon is observed in Models 7 and 8, although “nonwhite,” a significant variable in Model 6, loses its significance once interviewer-rated skin tone is added to the model. Thus, as expected, these results show that above and beyond an individual’s self-classification into one of the census-based race categories, interviewer-rated skin tone remains a significant determinant of material wealth.
When looking at the standardized coefficients, we find that skin tone also has a much stronger effect on wealth than census-based categories (see Appendix A3). These findings suggest that using census-based race categories instead of skin tone can significantly downplay the actual effect of race on social stratification in Latin America.
Variation by Country
Our analysis of individual countries reveals that the results hold and are significant throughout Latin America, but some exceptions are worth reporting. Figure 7 shows the relationship between skin tone and material wealth in each country in Latin America, holding constant respondents’ age, gender, education, marital status, rural/urban location, subnational region, and interviewer skin color and gender.Footnote 25 The results reveal strong evidence of wealth-based colortocracies in that skin tone is largely predictive of material wealth in 81% (thirteen out of sixteen) of the Latin American countries we observe. The exceptions to this pattern include Chile, Colombia,Footnote 26 and Costa Rica,Footnote 27 countries with heterogenous colonial legacies where skin tone does not appear to determine material wealth accumulation.
Skin tone and material wealth in Latin America net of background factors.
Note: Horizontal bars represent 95% confidence intervals; if the horizontal confidence interval does not cross the vertical line at zero, then the effect of skin tone is statistically significant at p < .05.

Figure 7. Long description
The plot displays 16 Latin American countries listed vertically on the y axis: Chile, Colombia, Costa Rica, Honduras, Panama, Ecuador, Dominican Republic, Nicaragua, Mexico, Brazil, Argentina, Peru, Paraguay, El Salvador, Bolivia, and Uruguay. The x axis is labeled Effect, ranging from negative four on the left to one on the right. For each country, a red diamond marks the estimated effect of skin tone on wealth, with a horizontal black line representing the 95 percent confidence interval. The vertical dashed line at zero indicates no effect. All countries have negative effect estimates, with Uruguay and Bolivia showing the largest negative values near negative three, and Chile the least negative near negative one. Most confidence intervals do not cross zero, indicating statistically significant negative effects of skin tone on wealth in these countries.
Finally, in Figure 8, we display clear evidence in further support of the expectation that interviewer-rated skin tone is a stronger predictor of wealth than self-classified racial categories. The figure shows that the point estimate for interviewer-rated skin tone in Model 2 (of Table 2) is a stronger predictor than racial categories in thirteen out of sixteen countries. Importantly, however, we do find that racial categories are statistically significant in eight of the sixteen countries we examined. Thus, as with previous research (Telles et al., Reference Telles, Flores and Urrea-Giraldo2015), the data show that overall, skin tone is a stronger predictor of socioeconomic outcomes, but racial categories matter as well, albeit to a lesser extent.
Wealth by race and skin color in Latin America net of background factors.
Note: Horizontal bars represent 95% confidence intervals; if the horizontal confidence interval does not cross the vertical line at zero, then the effect of skin color and/or designated racial categories is statistically significant at p < .05.

Figure 8. Long description
The chart displays countries listed vertically on the y-axis: Uruguay, Bolivia, El Salvador, Paraguay, Peru, Argentina, Brazil, Mexico, Nicaragua, Dominican Republic, Ecuador, Panama, Honduras, Costa Rica, Colombia, and Chile. The x-axis is labeled Effects, ranging from negative four to positive two. For each country, multiple symbols represent racial categories: open square for pardo, open diamond for black, open triangle for mestizo, x for indigenous plus other, and filled circle for skin tone. Each symbol is centered on a value with a horizontal bar indicating the 95 percent confidence interval. The vertical line at zero marks no effect. In most countries, the filled circle (skin tone) is left of zero, often with confidence intervals not crossing zero, indicating statistically significant negative effects of darker skin tone on wealth. Other categories, such as black and indigenous, also show negative effects in several countries, with some intervals not crossing zero. The legend at the bottom decodes the symbols for each group.
Discussion
We began this study by conceptualizing colortocracies as systems privileging lighter skin. We framed this study around three previously understudied questions: How prevalent are occupational-based versus wealth-based colortocracies throughout Latin America? Is interviewer-rated skin tone a stronger predictor of socioeconomic status than self-designated race categories across a broader array of Latin American countries than previously examined or in just a few? And does the answer depend on the outcome measure in question: occupation versus wealth (two important indicators that have received relatively little attention in the literature)? The answers to these questions build on and significantly extend what was previously known about the relationship between skin tone, self-identified racial identity, and socioeconomic status in Latin America in the following ways.
First, this study shows that the strength of the evidence marking the presence of colortocracies and thereby support for the preference for Whiteness hypothesis throughout Latin America, largely depends on two factors: the socioeconomic outcome measure under consideration and the Latin American country in question. When the outcome measure is occupational status, we can only confirm the presence of a colortocracy (or preference for Whiteness) in four out of sixteen Latin American countries. These include countries with a legacy of Whiteness (Argentina, Uruguay) and countries with an ideological legacy of racial mixture or mestizaje (Mexico, Dominican Republic). In these countries we find evidence that lighter-skinned Latin Americans enjoy higher levels of occupational status than their darker-skinned counterparts. By contrast, when the outcome measure is material wealth, we find strong support for the preference for Whiteness hypothesis in thirteen out of sixteen Latin American countries. These also include countries that evince a White colonial legacy and countries with a history of racial mixture ideology. That this pattern prevails in so many of the Latin American countries we study despite significant variation in sociohistorical, political, and economic contexts, may speak to several factors including the greater utility of the composite wealth measure we use over occupational status as an indicator of socioeconomic status, the endurance of intergenerational wealth gaps across the region, and perhaps differences in the way those with little or no wealth are treated relative to those with considerable wealth. Our findings suggest that prior studies that have omitted material wealth as an outcome measure, or studies that employ limited indicators of wealth (e.g., home, car, or motorcycle ownership), may have underestimated the full extent of skin tone inequality in Latin America. Thus, we call on future researchers to make greater use of more comprehensive wealth measures as an indicator of status, especially in studies seeking to make cross-national comparisons throughout the region.
Second, our findings underscore previous research arguing that self-designated, census-based “race” identification and interviewer-determined “skin tone” are conceptually, empirically, and analytically distinct (Bailey et al., Reference Bailey, Loveman and Muniz2013; Foy and Ray, Reference Foy and Ray2019; Monk Reference Monk2016). But, importantly, whether interview-rated skin tone is stronger than self-designated race categories as a predictor of status also depends on the country and the outcome measure under consideration. When the outcome measure is occupational status (a traditional indicator of status in studies of social stratification), skin tone is statistically significant and a stronger predictor than racial categories in Latin America as a whole (all countries combined) in 25% of the countries we observed individually. However, when the outcome measure is material wealth, skin tone is a stronger predictor than racial categories (and is statistically significant) in over 80% of the countries analyzed individually—regardless of the colonial past or current racial ideology of the country. Thus, the greater utility of interviewer-rated skin tone over self-identified race categories is a function of both outcome measure and country. Furthermore, additional robustness tests show that the magnitude of the effect of interviewer-rated skin tone is much larger than self-designated race categories for both occupational status and for wealth, and in most cases skin tone is the only significant variable in the models examined (see Appendix A3). It is important to note that nearly all studies on ethnoracial inequality utilize self-identified race data. Therefore, this research holds significance as it evaluates the importance of the predominant race measure (self-identification) in comparison to interviewer-assessed skin color. We join a chorus of scholars calling for more careful consideration of these issues in future studies of socioeconomic inequality in Latin America (Bailey et al., Reference Bailey, Loveman and Muniz2013; Banton Reference Banton2012; Foy and Ray, Reference Foy and Ray2019; Golash-Boza Reference Golash-Boza2010; Monk Reference Monk2016; Saperstein Reference Saperstein2012; Telles Reference Telles2014; Telles et al., Reference Telles, Flores and Urrea-Giraldo2015). Prior research has almost exclusively used census-based race self-classification or a more collapsed binary category of “nonwhites” to examine the effect of race on different socioeconomic outcomes—a practice our study confirms can obscure more than it illuminates about socioeconomic disparities in general, but particularly as it relates to Black and Brown populations (Hasenbalg Reference Hasenbalg and Fontaine1985; Marteleto Reference Marteleto2012; Silva Reference Silva and Fontaine1985; Telles Reference Telles2004).
By including both census-based self-classification and interviewer-rated skin color in the same statistical models, this study examines whether either measure significantly predicts occupational status and wealth. This approach allows us to investigate the assumption that while race and skin color may overlap, they should not be treated as equivalent. The results show that skin tone matters above and beyond racial self-classification for social stratification. In fact, our Bayesian Information Criteria/Akaike Information Criteria (BIC/AIC) analyses indicate that the models using actual skin color, while controlling for self-classified race provide better goodness of fit for both outcomes (i.e., occupational status and wealth) (see Appendix A4). Consequently, our analysis makes an important contribution to the ongoing discourse on how distinct race and skin color truly are (Banton Reference Banton2012; Guimarães Reference Guimarães2012; Monk Reference Monk2016; Telles Reference Telles2012), by assessing their empirical effect independently and in combination.
As with prior research in this area, our study has several limitations. First, our cross-sectional design prevents us from asserting causation when it comes to the measures we employ. Relatedly, we are aware of the possibility of reverse causality between measures of ethnoracial identification and socioeconomic status (Telles et al., Reference Telles, Flores and Urrea-Giraldo2015), and the Brazilian trope that “money whitens” (Schwartzman Reference Schwartzman2007; Villarreal Reference Villarreal2010), in that increases in socioeconomic status can enhance the likelihood of self-classifying as White in Brazil (Telles Reference Telles2004; Telles and Lim, Reference Telles and Lim1998; Twine Reference Twine1998) and Mexico (Roth et al., Reference Roth, Solís and Sue2022), but not necessarily in other Latin American countries (Telles and Paschel, Reference Telles and Paschel2014). To address this important matter, we added controls for interviewer skin color and gender, and our results became even more robust. Still, to further uncover some of the mechanisms at play in our study, future research might consider a longitudinal design and/or more qualitative treatments of the subject.
Second, the wide confidence intervals representing several countries in Figures 4 and 8 are due to small sample sizes for designated racial categories in those countries. As more data becomes available, additional analysis should be conducted to test the robustness of these findings. Third, we use the broad occupational categories provided in the LAPOP survey. Using more detailed occupational categories such as the International Standard Classification of Occupations might result in a more fine-grained measurement of occupational status. However, we are unaware of a dataset that employs these categories across multiple Latin American countries while also collecting interviewer-rated skin tone information as found in the LAPOP survey. Fourth, the data on parental background and socioeconomic status is not available in the 2018 survey. Notwithstanding, we used the best and most recent data set available to date. Lacking a measure of parental background, we are unable to speak to the matter of inherited discrimination. Instead, when it comes to the roles skin color and race plays in limiting the socioeconomic life chances of Latin Americans, we interpret our results as more a reflection of cumulative discrimination and/or discrimination aimed at the survey respondent (Villarreal Reference Villarreal2010). Still, the inclusion of intergenerational SES and parental background variables into future waves of LAPOP could substantially shed light on this important issue.
Fifth, as with other studies (Roth et al., Reference Roth, Solís and Sue2022), we do not explore the gendered effects of skin color even though there is substantial evidence that women with similar status as men are more likely to be categorized as White and to be perceived by others as lighter in skin color (Telles Reference Telles2014; Telles and Flores, Reference Telles and Flores2013). This is indeed a fruitful area for future researchers to explore. Finally, even though we examined sixteen Latin American countries, accounting for 90% of the Latin American population (World Bank 2019), there are many Latin American countries that were not included in our data. To update and extend prior literature, we examined only Latin American countries that were available in the most recent LAPOP survey (2018), drawing on countries that also included both census racial categories and interviewer-rated skin color information for all respondents. Whether the patterns we observed in the countries we examined apply to other countries not included in our analysis is an empirical question worthy of future inquiry.
The ideologies linked to skin tone and race are major stratifying social forces throughout Latin America, but also in the United States and globally (Dixon and Telles, Reference Dixon and Telles2017). The source of these stratifying forces has been linked to the prevailing legacy of slavery and colonial ideology throughout the Americas. Skin tone intersects with contemporary racism, discrimination, and inequality to forge differential socioeconomic life chances among people of the same race and ethnic backgrounds. In this vein, skin tone can be viewed as a form of fungible social capital (Dixon and Telles, Reference Dixon and Telles2017) that can be converted into other forms of social capital, including social network access, symbolic capital (esteem and status), and, as demonstrated here, socioeconomic capital in the form of occupational status to some extent and material wealth accumulation to a much larger extent.
An important indicator of the widespread and growing preference for Whiteness around the world is evidenced by the “explosion of skin lightening and racial cosmetic surgeries” (Dixon and Telles, Reference Dixon and Telles2017, p. 411) since the 1980s. Documenting the rise of the multibillion-dollar and multinational skin lightening industry, Dixon and Telles (Reference Dixon and Telles2017) argue that the industry “capitalizes on the demand for lighter skin in exchange for massive profits,” thereby proving that “light skin preference and white supremacy have become increasingly united, globalized, and commodified” (p. 406). Some scholars have observed the quest for light skin through a deeper social psychological lens that views the obsession with light skin as both “fetishization” and “self-denigration” that is ultimately “pathological” in its full expression (Hall Reference Hall1995).
Our key takeaway is that skin tone and ethnoracial identity matter when it comes to determining the socioeconomic life chances of Latin American citizens, but the strength of the association varies by country and indicator under investigation. We have only scratched the surface when it comes to fully understanding the breadth of these patterns. We invite future researchers to join us as we attempt to document variation in the persistent significance of skin tone and ethnoracial identity throughout Latin America.
Supplementary material
The supplementary material for this article can be found at http://doi.org/10.1017/S1742058X26100137.


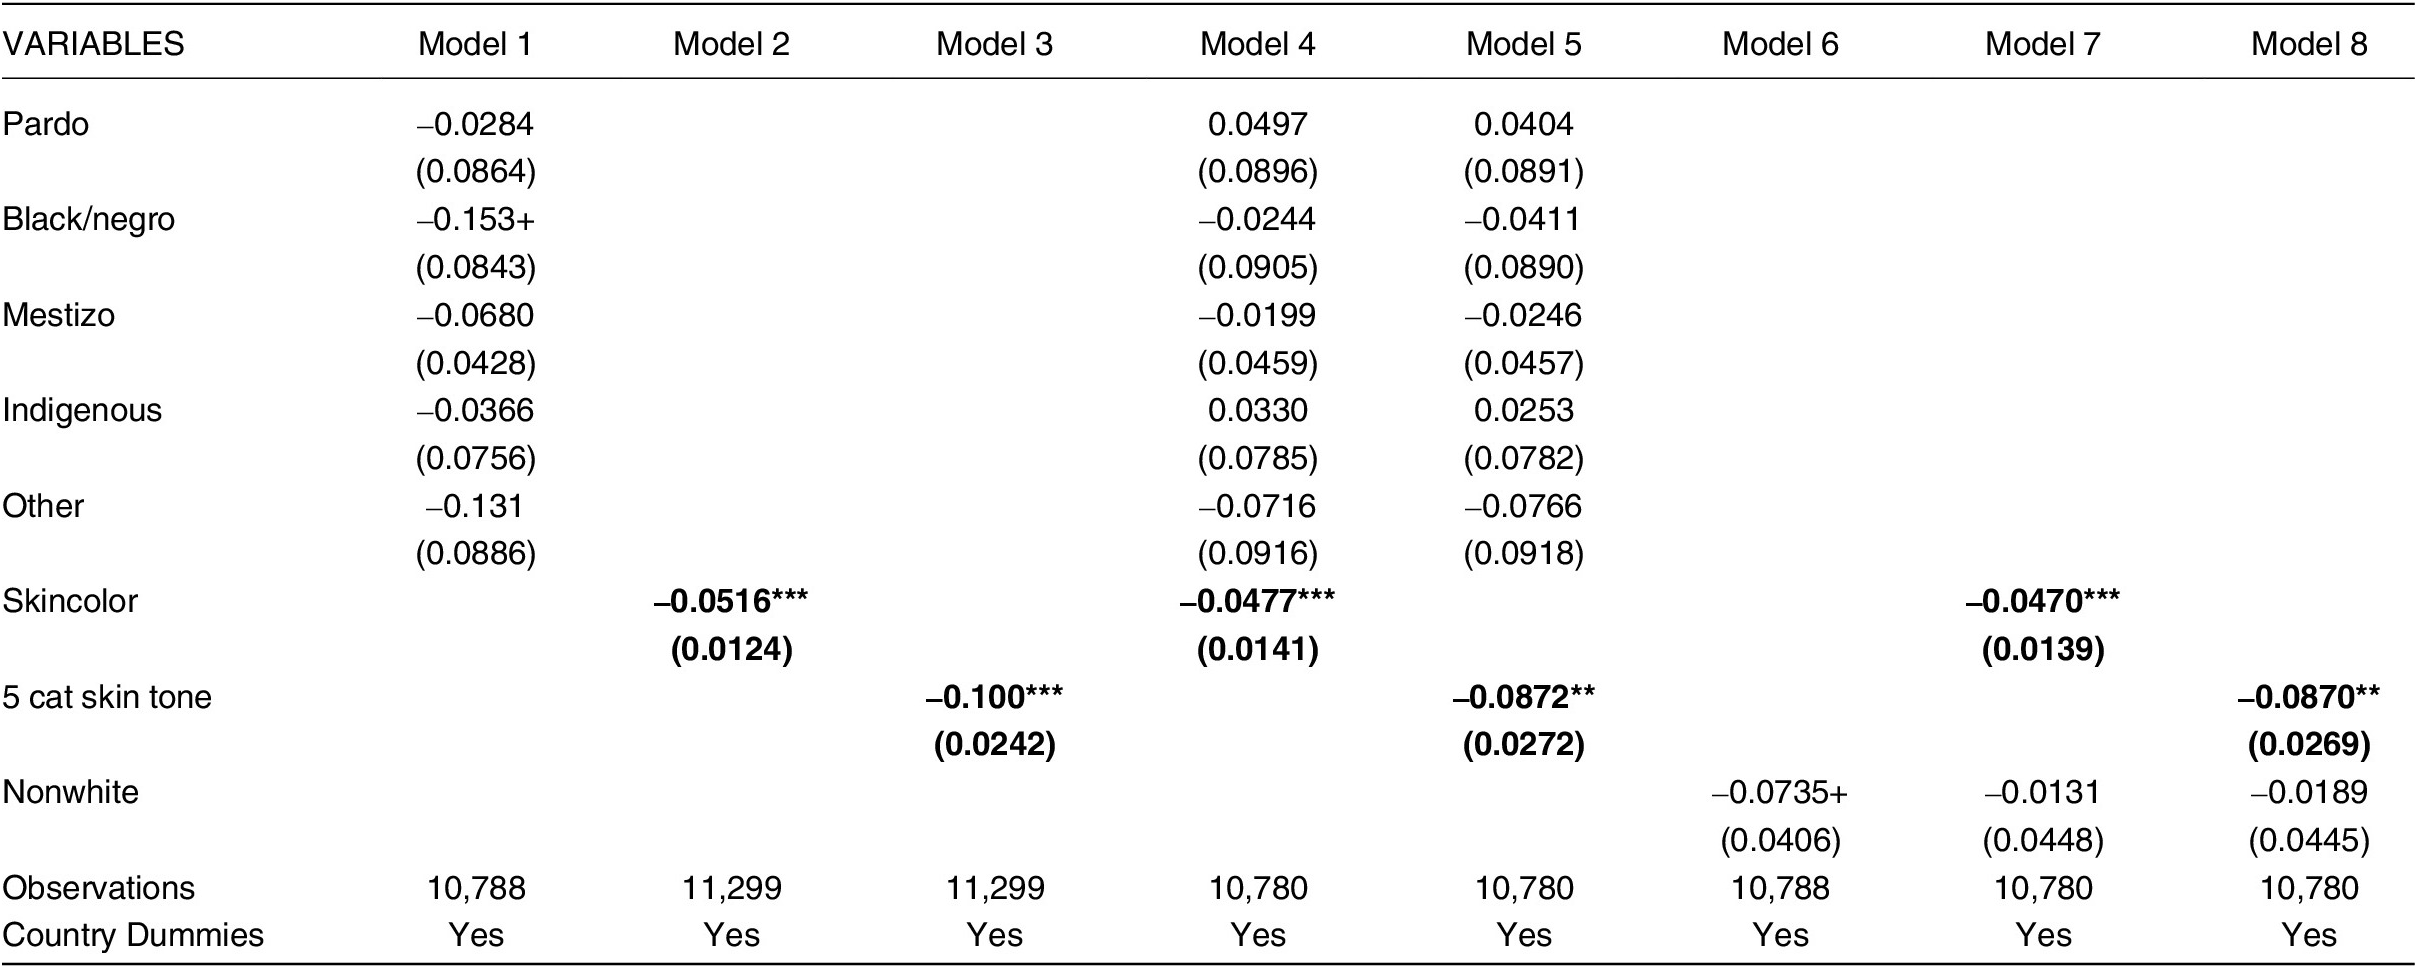
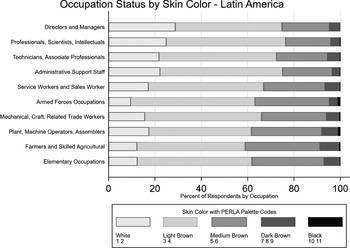
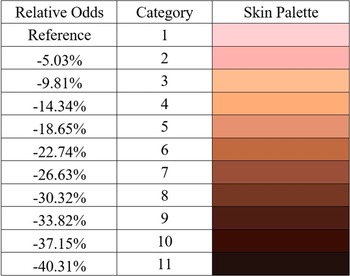
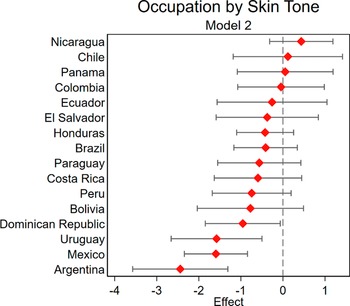
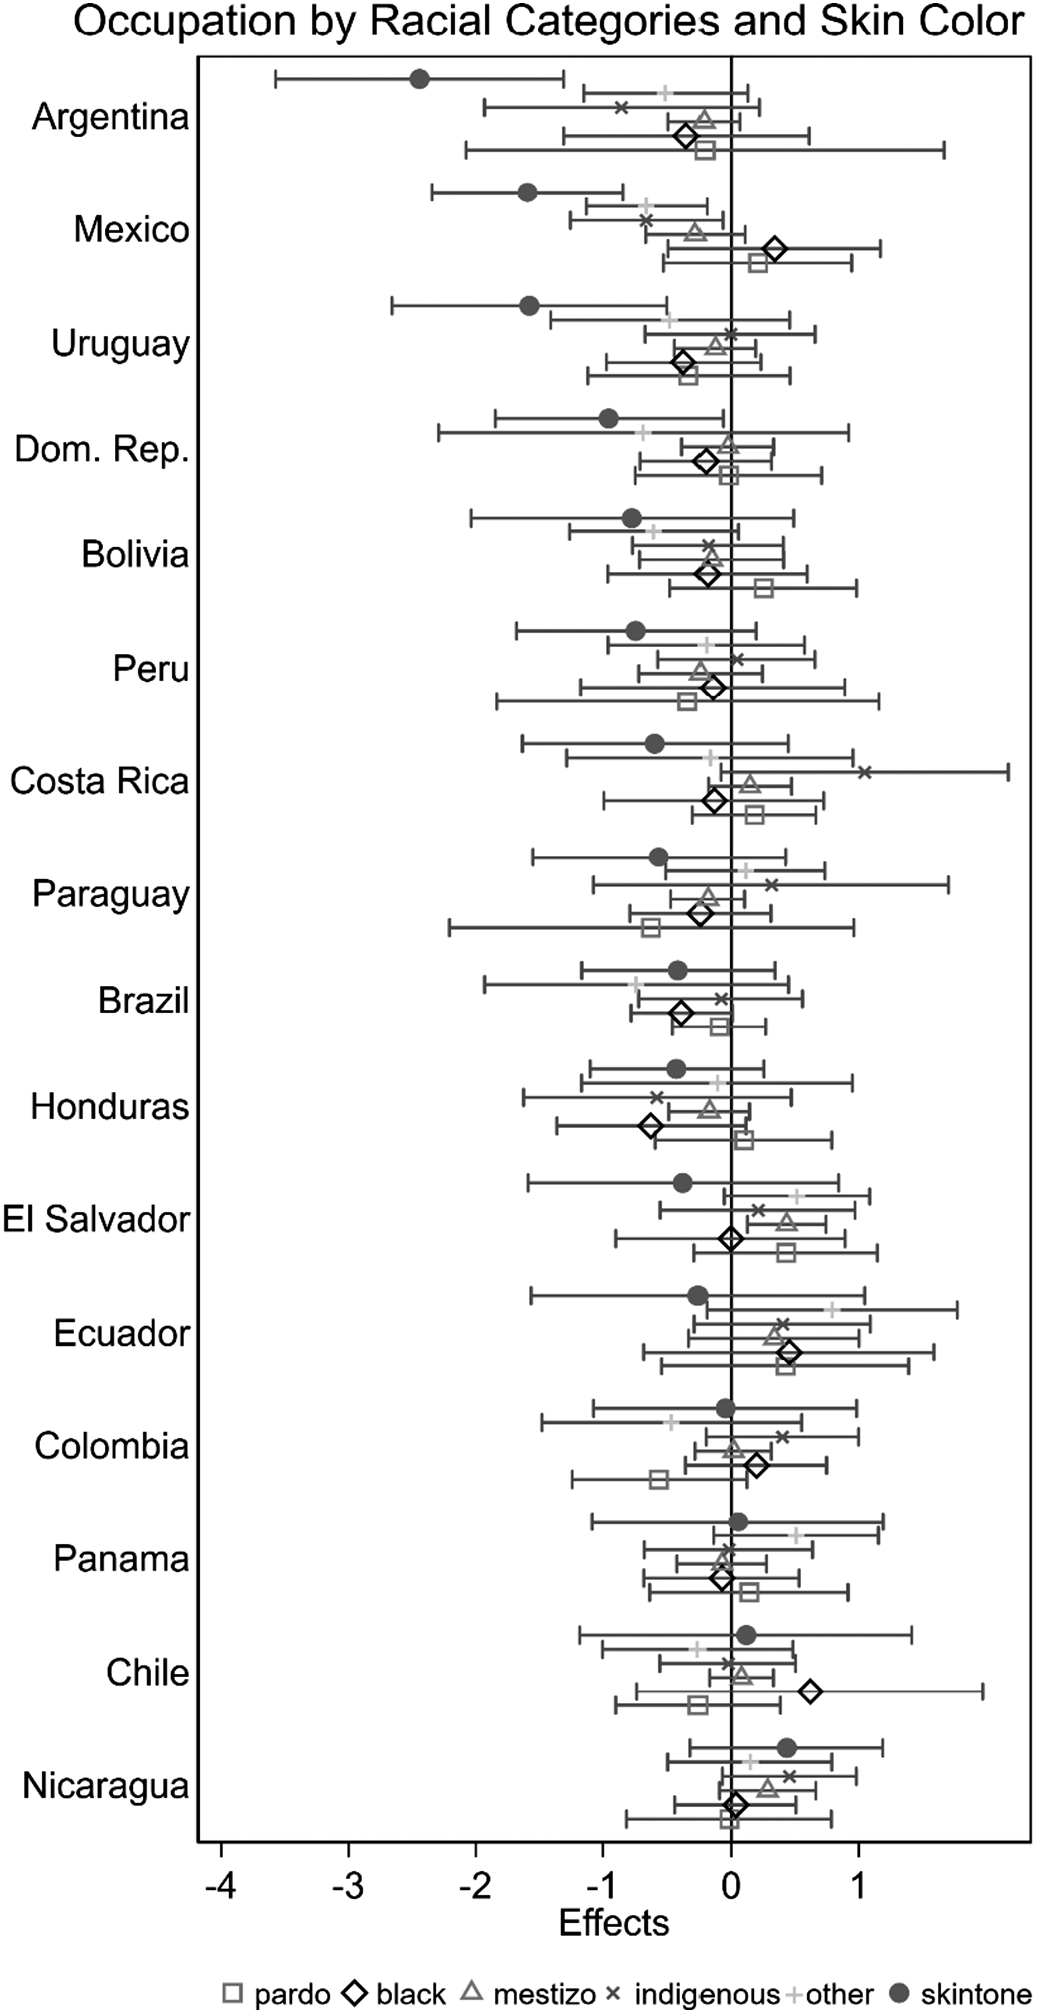
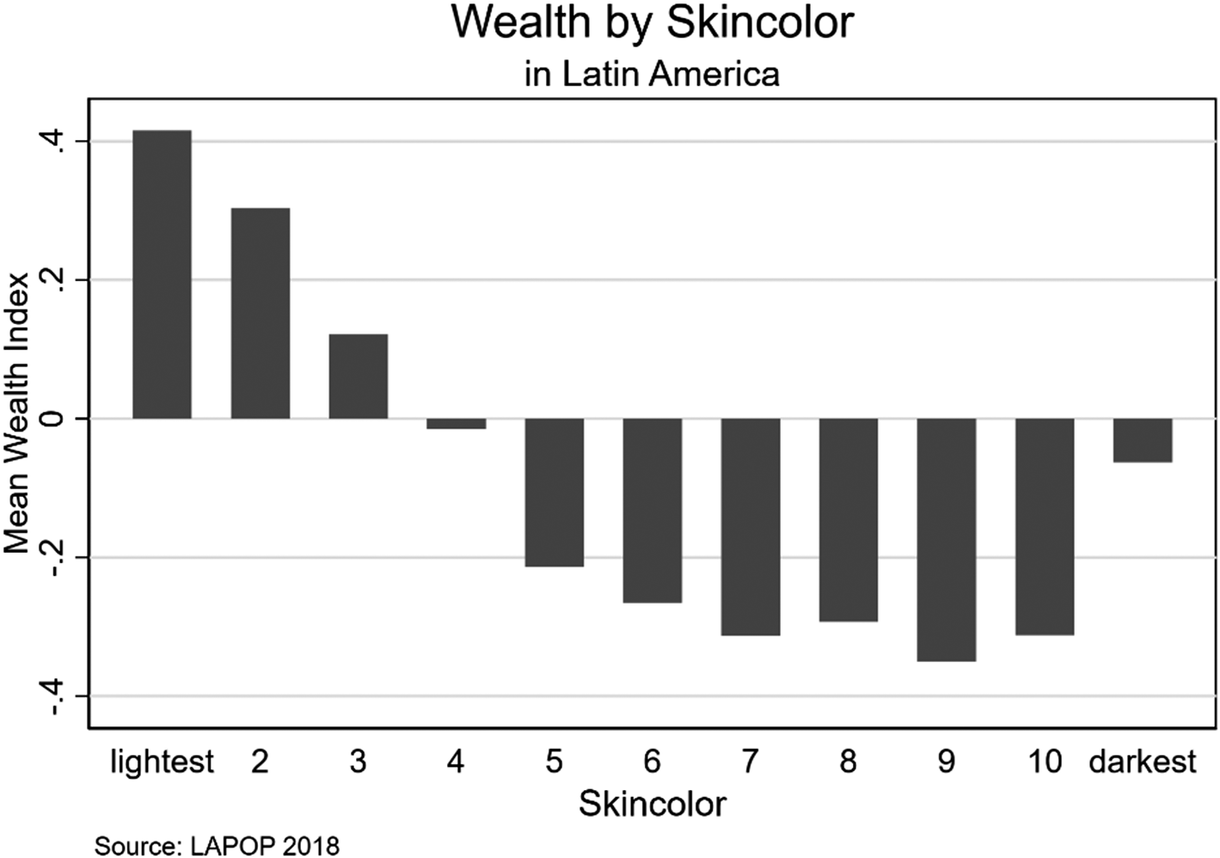
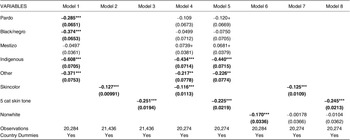
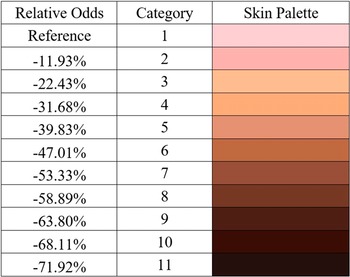
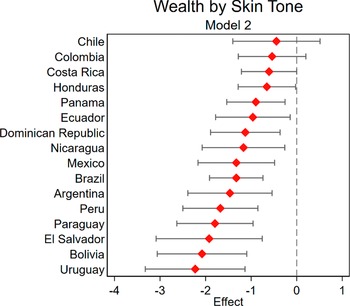
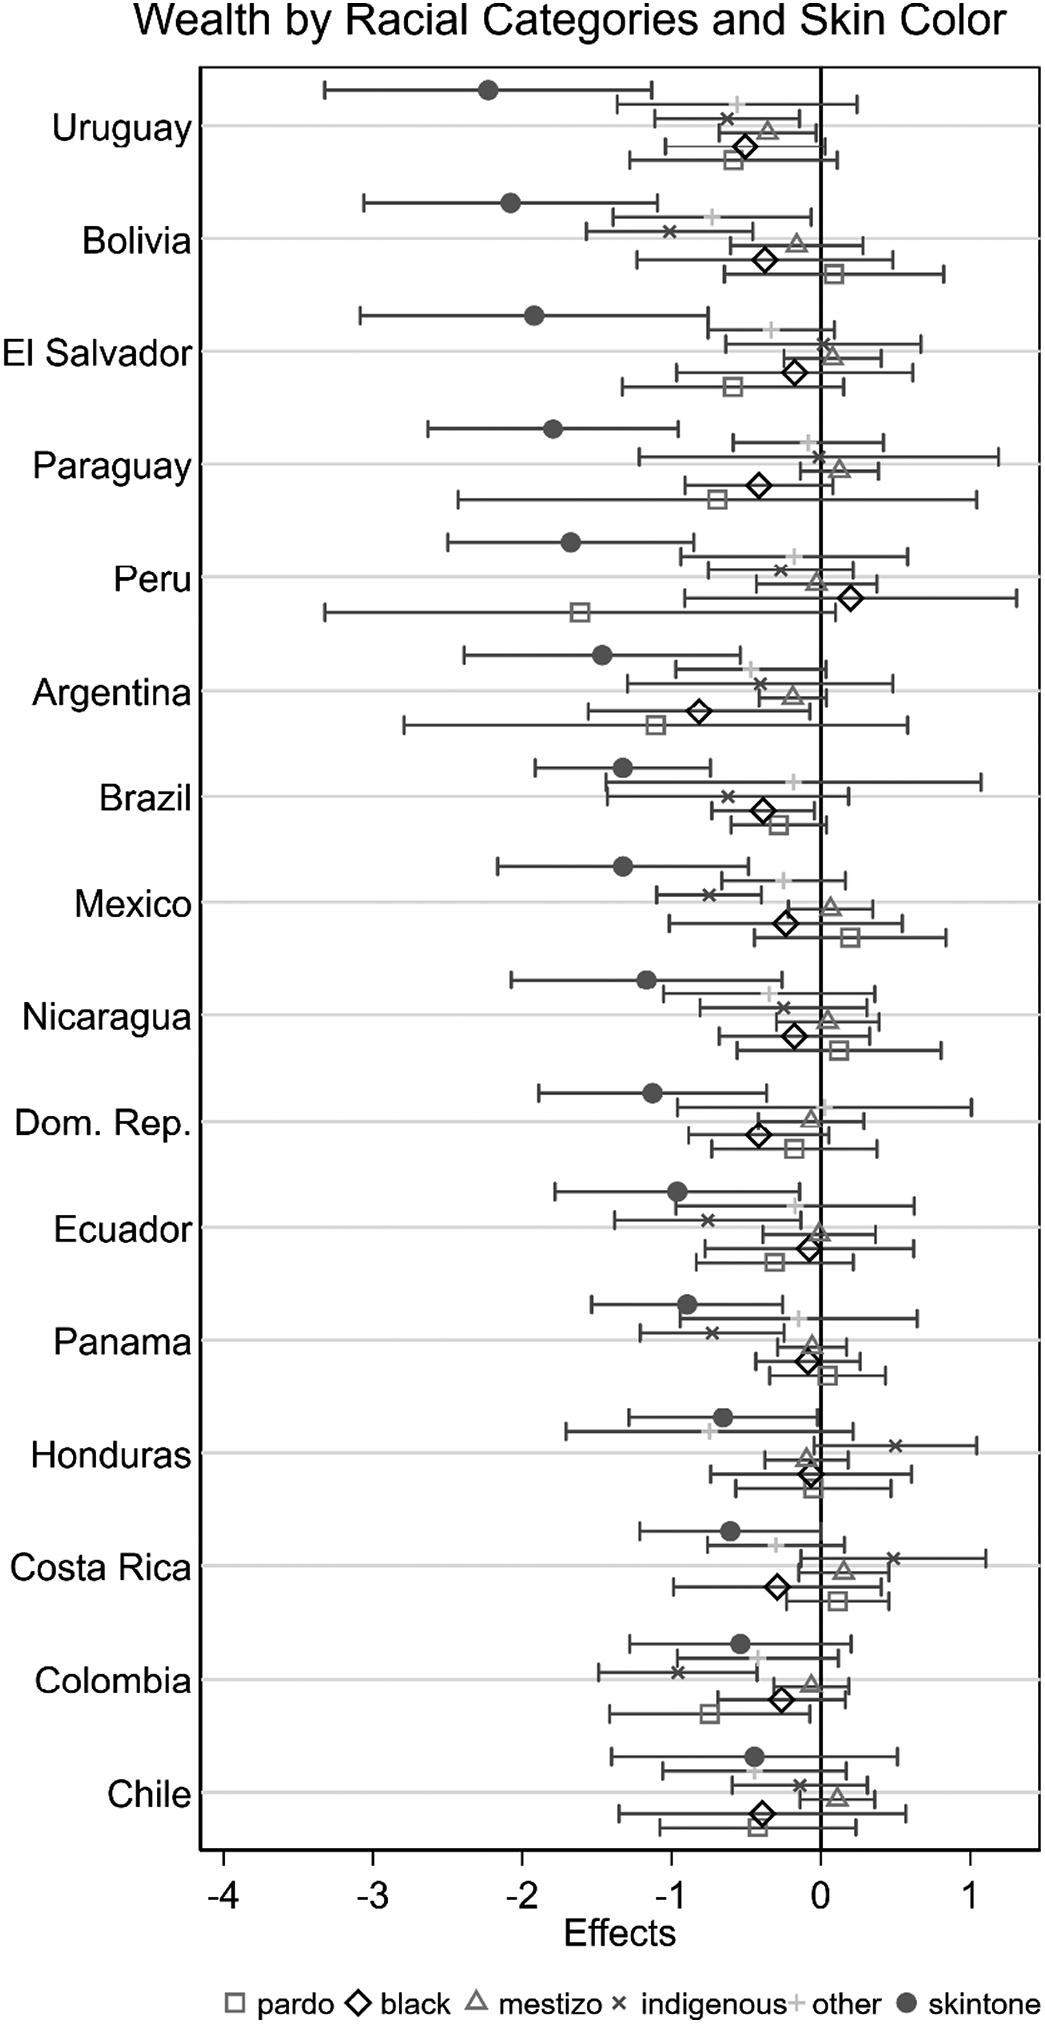


 Open access

