


Sense of control is the belief people have in their ability to influence important aspects of their immediate environments (Fritsche et al., Reference Fritsche, Moya, Bukowski, Jugert, de Lemus, Decker, Valor-Segura and Navarro-Carrillo2017; Skinner, Reference Skinner1996). It has been unmistakably established that perceiving sense of control is a basic human need shared between all cultures (Hornsey et al., Reference Hornsey, Greenaway, Harris and Bain2019). Perceiving low personal control has been primarily linked with undesirable psychological outcomes, ranging from adopting more maladaptive coping strategies (Brailovskaia & Margraf, Reference Brailovskaia and Margraf2021; Yang et al., Reference Yang, Liu, Chen, Li, Zhang, Xiong, Zhang, Zhou and Llu2024) to exhibiting poorer physical health outcomes (Hong et al., Reference Hong, Lachman, Charles, Chen, Wilson, Nakamura, VanderWeele and Kim2021).
Sense of control can be affected by contextual factors, with periods of financial instability being one of the most representative. Contexts of collective crisis (e.g., financial recessions or climate change) are highly unstable, making it harder for individuals to estimate the extent of the consequences of such complex circumstances (Merolla et al., Reference Merolla, Ramos, Zechmeister, Hogg and Blaylock2012). Indeed, earlier research has documented that people who were worried about the worsening of their financial situation during the Great Recession experienced a reduced sense of control (Fritsche et al., Reference Fritsche, Moya, Bukowski, Jugert, de Lemus, Decker, Valor-Segura and Navarro-Carrillo2017). Available empirical studies have also provided solid support to the relationship between individual-level objective socioeconomic data (e.g., social class) and sense of control, with individuals of lower social classes reporting decreased levels of sense of control than their upper-class counterparts (e.g., Kan et al., Reference Kan, Kawakami, Karasawa, Love, Coe, Miyamoto, Ryff, Kitayama, Curhan, B. and Markus2014). Moreover, in the context of the COVID-19 crisis, empirical studies also found that a greater exposure to COVID-19 was associated with a diminished sense of control (Deng & Feng, Reference Deng and Feng2022; Huang et al., Reference Huang, Hou, Sun and Wang2023).
There is extensive research suggesting that sense of control is one of the core determinants of well-being and health. Thus, diminished sense of control has been frequently and consistently related to lower levels of happiness, mental health, and physical health (Han et al., Reference Han, Chen and Chung2023; Li et al., Reference Li, Yu, Hu and Jin2023; Rosenbaum et al., Reference Rosenbaum, White and Gervino2012). Available research has also documented that sense of control might regulate the detrimental effects of various forms of psychological stressors. For instance, in the case of high anxiety, higher levels of perceived control were found to lead to lower levels of complications, morbidities, and mortality after myocardial infarction in anxious patients (AbuRuz, Reference AbuRuz2018). Moreover, several studies have shown that control has a protective effect under conditions of global threat. In the case of the COVID-19 pandemic, it has been found that in situations of COVID-19 risk, higher levels of perceived control prevented some of the negative effects this threat posed on people’s life satisfaction (Zheng et al., Reference Zheng, Miao and Gan2020) and it also was a protective factor against an increase of negative emotion and a decrease of positive emotion (Li et al., Reference Li, Yang, Dou, Wang, Zhang and Lin2020).
Probably, the most frequently used instrument to measure sense of control is Lachman and Weaver’s Sense of Control Scale (1998). This scale was developed by including items from the Mastery Scale by Pearlin and Schooler (Reference Pearlin and Schooler1978) and creating several original items over the course of three studies with the intention of testing and developing instruments for the Midlife in the United States (MIDUS) studies. The authors advocate for considering sense of control as determined by two different but interrelated categories: (a) perceived constraints (i.e., the belief that there are limitations beyond one’s control that interfere with achieving goals) and (b) personal mastery (i.e., the sense of efficacy in carrying out goals), similar to the conceptualization by Skinner (Reference Skinner1996). However, the extensive use of this scale has not resulted in the accumulation of sufficient empirical evidence regarding its psychometric adequacy, beyond reliability evidence and validity evidence based on relations to other variables. This fact could likely explain the substantial differences observed in its utilization across studies. For instance, whereas some empirical studies calculate the overall sense of control score by summing (Bi et al., Reference Bi, Cui, Pan, Liu, Chen and Ma2024) or averaging (Cerino et al., Reference Cerino, Charles, Piazza, Rush, Looper, Witzel, Mogle and Almeida2024) its 12 items, other investigations opt to use a specific dimension of the Sense of Control Scale, particularly the personal mastery subscale (Aghaei et al., Reference Aghaei, Qiao, Chi Tam, Yuan and Li2024). In general, it has been documented that both the overall score in sense of control and the score in its subscales show high reliability coefficients (Shane et al., Reference Shane, Hamm and Heckhausen2019; Xiao et al., Reference Xiao, Wu, Deng and Liu2024) and a coherent network of associations with positive (Chen et al., Reference Chen, Luo, Wu, Chen and Zhao2021) and negative (Xiong et al., Reference Xiong, Ming, Zhang, Bai, Luo, Cao, Zhang and Tao2021) indicators of well-being.
As a derivative of the Sense of Control Scale, Smith et al. (Reference Smith, Fisher, Ryan, Clarke, House and Weir2013) developed a scale to measure personal sense of control, self-efficacy, agency, and mastery, in order to use it in the Health and Retirement Study (HRS). This scale comprises of 10 items divided equally into two subscales: perceived constraints on personal control and perceived mastery. The five items that conform the perceived constraints on personal control subscale from the HRS are identical to five of the eight items from the perceived constraints original items, except for the HRS’s item 5, which differs from original item 10 because it lacks the word “some.” Original items 1, 7, and 11 were removed from the HRS version. Regarding personal mastery, the HRS version includes all four items employed in the original scale and adds a new fifth item. The HRS version has been adapted into Spanish (Pedroso-Chaparro et al., Reference Pedroso-Chaparro, Cabrera, Fernandes-Pires, Márquez-González and Losada-Baltar2024), resulting in the Spanish version of the Perceived Control Scale. Both the HRS version and the Perceived Control Scale aimed to obtain a scale that can measure perceived control in middle-aged and (mostly) older adults, as shown by the purpose of the HRS (Sonnega, Reference Sonnega2025) and the age of the sample and nomological network of the Perceived Control Scale validation. Nevertheless, our focus is centered on the original Sense of Control Scale (Lachman & Weaver, Reference Lachman and Weaver1998), which intended to create a scale that measured sense of control in the general population.
Building upon the aforementioned, as well as the fact that a Spanish adaptation of this exact measure is not yet available, the overarching aim of the current preregistered research was to develop and validate the SP-SCS. Given the various methodological inconsistencies reported in its use, we were particularly interested in conducting a comprehensive psychometric evaluation that would also account for its factorial validity. More specifically, the dimensionality of the scale was tested, its internal consistency was calculated, measurement invariance across gender was examined, and the relationships of the SP-SCS with other theoretically relevant variables (i.e., well-being, perceived psychological threat, and socioeconomic status) were also scrutinized. On the one hand, we expected sense of control to be positively associated with positive indicators of subjective well-being, financial threat, and subjective socioeconomic status. On the other hand, we also expected sense of control to be negatively related to negative indicators of subjective well-being (Fritsche et al., Reference Fritsche, Moya, Bukowski, Jugert, de Lemus, Decker, Valor-Segura and Navarro-Carrillo2017; John et al., Reference John, Boileau and Bless202 Reference Aghaei, Qiao, Chi Tam, Yuan and Li4; Li et al., Reference Li, Yu, Hu and Jin2023). Although there exist some measures of this construct in specific populations, achieving the goals of this paper would help obtain a standard measure of sense of control in the general population adapted to the Spanish language, so that this belief could be further studied and comprehended.
Method
Participants
The sample consisted of 605 participants (65.5% women, 33.6% men, 0.3% did not identify as men or women and 0.7% did not want to specify) between 18 and 80 years old (M = 33.09, SD = 14.18). The requirements to be able to participate in the study were for participants to be over the age of 18 and to be Spanish speakers. The initial sample was of 614 participants, and it was reduced by 9 people who did not pass the attention check. This attention check was included in the second out of six questionnaires and stated, “If you are reading this, please check number 6.” Participants who checked any option other than number 6 were eliminated. Details of the sociodemographic characteristics of the sample are listed in Table 1.
Sociodemographic data frequencies

Table 1. Long description
The table consists of three columns: Variable, n (frequency), and % (percentage). It is divided into five main categories:
1. Current employment situation: Students represent the largest group at 294 (48.6%), followed by full-time jobs at 218 (36%), part-time jobs at 53 (8.8%), unemployed at 25 (4.1%), and retired at 15 (2.5%).
2. Civil status: Single individuals are the most frequent at 233 (38.5%), followed by those in a relationship at 156 (25.8%), married at 145 (24%), non-married/cohabiting at 52 (8.6%), divorced at 14 (2.3%), and widowed at 5 (0.8%).
3. Family income level: The highest concentration is in the 1,951 to 3,250 Euro range at 174 (28.8%) and the 1,301 to 1,950 Euro range at 156 (25.8%). Other brackets include 3,251 to 4,550 Euro at 97 (16%), 651 to 1,300 Euro at 85 (14%), 4,551 to 5,200 Euro at 35 (5.8%), less than 650 Euro at 24 (4%), 5,201 to 5,800 Euro at 18 (3%), and greater than 5,800 Euro at 16 (2.6%).
4. Educational attainment: The largest group is University not completed at 254 (42%), followed by Master at 112 (18.5%), University completed at 106 (17.5%), Doctorate at 41 (6.8%), Vocational training at 37 (6.1%), Primary school at 23 (3.8%), and both Secondary education and Baccalaureate at 16 (2.6%) each.
5. Occupation: Unemployed individuals account for 214 (35.4%), followed closely by Technical occupations at 201 (33.2%). Other categories include Office works at 64 (10.6%), Professional on the service sector at 49 (8.1%), Salesperson at 31 (5.1%), Senior management at 23 (3.8%), Skilled worker at 13 (2.1%), and Agricultural worker at 10 (1.7%).
Instruments
Spanish Adaptation of the Sense of Control Scale (SP-SCS; Lachman & Weaver, Reference Lachman and Weaver1998): This scale is used to measure levels of sense of control. This scale is comprises of 12 items divided into two subscales: (a) perceived constraints (8 items; e.g., “There is little I can do to change many of the important things in my life”) and (b) personal mastery (4 items; e.g., “I can do just about anything I really set my mind to do”), differing from the HRS version (Smith et al., Reference Smith, Fisher, Ryan, Clarke, House and Weir2013) and the Perceived Control Scale (Pedroso-Chaparro et al., Reference Pedroso-Chaparro, Cabrera, Fernandes-Pires, Márquez-González and Losada-Baltar2024), both of which have 10 items, 5 items per subscale. Answers are rated on a 7-point Likert scale ranging from 1 (strongly disagree) to 7 (strongly agree), with higher scores indicating higher levels of perceived constraints and personal mastery. To obtain the global score of the scale, the items in the perceived constraints subscale were reversed, with higher scores of perceived constraints indicating higher levels of sense of control. Subsequently, the mean scores were calculated by averaging all of the items of the scale (Xiong et al., Reference Xiong, Ming, Zhang, Bai, Luo, Cao, Zhang and Tao2021). We also obtained the mean scores of the perceived constraints and the personal mastery subscales, respectively. In order for the adaptation to be highly correspondent to the original English version, a standard back-translation procedure was followed (Hambleton & de Jong, Reference Hambleton and de Jong2003). All the items were translated into Spanish by two independent and official translators. Then, three researchers experienced in social psychology and psychological assessment agreed on a consensual version considering language suitability and the final version was independently back-translated into English. Afterwards, it was corroborated that the back-translation closely resembled the original version. The approved SP-SCS has been made available (Supplementary Material).
Spanish adaptation of the Satisfaction with Life Scale (SWLS; Cabañero et al., Reference Cabañero, Martínez, Cabrero, Orts, Reig and Tosal2004; Diener et al., Reference Diener, Emmons, Larsen and Griffin1985): Its five items assess life satisfaction (e.g., I have been completely satisfied with my life) on a 7-point scale (1 = strongly disagree to 7 = strongly agree) and showed good scoring reliability (α = .848).
Spanish version of the Subjective Happiness Scale (SHS; Extremera & Fernández-Berrocal, Reference Extremera and Fernández-Berrocal2014; Lyubomirsky & Lepper, Reference Lyubomirsky and Lepper1999): This scale evaluates self-perceptions of happiness through four items (e.g., “Some people are generally very happy (…) To what extent does this characterization describe you?”) measured on a 7-point scale (1 = not at all to 7 = a great deal) and also showed adequate reliability in its scoring (α = .858).
Spanish adaptation of the 21-item version of the Depression, Anxiety and Stress Scale (DASS-21; Daza et al., Reference Daza, Novy, Stanley and Averill2002; Lovibond & Lovibond, Reference Lovibond and Lovibond1995): This is used to assess depression (e.g., “I couldn’t seem to experience any positive feeling at all”), anxiety (e.g., “I was aware of dryness of my mouth”), and stress symptoms (e.g., “I found it hard to wind down”). Participants were presented with 21 symptoms and were asked to indicate how often they felt how the statement indicated over the past week. Their answers were rated on a 4-point scale (0 = never, 3 = very frequently), with higher scores indicating more frequent experimentation of those symptoms. The total scoring reliability of the scale was great (α = .949).
Spanish version of the Financial Threat Scale (Marjanovic et al., Reference Marjanovic, Greenglass, Fiskebaum and Bell2013, Reference Marjanovic, Greenglass, Fiskebaum, De Witte, Garcia-Santos, Buchwald, Peiró and Mañas2015): It comprises of 5 items (e. g., “To which extent do you feel like you are at risk?”) with a 5-point Likert scale response format (1 = not at all, 5 = extremely) and is used to evaluate the levels of fear, uncertainty, and preoccupation participants have over their financial situation. The scale showed good reliability scoring for this sample (α = .885).
MacArthur Scale of Subjective Social Status (Adler et al., Reference Adler, Epel, Castellazzo and Ickovics2000): This measure is used to assess participants subjective socioeconomic status and it takes the form of a (social) ladder composed of 10 rungs representing different positions in the social hierarchy. A number from 1 to 10 is assigned to each rung (higher numbers reflected a higher position in the social class hierarchy). Participants were asked to select the number of the rung where they considered themselves to be in comparison with the rest of society.
Procedure
Firstly, the hypotheses for this study were preregistered.Footnote 1 From there, the cited measurements were uploaded to an online survey located on the platform Qualtrics. This survey was distributed through the local University’s email channels that reached all students and professors (i.e., incidental sampling). It was also distributed by undergraduate students who shared the link to the survey among their friends and family (i.e., snowball sampling). Participants were provided with a brief description of the study, had their anonymity and confidentiality ensured, and were informed that they could stop answering at any given time. Once they gave their consent, they filled out the survey. The studyFootnote 2 was carried out in accordance with the responsible university’s ethical guidelines and the Declaration of Helsinki.
Data Analysis
Firstly, the domain-level descriptive statistics of the 12 items were calculated (i.e., mean, standard deviation, asymmetry and kurtosis). Discrimination indexes were also analyzed (corrected test-item correlations) and were considered adequate when being over .20 (Muñiz & Fonseca-Pedrero, Reference Muñiz and Fonseca-Pedrero2019).
To test the internal structure of the instrument a crossed validation through two random subsamples was employed. The first subsample (1/3) was used to explore the internal structure with an exploratory factor analysis (EFA) and the second subsample (2/3) was used to confirm the structure of the first approach through a confirmatory factor analysis (CFA). Given that the number of response categories is high (seven response categories) and that all items showed asymmetry and kurtosis values out of the ±1 range, both the EFA and the CFA were carried out using the Pearson correlation matrix (Ferrando et al., Reference Ferrando, Lorenzo-Seva, Hernández-Dorado and Muñiz2022) and maximum likelihood robust (MLR) was employed as the estimation method. In the EFA, the appropriate number of factors to retain was determined using the optimal implementation of Parallel Analysis (Timmerman & Lorenzo-Seva, Reference Timmerman and Lorenzo-Seva2011). Robust Promin was used as the rotation method. Comparative fit index (CFI), Tucker–Lewis index (TLI), root mean square error of approximation (RMSEA), and root mean square of residuals (RMSR) were used as adjustment indexes, establishing good adjustment when CFI and TLI > .95, RMSEA < .08 and RMSR < .06 (Hu & Bentler, Reference Hu and Bentler1999). Due to the importance of studying the factor structure of a construct throughout different populations, measurement invariance was examined across gender. Configural, metric, and scalar invariance were analyzed through a multi-group confirmatory factor analysis (MG-CFA). Since they were nested models, the acceptable change in CFI to assume invariance must be lower than −.01 and lower than .015 in RMSEA (ΔCFI < −.01, ΔRMSEA < .015; Chen, Reference Chen2007).
Once the factorial structure was explored and confirmed, the reliability of the scores was studied through Cronbach’s α coefficient. To obtain validity evidence in relation to other variables (AERA et al., 2014), Pearson correlations between sense of control and satisfaction with life, subjective happiness, and the three dimensions evaluated by the DASS-21 (i.e., depression, anxiety and stress) were calculated. Pearson correlations of sense of control with financial threat and subjective socioeconomic status were also tested.
Finally, possible differences in the instrument’s dimensions in regard to work status, relationship status, and income were also analyzed. In the case of work and relationship status, independent samples t-tests for difference of means were carried out. Cohen’s d was used for effect size. For income, a one-factor ANOVA was carried out (the post-hoc Tukey test was utilized to check between which groups there were differences; Juarros Basterretxea et al., Reference Juarros Basterretxea, Aonso-Diego, Postigo, Montes-Álvarez, Menéndez-Aller and García-Cueto2024).
Domain-level descriptive statistics, discrimination indexes, reliability of the scores, Pearson correlations, and group differences were studied using SPSS 24 (IBM Corp, 2016). The EFA was calculated out using FACTOR 12.03.02 (Ferrando & Lorenzo-Seva, Reference Ferrando and Lorenzo-Seva2017). The CFA and the measure invariance were analyzed using Mplus8 (Muthén & Muthén, Reference Muthén and Muthén2017).
Results
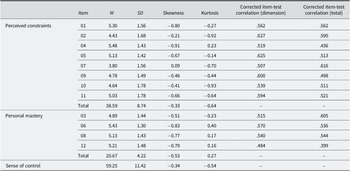
Firstly, descriptive statistics of the items were studied. Each of the items showed adequate values of asymmetry and kurtosis, fluctuating within the ±1 range (Table 2). The discriminative power of the items was very high, both considering their respective dimension and the scoring of the whole instrument (Table 2).
Descriptive statistics of the items of the Spanish version of the Sense of Control Scale (SP-SCS)
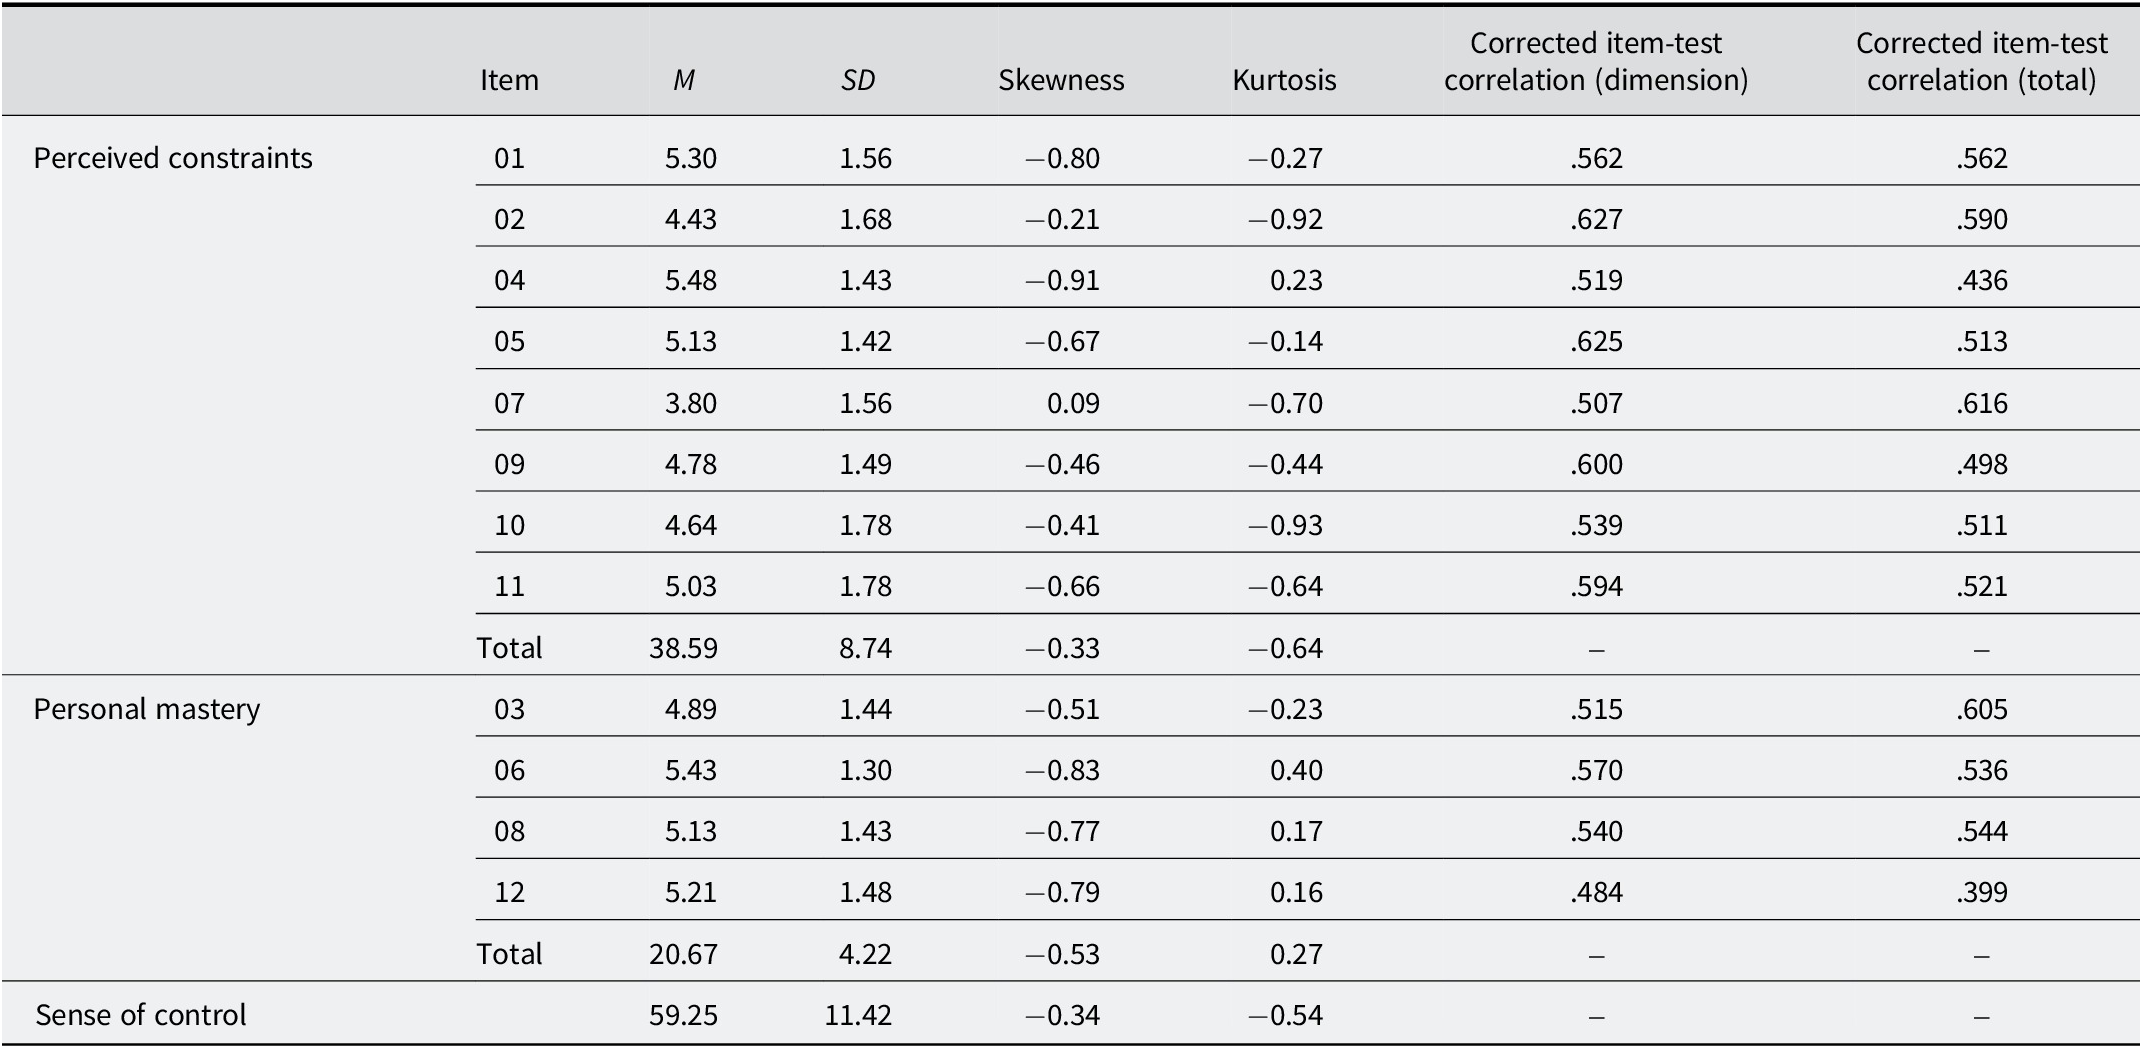
Table 2. Long description
The table presents descriptive statistics for 12 items across two dimensions. Columns include Item, M, S D, Skewness, Kurtosis, Corrected item-test correlation dimension, and Corrected item-test correlation total.
* Perceived constraints dimension includes items 01, 02, 04, 05, 07, 09, 10, and 11. Means range from 3.80 to 5.48. The dimension total M is 38.59 with an S D of 8.74.
* Personal mastery dimension includes items 03, 06, 08, and 12. Means range from 4.89 to 5.43. The dimension total M is 20.67 with an S D of 4.22.
* Sense of control total score across all items shows an M of 59.25, S D of 11.42, Skewness of minus 0.34, and Kurtosis of minus 0.54.
Skewness for individual items ranges from minus 0.91 to 0.09, and Kurtosis ranges from minus 0.93 to 0.40. Item-test correlations for dimensions range from .484 to .627.
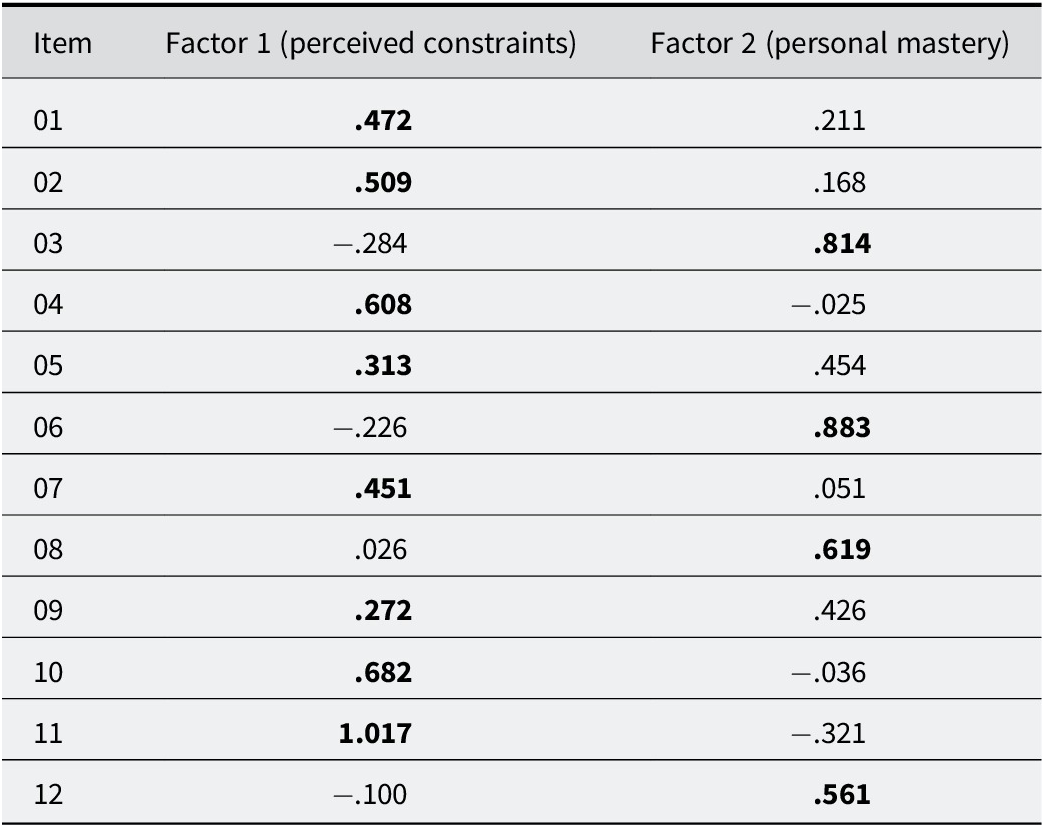
Once the descriptive statistics of the items were analyzed, the factorial structure of the instrument was explored by means of an EFA with the first random subsample (n = 203). The scores were adequate to carry out the EFA (KMO = .869; Bartlett p < .001). The first factor explained 40.69% of the variance and it rose to 51.06% when the second factor was considered. However, the optimal implementation of parallel analysis recommended a single dimension. The bidimensional model showed a good fit (CFI = .970; TLI = .953; RMSEA = .077; RMSR = .053), and the factorial loadings were distributed according to their theoretical dimension (Table 3). An exception for this were items 5 and 9, which even though charged adequately in their corresponding theoretical dimension showed a higher factorial loading in the other dimension. In addition, the standardized loading above 1 observed for item 11 was examined and did not correspond to a Heywood case, as its residual variance remained positive. This model showed a better fit to the data than the unidimensional model (CFI = .823; TLI = .784; RMSEA = .090 [90% .078–102]; RMSR = .072).
Factor loadings of the items in the exploratory factor analysis
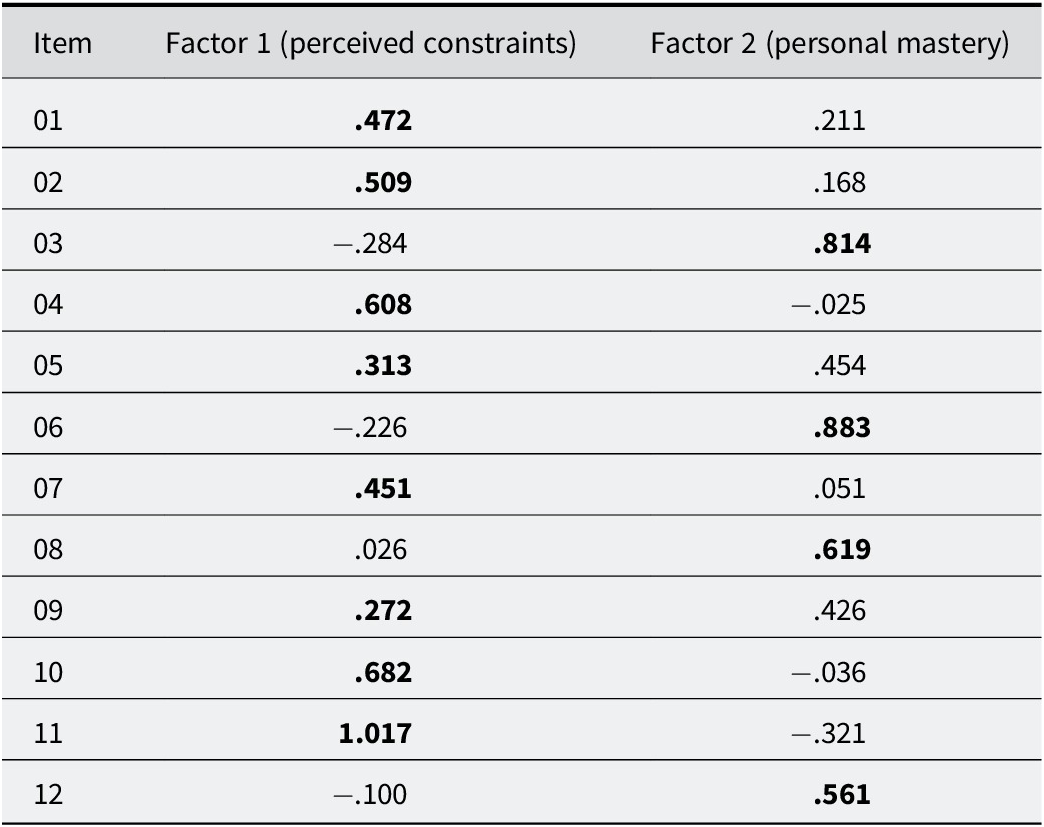
Table 3. Long description
The table consists of three columns: Item, Factor 1 (perceived constraints), and Factor 2 (personal mastery).
* Item 01: Factor 1 is .472 (bold), Factor 2 is .211.
* Item 02: Factor 1 is .509 (bold), Factor 2 is .168.
* Item 03: Factor 1 is minus .284, Factor 2 is .814 (bold).
* Item 04: Factor 1 is .608 (bold), Factor 2 is minus .025.
* Item 05: Factor 1 is .313 (bold), Factor 2 is .454.
* Item 06: Factor 1 is minus .226, Factor 2 is .883 (bold).
* Item 07: Factor 1 is .451 (bold), Factor 2 is .051.
* Item 08: Factor 1 is .026, Factor 2 is .619 (bold).
* Item 09: Factor 1 is .272 (bold), Factor 2 is .426.
* Item 10: Factor 1 is .682 (bold), Factor 2 is minus .036.
* Item 11: Factor 1 is 1.017 (bold), Factor 2 is minus .321.
* Item 12: Factor 1 is minus .100, Factor 2 is .561 (bold).
Note: The theoretical dimension in which the item should charge is highlighted in bold.
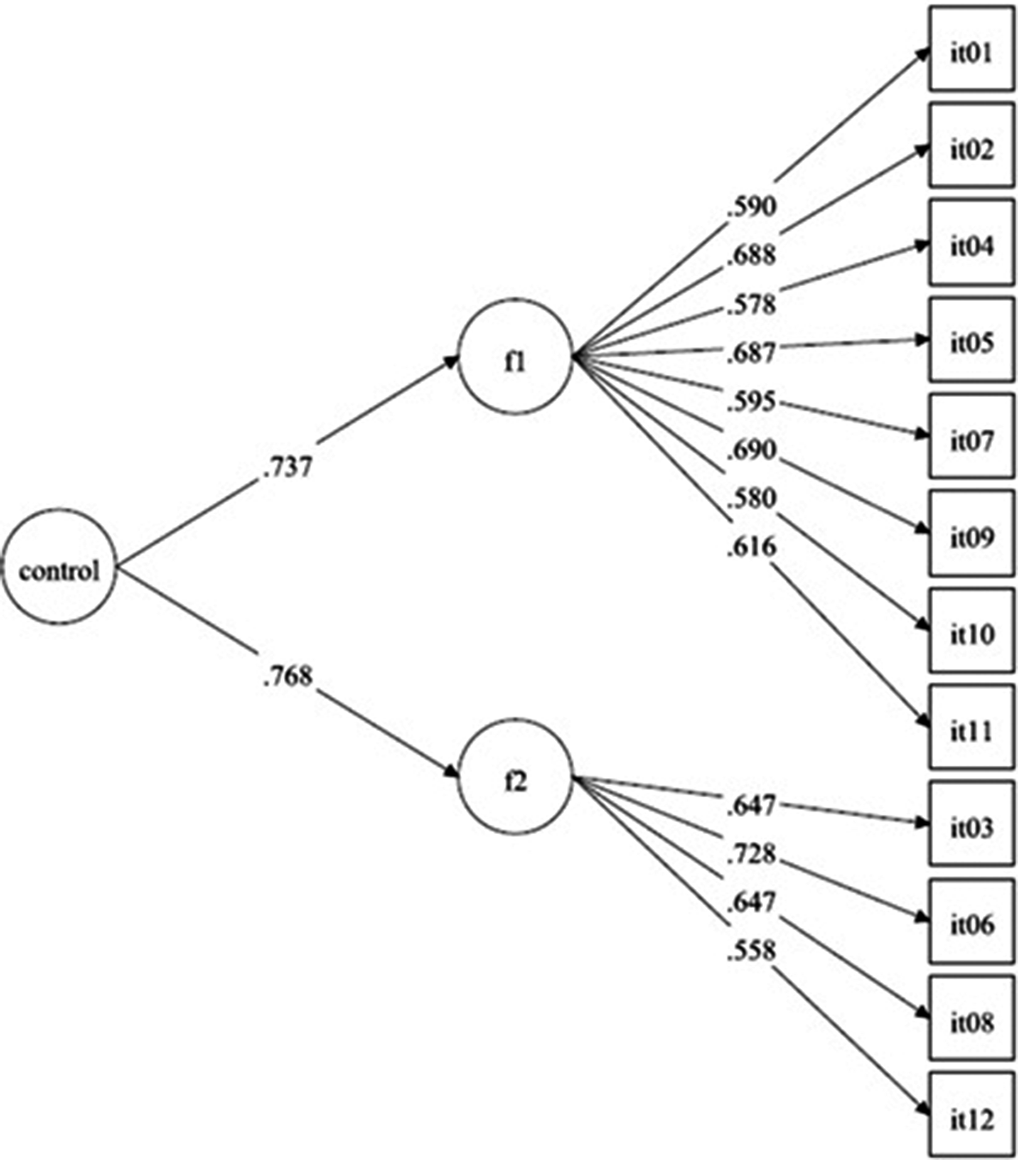
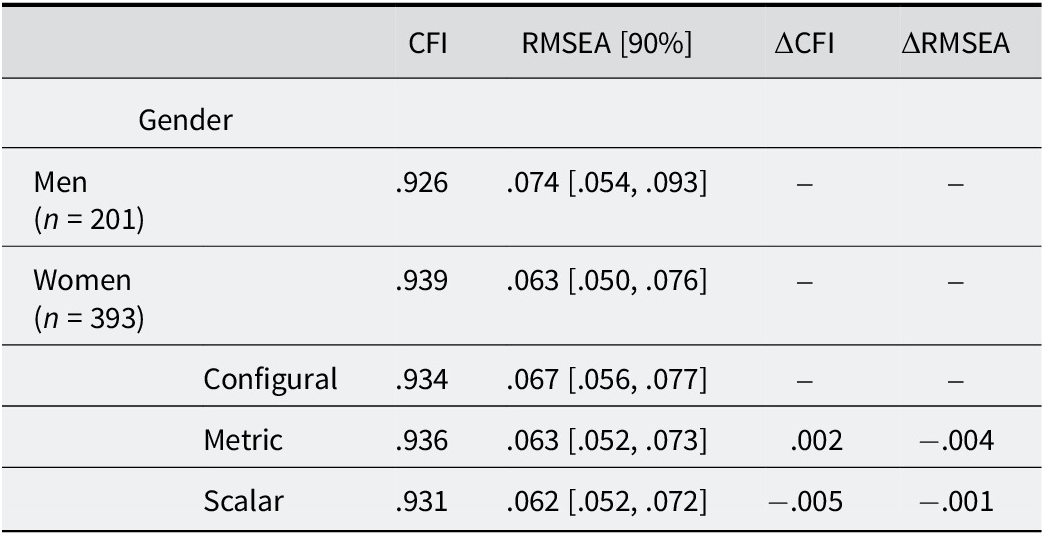
Once the factorial structure was explored, the next step was to confirm the factorial structure using a CFA in the second random subsample (n = 402). Given that the correlation between both dimensions was very high (r = .786), a two first-order dimension (perceived constraints and personal mastery) and one second-order dimension model (sense of control) was argued. This model showed an adequate fit to the data (CFI = .960; TLI = .949; RMSEA = .044 [90% .029–058]; RMSR = .039) and the factorial loadings were all adequate, fluctuating between .558 and .768 (Figure 1). Following that, the invariance of the measure in regard to gender was studied, achieving the three levels of invariance (i.e., configural, metric, and scalar), as shown in Table 4.
Factorial structure of the instrument with standardized factor loadings.
Note: f1 = perceived constraints; f2 = personal mastery.

Figure 1. Long description
The diagram is a path model with three layers.
1. Far Left: A circle labeled control serves as the primary latent variable. Two arrows originate from it. The upper arrow points to f 1 with a standardized loading of .737. The lower arrow points to f 2 with a loading of .768.
2. Center: Two circles represent the sub-factors.
- f 1 (perceived constraints) is positioned at the top center.
- f 2 (personal mastery) is positioned at the bottom center.
3. Far Right: Twelve square boxes represent observed items, labeled it 01 through it 12.
- f 1 points to eight items with the following loadings: it 01 (.590), it 02 (.688), it 04 (.578), it 05 (.687), it 07 (.595), it 09 (.690), it 10 (.580), and it 11 (.616).
- f 2 points to four items with the following loadings: it 03 (.647), it 06 (.728), it 08 (.647), and it 12 (.558).
Factorial structure and invariance of the instrument in regard to gender
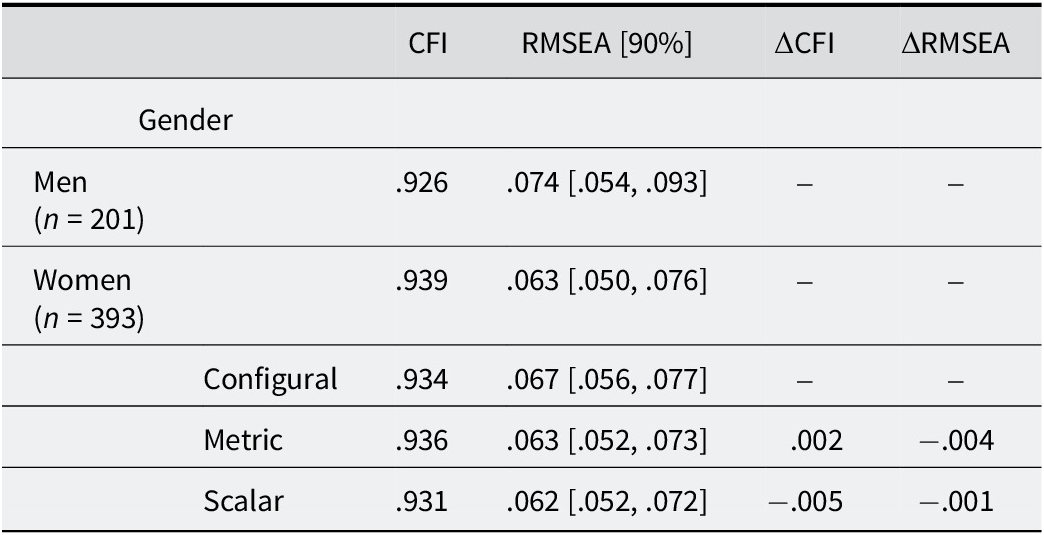
Table 4. Long description
The table consists of six columns: Gender or Model, an empty column, C F I, R M S E A [90%], Delta C F I, and Delta R M S E A.
Row 1: Men (n = 201). C F I is .926. R M S E A is .074 with a 90% confidence interval of [.054, .093]. Delta values are not applicable.
Row 2: Women (n = 393). C F I is .939. R M S E A is .063 with a 90% confidence interval of [.050, .076]. Delta values are not applicable.
Row 3: Configural model. C F I is .934. R M S E A is .067 with a 90% confidence interval of [.056, .077].
Row 4: Metric model. C F I is .936. R M S E A is .063 with a 90% confidence interval of [.052, .073]. Delta C F I is .002. Delta R M S E A is minus .004.
Row 5: Scalar model. C F I is .931. R M S E A is .062 with a 90% confidence interval of [.052, .072]. Delta C F I is minus .005. Delta R M S E A is minus .001.
After the factorial structure was examined, the reliability of the scores of the instrument was evaluated. The reliability of the scores was high for both the total scores of the instrument (α = .854) and the perceived constraints dimension (α = .839) and somewhat lower for the personal mastery dimension (α = .734), which was most likely influenced by the low number of items in this dimension.
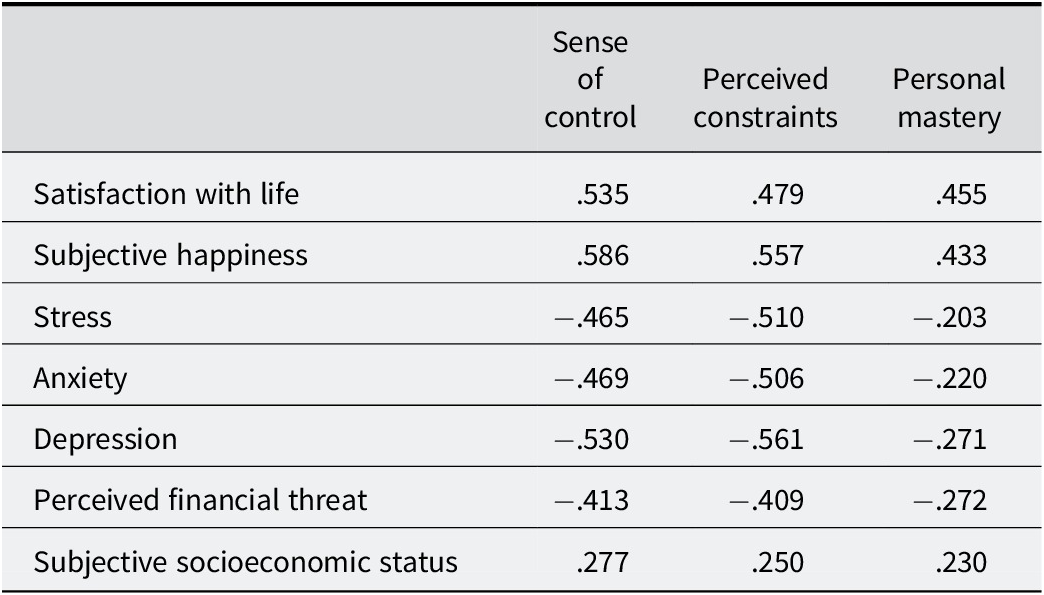
Regarding validity evidence in relation to other variables, Table 5 displays the Pearson correlations between the SP-SCS and the rest of the variables evaluated in the study. The scores of the entire scale, of the perceived constraints dimension, and of the personal mastery dimension showed (Table 5) significant positive correlations with satisfaction with life (rs = .455 to .535), subjective happiness (rs = .433 to .586), and subjective socioeconomic status (rs = .230 to .277). They also showed significant negative correlations with the three dimensions evaluated by the DASS-21 [i.e., depression (rs = −.271 to −.561), anxiety (rs = −.220 to −.506), and stress (rs = −.203 to −.510)] and financial threat (rs = −.272 to −.413).
Pearson correlations between the Spanish Sense of Control Scale (SP-SCS) and external variables
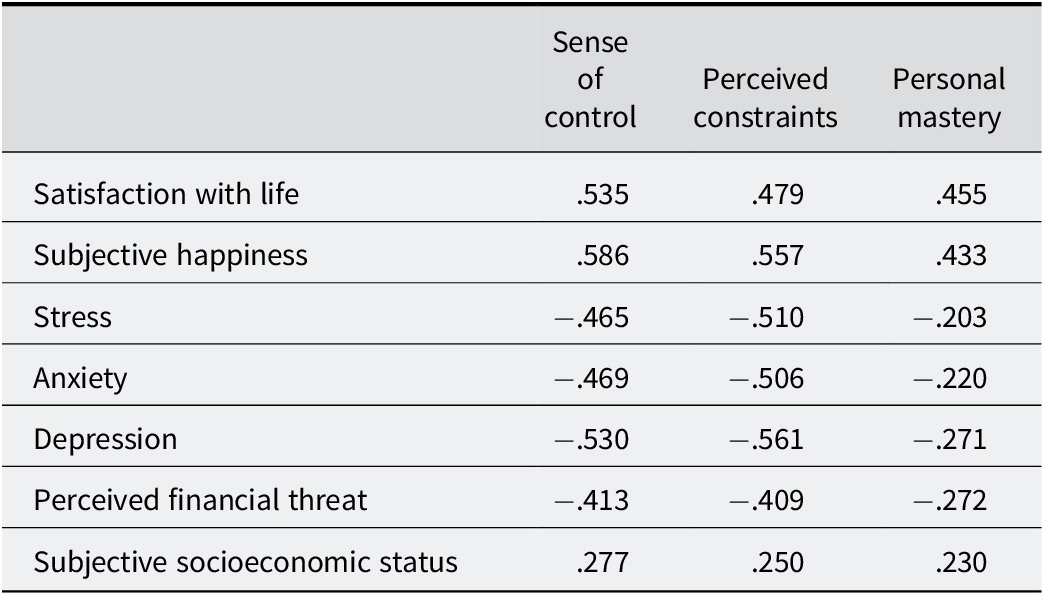
Table 5. Long description
The table consists of four columns. The first column lists external variables, while the subsequent three columns represent the S P - S C S subscales: Sense of control, Perceived constraints, and Personal mastery.
* Satisfaction with life: Sense of control .535, Perceived constraints .479, Personal mastery .455.
* Subjective happiness: Sense of control .586, Perceived constraints .557, Personal mastery .433.
* Stress: Sense of control minus .465, Perceived constraints minus .510, Personal mastery minus .203.
* Anxiety: Sense of control minus .469, Perceived constraints minus .506, Personal mastery minus .220.
* Depression: Sense of control minus .530, Perceived constraints minus .561, Personal mastery minus .271.
* Perceived financial threat: Sense of control minus .413, Perceived constraints minus .409, Personal mastery minus .272.
* Subjective socioeconomic status: Sense of control .277, Perceived constraints .250, Personal mastery .230.
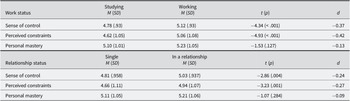
Finally, potential differences between the dimensions of the Sense of Control Scale in regard to income, work status, and relationship status were also analyzed. Statistically significant differences were found both for income and relationship status in the total scores of the scale and the perceived constraints dimension but not in the personal mastery subscale. Participants who were employed showed higher scores of global sense of control and higher scores of perceived constraints. This was also true for participants who were in a relationship (Table 6).
Differences in the Spanish Sense of Control Scale (SP-SCS) regarding work and relationship status
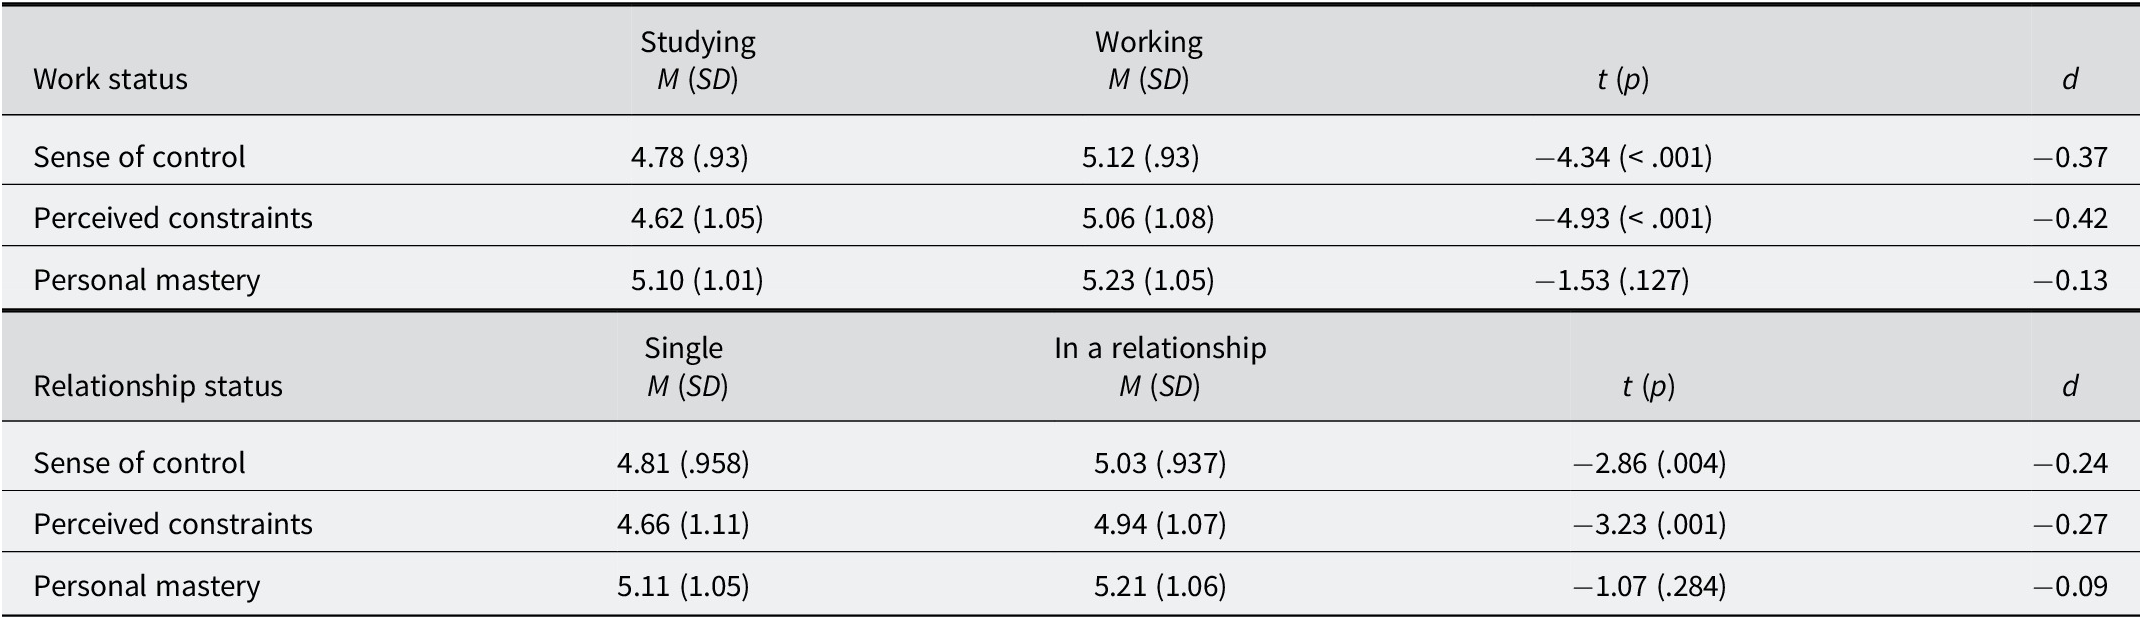
Table 6. Long description
The table is divided into two main horizontal sections.
Section 1: Work status. This section compares individuals who are Studying versus those who are Working across three dimensions.
- Sense of control: Studying M = 4.78, SD = 0.93; Working M = 5.12, S D = 0.93; t = minus 4.34, p < .001, d = minus 0.37.
- Perceived constraints: Studying M = 4.62, S D = 1.05; Working M = 5.06, S D = 1.08; t = minus 4.93, p < .001, d = minus 0.42.
- Personal mastery: Studying M = 5.10, S D = 1.01; Working M = 5.23, S D = 1.05; t = minus 1.53, p = .127, d = minus 0.13.
Section 2: Relationship status. This section compares individuals who are Single versus those In a relationship.
- Sense of control: Single M = 4.81, S D = .958; In a relationship M = 5.03, S D = .937; t = minus 2.86, p = .004, d = minus 0.24.
- Perceived constraints: Single M = 4.66, S D = 1.11; In a relationship M = 4.94, S D = 1.07; t = minus 3.23, p = .001, d = minus 0.27.
- Personal mastery: Single M = 5.11, S D = 1.05; In a relationship M = 5.21, S D = 1.06; t = minus 1.07, p = .284, d = minus 0.09.
Likewise, regarding income (Table 7), statistically significant differences were found in the total scores of the scale and the perceived constraints dimension. Participants with monthly incomes higher than €3.250 showed higher scores of global sense of control and higher scores of perceived constraints than participants with average and lower monthly incomes.
Differences in the Spanish Sense of Control Scale (SP-SCS) regarding income

Table 7. Long description
A table with six columns and four rows including the header. The columns are: Income less than 1,300 Euros (group a), Income 1,301 to 3,250 Euros (group b), Income greater than 3,250 Euros (group c), F statistic with p-value, and Post-hoc results. Values are presented as Mean with Standard Deviation in brackets.
* Sense of control: Group a is 4.87 (1.00). Group b is 4.84 (.90). Group c is 5.18 (.98). F is 7.90, p is less than .001. Post-hoc shows significant differences for a with c and b with c.
* Perceived constraints: Group a is 4.69 (1.13). Group b is 4.72 (1.08). Group c is 5.13 (1.05). F is 9.15, p is less than .001. Post-hoc shows significant differences for a with c and b with c.
* Personal mastery: Group a is 5.24 (1.15). Group b is 5.08 (.98). Group c is 5.30 (1.12). F is 2.71, p is .067. No significant post-hoc differences.
Note: Post-hoc column shows statistically significant comparisons.
Discussion
This study aimed to develop and successfully validate the Spanish version of the Sense of Control Scale (SP-SCS). For this to be achieved, this measure underwent a comprehensive psychometric evaluation in a large Spanish population sample. The results obtained support the assertion that in this sample, the SP-SCS scores show convincing validity evidence in relation to its internal structure, adequate scoring reliability, and validity evidence based on its associations with relevant external outcomes.
Consistent with the bidimensional structure originally proposed by Lachman and Weaver (Reference Lachman and Weaver1998), the SP-SCS presented a bifactorial structure, as evidenced by the conducted EFA and CFA analyses. More specifically, this research confirmed that the scale comprised of two first-order dimensions (perceived constraints and personal mastery) and one second-order dimension (sense of control). Even though parallel analysis suggested a unidimensional structure, comparisons of model fit among exploratory solutions favored the bidimensional structure (ΔCFI = .148, ΔTLI = .169, ΔRMSEA = −.013, ΔSRMR = −.019). Furthermore, CFA results indicated that the second-order model showed a good overall fit. This multidimensional structure is aligned with the Perceived Control Scale (Pedroso-Chaparro et al., Reference Pedroso-Chaparro, Cabrera, Fernandes-Pires, Márquez-González and Losada-Baltar2024), which presents a bidimensional structure. Furthermore, the items that belonged to each dimension coincide with those of the original scale. The reliability of the perceived constraints scores was high and comparatively lower in the case of personal mastery scores. These results are similar to those obtained using the original Sense of Control Scale (Lachman & Weaver, Reference Lachman and Weaver1998). The lower (although adequate) reliability coefficients of personal mastery scores could be explained by this dimension’s relatively low number of items (i.e., 4 items). Continuing with the psychometric properties, all items showed acceptable values of asymmetry, kurtosis, and discriminatory power within its own dimension or the total scores of the instrument.
Importantly, the SP-SCS was found to be invariant across gender group regarding all three levels of invariance (i.e., configural, metric and scalar), broadening on the types of evidence gathered by the Perceived Control Scale (Pedroso-Chaparro et al., Reference Pedroso-Chaparro, Cabrera, Fernandes-Pires, Márquez-González and Losada-Baltar2024) validation. Moreover, when checking for the differences in the SP-SCS scores across income, work status, and relationship status groups, we found that respondents who worked, participants who were in a relationship, and participants with a monthly income of ≥€3.250, respectively, reported higher levels of sense of control because they scored higher on the perceived constraints dimension (but not on personal mastery) and on the second-order dimension of sense of control.
Considering the nomological network of the SP-SCS, this research was carried out from a psychosocial perspective, focusing specifically on subjective well-being (i.e., satisfaction with life and happiness), psychological distress (i.e., depression, anxiety, and stress), perceived financial threat, and socioeconomic status. Thus, it was found that sense of control was connected to the entire set of external outcomes considered as predicted. Lower levels of sense of control, that is, lower scores on perceived constraints, personal mastery, as well as global sense of control, were associated with lower subjective well-being and lower subjective socioeconomic status, as well as higher psychological distress and perceived financial threat. Overall, these findings are consistent with earlier studies reporting that lower levels of sense of control are related to diminished well-being and mental health (AbuRuz, Reference AbuRuz2018; Han et al., Reference Han, Chen and Chung2023; Li et al., Reference Li, Yu, Hu and Jin2023; Zheng et al., Reference Zheng, Miao and Gan2020) and increased financial threat (Fritsche et al., Reference Fritsche, Moya, Bukowski, Jugert, de Lemus, Decker, Valor-Segura and Navarro-Carrillo2017). These findings expand on the results obtained by other conceptually similar measures such as the Perceived Control Scale (Pedroso-Chaparro et al., Reference Pedroso-Chaparro, Cabrera, Fernandes-Pires, Márquez-González and Losada-Baltar2024), showing that their evidence that sense of control is positively related to depressive and anxious symptomatology in the older population can be extended to the general population.
Given the importance sense of control has over several indicators of well-being, it is necessary to make available an instrument that can adequately measure this construct. Obtaining validity evidence for the SP-SCS allows the assessment of sense of control on the adult general Spanish population.
Limitations
Some limitations should be noted. This research only included self-report measures, but it is necessary to highlight the fact that the context of the study was not competitive and, thus, participants would not have felt the need to be dishonest or try to portray a socially desirable image of themselves. Furthermore, the multidimensionality of the scale could just be a statistical artifact and not part of the psychological construct (Suárez Álvarez et al., Reference Suárez Álvarez, Pedrosa, Lozano, García-Cueto, Cuesta and Muñiz2018). This implies that there is the possibility that the two first-order dimensions are differentiated not because they measure different aspects of control but because the differentiated scoring (one subscale having inverted scores) make them seem different (Postigo et al., Reference Postigo, García-Fernández, Cuesta, González-Nuevo, Menéndez-Aller and García-Cueto2024). Thus, to truly ascertain whether the dimensions are actually different or not, future research should focus on exploring the correlational patterns of these dimensions with external variables.
Conclusion
In conclusion, robust evidence for the adequate psychometric properties of the SP-SCS was obtained. The findings of this study support the theoretical framework that proposes that sense of control is a construct comprised by a factorial structure of two first-order dimensions and one second-order dimension. The division of the construct into perceived constraints and personal mastery seems to better account for data of sense of control. This two-factor scale showed correct item-level equivalence across gender. The SP-SCS presented a coherent set of correlates with external variables, thus obtaining strong convergent validity evidence for the scale. These results imply that the SP-SCS constitutes a useful, reliable measure, with several sources of validity evidence available, to assess sense of control in the general Spanish population. This shall allow for further study of this basic human need. Moreover, the set of correlates this scale yielded further solidifies the relevance sense of control has in relation to subjective well-being, perceived psychological threat, and socioeconomic status.
Supplementary material
To view supplementary material for this article, please visit http://doi.org/10.1017/SJP.2026.10047.
Data Availability Statement
The preregistration of this study, the final SP-SCS, and the database used for all of the analyses that were carried out can be found in this link to the OSF platform: https://osf.io/3c2ra/?view_only=60c7e7248e2349cb88861f346366fbdf. All information that could potentially make participants identifiable has been removed from the dataset in order to ensure their anonymity.
Author Contribution
Conceptualization: B.C.-S., G.N.-C., I.V.-S.; Data curation: B.C.-S., Á.P.; Formal analysis: B.C.-S., Á.P.; Funding acquisition: B.C.-S., G.N.-C., I.V.-S.; Investigation: B.C.-S.; Project administration: B.C.-S., G.N.-C., I.V.-S.; Resources: B.C.-S., Á.P., I.V.-S.; Supervision: G.N.-C., I.V.-S.; Visualization: B.C.-S., Á.P.; Validation: Á.P.; Writing—original draft: B.C.-S., Á.P.; Writing—review and editing: B.C.-S., Á.P., I.V.-S.
Funding Statement
This study was conducted with the support of a research contract awarded to Brianda Canal-Serantes (PRE2021–099547; project PID2020-114464RB-I00) by the Spanish Ministry of Science, Innovation, and Universities, the State Research Agency (reference: MCIN/AEI/10.13039/501100011033) and the European Social Fund Plus.
Competing Interests
The authors have no known competing interests to declare that are relevant to the content of this article.




 Open access

