

1. Introduction
Melt layers are frequently observed in ice cores extracted from polar and alpine glaciers. Melting occurs when the air temperature rises above 0°C at these locations. The annual melt-layer variability in firn and ice cores has been used as a proxy for summer temperature variability on several glaciers including the Greenland ice sheet (Reference Herron, Herron and LangwayHerron and others, 1981; Reference Langway and ShojiLangway and Shoji, 1990; Reference Alley and AnandakrishnanAlley and Anandakrishnan, 1995; Reference Kameda, Narita, Shoji, Nishio, Fujii and WatanabeKameda and others, 1995; Reference Rowe, Anderson, Mote and KuivinenRowe and others, 1995), Devon Ice Cap, Canada (Reference KoernerKoerner, 1977); Agassiz Ice Cap, Canada (Reference Fisher, Koerner and ReehFisher and others, 1995); and the West Antarctic ice sheet (Reference Das and AlleyDas and Alley, 2008). For example, Reference Herron, Herron and LangwayHerron and others (1981) found annual percent melt increased during the Medieval Warm Period, decreased during the Little Ice Age and correlated well with δ18O. Reference Koerner and FisherKoerner and Fisher (1990) inferred mean summer season temperatures through the use of annual melt percent from an Agassiz Ice Cap core. At Siple Dome, Antarctica, where under the present climate the temperature rises above freezing during only a small fraction of summers, and at several Arctic locations of high annual melt, melt layers represent ‘extreme temperatures’ and also reflect mean summer temperatures (Reference KoernerKoerner, 1997; Reference Das and AlleyDas and Alley, 2005).
A snow pit and shallow core examined during a reconnaissance field season in the spring of 2008 to Kahiltna Glacier on the west shoulder of Denali, Alaska, USA, revealed tightly clustered melt layers that we interpret as representing summertime melting events. Here we examine the relationship between mean and extreme summer temperatures and ice-layer thickness to determine if a longer-term record of summertime warmth may be available from analysis of melt layers in a deep core drilled at this site. This study also examines the types of weather patterns that are responsible for very warm summer temperatures in central Alaska.
2. Data and Methodology
During May 2008, we collected samples from a 4.35 m deep snow pit and then drilled and sampled a 18.77 m long, 8.2 cm diameter firn core from the bottom of the pit approximately 1 km south of Kahiltna Pass (KPass; 63.07° N, 151.17° W; Fig. 1) at 2970 m a.s.l. (∼700 hPa). The physical depth and thickness of ice layers in the core (there were no ice layers in the snow pit) were recorded carefully in the field. Melt-layer thickness was calculated by measuring the along-core thickness. If a lens or melt layer had a variable thickness, an average thickness was recorded. No vertical ice pipes were observed. Density in the snow pit was measured every 10 cm, and the length of each core segment was measured and weighed to calculate the density.
Map of northwestern North America. All meteorological stations (triangles) mentioned in the text and ice-core locations (circles: Mount Logan (Reference Holdsworth, Krouse, Nosal, Bradley and JonesHoldsworth and others, 1992; Reference OsterbergOsterberg and others, 2008), Eclipse (Reference Yalcin and WakeYalcin and Wake, 2001; Reference Yalcin, Wake and GermaniYalcin and others, 2003, Reference Yalcin, Wake, Kreutz and Whitlow2006a,Reference Yalcin, Wake, Dibb, Kreutz and Whitlowb,Reference Yalcin, Wake, Kang, Kreutz and Whitlowc), King Col (Reference Goto-AzumaGoto-Azuma and others, 2003) and Bona-Churchill (Reference Thompson, Mosley-Thompson, Zagorodnov, Davis, Mashiotta and LinThompson and others, 2004)) are labeled.

The snow pit was sampled continuously at 5 cm resolution for glaciochemical analyses and was averaged to match the 10 cm continuously sampled firn core. Firn-core samples were scraped with a ceramic blade under a class 100 High Efficiency Particle Air (HEPA) clean bench at −20°C in the clean ice processing facility at the University of Maine and then melted in pre-cleaned 250 mL Nalgene bottles. All samples remained frozen until just prior to analysis. The samples were analyzed for dD at the University of Maine with a Mircomass Isoprime mass spectrometer and Eurovector PyrOH peripheral (Reference Morrison, Brockwell, Merren, Fourel and PhillipsMorrison and others, 2001).
Meteorological data used in our analysis are from the US National Centers for Environmental Prediction (NCEP)/US National Center for Atmospheric Research (NCAR) reanalysis (Reference KalnayKalnay and others, 1996) 6 hourly data on a 2.5° × 2.5° grid. These data at 62.5° N, 150.0° W, 700 hPa, the closest gridpoint to KPass, are used as a proxy for meteorological conditions at KPass. This temperature record was compared with daily temperature recorded by a University of Maine meteorological station installed in May 2008 at Kahiltna base camp (2195 m a.s.l.; 11 km south-southeast of KPass). Both time series have a high autocorrelation, so the daily residuals were calculated from an 11 day running-mean temperature to minimize autocorrelation. The correlation coefficient between these daily datasets for 8 May 2008 to 4 May 2009 is 0.61 (p < 0.0001). Therefore, we are confident that the NCEP/NCAR reanalysis gridpoint data closely represent weather conditions at KPass. We assume that melting of any significance occurred only when the temperature at the gridpoint was above 0°C, an obvious threshold that is supported experimentally (Reference Das and AlleyDas and Alley, 2005). The metric used here to estimate the magnitude of warmth above 0°C at KPass is ‘positive degree-days’ (PDD), daily cumulative degrees above 0°C (at 6 hour resolution) divided by 4, similar to the PDD used by Reference Das and AlleyDas and Alley (2005) and analogous to ‘degree-days’ (e.g. Reference BraithwaiteBraithwaite, 1995; Reference Aizen, Aizen, Melack and KrenkeAizen and others, 2000, Reference Aizen, Aizen, Melack, Nakamura and Kobayashi2002; Reference HockHock, 2003). These same metrics were calculated for higher temperature thresholds from daily temperature records of Alaskan meteorological stations (US National Climatic Data Center) for comparison with the core record. Nearby Gulkana Glacier mass-balance data from the highest-elevation observation point (Site D, 1850 m; US Geological Survey–Glacier and Snow Program of Alaska and Washington Science Centers) and weather-station (1480 m) data were similarly compared with KPass annual melt-layer thickness. These stations and all other sites mentioned in the text are shown in Figure 1.
Geopotential height patterns at 500 hPa every 6 hours (NCEP/NCAR reanalysis) were analyzed during times when the gridpoint temperature exceeded 0°C, to elucidate any persistent atmospheric patterns that the melt layers represent. This mid-tropospheric pressure level was chosen because of its excellent representation of the dominant synoptic-scale weather patterns. Sounding profiles were obtained from the University of Wyoming Department of Atmospheric Science website.
3. Local Meteorology and Climate
Alaska exhibits a wide range of climates. The state is surrounded by oceans and seas on all sides except the east where it borders Canada, and daily and annual temperature ranges are strongly subdued by the maritime influence near the coast. The interior has a continental climate with high temperatures regularly exceeding 25°C in the summer, and wintertime lows frequently dropping below −30°C (Reference Shulski and WendlerShulski and Wendler, 2007). The dominant moisture source for most of the state, including Denali National Park, is the Gulf of Alaska (GoA), the nearby mid-latitudinal North Pacific Ocean and the Bering Sea. Decadal-scale mean annual and June–August (JJA) temperatures for the state of Alaska are strongly associated with North Pacific sea-surface temperature anomalies, described by the phase of the Pacific Decadal Oscillation (PDO) index, at r = 0.72 and 0.57, respectively (p < 0.0001 for both). Precipitation amount varies largely with the strength of the Aleutian low, which is associated with the phase of the Pacific–North American pattern (Reference Wallace and GutzlerWallace and Gutzler, 1981), a teleconnection of El Niño Southern Oscillation and the PDO (Reference Shulski and WendlerShulski and Wendler, 2007).
The mean summer (JJA) temperature at KPass, based on the NCEP gridpoint, is −4.0°C. The 2004 JJA average of −0.5°C was by far the warmest summer since at least 1948 (the beginning of the dataset), with −1.9°C in 1957 the second warmest. One below-average summer occurred between 2003 and 2007, which was in 2006 at −4.5°C. KPass daily temperature correlates well with regional temperatures (Yakutat 0.77, McGrath 0.81, Cantwell 0.83, Talkeetna 0.83), including Arctic stations (Barrow 0.80, Bettles 0.83, Kotzebue 0.84), indicating regionally coherent air masses.
Typical summer weather stays below freezing but is punctuated by occasional periods of above-freezing weather, referred to here as heat events (HEs). An HE is defined here as any period of time where the temperature exceeds 0°C. An inventory of HEs at KPass for 2003–07 is provided in Table 1. Some discontinuous HEs were grouped together if the temperature dropped slightly below freezing for a few 6 hour periods because one synoptic pattern was responsible for each HE and intrapattern variability created the brief drops below 0°C.
Inventory HE parameters (PDD, duration in days, and date of commencement). Boldface indicates an HE associated with a cut-off low

4. Melt Conceptual Model
Surface snowmelt can occur via above-freezing temperatures, rain and freezing rain, while albedo, relative humidity, insolation and wind speed are all variables that can change melt efficiency. Owing to the lack of meteorological observations at KPass, it is assumed that the effects on melting from all of these variables, except for temperature, are relatively constant on an annual basis. We also assume that the magnitude of melt is directly proportional to the air temperature above freezing. Once meltwater has formed, it can percolate down into older snow, spread horizontally if it encounters an impermeable layer of ice or a snow layer of higher density and refreeze into an ice layer (Reference Albert and PerronAlbert and Perron, 2000; Reference Das and AlleyDas and Alley, 2005; Reference Moran and MarshallMoran and Marshall, 2009). Individual ice layers have variable thickness of the order of millimeters to centimeters and may form at differing depths on small spatial scales (<1 m) (Reference ParryParry and others, 2007). Thin horizontal ice layers (generally <4 mm) can have holes, cracks or other weak points where meltwater can permeate (Reference Albert and PerronAlbert and Perron, 2000). Ice layers close to the surface can become temporarily permeable during suitable warm daytime conditions (Reference LanghamLangham, 1974; Reference Moran and MarshallMoran and Marshall, 2009). Ice cores sample only a small fraction of an ice layer; therefore, any given ice-layer sample may not be representative of the magnitude of the entire ice layer relative to other ice layers. This ice-layer variability and ice-core sampling technique complicates extracting a temperature–melt-layer thickness relationship, particularly on subannual timescales (Reference ParryParry and others, 2007). Nevertheless, melt percent time series have provided high-fidelity depictions of above-freezing temperature variability and mean summer and annual temperatures in several locations (Reference Herron, Herron and LangwayHerron and others, 1981; Reference Koerner and FisherKoerner and Fisher, 1990; Reference Alley and AnandakrishnanAlley and Anandakrishnan, 1995; Reference Kameda, Narita, Shoji, Nishio, Fujii and WatanabeKameda and others, 1995; Reference Das and AlleyDas and Alley, 2008; Reference KinnardKinnard and others, 2008).
5. Core Dating
A depth–age relationship was established via an iterative approach of counting seasonal variations in δD and the location of clusters of melt layers to identify annual layers. Thereafter, the δD time series was compared with temperature time series in the region to refine the sub-annual timescale. Anomalous δD events were dated with similar anomalous temperature events, resulting in timescale refinements of <3 months. The δD time series begins with snow that fell on 12 May 2008 (Fig. 2). The relatively low δD values at the top of the snowpack correspond to snowfall events during the 2007/08 cold season, and the first broad peak in δD is assigned to the 2007 warm season. A grouping of ice layers embedded in the δD peak and subsequent trough formed from melting surface snow during the 2007 warm season that percolated into the previous cold season’s snow. Another four similar cycles in δD and ice-layer groups follow, bringing the interpreted timeline back to the 2002/03 winter. Most ice layers remained in the firn of the previous 6 months (∼1.22 m w.e.). No adjustments were made to annual water equivalent (w.e.) depth for the few melt layers that percolated into the previous calendar year because the estimated error in the depth–age scale is larger than the amount of percolation. These interpretations are consistent with percolation in hotbox experiments at Siple Dome, where a PDD value of 5.2°C was sufficient to cause meltwater to percolate through ∼0.13 m w.e. of firn (Reference Das and AlleyDas and Alley, 2005). Stratigraphically, only one ice layer appears distinctly separate from the identifiable annual groupings. This 13.3 cm ice layer appears during the autumn of 2003, between the 2003 and 2004 ice-layer groupings, and is discussed in section 6.
Kahiltna Pass firn-core density (top), high-resolution δD (bottom, thin), smoothed δD (bottom, thick), peak summer markers (diamonds), peak winter markers (squares) and significant δD events (open circles) with a timescale as the x-axis. The arrows indicate the thickest ice layer (0.13 m) in the record and its associated spike in δD. The smoothed δD was done using a robust spline smoother (Reference Meeker, Mayewski, Bloomfield and DelmasMeeker and others, 1995). The relative thickness of the density layers and their relative spacing do not correspond to their relative physical thickness and spacing because of linear interpolation between reference horizons with time as the independent variable.

The average accumulation rate over the 5 year span of the record is 2.43 m w.e. a−1 and ranges from about 1.96 to 3.10 m a−1 (Table 2). Accumulation at Mount Wrangell, Alaska (4100 m a.s.l.), for June 2005–June 2006 was >2.5 m w.e. (Reference Kanamori, Benson, Truffer, Matoba, Solie and ShiraiwaKanamori and others, 2008), similar to 3.10 m at KPass. Evaporation during snowmelt contributes very little to w.e. loss (Reference Leydecker and MelackLeydecker and Melack, 1999; Reference Moran and MarshallMoran and Marshall, 2009). Note that the x-axis in Figure 2 is a timescale. The relative thicknesses of the ice layers and their relative spacing are unrepresentative of their actual physical and w.e. thickness and spacing.
Annual snow and ice-layer statistics for the Kahiltna Pass shallow core record. Italics denote incomplete data for the given 1 year time period

The highest and lowest δD values from each year are assigned the climatologically warmest and coolest days of the year, 20 July and 20 January, respectively, with subjective positioning where extremes of similar magnitude occur multiple times in a season. Four additional anomalous δD events (not associated with melt layers) were dated with the 700 hPa temperature time series (open circles in Fig. 2) assuming a strong stable-isotope–temperature relationship (Reference DansgaardDansgaard, 1964). Only month-scale or longer δD and temperature features were analyzed and marked because of shorter scale ambiguity arising from noise, the high sampling resolution (with respect to w.e. depth) and potential intracyclone δD changes at the top of the core. Relative humidity was evaluated during these anomalous temperature events to assure the likelihood of snowfall. With these five additional markers, the total number of constraints on the δD depth–age scale is 16 over nearly 5.5 years. In between these markers, the δD series is linearly extrapolated with time.
Absolute melt-layer thickness is used here to quantify the amount of melt because it varies directly with the magnitude and length of time temperature was above freezing, and a direct causal relationship with temperatures above 0°C can be explored, under the assumption that melt-layer thickness approximates the magnitude of the above-freezing event.
The modest amount of melt observed at KPass should have negligible deterioration of the seasonal δD records (e.g. Reference Moran and MarshallMoran and Marshall, 2009). Other sites of substantially more annual melt have provided records that retain strong seasonal signals (e.g. Reference Pfeffer and HumphreyPfeffer and Humphrey, 1996; Reference Grumet, Wake, Zielinski, Fisher, Koerner and JacobsGrumet and others, 1998). At Penny Ice Cap, Canada, only when annual melt percent exceeded 50% were the seasonal signals lost (Reference Grumet, Wake, Zielinski, Fisher, Koerner and JacobsGrumet and others, 1998). Meltwater percolation during melting events explains why the ice layers are offset from the SD summer maxima and has been documented in other studies (e.g. Reference Pfeffer and HumphreyPfeffer and Humphrey, 1996; Reference Grumet, Wake, Zielinski, Fisher, Koerner and JacobsGrumet and others, 1998; Reference Das and AlleyDas and Alley, 2005; Reference Moran and MarshallMoran and Marshall, 2009). The relatively high melt that occurred during the record warm 2004 summer may explain the comparatively low seasonal δD signal (Reference Moran and MarshallMoran and Marshall, 2009).
6. Results and Discussion
According to our timescale, in late 2003 a large amplitude spike in δD (+32‰) coincided with the thickest melt layer of the record (13.3 cm; marked with an open circle and vertical arrow in Fig. 2). Two pieces of evidence support the proposal that an anomalous melting event created this spike and that it is not a full summer layer. First, the melt layer is solitary, the thickest melt layer in the record, and does not look like any of the other four summers that consist of multiple thin ice layers. The second piece of evidence is that the high δD was measured from the ice layer, decreasing substantially on either side of it. The most probable cause of the large solitary ice layer is an anomalous warm event during the early 2004 warm season and subsequent percolation down through the snowpack. The first HE of the record warm 2004 summer (18 June–3 July, 50.6 PDD; Table 1) undoubtedly instigated a substantial melting event as it was the longest HE observed between 2003 and 2007. Substantial heat was available for the meltwater to percolate deep into the snowpack to the previous year. The late-spring snow that melted was probably of high-valued δD. This meltwater likely percolated down into the snowpack, refroze and created the δD spike that is embedded in the higher fractionated snow of the previous cold season.
The last HE of the preceding warm season may have resulted in an impermeable layer where this first meltwater of 2004 refroze. This event occurred on 1–2 October 2003 with about 48 hours of above-freezing air temperatures at KPass (NCEP gridpoint). The Anchorage, Fairbanks and McGrath sounding temperatures for these 2 days support above-freezing temperatures (up to ∼2°C) at KPass which could have created a water-flow barrier. The short duration and marginally warm temperatures indicate that the HE of 1–2 October 2003 could not have created the entire 13.3 cm ice layer.
The other two large HEs (>50 PDD) likely did not result in deep percolation. Both these events occurred after other HEs of that summer, which likely created impermeable ice layers that blocked deep percolation. Also noteworthy is that other melt layers are not associated with a spike in δD. Possible reasons are that these thinner melt layers constituted a smaller percentage of the 10 cm ice–firn sample and that the ice layers were split between two samples upon the 10 cm sample cutting. Other possible reasons are that the snow that melted was not of anomalously high δD, and exchanges between, and entrainment of, water molecules in the meltwater and surrounding firn occurred during percolation.
The absolute amounts of summer melt and annual accumulation as recorded in the KPass core are listed in Table 2. To explore the extent to which KPass melt layers are a good indicator of well-above average warm-season temperatures across the Alaska region, two correlative tests were performed. First, correlations were calculated between 2003 and 2007 summer (JJA) daily maximum temperatures at KPass (NCEP gridpoint) and various Alaska meteorological stations (Cantwell, Fairbanks, McGrath, McKinley Park and Talkeetna; Fig. 1). To minimize autocorrelation, the 11 day running-mean residuals technique, as described in section 2, was used. Correlations were highest with a 1 day lag for all but the closest station, McKinley Park, mainly due to the geographical distance between sites, and ranged between 0.37 and 0.49 (p < 0.0001). Secondly, cumulative annual melt-layer thickness (w.e.) was compared with cumulative PDD from several nearby weather stations, three Alaskan Arctic stations and the KPass gridpoint. These data and correlation coefficients are shown in Figure 3. Judging by the deeper offset of melt layers from their respective summers for 2004–07, it is likely that the firn-core record does not contain all ice layers from the 2003 summer. For this reason, the correlation coefficients listed are for 2004–07 (n = 4). For all temperature measures of above-average warmth used, the correlation coefficients for sub-Arctic stations are very high (0.94–1.00) and quite high for the Arctic stations (0.75–0.98). Additionally, Gulkana Glacier summer balance data correlate well with KPass annual melt-layer thickness at r = −0.82 (Fig. 3). Although we have only 4 years of complete melt-layer data, the correlation coefficients indicate that the melt layers at KPass provide a potential proxy for mean and extreme summertime temperatures that affect the Alaska region.
Plot of annual firn-core ice-layer w.e (thick solid line) or PDD above each station’s respective threshold daily maximum temperature and Gulkana Glacier summer mass balance (dotted line, inverted right y-axis). Correlation coefficients between the ice layer w.e. thickness and the heat proxies are listed in the legend.

Analysis of the HE inventory (Table 1) and ice-layer inventory (Table 3) shows that some years have more melt layers than HEs and vice versa, that there is no clear sense of which HEs were responsible for individual melt layers, and no indication of how much melt occurred from each HE (division of annual ice-layer depth by PDD yields widely ranging values year to year). Reference Pfeffer and HumphreyPfeffer and Humphrey (1996) show variations in snowpack structure, snow crystal structure and snowpack temperature cause high spatial variability in meltwater percolation and ice-layer formation, which likely are factors at KPass. Additional complexities arise from the magnitude, frequency and duration of HEs, as well as variable weather conditions.
Inventory of the thickness (cm) of all ice layers identified visually, in sequential order
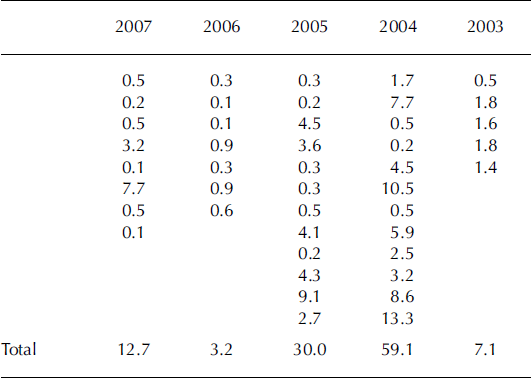
The five largest ice layers (13.3, 10.5, 9.1, 8.6, 7.7 cm) occurred during 2004 and 2005, the two warmest summers during 2003–07 (Table 3). The year of highest ice-layer thickness matches the warmest meteorological summer (JJA) on record (2004) for the state of Alaska and for the Denali National Park Headquarters (aka McKinley Park Headquarters) (Fig. 4). The 112.5 PDD in 2004 are more than double the next highest amount (54 in 2005) in the entire NCEP/NCAR reanalysis record (1948–present). The cumulative ice-layer thicknesses measured in 2006 and 2007 are <43% of that measured in either of the two warmest summers of 2004 and 2005. Similarly, annual PDD in 2006 and 2007 were <29% of those that occurred in either 2004 or 2005.
Time series of average summer (JJA) temperature at Denali National Park Headquarters (aka McKinley Park; solid line) for 1930–2008 and the closest NCEP/NCAR reanalysis gridpoint (62.5° N, 150.0° W, 700 hPa; dotted line) to Denali for 1948–2008. The 2004 summer is the warmest summer on record by 1.7°C for Denali National Park Headquarters. Denali National Park Headquarters data courtesy of P. Sousanes, Denali National Park and Preserve.

To determine the weather patterns responsible for the HEs, the 500 hPa geopotential height patterns and their evolution were evaluated for each >1 day HE. The patterns of the longest and warmest HEs from 2003–07 (those responsible for more melting) were characterized first. Three HEs lasted at least 2 weeks and experienced over 50 PDD: 18 June–3 July 2004, 3–23 August 2004 and 7–20 August 2005. These three events occurred during the 2 years of the highest total ice-layer thickness, with two in the top year. An analysis of the 500 hPa geopotential height patterns reveals a Rex-block pattern situated over the Alaska region for all three HEs. A Rex block (aka ‘high-over-low’ block; Reference BluesteinBluestein, 1993) at 500 hPa is observed as high heights located poleward of low heights, and both centers of the dipole are closed off from the open flow that splits around the Rex block. Rex blocks are climatologically favored in this region of the Northern Hemisphere (Reference BluesteinBluestein, 1993). A transient ‘high’ (or ridge) and ‘low’ (or trough) are ‘open’to air passing through them, as opposed to air being quasi-trapped within a closed high or low. No other long-lived Rex blocks formed during 2003–07 and only on five other occasions (four during 2005) did an atmospheric configuration similar to a Rex block form temporarily for up to 5 days.
Figure 5 shows a snapshot of each of the three Rex-block events. (Averaging the heights during an entire event is not representative of the prevailing blocking pattern due to the meandering of the block and surrounding features. 6 hourly animations of all three Rex-blocking events can be viewed at http://gust.sr.unh.edu/∼ekelsey/denali/.) The highs of each Rex block were located over roughly the same location (Alaska) and the lows show somewhat more variability in their position over the GoA. The dipole centers generally wandered about the locations depicted in Figure 5 during each HE. Each Rex block is associated with a downstream trough over Hudson Bay, Canada, and an upstream trough over eastern Siberia.
Snapshots of the 500 hPa geopotential height (m) during each of the three HEs caused by Rex-block events: (a) 12.00 UTC 29 June 2004; (b) 18.00 UTC 16 August 2004; and (c) 00.00 UTC 11 August 2005.

The formation of the Rex block constitutes the first 24–48 hours of each HE and all three formed through different processes. In the case of 18 June 2004, the cut-off high became established first as flow amplified over the eastern Pacific. A trough deepened, stretched southward to 30° N along 160° W and advected warm subtropical air northward into an amplifying ridge centered along the Alaska/Yukon border. The ridge cut off on 19 June and a piece of the upstream trough broke off and moved to the south of the ridge to form the Rex block on 21 June. The HE of 3 August 2004 began with a cut-off low that moved south along the Alaska/Yukon border into the GoA and merged with a second cut-off low moving east from the Bering Sea. A ridge built northward into Alaska between the lows and was pinched off by the merging lows. In the case of 7 August 2005, the Rex block formed as a consequence of a breaking wave where a ridge and downstream trough axes rotated clockwise until they were in a Rex-block orientation and then closed off from the main flow. The initial development of this wave appears to have been instigated upstream by an amplifying trough over the western Pacific.
For the shorter HEs, the height patterns are more diverse. No significant blocking patterns are seen (save for a weak 4 day omega block during the HE of 6 August 2003), which is not surprising since they typically last on the order of weeks. A feature prevalent in many of the HEs is the presence of a cut-off low in the GoA. In 19 of all 39 HEs (49%), the low was transient and moved through the GoA from west to east. Cut-off lows this high in latitude rarely occur outside the summer months because of weaker atmospheric dynamics, and the jet stream and polar front are at their furthest north locations climatologically during the summer. Cut-off lows are frequently associated with HEs because they are embedded in a larger-scale ridge that provides warm air over the Alaska region. All 19 HEs associated with a GoA cut-off low occurred during summer (JJA) out of a total of 28 summer (JJA) HEs (68%). Of HEs that lasted at least 24 hours, 64% were associated with a GoA cut-off low. All HEs of at least modest duration (2.5 days) and/or PDD (>3.1) experienced a GoA cut-off low. These cut-off low patterns are meteorologically similar to Rex blocks, with the exception of duration and the fact that the ridge remains open to the westerly flow.
For all HEs, the source of the warm air masses was in general from the south. Most air masses originated from the subtropical east or central Pacific, while some advected northwestward off the US and Canadian Rockies, an elevated heat source. The maintenance of long-duration HEs occurs through the persistence of the weather pattern through weak reinforcements of warm air and low potential vorticity associated with weak baroclinicity that is available. The shorter-duration HEs are associated typically with transient and often amplifying ridges that are replaced quickly by an eastward-moving upstream trough.
7. Conclusion
Analysis of the 4 year snow-pit and firn-core record from Kahiltna Pass supports the hypothesis that ice layers at this location provide a high-fidelity record of mean summertime temperatures for interior Alaska. KPass melt layers are associated with coherent, regional unusually warm summertime air masses and can be used as a proxy for the frequency of extreme warmth and the atmospheric circulation patterns that produce them. Large melting episodes (that last about 2 weeks or longer and create thick ice layers) occur when a Rex block becomes established over the Alaska region and troughs occur upstream over eastern Siberia and downstream over Hudson Bay. The 59.1 cm (27%) of melt in 2004 during the warmest Alaskan summer on record appears to be an anomalous event at an otherwise low-melt site (3–30 cm, 1–10%). Two Rex-block events in 2004 and one in 2005, each of which provided over 50 cumulative PDD, were responsible for the majority of the melting for those years. If Rex-block episodes are the only, or dominant, mechanism for >∼25 cm annual melting at KPass, then annual melt-layer thickness can be used to reconstruct the frequency of Alaska region Rex blocks and Hudson Bay and Siberian troughing. Analysis of a longer ice-core record that contains the period for which instrumental data exist for this region should be able to manifest other atmospheric modes for significant melting, if they exist. Smaller melting episodes occur via transient trough–ridge patterns that typically are associated with a cut-off low in the GoA, which will allow for the reconstruction of summertime cut-off low variability with a deep core.
A deep ice core from KPass will allow for the extension of this calibration period over the 20th century. A 20th-century time series of annual melt-layer thickness will provide warm-season temperature and atmospheric circulation data to articulate the Arctic and Alaskan warmth of the 1920s and the warm and cold periods associated with the phases of the PDO. The longer calibration period should provide statistically significant relationships between melt-layer thickness, regional temperature, Rex blocks, and cut-off lows that occur during unusual summertime warmth. With the calibrated ice core, the summertime climate of Alaska during the Little Ice Age and Medieval Warm Period climatic anomalies will be reconstructed and compared with other paleo-evidence. This study shows that significant contributions to the understanding of the climate of the North Pacific region can be made through the extraction and analysis of a deep core from Kahiltna Pass.
Acknowledgements
We thank the US National Science Foundation–Office of Polar Programs for financial support (Arctic Sciences grants 0713974 and 0714004), the Denali National Park Service staff for congenial collaborative efforts, and Polar Field Services for logistical support. We are grateful for the in-field drilling expertise of M. Waszkiewicz and the various in-field skills and strength of S. Campbell.


