

1. Introduction
Insurance and annuity products covering several lives require the modelling of the joint distribution of future lifetimes. Commonly in actuarial practice, the future lifetimes among a group of people are assumed to be independent. This simplifying assumption is not supported by real insurance data as demonstrated by numerous investigations. Joint life annuities issued to married couples offer a very good illustration of this fact. It is well known that husband and wife tend to be exposed to similar risks as they are likely to have the same living habits. For example, Parkes et al. (Reference Parkes, Benjamin and Fitzgerald1970) and Ward (Reference Ward1976) have brought to light the increased mortality of widowers, often called the broken-heart syndrome. Many contributions have shown that there could be a significant difference between risk-related quantities, such as risk premiums, evaluated according to dependence or independence assumptions. Denuit & Cornet (Reference Denuit and Cornet1999) have measured the effect of lifetime dependencies on the present value of a widow pension benefit. Based on the data collected in cemeteries, not only do their estimation results confirm that the mortality risk depends on the marital status, but also show that the amounts of premium are reduced approximately by 10% compared to model which assumes independence. According to data from a large Canadian insurance company, Frees et al. (Reference Frees, Carriere and Valdez1996) have demonstrated that there is a strong positive dependence between joint lives. Their estimation results indicate that annuity values are reduced by ~5% compared to the model with independence.
Introduced by Sklar (Reference Sklar1959), copulas have been widely used to model the dependence structure of random vectors. In the particular case of bivariate lifetimes, frailty models can be used to describe the common risk factors between husband and wife. Oakes (Reference Oakes1989) has shown that the bivariate distributions generated by frailty models are a subclass of Archimedean copulas. This makes this particular copula family very attractive for modelling bivariate lifetimes. We refer to Nelsen (Reference Nelsen2006) for a general introduction to copulas.
The Archimedean copula family has been proved valuable in numerous life insurance applications, see, e.g., Frees et al. (Reference Frees, Carriere and Valdez1996), Brown & Poterba (Reference Brown and Poterba1999), Carriere (Reference Carriere2000). In Luciano et al. (Reference Luciano, Spreeuw and Vigna2008), the marginal distributions and the copula are fitted separately and, the results show that the dependence increases with age.
It is known that the level of association between variables is characterised by the value of the dependence parameter. In this paper, a special attention is paid to this dependence parameter. Youn & Shemyakin (Reference Youn and Shemyakin1999) have introduced the age difference between spouses as an argument of the dependence parameter of the copula. In addition, the sign of the age difference is of great interest in our model. More precisely, we presume that the gender of the older member of the couple has an influence on the level of dependence between lifetimes. In order to confirm our hypothesis, four families of Archimedean copulas are discussed namely, Gumbel, Frank, Clayton and Joe copulas, all these under a Gompertz distribution assumption for marginals. The parameter estimations are based on the maximum likelihood approach using data from a large Canadian insurance company, the same set of data used by Frees et al. (Reference Frees, Carriere and Valdez1996). Following Joe & Xu (Reference Joe and Xu1996) and Oakes (Reference Oakes1989), a two-step technique, where marginals and copula are estimated separately, is applied. The results make clear that the dependence is higher when husband is older than wife.
Once the marginal and copula parameters are estimated, one needs to assess the goodness of fit of the model. For example, the likelihood ratio test is used in Carriere (Reference Carriere2000) whereas the model of Youn & Shemyakin (Reference Youn and Shemyakin1999) is based on the Akaike information criterion. In this paper, following Gribkova & Lopez (Reference Gribkova and Lopez2015) and Lawless (Reference Lawless2011), we implement a whole goodness-of-fit procedure to validate the model. Based on the Cramèr–von Mises statistics, the Gumbel copula, whose dependence parameter is a function of the age difference and its sign gives the best fit.
The rest of the paper is organised as follows. Section 2 describes the data set and provides some key facts that motivate our study. Section 3 describes the maximum likelihood procedure used to estimate the marginal distributions. The dependence models are examined in section 4. First, we describe the copula models whose parameter are estimated. Second, a bootstrap algorithm is proposed for assessing the goodness of fit of the model. Considering several annuity products available on the life insurance market, numerical applications with real data, including best estimate (BE) of liabilities, risk capital and stop-loss premiums are presented in section 5. Section 6 concludes the paper.
2. Motivation
As already shown in Maeder (Reference Maeder1996), being in a married couple can significantly influence the mortality. Moreover, the remaining lifetimes of male and female in the couple are dependent, see, e.g., Carriere (Reference Carriere2000), Frees et al. (Reference Frees, Carriere and Valdez1996). In this contribution, we aim at modelling the dependence between the lifetimes of a man and a woman within a married couple. Common dependence measures, which will be used in our study, are: the Pearson’s correlation coefficient r, the Kendall’s τ and the Spearman’s ρ. In order to develop these aspects, dataFootnote 1 from a large Canadian life insurance company are used. The data set contains information from policies that were in force during the observation period, i.e., from 29 December 1988 to 31 December 1993. Thus, we have 14,947 contracts among which 14,889 couples (one male and one female) and the remaining 58 are contracts where annuitants are both male (22 pairs) or both female (36 pairs). The same data set has been analysed in Frees et al. (Reference Frees, Carriere and Valdez1996), Carriere (Reference Carriere2000), Youn & Shemyakin (Reference Youn and Shemyakin1999), Gribkova & Lopez (Reference Gribkova and Lopez2015) among others, also in the framework of modelling bivariate lifetime. Since we are interested in the dependence within the couple, we focus our attention on the male–female contracts.
We refer the readers to Frees et al. (Reference Frees, Carriere and Valdez1996) for the data-processing procedure. The data set is left truncated as the annuitant information is recorded only from the date they enter the study; this means that insured who have died before the beginning of the observation period were not taken into account in the study. The data set is also right censored in the sense that most of the insured were alive at the end of the study. Considering our sample as described above, some couples having several contracts could appear many times. By considering each couple only once, our data set consists of 12,856 different couples for which, we can draw the following information:
∙ the age at the beginning of the observation x m and x f for male and female, respectively;
∙ the lifetimes under the observation period t m and t f for male and female, respectively; and
∙ the binary right-censoring indicator δ m and δ f for male and female, respectively;
∙ the couples benefit in Canadian Dollar (CAD) amount within a last survivor contract.
The entry age is the age at which, the annuitant enters the study. The lifetime at entry age corresponds to the lapse of time during which the individual was alive over the period of study. Therefore, for a male (resp. female) aged x m (resp. x f ) at entry and whose data are not censored, i.e., δ m =0 (resp. δ f =0), x m +t m (resp. x f +t f ) is the age at death. When the data are right censored, i.e., δ m =1 (resp. δ f =1), the number x m +t m (resp. x f +t f ) is the age at the end of the period of study (31 December 1993). The lifetime is usually equal to 5.055 years corresponding to the duration of the study period; but it is sometimes less as some people may entry later or die before the end of study. Benefit is paid each year until the death of the last survivor. Its value will be used as an input for the applications of the model to insurance products in section 5.2. Some summary statistics of the age distribution of our data set are displayed in Table 1.
Summary of the univariate distribution statistics.

It can be seen that the average entry age is 66.39 for the entire population, 67.87 for males and 64.91 for female; 90% of annuitants are older than 57.90 at entry and males are older than females by 3 years on average. Among the 11,457 couples considered there are 193 couples where both annuitants are died. Based on these 193 couples, the empirical dependence measures are displayed in the last row of Table 2. The values show that the ages at death of spouses are positively correlated.
Empirical dependence measures with respect to the gender of the elder partner.

From the existing literature, see, e.g., Denuit & Cornet (Reference Denuit and Cornet1999), Youn & Shemyakin (Reference Youn and Shemyakin1999), Denuit et al. (Reference Denuit, Dhaene, Le Bailly de Tilleghem and Teghem2001), Ji et al. (Reference Ji, Hardy and Li2011), Hougaard (Reference Hougaard2000), the dependence within a couple is often influenced by three factors:
∙ the common lifestyle that husband and wife follow, e.g., their eating habits, this is referred to as the long-term dependence;
∙ the short-term dependence or the broken-heart factor where the death of one would precipitate the death of the partner, often due to the vacuum caused by the passing away of the companion; and
∙ the common disaster that affects simultaneously the husband and his wife, as they are likely to be in the same area when a catastrophic event occurs, this dependence factor is considered as the instantaneous dependence.
Based on the common disaster and the broken-heart, Youn & Shemyakin (Reference Youn and Shemyakin1999) have introduced the age difference between spouses. Their results show that a model accounting for this aspect captures some additional association between lifetime of the spouses that would not be reflected in a model without age difference. It is also observed that, the higher the age difference is, the lower is the dependence. Referring to the same data set, Table 3 confirms their results, with |d| the absolute value of d and d=x m −x f .
Empirical dependence measures with respect to the age difference.

Our study follows the same lines of idea as these authors. In addition to the age difference, we believe that the gender of the elder partner may have an impact on their lifetimes dependencies. Indeed, the fact that the husband is older than the wife may influence their relationship, and indirectly, the dependence factors cited above. Despite the smallness of the sizes of the uncensored data does not allow us to conclude on the dependence structure of the 11,457 couples, it highlights well our hypothesis which will be verified with the whole data set. In this regard, the results displayed in Table 2 clearly show that the spouse lifetime dependencies are higher when d is positive, i.e., when husband is older than wife. The variable gender of the elder member is measured through the sign of the age difference d. Table 4 displays the empirical Kendall’s τ with respect to the age difference and to the gender of the elder partner. One can notice that the coefficients can vary for more than 30% depending on who is the older member of the couple.
Kendall’s τ correlation coefficients by age and gender of the elder partner.

In what follows, a bivariate lifetime model will verify our hypothesis. To this end, marginal distributions for each of the male and female lifetimes are, first, defined and, second, the copula models are introduced. The estimation methods will be detailed in sections 3 and 4.
3. Marginal Distributions
3.1. Background
The lifetime of a newborn shall be modelled by a positive continuous random variable, say X with distribution function (df) F and survival function S. The symbol (x) will be used to denote a live aged x and T(x)=(X−x)|X>x is the remaining lifetime of (x). The actuarial symbols t p x and t q x are, respectively, the survival function and the df of T(x). Indeed, the probability, for a live (x), to remain alive t more years is given by
 $$_{t} p_{x} \, {\equals}\, {\Bbb P}\left( {X\,\gt\,x{\plus}t{\rm \,\mid\,}X\,\gt\,x} \right)\, {\equals}\, {{{\Bbb P}\left( {X\,\gt\,x{\plus}t} \right)} \over {{\Bbb P}\left( {X\,\gt\,x} \right)}}\, {\equals}\, {{S\left( {x{\plus}t} \right)} \over {S\left( x \right)}}$$
When X has a probability density function f, then T(x) has a probability density function given by
 $$f_{x} \left( t \right)\, {\equals}\, _{t} p_{x} \,\mu \left( {x{\plus}t} \right)$$
where μ(.) is the hazard rate function, also called force of mortality.
Several parametric mortality laws such as De Moivre, constant force of mortality, Gompertz, Inverse-Gompertz, Makeham, Gamma, Lognormal and Weibull are used in the literature; see Bowers et al. (Reference Bowers, Gerber, Hickman, Jones and Nesbitt1986). The choice of a specific mortality model is determined mainly by the characteristics of the available data and the objective of the study. It is well known that the De Moivre law and the constant force of mortality assumptions are interesting for theoretical purposes whereas Gompertz and Weibull are more appropriate for fitting real data, especially for population of age over 30. The data set exploited in this paper regroups essentially policyholders who are at least middle-aged. That is why, in our study, the interest is on the Gompertz law whose characteristics are defined as follows:
 $$\mu \left( x \right)\, {\equals}\, Bc^{x} \quad {\rm and}\quad S\left( x \right)\, {\equals}\, exp\left( {{\minus}{B \over {ln\,c}}\left( {c^{x} {\minus}1} \right)} \right)\quad {\rm with}\quad B\,\gt\,0,\;c\,\gt\,1,\;x\geq 0$$
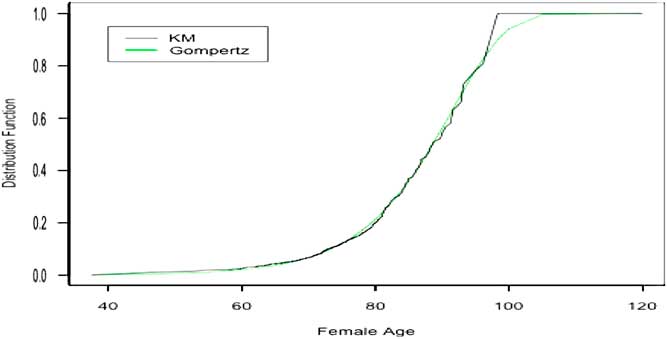
In addition, Frees et al. (Reference Frees, Carriere and Valdez1996) and Carriere (Reference Carriere2000) have shown that the Gompertz mortality law fits our data set very well, see Figure 1. For estimation purposes the Gompertz law has been reparametrised as follows (see Carriere, Reference Carriere1994):
 $$e^{{{{{\minus}m} \over \sigma }}} \, {\equals}\, {B \over {lnc}}\quad \quad {\rm and}\quad \quad e^{{{1 \over \sigma }}} \, {\equals}\, c$$
from which we obtain
 $$\eqalignno{ \mu \left( {x{\plus}t} \right)\, {\equals}\, & {1 \over \sigma }exp\left( {{{x{\plus}t{\minus}m} \over \sigma }} \right) \cr _{t} p_{x} \, {\equals}\, & exp \left( {e^{{{{x{\minus}m} \over \sigma }}} \left( {1{\minus}e^{{{t \over \sigma }}} } \right)} \right) $$
 $$\eqalignno{ f_{x} (t)\, {\equals}\, & exp\left( {e^{{{{x{\minus}m} \over \sigma }}} \left( {1{\minus}e^{{{t \over \sigma }}} } \right)} \right){1 \over \sigma }exp\left( {{{x{\plus}t{\minus}m} \over \sigma }} \right) \cr F_{x} (t)\, {\equals}\, & 1{\minus}exp\left( {e^{{{{x{\minus}m} \over \sigma }}} \left( {1{\minus}e^{{{t \over \sigma }}} } \right)} \right) $$
where the mode m>0 and the dispersion parameter σ>0 are the new parameters of the distribution.
Gompertz and Kaplan–Meier (KM)-fitted female distribution functions.
3.2. Maximum likelihood procedure
In what follows, we will use the following notation:
∙ The index j indicates the gender of the individual, i.e., j=m for male and j=f for female.
∙ θ j =(m j , σ j ) denotes the vector of unknown Gompertz parameters for a given gender j.
∙ n is the total number of couples in our data set. Hereafter, a couple means a group of two persons of opposite gender that have signed an insurance contract and i is the couple index with 1≤i≤n.
∙ For a couple i,
 $$t_{j}^{i} $$
is the remaining lifetime observed in the collected data. Indeed, for an individual of gender j aged x
j
, the remaining lifetime
$$T_{j}^{i} (x)$$
is a random variable such that
$$t_{j}^{i} $$
is the remaining lifetime observed in the collected data. Indeed, for an individual of gender j aged x
j
, the remaining lifetime
$$T_{j}^{i} (x)$$
is a random variable such that


 $$T_{j}^{i} \left( {x_{j} } \right)\, {\equals}\, min\left( {t_{j}^{i} ,\,B_{j}^{i} } \right)\quad {\rm and}\quad \delta _{j}^{i} \, {\equals}\, {\bf 1}_{{\left\{t_{j}^{i} \geq B_{j}^{i} } \right\}}} $$
where
 $$B_{j}^{i} $$
is a random censoring point of the individual of gender j in the couple i.
$$B_{j}^{i} $$
is a random censoring point of the individual of gender j in the couple i.
Consider a couple i where the male and female were, respectively, aged x m and x f at contract initiation date. For each gender j=m, f, the contribution to the likelihood is given by
 $$L_{j}^{i} \left( {\theta _{j} } \right)\, {\equals}\, \left[ {_{{B_{j}^{i} }} p_{{x_{j} }} \left( {\theta _{j} } \right)} \right]^{{\delta _{j}^{i} }} \left[ {f_{{x_{j} }}^{i} \left( {t_{j}^{i} ,\,\theta _{j} } \right)} \right]^{{1{\minus}\delta _{j}^{i} }} $$
We recall that the data set is left truncated that is why likelihood function in (3.2) has therefore to be conditional on survival to the entry age x j , see, e.g., Carriere (Reference Carriere2000). Therefore, the overall likelihood function can be written as follows:
 $$L_{j} \left( {\theta _{j} } \right)\, {\equals}\, \prod\limits_{i\, {\equals}\, 1}^n L_{j}^{i} \left( {\theta _{j} } \right),\quad j\, {\equals}\, m,\,f$$
By maximising the likelihood function in (3.3) using our data set, the maximum likelihood estimation estimates of the Gompertz df are displayed in Table 5.
Gompertz parameter estimates.

Standard errors are relatively low and estimation shows that the modal age at death is larger for females than for males. This latter can be explained by the fact that women have a longer life expectancy than men. A good way to analyse how well the model performs is to compare with the Kaplan–Meier (KM) product-limit estimator of the data set. We recall that the KM technique is an approach which consists in estimating non-parametrically the survival function from the empirical data. Figure 1 compares, for the female group, the KM estimator of the survival function to the one obtained from the Gompertz distribution estimated above. Since almost all the annuitants are older than 40 at entry, all the distributions are conditional on survival to age 40. The survival functions are plotted as a function of age x (for x=40 to x=110). The Gompertz curve is smooth whereas the KM is jagged. The figures clearly show that the estimated Gompertz model is a valid choice for approximating the KM curve.
4. Dependence Models
4.1. Background
The concept of copula was introduced by Sklar (Reference Sklar1959) in order to specify the joint df of a random vector by separating the behaviour of the marginals and the dependence structure. Without loss of generality, we focus on the bivariate case. We denote by T(x m ) and T(x f ) the future lifetime, respectively, for man and woman. Following Carriere (Reference Carriere2000), we couple the lives at the time when they start being observed. Specifically, if T(x m ) and T(x f ) are positive and continuous, there exists a unique copula C:[0, 1]2→[0, 1] which specifies the joint df of the bivariate random vector (T(x m ), T(x f )) as follows:
 $${\Bbb P}\left( {T(x_{m} )\leq t_{1} ,\,T(x_{f} )\leq t_{2} } \right)\, {\equals}\, C\left( {{\Bbb P}\left( {T(x_{m} )\leq t_{1} } \right),\,{\Bbb P}\left( {T(x_{f} )\leq t_{2} } \right)} \right)\, {\equals}\, C ( {_{{t_{1} }} q_{{x_{m} }} ,\,_{{t_{2} }} q_{{x_{f} }} } )$$
Similarly, the survival function of (T(x m ), T(x f )) is written in terms of copulas and marginal survival functions. This is given by
 $${\Bbb P}\left( {T(x_{m} )\,\gt\,t_{1} ,T(x_{f} )\,\gt\,t_{2} } \right)\, {\equals}\, \tilde{C}( {_{{t_{1} }} p_{{x_{m} }} ,\,_{{t_{2} }} p_{{x_{f} }} } \right)\, {\equals}\, _{{t_{1} }} p_{{x_{m} }} {\plus}_{{t_{2} }} p_{{x_{f} }} {\minus}1{\plus}C ( {_{{t_{1} }} q_{{x_{m} }} ,\,_{{t_{2} }} q_{{x_{f} }} } \right)$$
A broad range of parametric copulas has been developed in the literature. We refer to Nelsen (Reference Nelsen2006) for a review of the existing copula families. The Archimedean copula family is very popular in life insurance applications, especially due to its flexibility in modelling dependent random lifetimes, see, e.g., Frees et al. (Reference Frees, Carriere and Valdez1996), Youn & Shemyakin (Reference Youn and Shemyakin1999). If ϕ is a convex and twice-differentiable strictly decreasing function, the df of an Archimedean copula is given by
 $$C_{\phi } (u,\,v)\, {\equals}\, \phi ^{{{\minus}1}} (\phi (u){\plus}\phi (v))$$
where ϕ: [0, 1]→[0, ∞] is the generator of the copula satisfying ϕ(1)=0 with u, v∈[0, 1]. In this paper, four well-known copulas are discussed. First, the Gumbel copula generated by
 $$\phi (t)\, {\equals}\, ({\minus}ln(t))^{{{\minus}\alpha }} ,\quad \alpha \,\gt\,1,$$
which yields the copula
 $$C_{\alpha } (u,\,v)\, {\equals}\, exp\left\{ {{\minus}\left[ {({\minus}ln(u))^{\alpha } {\plus}({\minus}ln(v))^{\alpha } } \right]^{{1/\alpha }} } \right\},\quad \alpha \,\gt\,1$$
Second, we have the Frank copula
 $$C_{\alpha } (u,\,v)\, {\equals}\, {\minus}{1 \over \alpha }{\rm ln}\left( {1{\plus}{{\left( {e^{{{\minus}\alpha u}} {\minus}1} \right)\left( {e^{{{\minus}\alpha v}} {\minus}1} \right)} \over {\left( {e^{{{\minus}\alpha }} {\minus}1} \right)}}} \right),\quad \alpha \,\ne\,0$$
with generator
 $$\phi (t)\, {\equals}\, {\minus}ln\left( {{{e^{{{\minus}\alpha t}} {\minus}1} \over {e^{{{\minus}\alpha }} {\minus}1}}} \right),\quad \alpha \,\ne\,0$$
Third, the Clayton copula is associated to the generator
 $$\phi (t)\, {\equals}\, t^{{{\minus}\alpha }} {\minus}1,\quad \alpha \,\gt\,0$$
and is given by
 $$C_{\alpha } (u,\,v)\, {\equals}\, \left( {u^{{{\minus}\alpha }} {\plus}v^{{{\minus}\alpha }} {\minus}1} \right)^{{{\minus}1/\alpha }} ,\quad \alpha \,\gt\,0$$
Finally, the Joe copula
 $$C_{\alpha } (u,\,v)\, {\equals}\, 1{\minus}\left( {(1{\minus}u)^{\alpha } {\plus}(1{\minus}v)^{\alpha } {\minus}(1{\minus}u)^{\alpha } (1{\minus}v)^{\alpha } } \right)^{{1/\alpha }} ,\quad \alpha \,\gt\,1$$
has generator ϕ(t)=−ln(1−(1−t)−α ), α>1.
Clearly, the parameter α in (4.2)–(4.5) determines the dependence level between the two marginal distributions. In our case, that would be the lifetimes of wife and husband. Youn & Shemyakin (Reference Youn and Shemyakin1999) have utilised a Gumbel copula where the association parameter α depends on d as follows:
 $$\alpha (d)\, {\equals}\, 1{\plus}{{\beta _{0} } \over {1{\plus}\beta _{2} d^{2} }},\quad \beta _{0} ,\,\beta _{2} \in{\Bbb R}$$
where d=x m −x f , with x m and x f the ages for male and female, respectively.
In our model for α, in addition to this specification, the gender of the elder partner, represented by the sign of d, is also taken into account. This latter is captured through the second term of the denominator β 1 d in equations (10) and (11). Thus, for our model the copula association parameter for the Frank and the Clayton is expressed by
 $$\alpha (d)\, {\equals}\, {{\beta _{0} } \over {1{\plus}\beta _{1} d{\plus}\beta _{2} \,\mid\! d\!\mid\,}},\quad \beta _{0} ,\,\beta _{1} ,\,\beta _{2} \in{\Bbb R}$$
Since the copula parameter α in the Gumbel and Joe copulas is restricted to be >1, the corresponding dependence parameter in (4.8) is allowed to have an intercept of 1 and we write
 $$\alpha (d)\, {\equals}\, 1{\plus}{{\beta _{0} } \over {1{\plus}\beta _{1} d{\plus}\beta _{2} \,\mid\!d\!\mid\,}},\quad \beta _{0} ,\,\beta _{1} ,\,\beta _{2} \in{\Bbb R}$$
It can be seen that if β 1<0, the dependence parameter is lower when husband is younger than wife, i.e. d<0. Also when d tends to infinity, the dependence parameter goes to 0 for Frank and Clayton and 1 for the Gumbel copula, thus tending towards the independence assumption. Note in passing that instead of taking d 2 as in equation (4.6), we use |d| in both (4.7) and (4.8) for the representation of the absolute age difference.
4.2. Estimation of parameters
The maximum likelihood procedure has been widely used to fit lifetime data to copula models, see, e.g., Lawless (Reference Lawless2011), Shih & Louis (Reference Shih and Louis1995), Carriere (Reference Carriere2000). This method consists in estimating jointly the marginal and copula parameters at once. However, given the huge number of parameters to be estimated at the same time, this approach is computationally intensive. Therefore, we adopt a procedure that allows the determination of marginal and copula parameters, separately. In this respect, Joe & Xu (Reference Joe and Xu1996) have proposed a two-step technique which, first, estimates the marginal parameters θ
j
, j=m, f, and the copula parameter α(d) in the second step. This is referred to as the inference functions for margins (IFM) method. Specifically, the survival function of each lifetime is evaluated by maximizing the likelihood function in (3). For each couple i with
 $$x_{m}^{i} $$
and
$$x_{m}^{i} $$
and
 $$x_{f}^{i} $$
, let
$$x_{f}^{i} $$
, let
 $$u_{i} {\rm \,\colon\,}\!{\equals}\, _{{t_{m}^{i} }} p_{{x_{m}^{i} }} \left( {\hat{\theta }_{m} } \right)$$
and
$$u_{i} {\rm \,\colon\,}\!{\equals}\, _{{t_{m}^{i} }} p_{{x_{m}^{i} }} \left( {\hat{\theta }_{m} } \right)$$
and
 $$v_{i} {\rm \,\colon\,}\!{\equals}\, _{{t_{f}^{i} }} p_{{x_{f}^{i} }} ( {\hat{\theta }_{f} } )$$
be the resulting marginal survival functions for male and female, respectively. Considering the right-censoring feature of the two lifetimes as indicated by
$$v_{i} {\rm \,\colon\,}\!{\equals}\, _{{t_{f}^{i} }} p_{{x_{f}^{i} }} ( {\hat{\theta }_{f} } )$$
be the resulting marginal survival functions for male and female, respectively. Considering the right-censoring feature of the two lifetimes as indicated by
 $$\delta _{m}^{i} $$
and
$$\delta _{m}^{i} $$
and
 $$\delta _{f}^{i} $$
, the estimates
$$\delta _{f}^{i} $$
, the estimates
 $$\widehat{{\alpha (d)}}$$
of the copula parameters are obtained by maximising the likelihood function:
$$\widehat{{\alpha (d)}}$$
of the copula parameters are obtained by maximising the likelihood function:
 $$\eqalignno{ L(\alpha (d)){\rm \,\colon\,}\! {\equals}\, L(\alpha )\, {\equals}\, & \prod\limits_{i\, {\equals}\, 1}^n \quad \left[ {{{\partial ^{2} \tilde{C}_{\alpha } (u_{i} ,v_{i} )} \over {\partial u_{i} \partial v_{i} }}} \right]^{{\left( {1{\minus}\delta _{m}^{i} } \right)( {1{\minus}\delta _{f}^{i} } \right)}} \quad \left[ {{{\partial \tilde{C}_{\alpha } (u_{i} ,v_{i} )} \over {\partial u_{i} }}} \right]^{{( {1{\minus}\delta _{m}^{i} } \right)\delta _{f}^{i} }} \cr & {\times}\,\left[ {{{\partial \tilde{C}_{\alpha } (u_{i} ,v_{i} )} \over {\partial v_{i} }}} \right]^{{\delta _{m}^{i} ( {1{\minus}\delta _{f}^{i} } \right)}} \quad \quad[ {\tilde{C}_{\alpha } (u_{i} ,v_{i} )} \right]^{{\delta _{m}^{i} \delta _{f}^{i} }} $$
A similar two-step technique, known as the Omnibus semi-parametric procedure or the pseudo-maximum likelihood, was also introduced by Oakes (Reference Oakes1989). In this procedure, the marginal distributions are considered as nuisance parameters of the copula model. The first step consists in estimating the two marginals survival functions non-parametrically using the KM method. After rescaling the resulting estimates by
 $${n \over {n{\plus}1}}$$
, we obtain the pseudo-observations (U
i,n
, V
i,n
) where
$${n \over {n{\plus}1}}$$
, we obtain the pseudo-observations (U
i,n
, V
i,n
) where
 $$U_{{i,\,n}} \, {\equals}\, {{\hat{S}_{m} \left( {x_{m}^{i} {\plus}t_{m}^{i} } \right)} \over {\hat{S}_{m} \left( {x_{m}^{i} } \right)}}\quad {\rm and}\quad V_{{i,\,n}} \, {\equals}\, {{\hat{S}_{m} ( {x_{f}^{i} {\plus}t_{f}^{i} } \right)} \over {\hat{S}_{m} ( {x_{f}^{i} } \right)}}$$
In the second step, the copula estimation is achieved by maximising the following function:
 $$\eqalignno{ L(\alpha (d)){\rm \,\colon\,}\! {\equals}\, L(\alpha )\, {\equals}\, & \prod\limits_{i\, {\equals}\, 1}^n \quad \left[ {{{\partial ^{2} \tilde{C}_{\alpha } (U_{{i,n}} ,V_{{i,n}} )} \over {\partial U_{{i,n}} \partial V_{{i,n}} }}} \right]^{{\left( {1{\minus}\delta _{m}^{i} } \right)( {1{\minus}\delta _{f}^{i} } \right)}} \quad \left[ {{{\partial \tilde{C}_{\alpha } (U_{{i,n}} ,V_{{i,n}} )} \over {\partial U_{{i,n}} }}} \right]^{{\left( {1{\minus}\delta _{m}^{i} } \right)\delta _{f}^{i} }} \cr & {\times}\left[ {{{\partial \tilde{C}_{\alpha } (U_{{i,n}} ,V_{{i,n}} )} \over {\partial V_{{i,n}} }}} \right]^{{\delta _{m}^{i} ( {1{\minus}\delta _{f}^{i} } \right)}} \quad \quad \left[ {\tilde{C}_{\alpha } (U_{{i,n}} ,V_{{i,n}} )} \right]^{{\delta _{m}^{i} \delta _{f}^{i} }} $$
Genest et al. (Reference Genest, Ghoudi and Rivest1995) and Shih & Louis (Reference Shih and Louis1995) have shown that the resulting estimators of the copula parameters are consistent and asymptotically normally distributed. Due to their computational advantages, the IFM and the Omnibus approaches are used in our estimations. By comparing the results stemming from the two techniques, we can analyse to which extent a certain copula is a reliable model for bivariate lifetimes within a couple. Tables 6 and 7 display the copula estimations based on our data set. The number in bracket under each estimate represents the standard error of the estimation. The estimated values from the IFM and the omnibus estimations are quite close for the Gumbel, the Frank and the Joe copulas. The important difference observed in the Clayton case indicates that this copula is probably not appropriate for modelling the bivariate lifetimes in our data set. The negative sign of
 $$\hat{\beta }_{1} $$
in all cases demonstrates that if husband is older than wife (i.e. d>0), their lifetimes are more likely to be correlated. The positive sign of
$$\hat{\beta }_{1} $$
in all cases demonstrates that if husband is older than wife (i.e. d>0), their lifetimes are more likely to be correlated. The positive sign of
 $$\hat{\beta }_{2} $$
suggests that the higher the age difference is, the lesser is the level of dependence between lifetimes. The parameters
$$\hat{\beta }_{2} $$
suggests that the higher the age difference is, the lesser is the level of dependence between lifetimes. The parameters
 $$\hat{\beta }_{1} $$
and
$$\hat{\beta }_{1} $$
and
 $$\hat{\beta }_{2} $$
have opposing effects on
$$\hat{\beta }_{2} $$
have opposing effects on
 $$\hat{\alpha }(d)$$
. In this regard, since
$$\hat{\alpha }(d)$$
. In this regard, since
 $${\rm \,\mid\,}\hat{\beta }_{2} {\rm \!\mid\,}\,\gt {\rm \,\mid\,}\hat{\beta }_{1} {\rm \!\mid\,}$$
, the maximum level of dependence is attained when d=0, i.e., when wife and husband have exactly the same age.
$${\rm \,\mid\,}\hat{\beta }_{2} {\rm \!\mid\,}\,\gt {\rm \,\mid\,}\hat{\beta }_{1} {\rm \!\mid\,}$$
, the maximum level of dependence is attained when d=0, i.e., when wife and husband have exactly the same age.
Inference functions for margins method: copula parameters estimate α (d) and α.

Omnibus approach: copula parameters estimate α (d) and α.

Our estimate of α (d) under the Gumbel copula is quite similar to the results in the model of Youn & Shemyakin (Reference Youn and Shemyakin1999), where
 $$\hat{\beta }_{0} \, {\equals}\, 1.02,\,\hat{\beta }_{1} \, {\equals}\, 0$$
and
$$\hat{\beta }_{0} \, {\equals}\, 1.02,\,\hat{\beta }_{1} \, {\equals}\, 0$$
and
 $$\hat{\beta }_{2} \, {\equals}\, 0.02$$
. Column 8 contains the estimation output when the dependence parameter α does not depend on d. When d=0, α (0)=β
0 (or 1+β
0 for Gumbel and Joe ) and that is equivalent to the case where the dependence parameter is not in function of the age difference.
$$\hat{\beta }_{2} \, {\equals}\, 0.02$$
. Column 8 contains the estimation output when the dependence parameter α does not depend on d. When d=0, α (0)=β
0 (or 1+β
0 for Gumbel and Joe ) and that is equivalent to the case where the dependence parameter is not in function of the age difference.
4.3. Goodness of fit
A goodness-of-fit procedure is performed in order to assess the robustness of our model. For this purpose, the model, including age difference and gender of the elder member within the couple with α (d), is compared to two other types, namely the one where the copula parameter does not depend on d and the model of Youn & Shemyakin (Reference Youn and Shemyakin1999). Many approaches for testing the goodness of fit of copula models are proposed in the literature, see, e.g., Genest et al. (Reference Genest, Rémillard and Beaudoin2009) (Berg, Reference Berg2009). We refer to Genest et al. (Reference Genest, Rémillard and Beaudoin2009) for an overview of the existing methods. There are several contributions highlighting the properties of the empirical copula, especially when the data are right censored, the contributions of Dabrowska (Reference Dabrowska1988), Prentice et al. (Reference Prentice, Zoe Moodie and Wu2004), Gribkova & Lopez (Reference Gribkova and Lopez2015) are some examples. In our framework, the goodness-of-fit approach is based on the non-parametric copula introduced in Gribkova & Lopez (Reference Gribkova and Lopez2015) and Lopez (Reference Lopez2012) as follows:
 $$C_{n} (u_{1} ,\,u_{2} )\, {\equals}\, {1 \over n}\mathop{\sum}\limits_{i\, {\equals}\, 1}^n \left( {1{\minus}\delta _{m}^{i} } \right) ( {1{\minus}\delta _{f}^{i} } )W_{{in}} {\Bbb 1}_{{ \{ {T ( {x_{m}^{i} } )\leq \hat{F}_{{m,\,n}}^{{{\minus}1}} (u_{1} ),\,T ( {x_{f}^{i} } )\leq \hat{F}_{{f,\,n}}^{{{\minus}1}} (u_{2} )} \}}} $$
where
 $$W_{{in}} \, {\equals}\, {1 \over {S_{{B_{m} }} ( {{\rm max} ( {T_{m}^{i} ,T_{f}^{i} {\minus}{\epsilon}_{i} } ){\minus}} )}}$$
and
$$W_{{in}} \, {\equals}\, {1 \over {S_{{B_{m} }} ( {{\rm max} ( {T_{m}^{i} ,T_{f}^{i} {\minus}{\epsilon}_{i} } ){\minus}} )}}$$
and
 $$S_{{B_{m} }} $$
is the survival function of the right censored random variable B
m
that is estimated using KM approach;
$$S_{{B_{m} }} $$
is the survival function of the right censored random variable B
m
that is estimated using KM approach;
 $${\epsilon}_{i} \, {\equals}\, B_{f}^{i} {\minus}B_{m}^{i} $$
. The term
$${\epsilon}_{i} \, {\equals}\, B_{f}^{i} {\minus}B_{m}^{i} $$
. The term
 $$\hat{F}_{{j,\,n}}^{{{\minus}1}} $$
is the KM estimator of the quantile function of
$$\hat{F}_{{j,\,n}}^{{{\minus}1}} $$
is the KM estimator of the quantile function of
 $$T ( {x_{j}^{i} } ),\,j\, {\equals}\, m,\,f$$
. The particularity of equation (4.11) is that, the uncensored observations are twice weighted (with 1/n and W
in
) unlike the original empirical copula where the same weight 1/n is assigned to each observation. The weight W
in
is devoted to compensate right censoring. Based on the p-value, the goodness-of-fit test indicates to which extent a certain parametric copula is close to the empirical copula C
n
. We adopt the Cramèr–von Mises statistics to assess the adequacy of the hypothetical copula to the empirical one, namely
$$T ( {x_{j}^{i} } ),\,j\, {\equals}\, m,\,f$$
. The particularity of equation (4.11) is that, the uncensored observations are twice weighted (with 1/n and W
in
) unlike the original empirical copula where the same weight 1/n is assigned to each observation. The weight W
in
is devoted to compensate right censoring. Based on the p-value, the goodness-of-fit test indicates to which extent a certain parametric copula is close to the empirical copula C
n
. We adopt the Cramèr–von Mises statistics to assess the adequacy of the hypothetical copula to the empirical one, namely
 $${\cal V}_{n} \, {\equals}\, \mathop{\int}_{[0,\,1]^{2} } K_{n} (v)dK_{n} (v)$$
where
 $$K_{n} (v)\, {\equals}\, \sqrt n \left( {C_{n} (v){\minus}C_{{\hat{\alpha }(d)}} (v)} \right)$$
is the empirical copula process. Genest et al. (Reference Genest, Rémillard and Beaudoin2009) have proposed an empirical version of equation (4.12) which is given by
$$K_{n} (v)\, {\equals}\, \sqrt n \left( {C_{n} (v){\minus}C_{{\hat{\alpha }(d)}} (v)} \right)$$
is the empirical copula process. Genest et al. (Reference Genest, Rémillard and Beaudoin2009) have proposed an empirical version of equation (4.12) which is given by
 $$\widehat{{\cal V}}_{n} \, {\equals}\, \mathop{\sum}\limits_{i\, {\equals}\, 1}^n (C_{n} (u_{{1i}} ,\,u_{{2i}} ){\minus}C_{{\hat{\alpha }(d)}} (u_{{1i}} ,\,u_{{2i}} ))^{2} $$
The assertion, the bivariate lifetime within the couple is described by the studied copula, is then tested under the null hypothesis H0. Since the Cramèr–von Mises statistics
 $$\widehat{v}_{n} $$
does not possess an explicit df, we implement a bootstrap procedure to evaluate the p-value as presented in the following pseudo-algorithm. For some large integer ξ, the following steps are repeated for every k=1, … , ξ:
$$\widehat{v}_{n} $$
does not possess an explicit df, we implement a bootstrap procedure to evaluate the p-value as presented in the following pseudo-algorithm. For some large integer ξ, the following steps are repeated for every k=1, … , ξ:
∙ Step 1: Generate lifetimes from the hypothetical copula, i.e.
$$\left( {U_{i}^{b} ,\,V_{i}^{b} } \right),\,i\, {\equals}\, 1,\,\,\ldots\,,\,n$$
is generated from
$$C_{{\hat{\alpha }(d)}} $$
. If the IFM method is used to determine
$$\hat{\alpha }(d)$$
, then the two lifetimes are produced from the Gompertz distribution:where
$$( {t_{m}^{{b,\,i}} \, {\equals}\, F_{{x_{m} }}^{{{\minus}1}} ( {U_{i}^{b} ,\,\hat{\theta }_{m} } ),\,t_{f}^{{b,\,i}} \, {\equals}\, F_{{x_{f} }}^{{{\minus}1}} ( {V_{i}^{b} ,\,\hat{\theta }_{f} } )} )$$
$$\hat{\theta }_{j} ,\;j\, {\equals}\, m,\,f$$
are taken from Table 5, while, for the omnibus, the corresponding lifetimes are generated with the KM estimators of the quantile functions of T(x
j
), j=m, f
$$( {t_{m}^{{b,\,i}} \, {\equals}\, \hat{F}_{{m,\,n}}^{{{\minus}1}} ( {U_{i}^{b} }),\,t_{f}^{{b,i}} \, {\equals}\, \hat{F}_{{f,\,n}}^{{{\minus}1}} ( {V_{i}^{b} } )} )$$
∙ Step 2: Generate the censored variables
$$B_{m}^{{b,i}} $$
and
$$B_{f}^{{b,i}} ,\,i\, {\equals}\, 1,\,\,\ldots\,,\,n$$
from the empirical distribution of B
m
and B
f
, respectively.∙ Step 3: Considering the same data as used for the estimation, replicate the insurance portfolio by calculating:
for each couple i of ages
$$\eqalignno{ & T^{b} ( {x_{m}^{i} } )\, {\equals}\,{\rm min}( {t_{m}^{{b,i}} ,\,B_{m}^{{b,i}} } ),\quad \delta _{m}^{{b,i}} \, {\equals}\, {\Bbb 1}_{{\{ {t_{m}^{{b,i}} \geq B_{m}^{{b,i}} } \}}} \cr & T^{b} ( {x_{f}^{i} } )\, {\equals}\, {\rm min}( {t_{f}^{{b,i}} ,\,B_{f}^{{b,i}} }),\quad \delta _{f}^{{b,i}} \, {\equals}\, {\Bbb 1}_{{ \{ {t_{f}^{{b,i}} \geq B_{f}^{{b,i}} } \}}} $$
$$x_{m}^{i} $$
and
$$x_{f}^{i} $$
.∙ Step 4: If the IFM approach is chosen in Step 1, the parameters of the marginals and the hypothetical copula parameters are estimated from the bootstrapped data
$$( {T^{b} ( {x_{m}^{i} }),\,T^{b} ( {x_{f}^{i} } ),\,\delta _{m}^{{b,i}} ,\,\delta _{f}^{{b,i}} } )$$
by maximising (3.2) and (4.9) whereas under the omnibus approach, the hypothetical copula parameters are estimated from the bootstrapped data as well by maximising equation (4.10).∙ Step 5: Compute the Cramèr–von Mises statistics
$$\hat{v}_{{n,\,k}}^{b} $$
using (4.13).∙ Step 6: Evaluate the estimate of the p-value as follows:


 $$\hat{p}\, {\equals}\, {1 \over {K{\plus}1}}\mathop{\sum}\limits_{k\, {\equals}\, 1}^\xi {\Bbb 1}_{{\{ {\hat{{\cal V}}_{{n,\,k}}^{b} \geq \hat{{\cal V}}_{n} } \right\}}} $$
Based on 1,000 bootstrap samples, the results of the goodness of fit is summarised in Table 8. It can be seen that for both IFM and Omnibus, our model have a greater p-value than the model without age difference, showing that age difference between spouses is an important dependence factor of their joint lifetime. Under the Gumbel model in Youn & Shemyakin (Reference Youn and Shemyakin1999) where β 1=0, the p-value is evaluated at 0.672. For the Gumbel copula in Table 8, the p-value in the model with α (d) is slightly higher, strengthening the evidence that the sign of d captures some additional association between spouses.
Goodness-of-fit test: p-value of each copula model.

Note: IFM, inference functions for margins.
At a critical level of 5%, the three copula families are accepted, even though the Clayton copula performs inadequately. Actually, as pointed out in Gribkova & Lopez (Reference Gribkova and Lopez2015), the important percentage of censored data in the sample results in a huge loss of any goodness of fit test. Therefore, these results cannot efficiently assess the lifetime dependence within a couple. Nevertheless, the calculated p-values may give an idea about which direction to go. In this regard, since the Gumbel and Frank copulas have the highest p-value, they are good candidates for addressing the dependence of the future lifetimes of husband and wife in this Canadian life insurer portfolio.
Furthermore, since the copula parameter without age difference is nested by the one with age difference, likelihood ratio test can be used to verify if the two parameters β 1 and β 2 in (4.7) and (4.8) are significant. Specifically, introduced by Neyman & Pearson (Reference Neyman and Pearson1933) the likelihood ratio test compares two nested hypothesis: the null hypothesis H0 with constrained parameters and the alternative hypothesis H1 with unconstrained parameters. Clearly, the model with constraints β 1=β 2=0 in (4.7) and (4.8) corresponds to H0 and the one with age difference corresponds to H1. Let L 0, L 1 be the maximum likelihood function values based on H0 and H1, respectively, the test statistic is given by
 $$\lambda \, {\equals}\, 2(ln(L_{1} ){\minus}ln(L_{0} ))$$
The null hypothesis is rejected at a significance level α if
 $$\lambda \,\gt\,\chi _{{r,\,1{\minus}\alpha }}^{2} $$
, with r the number of restricted parameters, r=2 in our case, and
$$\lambda \,\gt\,\chi _{{r,\,1{\minus}\alpha }}^{2} $$
, with r the number of restricted parameters, r=2 in our case, and
 $$\chi _{{r,\,1{\minus}\alpha }}^{2} $$
is the 1−α quantile of a χ
2 distribution with r degrees of freedom. At a significance level of 5%, all the test statistics of the copula families presented in Table 9 are greater than
$$\chi _{{r,\,1{\minus}\alpha }}^{2} $$
is the 1−α quantile of a χ
2 distribution with r degrees of freedom. At a significance level of 5%, all the test statistics of the copula families presented in Table 9 are greater than
 $$\chi _{{2,\,0.95}}^{2} \, {\equals}\, 5.991$$
, which means that the null hypothesis is rejected. Thus, the models allowing age difference in the copula parameter give a better fit than the models without age difference. This justifies the significance of β
1 and β
2 in (4.7) and (4.8).
$$\chi _{{2,\,0.95}}^{2} \, {\equals}\, 5.991$$
, which means that the null hypothesis is rejected. Thus, the models allowing age difference in the copula parameter give a better fit than the models without age difference. This justifies the significance of β
1 and β
2 in (4.7) and (4.8).
Likelihood ratio statistic of each copula model.

Note: IFM, inference functions for margins.
4.4. Comparison with recent studies
In this subsection, we compare our results with recent studies. Luciano et al. (Reference Luciano, Spreeuw and Vigna2016) have introduced longevity risk in modelling spouses dependencies. In this respect, similarly to our approach, they model marginals and the dependence separately where the dependence within couples is governed mainly by Archimedean copula. By separating the same data set used in our paper into a group of younger generation and a group of older generation, they conclude that spouses dependences decreases when passing from older generation to younger generation. Clearly, for the same age difference lifetime dependence between young couple is weaker than the one for old couple. In addition, the effect of cohort is also included in our model. Actually, the larger the age difference between spouses the weaker the dependence which means that the husband (the wife) belongs to the group of older generation while the wife (the husband) to the younger cohort.
Recently, Lu (Reference Lu2017) has proposed a mixed proportional hazards model to capture the mortality dependence within spouses. First, he concludes that the broken-heart syndrome explains a large proportion of the correlation of the lifetime of husband and wife and the level of the dependence is asymmetric. This finding of asymmetric dependence is in line with our results saying that when the husband is older than the wife the correlation is higher. Second, he introduces a new dependence factor namely the unobserved heterogeneity of broken-heart syndrome which comes from the fact that the husband wife share the same correlated risk factors. This new dependence factor is not considered in our model.
5. Insurance Applications
5.1. Life insurance annuity contracts involving couple lives
Multiple life actuarial calculations is common in the insurance practice. Hereafter, (x) stands for the husband aged x whereas (y) is the wife. Considering a couple (xy), T(xy) describes the remaining time until the first death between (x) and (y) and, it is known as the joint life status. Conversely,
 $$T\left( {\overline{{xy}} } \right)$$
is the time until death of the last survivor. The variables
$$T\left( {\overline{{xy}} } \right)$$
is the time until death of the last survivor. The variables
 $$T\left( {\overline{{xy}} } \right)$$
and T(xy) are random and we can write
$$T\left( {\overline{{xy}} } \right)$$
and T(xy) are random and we can write
 $$T\left( {xy} \right)\, {\equals}\, {\rm min} \left( {T\left( x \right),\,T\left( y \right)} \right){\rm where}\,{\rm as}\,T\left( {\overline{{xy}} } \right)\, {\equals}\, {\rm max}\left( {T\left( x \right),\,T\left( y \right)} \right)$$
As in the single-life model, the survival probabilities are given by
 $$_{t} p_{{xy}} \, {\equals}\, {\Bbb P}\left( {T\left( {xy} \right)\,\gt\,t} \right)\quad {\rm and}\quad _{t} p_{{\overline{{xy}} }} \, {\equals}\, {\Bbb P}\left( {T\left( {\overline{{xy}} } \right)\,\gt\,t} \right)$$
Clearly, if T(x) and T(y) are independent, then
 $$_{t} p_{{xy}} \, {\equals}\, _{t} p_{x} \;_{t} p_{y} \quad {\rm and}\quad _{t} p_{{\overline{{xy}} }} \, {\equals}\, 1{\minus}_{t} q_{x} \;_{t} q_{y} $$
The curtate life expectancies, for T(xy) and
 $$T\left( {\overline{{xy}} } \right)$$
, respectively, are given by
$$T\left( {\overline{{xy}} } \right)$$
, respectively, are given by
 $$e_{{xy}} \, {\equals}\, {\Bbb E}\left( {T\left( {xy} \right)} \right)\, {\equals}\, \mathop{\sum}\limits_{t\, {\equals}\, 1}^\infty {_{t} p_{{xy}} } \quad {\rm and}\quad e_{{\overline{{xy}} }} \, {\equals}\, {\Bbb E}\left( {T\left( {\overline{{xy}} } \right)} \right)\, {\equals}\, \mathop{\sum}\limits_{t\, {\equals}\, 1}^\infty {_{t} p_{{\overline{{xy}} }} } $$
with the following relationship
 $$e_{{\overline{{xy}} }} \, {\equals}\, e_{x} {\plus}e_{y} {\minus}e_{{xy}} $$
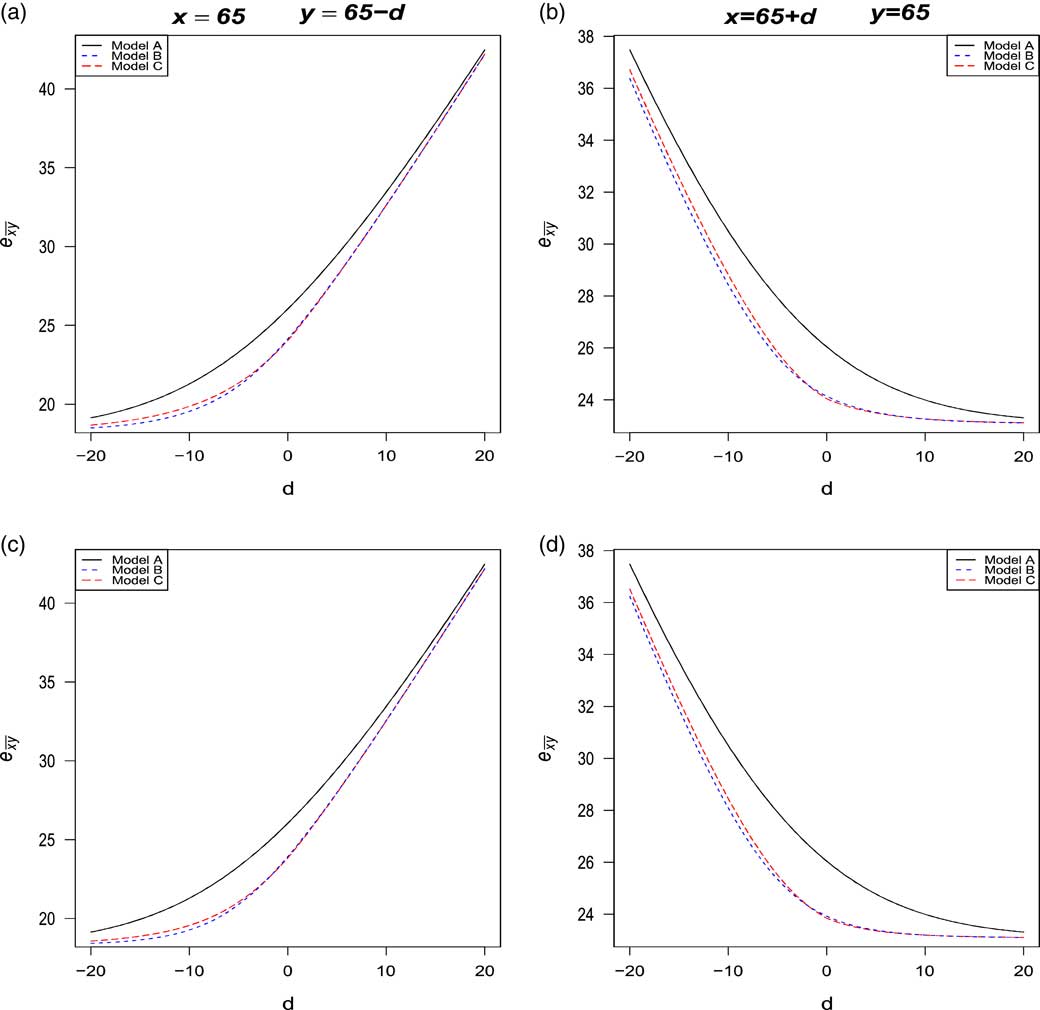
Figures 2 and 3 compare the evolution of
 $$e_{{\overline{{xy}} }} $$
as a function of the age difference d=x−y, under the following models:
$$e_{{\overline{{xy}} }} $$
as a function of the age difference d=x−y, under the following models:
∙ model A: T(x) and T(y) are independent;
∙ model B: T(x) and T(y) are dependent with a constant copula parameter α=α 0;
∙ model C: T(x) and T(y) are dependent with a copula parameter α (d) as described in (4.7) and (4.8).
Comparison of
 $$e_{{\overline{{xy}} }} $$
under models A, B and C: Gumbel and Frank copulas.
$$e_{{\overline{{xy}} }} $$
under models A, B and C: Gumbel and Frank copulas.
Comparison of
 $$e_{{\overline{{xy}} }} $$
under models A, B and C: Clayton and Joe copulas.
$$e_{{\overline{{xy}} }} $$
under models A, B and C: Clayton and Joe copulas.
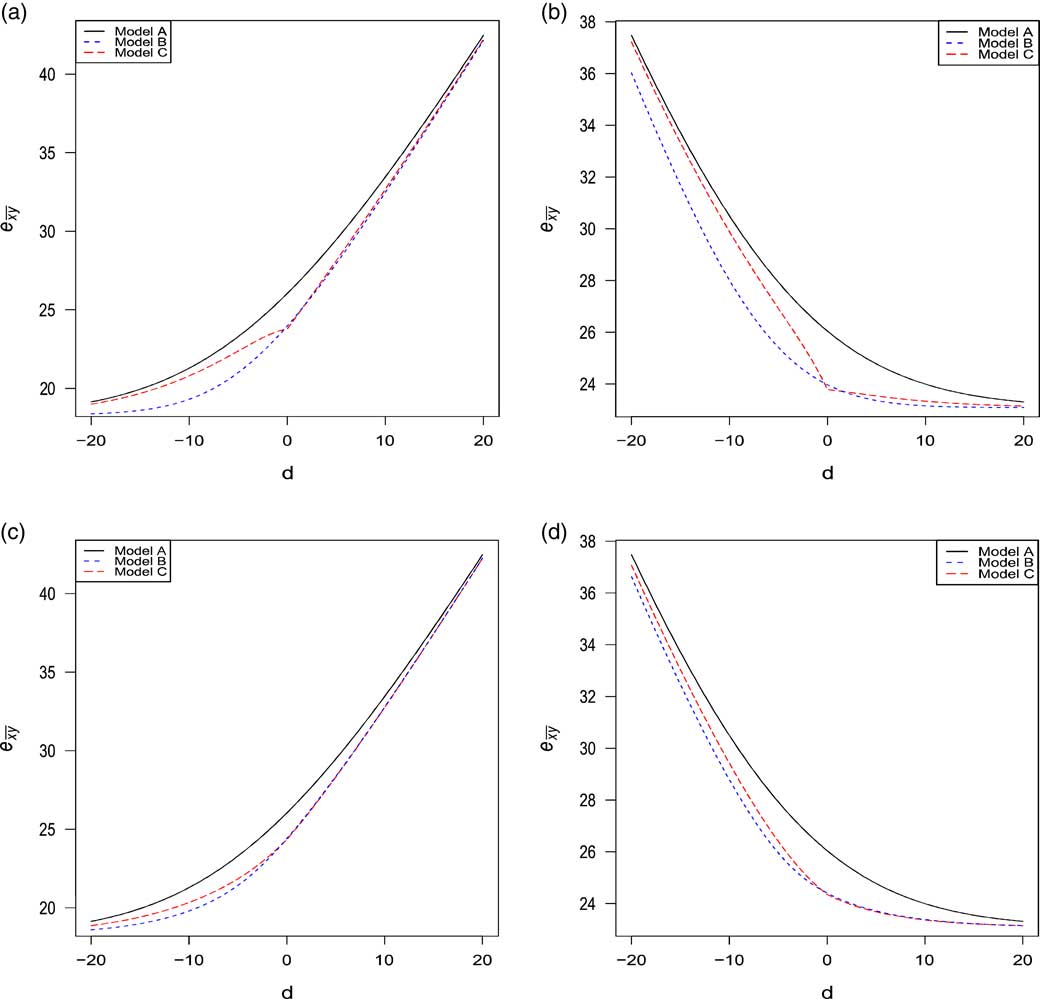
On the left (resp. right), the graphs were constructed under the assumption of x=65 (resp. y=65) for the husband (resp. wife) and the age difference d ranges from −20 to 20 as more than 99% of our portfolio belongs to this interval. The fixed age is set to 65 because this is the retirement age in many countries. The analysis was made under the four families of copula described in section 4. In general, it can be seen that the life expectancy of the last survivor
 $$e_{{\overline{{xy}} }} $$
increases when
$$e_{{\overline{{xy}} }} $$
increases when
 $$e_{{\overline{{xy}} }} \, {\equals}\, e_{{\overline{{65\,\colon\,65{\minus}d}} }} $$
whereas it decreases when
$$e_{{\overline{{xy}} }} \, {\equals}\, e_{{\overline{{65\,\colon\,65{\minus}d}} }} $$
whereas it decreases when
 $$e_{{\overline{{xy}} }} \, {\equals}\, e_{{\overline{{65{\plus}d\,\colon\,65}} }} $$
. This result strengthens the evidence that the sign of d has an effect on annuity values. For example, when |d|=10 under the Gumbel copula:
$$e_{{\overline{{xy}} }} \, {\equals}\, e_{{\overline{{65{\plus}d\,\colon\,65}} }} $$
. This result strengthens the evidence that the sign of d has an effect on annuity values. For example, when |d|=10 under the Gumbel copula:
 $$e_{{\overline{{65\,\colon\,55}} }} \, {\equals}\, 32.62\geq e_{{\overline{{55\,\colon\,65}} }} \, {\equals}\, 28.82$$
When comparing the models A, B and C, it can be seen that the life expectancy
 $$e_{{\overline{{xy}} }} $$
is clearly overvalued under the model A of independence assumption, thus confirming the results obtained in Frees et al. (Reference Frees, Carriere and Valdez1996), Youn & Shemyakin (Reference Youn and Shemyakin1999), Denuit & Cornet (Reference Denuit and Cornet1999). Now, let us focus our attention on models B and C considering only Gumbel, Frank and Joe copulas as it has been shown in the previous section that the Clayton copula might not be appropriate for the Canadian insurer’s data. In all graphs, the life expectancy is always lower or equal under model B and the rate of decreases may exceed 2%. The largest decrease is observed when d<0, i.e., when husband is younger than wife.
$$e_{{\overline{{xy}} }} $$
is clearly overvalued under the model A of independence assumption, thus confirming the results obtained in Frees et al. (Reference Frees, Carriere and Valdez1996), Youn & Shemyakin (Reference Youn and Shemyakin1999), Denuit & Cornet (Reference Denuit and Cornet1999). Now, let us focus our attention on models B and C considering only Gumbel, Frank and Joe copulas as it has been shown in the previous section that the Clayton copula might not be appropriate for the Canadian insurer’s data. In all graphs, the life expectancy is always lower or equal under model B and the rate of decreases may exceed 2%. The largest decrease is observed when d<0, i.e., when husband is younger than wife.
In order to illustrate the importance of these differences, we consider four types of multiple life insurance annuity products. First, Product 1 is the joint life annuity which pays benefits until the death of the first of the two annuitants. For a husband (x) and his wife (y) who receive continuously a rate of 1, the present value of future obligations and its expectation are given by
 $$\bar{a}_{{\overline{{T\left( {xy} \right)\,\mid\,}} }} \, {\equals}\, {{1{\minus}exp\left( {{\minus}\delta T\left( {xy} \right)} \right)} \over \delta }\quad {\rm and}\quad \bar{a}_{{xy}} \, {\equals}\, {\Bbb E}\left( {\bar{a}_{{\overline{{T\left( {xy} \right){\rm \,\mid\,}}} }} } \right)$$
where δ is the constant instantaneous interest rate (also called force of interest). The variable
 $$\bar{a}_{{\overline{{T\left( {xy} \right){\rm \,\mid\,}}} }} $$
can be seen as the insurer liability regarding (xy). Product 2 is the last survivor annuity which pays a certain amount until the time of the second death
$$\bar{a}_{{\overline{{T\left( {xy} \right){\rm \,\mid\,}}} }} $$
can be seen as the insurer liability regarding (xy). Product 2 is the last survivor annuity which pays a certain amount until the time of the second death
 $$T\left( {\overline{{xy}} } \right)$$
. In that case, the present value of future annuities and its expectation are given by
$$T\left( {\overline{{xy}} } \right)$$
. In that case, the present value of future annuities and its expectation are given by
 $$\bar{a}_{{\overline{{T\left( {\overline{{xy}} } \right){\rm \,\mid\,}}} }} \, {\equals}\, {{1{\minus}exp\left( {{\minus}\delta T\left( {\overline{{xy}} } \right)} \right)} \over \delta }\quad {\rm and}\quad \bar{a}_{{\overline{{xy}} }} \, {\equals}\, {\Bbb E}\left( {\bar{a}_{{\overline{{T\left( {\overline{{xy}} } \right)}} {\rm \,\mid\,}}} } \right)$$
In practice, payments often start at a higher level when both beneficiaries are alive. It drops at a lower level on the death of either and continues until the death of the survivor. This case is emphasised by Product 3 where the rate is 1 when both annuitant are alive and reduces to ${2 \over 3}$
after the first death. Product 3 is actually a combination of the two first annuities. Thus, the insurer liabilities and its expectation are given by
${2 \over 3}$
after the first death. Product 3 is actually a combination of the two first annuities. Thus, the insurer liabilities and its expectation are given by
 $$V\left( {\overline{{xy}} } \right)\, {\equals}\, {1 \over 3}\bar{a}_{{\overline{{T\left( {xy} \right){\rm \,\mid\,}}} }} {\plus}{2 \over 3}\bar{a}_{{\overline{{T\left( {\overline{{xy}} } \right){\rm \,\mid\,}}} }} \quad {\rm and}\quad {\Bbb E}\left( {V\left( {\overline{{xy}} } \right)} \right)\, {\equals}\, V_{{\overline{{xy}} }} \, {\equals}\, {1 \over 3}\bar{a}_{{xy}} {\plus}{2 \over 3}\bar{a}_{{\overline{{xy}} }} $$
where
 $${\Bbb E}\left( {\bar{a}_{{\overline{{T\left( {\overline{{xy}} } \right)\,\mid\,}} }} } \right)\, {\equals}\, \bar{a}_{{\overline{{xy}} }} $$
.
$${\Bbb E}\left( {\bar{a}_{{\overline{{T\left( {\overline{{xy}} } \right)\,\mid\,}} }} } \right)\, {\equals}\, \bar{a}_{{\overline{{xy}} }} $$
.
Fourth, imagine a family or couple whose income is mainly funded by the husband. The family may want to guarantee its source of income for the eventual death of the husband. For this purpose, the couple may buy the so called reversionary annuity for which the payments start right after the death of (x) until the death of (y). No payment is made if (y) dies before (x). As for Product 3, the reversionary annuity (Product 4) is also a combination of some specific annuity policies and the total obligations of the insurer and its expectation are computed as follows:
 $$\bar{a}_{{\overline{{T\left( x \right)\,\mid\,T\left( y \right)\,\mid\,}} }} \, {\equals}\, \bar{a}_{{\overline{{T\left( y \right)\,\mid\,}} }} {\minus}\bar{a}_{{\overline{{T\left( {xy} \right)\,\mid\,}} }} \quad {\rm and}\quad \bar{a}_{{x\,\mid\,y}} \, {\equals}\, {\Bbb E}\left( {\bar{a}_{{\overline{{T\left( x \right)\,\mid\,T\left( y \right)\,\mid\,}} }} } \right)\, {\equals}\, \bar{a}_{y} {\minus}\bar{a}_{{xy}} $$
In what follows, considering each of the insurance Products 1, 2, 3 and 4, comparison of models A, B and C will be discussed. The analysis will include the valuation of the BE of the aggregate liability of the insurer as well as the quantification of risk capital and stop-loss premiums.
5.2. Risk capital and stop-loss premium
In the enterprise risk management framework, insurers are required to hold a certain capital. This amount, known as the risk capital, is used as a buffer against unexpected large losses. The value of this capital is quantified in a way that the insurer is able to cover its liabilities with a high probability. For instance, under Solvency II, it is the value-at-risk (VaR) at a tolerance level of 99.5% of the insurer total liability, while for the Swiss Solvency Test (SST), it is the expected shortfall (ES) at 99%. Let L be the aggregate liability of the insurer. At a confidence level α, the VaR is given by
 $$VaR_{L} (\alpha )\, {\equals}\, inf\left\{ {l\in{\Bbb R}{\rm \,\colon\,}{\Bbb P}\left( {L\leq l} \right)\geq \alpha } \right\}$$
whilst the ES is
 $$ES_{L} (\alpha )\, {\equals}\, {\Bbb E}\left( {L{\rm \!\mid\!}L\,\gt\,VaR_{L} (\alpha )} \right)$$
These risk measures will serve to compare models A, B and C for each type of product. As the insurance portfolio is made of n policyholders, we define
 $$L\, {\equals}\, \mathop{\sum}\limits_{i\, {\equals}\, 1}^n L_{i} $$
where L i represents the total amount due to a couple i of (x i ) and (y i ). The data set used in the calculations is the same as those used for the model estimations and described in section 2. In principle, the couple i receives the amount b i at the beginning of each year until the death of the last survivor. However, in our applications, b i will be the continuous benefit rate in CAD for each type of product. For example, in the particular case of Product 3:
 $$L_{i} \, {\equals}\, b_{i} V\left( {\overline{{x_{i} y_{i} }} } \right)\, {\equals}\, b_{i} \left( {{1 \over 3}\bar{a}_{{\overline{{T\left( {x_{i} ,\,y_{i} } \right){\rm \,\mid\,}}} }} {\plus}{2 \over 3}\bar{a}_{{\overline{{T\left( {\overline{{x_{i} ,\,y_{i} }} } \right){\rm \,\mid\,}}} }} } \right)$$
Since there is no explicit form for the distribution of L, a simulation approach will serve to evaluate the insurer aggregate liability. The pseudo-algorithm used for simulations is presented in the following steps:
∙ Step 1: For each couple i, generate (U i , V i ) from the copula model (models A or B or C).
∙ Step 2: For each couple i with x i and y i , generate the future lifetime T(x i ), T(y i ) from the Gompertz distribution as follows:
(5.3)where
$$T(x_{i} )\, {\equals}\, F_{{x_{i} }}^{{{\minus}1}} \left( {U_{i} ,\,\hat{\theta }_{m} } \right)\quad {\rm and}\quad T(y_{i} )\, {\equals}\, F_{{y_{i} }}^{{{\minus}1}} \left( {V_{i} ,\,\hat{\theta }_{f} } \right)$$
$$\hat{\theta }_{j} ,\;j\, {\equals}\, m,\,f$$
are taken from Table 5.∙ Step 3: Evaluate the liability L i for each couple i=1, … , n.
∙ Step 4: Evaluate the aggregate liability of the insurer
$$L\, {\equals}\, \mathop{\sum}\nolimits_{i\, {\equals}\, 1}^n {L_{i} } $$
.


Due to its goodness-of-fit performance, the Gumbel copula will be used in the calculations for models B and C. Mortality risk is assumed to be the only source of uncertainty and we consider a constant force of interest of δ=1%. For each product described in subsection 5.1, Steps 1–4 are repeated 1,000 times in order to generate the distribution of L. In addition to the risk capital measured as under the Solvency II and the SST framework, the BE of the aggregate liability of the insurer (i.e.
 $$BE\, {\equals}\, {\Bbb E}(L)$$
), the coefficient of variation and the stop-loss premium
$$BE\, {\equals}\, {\Bbb E}(L)$$
), the coefficient of variation and the stop-loss premium
 $$SL\, {\equals}\, {\Bbb E}\left( {(L{\minus}\zeta )_{{\plus}} } \right)$$
are also evaluated, where ζ is the deductible. For the portfolio of Products 1, 2, 3 and 4, the amount of ζ in millions CAD are, respectively, 4, 4.5, 4.2, 1.7. Results are presented in Tables 10−13 according to each product. For the ease of understanding all values have been converted to a per Model A basis and presented in per cent (the corresponding amounts are presented in Appendix A). As we could expect, the model A with independent lifetime assumption misjudges the total liability of the insurer. The highest differences are observable with Product 4 in Table 13. In this respect, the difference between models A and C reaches 17.49% for the BE, 25.44% for the risk capitals and 48.01% for the stop-loss premiums. By comparing models B and C, the findings tell minor differences. The variation noticed in Figure 2 (when d<0) are practically non-existent in the aggregate values for most of the products under investigation. In other words, while the effects of the age difference and its sign are noticeable on the individual liability (see subsection 5.1), the effects on the aggregate liability are merely small. This is due to the law of large numbers and to the high proportion of couple with d>0 in our portfolio (70%). Actually, the compensation of the positive and negative effects of the age difference on the lifetimes dependency in the whole portfolio mitigates its effects on the aggregate liability. However, it should be noted that the relative difference exceeds 1.41% for the VaR
L
(0.95) in Table 13.
$$SL\, {\equals}\, {\Bbb E}\left( {(L{\minus}\zeta )_{{\plus}} } \right)$$
are also evaluated, where ζ is the deductible. For the portfolio of Products 1, 2, 3 and 4, the amount of ζ in millions CAD are, respectively, 4, 4.5, 4.2, 1.7. Results are presented in Tables 10−13 according to each product. For the ease of understanding all values have been converted to a per Model A basis and presented in per cent (the corresponding amounts are presented in Appendix A). As we could expect, the model A with independent lifetime assumption misjudges the total liability of the insurer. The highest differences are observable with Product 4 in Table 13. In this respect, the difference between models A and C reaches 17.49% for the BE, 25.44% for the risk capitals and 48.01% for the stop-loss premiums. By comparing models B and C, the findings tell minor differences. The variation noticed in Figure 2 (when d<0) are practically non-existent in the aggregate values for most of the products under investigation. In other words, while the effects of the age difference and its sign are noticeable on the individual liability (see subsection 5.1), the effects on the aggregate liability are merely small. This is due to the law of large numbers and to the high proportion of couple with d>0 in our portfolio (70%). Actually, the compensation of the positive and negative effects of the age difference on the lifetimes dependency in the whole portfolio mitigates its effects on the aggregate liability. However, it should be noted that the relative difference exceeds 1.41% for the VaR
L
(0.95) in Table 13.
Relative best estimate (BE) and risk capital for the joint life annuity portfolio.

Note: CoV, coefficient of variation; SL, stop-loss premium; VaR, value-at-risk; ES=expected shortfall.
Relative best estimate (BE) and risk capital for the last survivor annuity (Product 2) portfolio.

Note: CoV, coefficient of variation; SL, stop-loss premium; VaR, value-at-risk; ES=expected shortfall.
Relative best estimate (BE) and risk capital for the last survivor annuity (Product 3) portfolio.

Note: CoV, coefficient of variation; SL, stop-loss premium; VaR, value-at-risk; ES=expected shortfall.
Relative best estimate (BE) and risk capital for the contingent annuity portfolio.

Note: CoV, coefficient of variation; SL, stop-loss premium; VaR, value-at-risk; ES=expected shortfall.
6. Conclusion
In this paper, we propose both parametric and semi-parametric techniques to model bivariate lifetimes commonly seen in the joint life insurance practice. The dependence factors between lifetimes are examined namely the age difference between spouses and the gender of the elder partner in the couple. Using real insurance data, we develop an appropriate estimator of the joint distribution of the lifetimes of spouses with copula models in which the association parameters have been allowed to incorporate the aforementioned dependence factors. A goodness-of-fit procedure clearly shows that the introduced models outperform the models without age factors. The results of our illustrations, focussing on valuation of joint life insurance annuity products, suggest that lifetimes dependence factors should be taken into account when evaluating the BE of the annuity products involving spouses.
Acknowledgements
The authors acknowledge partial support from a Swiss National Science Foundation grant and the project RARE -318984 (an FP7 Marie Curie IRSES Fellowship). G. R. is partially supported by Vaudoise Assurances. The authors would also like to thank Nicolas Salani for the interesting discussions during the preparation of this contribution. The authors gratefully acknowledge the two anonymous referees for their insightful comments which helped improving the paper.
Appendices
Appendix A: Risk measures for the aggregate liability of the insurer.
Risk capital for the joint life annuity portfolio in Canadian Dollar.

Risk capital for the last survivor annuity (Product 2) portfolio in Canadian Dollar.

Risk capital for the last survivor annuity (Product 3) portfolio in Canadian Dollar.

Risk capital for the life contingent annuity portfolio in Canadian Dollar.


