


1. Introduction
Hydraulic fracturing is typically used to improve the permeability of hydrocarbon or geothermal reservoirs by further opening and propagating existing fractures and by creating new fractures to form connected networks as efficient fluid pathways (Montgomery & Smith, Reference Montgomery and Smith2010). Reservoir stimulation by induced hydraulic fracturing started as early as the 1860s and became standard practice in industry in the late 1940s when the term ‘hydraulic fracturing’ came into use (Clark, Reference Clark1949; Krueger, Reference Krueger1973; Montgomery & Smith, Reference Montgomery and Smith2010; Gehne & Benson, Reference Gehne and Benson2019). The basic theory of how fluid pressure affects fracturing was developed simultaneously using the concept of effective stresses (Terzaghi, Reference Terzaghi1923, Reference Terzaghi1943; Biot, Reference Biot1941; see also review of Guerriero & Mazzoli, Reference Guerriero and Mazzoli2021). It was then soon realized that naturally elevated fluid pressures can also induce the formation of hydraulic fractures (Anderson, Reference Anderson1939; Hubbert, Reference Hubbert1951; Hubbert and Rubey, Reference Hubbert and Rubey1959, Sibson et al. Reference Sibson, Moore and Rankin1975; Cox et al. Reference Cox, Etheridge and Wall1986; Engelder & Lacazette, Reference Engelder, Lacazette, Barton and Stephansson1990). This appears particularly obvious in the case of igneous dykes, i.e. originally magma-filled fractures. With the frozen magma still preserved as the proverbial smoking gun inside the fractures, it is clear that the fluid ‘magma’ caused or at least played a significant role in the formation, opening and propagation of the fractures. Theory on the formation and propagation of magma-filled fractures rapidly developed from the 1970s (Weertman, Reference Weertman1971; Spence & Turcotte, Reference Spence and Turcotte1985; Takada, Reference Takada1990; Rubin, Reference Rubin1995). It is, however, of interest to note that the pioneering paper by Weertman (Reference Weertman1971) derived its theory from water-filled crevasses in ice. It is currently widely accepted that fluid pressure must be considered for brittle deformation in fluid-bearing rocks. Although magma-induced hydrofracturing has made a significant impact on hydrofracture theory, we here focus on non-igneous hydrofracturing by aqueous fluids. A difference with magmas is that aqueous fluids are rarely sourced from a single large volume, such as magma chambers for igneous hydrofractures, and that aqueous fluids do not freeze like a magma, but may leave traces by mineral precipitates or wall rock alterations (see review by Oliver and Bons, Reference Oliver and Bons2001). For reviews that include igneous hydrofractures, the reader is referred to Gudmundsson (Reference Gudmundsson2011) and Rivalta et al. (Reference Rivalta, Taisne, Bunger and Katz2015).
It was only around 1960 that the term ‘hydrofracture’ as an alternative to ‘hydraulic fracture’ appeared, first in the literature of the former USSR (e.g. Soloyev & Kobeleva, Reference Soloyev and Kobeleva1960). Since then, the term has become popular in the literature on natural fluid-pressure induced fractures. In the literature related to oil and gas exploration and production, the term ‘hydraulic fracture’ remains mostly used. ‘Fracking’ is as an alternative term for ‘hydraulic fracturing’ that has already been in use for at least 60 years (e.g. Rogatz, Reference Rogatz1961) but more recently gained negative connotations.
In this paper we provide a review of natural fluid-induced fractures. We first provide definitions of relevant terms in Section 2. In Section 3 we discuss the theory on hydrofracture formation and subsequent propagation. As hydrofractures are fractures formed by elevated fluid pressure (strict definition discussed below), recognizing such fractures is important to potentially infer elevated palaeofluid pressures. In Section 4 we therefore address the question of how to recognize a fossil hydrofracture in the geological record. We consider two aspects: first the geological conditions in which fractures can only form when the fluid pressure is elevated and, second, which types of fractures and mineral veins indicate hydrofracturing by their geometry, internal structures or network properties. As the formation of hydrofractures can dramatically change the local effective permeability, we finally address fluid flow associated with hydrofracturing in Section 5.
2. Definitions
In this paper we use the term ‘hydrofracture’, but the reader should bear in mind that, as far as the rock is concerned, it is the same as ‘hydraulic fracture’ as a rock ‘does not know’ whether the fluid pressure it experiences is natural or human-induced. A ‘fracture’ is a discrete planar discontinuity in a solid, such as a rock, along which cohesion or continuity across that surface is lost. The process of losing cohesion, i.e. breaking, is called ‘failure’. Please note that here we exclude so-called ductile fractures, which are interpreted to form by the collapse, linkage and coalescence of microvoids and microcracks during creep deformation, i.e. in a rock that dominantly deforms by ductile flow (e.g. Regenauer-Lieb, Reference Regenauer-Lieb1999; Gomez-Rivas & Griera, Reference Gomez-Rivas and Griera2012). Failure ensues when the stress state in the material reaches conditions that the material cannot sustain. Stress components in a porous rock are (i) the mean stress acting on the solid, which is by definition the pressure the solid experiences (P solid; see Table 1 for a list of symbols), (ii) the deviatoric stress tensor, which is the stress tensor minus the solid pressure, and finally (iii) the pressure of the material inside the pores. Here we denote this material in pores with ‘fluid’, which can be air, gas, oil, liquid, such as an aqueous fluid, or magma. It is assumed that the viscosity of the fluid is so low compared to that of the solid that the differential stress (difference between maximum and minimum stress) in the fluid can usually be considered effectively zero. For a given porosity ϕ, the stress state of the rock S ij (rock) can thus be described as the weighted average of the stress state of the solid S ij (solid) and of the pore fluid, represented by the fluid pressure P f:
 $${S_{ij}}(rock) = \phi {P_f}{\delta _{ij}} + (1 - \phi ){S_{ij}}(solid),$$
List of symbols

with δ ij the Kronecker delta. The stresses and pressures are averaged over the volume of rock under consideration. Stresses inside the solid may vary especially strongly, for example at grain contacts or at the tips of microfractures. However, pressure in the fluid may also vary, especially when pores are not all connected well.
The ‘hydrostatic fluid pressure’ (P hydro) is the fluid pressure in a fluid that is at rest and in contact with the Earth’s surface. P hydro is the pressure caused by the weight of the water column. For a fluid with a mean density (angled brackets denote an average) <ρ f>, P hydro at depth z is <ρ f>gz, with g the gravitational acceleration. In the same way, we can define the lithostatic pressure (P lith), which is simply the pressure caused by the weight of the rock column with mean density <ρ rock>. For depth z we get P lith = <ρ rock>gz. Fluid pressure can be above hydrostatic and is then often referred to as ‘overpressure’ (e.g. Osborne & Swarbrick, Reference Osborne and Swarbrick1997). This may relate to the state of the absolute fluid pressure, for example when Sibson (Reference Sibson2003) writes ‘overpressures may approach lithostatic values’. In this paper, we, however, prefer to define fluid overpressure (ΔP f) as the difference between the actual fluid pressure and the hydrostatic fluid pressure: ΔP f = P f − P hydro. It should be noted that Gudmundsson (Reference Gudmundsson2011) and Phillip (Reference Phillip2012) define overpressure as the total fluid pressure minus the normal stress on the fracture plane, which in the literature on fracture propagation is often called the ‘driving stress’, ‘driving pressure’ or the ‘net pressure’ (Spence & Turcotte, Reference Spence and Turcotte1985; Rubin, Reference Rubin1995; Olson et al. Reference Olson, Laubach and Lander2009). While fluid overpressure is a scalar with an absolute value, it may sometimes be advantageous to use the fluid pressure relative to another reference pressure. Hubbert & Rubey (Reference Hubbert and Rubey1959) introduced the ‘pore fluid factor’ (λ), which is the ratio of the pore fluid and the total vertical stress (also see Cox, Reference Cox2010).
The fact that a reservoir can be stimulated by increasing the fluid pressure shows that the fluid pressure plays a role in fracture formation. Failure is thus not only a function of the absolute stresses, but effective stresses, which are the absolute stresses in relation to the fluid pressure. The simplest definition for ‘effective stress’ is the absolute stress minus the fluid pressure (Terzaghi, Reference Terzaghi1923). This definition is widely used in geology and we also use it in this paper, although will discuss below alternative definitions as well.
The term hydrofracture is commonly used as denoting fractures whose formation is induced by an elevated fluid pressure, as opposed to those formed by elevated differential stresses, typically because of tectonic stresses, but also due to, for example, meteorite impacts or igneous activity. For simplicity we group the latter fractures under the term ‘tectonic fractures’. While it may be clear that fractures are hydrofractures when they occur due to an artificial increase of the fluid pressure, it is not as simple to ascertain whether a natural fracture is due to an elevated fluid pressure (a hydrofracture), to elevated tectonic stresses (a tectonic fracture), or a combination of both, as is probably usually the case. For natural fractures we therefore here propose to refine the term ‘hydrofracture’ to mean those fractures that are primarily caused by an elevated fluid pressure. This definition does not exclude a contribution of tectonic stresses. What remains is to define ‘primarily’ as this now defines whether a fracture is a hydrofracture or not. We will address this issue further below.
By definition, cohesion is lost across a fracture surface. Over time, cohesion is usually recovered by healing, often by mineral precipitation in the space created in the fracture, i.e. the formation of a ‘vein’ (Bons et al. Reference Bons, Elburg and Gomez-Rivas2012; Laubach et al. Reference Laubach, Lander, Criscenti, Anovitz, Urai, Pollyea, Hooker, Narr, Evans, Kerisit, Olson, Dewers, Fisher, Bodnar, Evans, Dove, Bonnell, Marder and Pyrak-Nolte2019). However, space for mineral veins can also be created without fracturing, for example by dissolution. We therefore use the general definition by Bons et al. (Reference Bons, Elburg and Gomez-Rivas2012) of veins as ‘mineral aggregates that precipitated from a fluid in dilational space, i.e., in space that was created in the rock’. This can be due to tensional failure, but is not restricted to this process. If the space is filled with a frozen magma, it is called a dyke, inclined igneous sheet, or sill. While it is common for the space for veins to be created by a fracture, it is important to note that a vein is not necessarily a former fracture. In particular the controversial equation of fibrous or ‘beef’ veins with fractures will be discussed in this paper, as it has been used to argue for their origin as hydrofractures. Other examples of veins not forming by precipitation of minerals within fracture porosity are replacement veins (e.g. Fletcher & Merino, Reference Fletcher and Merino2001; Pirajno, Reference Pirajno2009).
3. Formation of hydrofractures
We divide the theory on hydrofractures in rocks into two topics: (1) the formation or nucleation of a new hydrofracture and (2) the propagation of an existing hydrofracture (Pollard & Aydin, Reference Pollard and Aydin1988; Gudmundsson, Reference Gudmundsson2011; Guerriero & Mazzoli, Reference Guerriero and Mazzoli2021). The difference is that for the first one we can usually assume a homogeneous stress and fluid-pressure state before the fracture forms. Once the fracture is formed, a complex stress field develops, particularly at the fracture tips (Engelder, Reference Engelder1999). Although the two processes are often treated separately, it is clear they are intimately linked as propagation can commence as soon as failure produces the first embryonic fracture. Nevertheless, here we follow the classical division and first deal with the initial formation of hydrofractures. We restrict ourselves to the basic Mohr–Coulomb–Griffith theory that does not take into account the interaction of chemical dissolution and precipitation reactions that intimately interact with a developing fracture or set of fractures, subcritical crack growth and ductile fractures, for which the reader is referred to Atkinson (Reference Atkinson1984), Weinberg & Regenauer-Lieb (Reference Weinberg and Regenauer-Lieb2010) and the extensive review by Laubach et al. (Reference Laubach, Lander, Criscenti, Anovitz, Urai, Pollyea, Hooker, Narr, Evans, Kerisit, Olson, Dewers, Fisher, Bodnar, Evans, Dove, Bonnell, Marder and Pyrak-Nolte2019).
3.a. Fluid pressure and initial fracture formation
An intact solid, such as a rock, will break or fail when the stress state reaches the failure criterion. The stress state can be described by the stress tensor (S ij ), or alternatively by the three principal stresses (S 1, S 2 and S 3) in descending order of magnitude (with compressive stress taken positive here), and their orientations in space. Stresses can vary widely on the small scale (Pollard & Aydin, Reference Pollard and Aydin1988). It is generally assumed that, at some scale above that of the homogeneous equivalent medium (HEM), the stress state can be described by a single stress tensor. The HEM scale is the scale well above smaller-scale heterogeneities, such as grains and pores in a sandstone, or stratigraphic layers in a basin. Whether failure occurs and, if it does, the orientation of the resulting fracture is entirely dependent on the stress state, the rock mechanical properties that are potentially anisotropic, and, if a pore fluid is present, the fluid pressure (P f).
3.a.1. Mohr–Coulomb–Griffith theory for failure
Failure of rocks is conveniently analysed with the Mohr diagram for stress (Mohr, Reference Mohr1882) in combination with the Mohr–Coulomb–Griffith failure envelope (Terzaghi, Reference Terzaghi1943; Hubbert, Reference Hubbert1951; Secor, Reference Secor1965). An intact rock volume can be envisaged to contain an infinite number of potential fracture planes in terms of location and orientation, but the Mohr–Coulomb–Griffith failure theory is only concerned with the orientation of the plane or planes (with respect to that of the principal stresses) that will fail to form a fracture. In this theory, only the maximum and minimum principal stresses (S 1 and S 3) play a role and fractures form in a plane parallel to S 2. The two-dimensional construction is thus for the plane that contains S 1 and S 3, and only considers potential fracture planes in the rock that are parallel to S 2. The shear stress (τ) and normal stress (S n) of a plane (parallel to S 2) that makes an angle α with the smallest principal stress (σ 3) are given by (Mohr, Reference Mohr1882; Hubbert, Reference Hubbert1951; Fig. 1a):
 $$\tau (\alpha ) = ({S_1} - {S_3}) \cdot \cos (\alpha )\sin (\alpha ) = {1 \over 2}({S_1} - {S_3}) \cdot \sin (2\alpha )$$
and
 \begin{align}{S_{\rm{n}}}(\alpha ) &= {S_1} \cdot {\cos ^2}(\alpha ) + {S_3} \cdot {\sin ^2}(\alpha )\\
&= {1 \over 2}({S_1} - {S_3}) + {1 \over 2}({S_1} - {S_3})\cos (2\alpha )\end{align}
\begin{align}{S_{\rm{n}}}(\alpha ) &= {S_1} \cdot {\cos ^2}(\alpha ) + {S_3} \cdot {\sin ^2}(\alpha )\\
&= {1 \over 2}({S_1} - {S_3}) + {1 \over 2}({S_1} - {S_3})\cos (2\alpha )\end{align}
Construction of the Mohr circle for stress. (a) Definition of the angle α between the minimum principal stress (S3) and a plane parallel to the intermediate principal stress (S2). (b) The Mohr circle for stress in a graph of τ versus S n. The stress state for a plane with orientation α can be found by measuring an angle 2α from the S1 point on the circle. (c) Mohr diagram with failure envelope, illustrating the two end-member failure types: shear failure and tensional failure. The orange circle is the circle that touches the failure envelope for both tensional and shear failure. Whether this can occur in a rock depends on the shape of the envelope at negative and low normal stress.

Equations (2) and (3) describe a circle in a plot of τ(α) against S n(α): the Mohr circle for stress (Fig. 1b). Each point on the circle represents the stress state for a plane with orientation α.
Within the τ–S n space of the Mohr diagram there are τ–S n conditions that a rock can sustain and those it cannot. This of course depends on the rock properties. The boundary between these two conditions is a line in the Mohr diagram: the failure envelope. A rock will fail as soon as a plane within the rock reaches a τ–S n combination on the failure envelope. This means that the Mohr circle just touches the failure envelope and, therefore, that the slope of the failure envelope is parallel to the tangent of the circle at the point of contact. As a result, the slope of the failure envelope determines the orientation α of the plane of failure (Fig 1c).
The failure envelope is typically defined by two basic equations. Tensional failure occurs when the minimum stress (S 3) reaches the tensional strength (T). It is common in the literature to report the absolute (positive) value of the tensional strength, although the normal stress on the plane of failure is negative in case of tensional or mode-I failure. To avoid confusion regarding the sign, we here use the real, negative value of T for the tensional strength. The shear-failure criterion is defined by:
 $$\tau = c + \mu \cdot {S_n},{\rm{or}}\,\tau = c + \tan (\psi ) \cdot {S_{\rm{n}}}.$$
Here c is the cohesion, which is the shear stress acting on a fracture plane that experienced zero normal stress when it failed. A planar surface in a rock can typically sustain more shear stress as the normal stress on that surface increases. This is captured by the coefficient of friction (μ) or the slope of the failure envelope, defined by the angle of internal friction (ψ), typically in the order of 30–45°. It follows that μ = tan(ψ).
Figure 1c shows the two basic types of failure: the first is shear failure resulting in a shear or mode-II fracture. It occurs when the Mohr circle touches the failure envelope for a plane that experiences a normal stress S n ≥ 0. Because of the symmetry of the stress state, the Mohr circle will reach the failure envelope twice in an isotropic rock. A conjugate set of fractures forms with opposite sense of shear. The resulting fractures, parallel to S 2, make an angle of α = ±(90° + ψ)/2 with S 3. As ψ is usually positive, S 1 is in the bisector of the acute angle 90° − ψ between the two fracture orientations (Anderson, Reference Anderson1905). A practical advantage of Anderson’s theory of faulting (Anderson, Reference Anderson1905, Reference Anderson1951) is that this simple geometrical relationship between the stress field and shear fracture orientations allows revealing both the stress-field orientation and the angle of internal friction by measuring fracture orientations in the field. Gomez-Rivas et al. (Reference Gomez-Rivas, Bons, Koehn, Urai, Arndt, Virgo, Laurich, Zeeb, Stark and Blum2014), for example, used this to track the evolution of the orientation of the stress field in the Jabal Akhdar Dome (Oman) from fault and vein orientations, first as a result of the emplacement and exhumation of the Semail Ophiolite and Hawasina nappes, and subsequently by the movement of the Indian plate relative to the Arabic plate. The second basic type is tensional failure, which occurs when the leftmost point on the Mohr circle is the first to reach the failure envelope. This means that failure occurs parallel to the plane normal to S 3. Because this requires a negative normal stress, the resulting fracture is under tension and its two fracture surfaces can diverge: an open extensional or mode-I fracture forms (Fig. 1c).
Hybrid fractures form in the transition between the end members of extensional and shear fractures. Here the angle of internal friction decreases from 90° down to ψ for S n > 0. One theoretical model for the failure criterion for hybrid failure was provided by Griffith (Reference Griffith1924) for S n ≤ 0:
 $${\tau ^2} = {{{c^2}} \over {{\tau ^2}}}T\left( {T - {S_{\rm{n}}}} \right),\,{\rm{giving}}\,{\mu _{{\rm{hybrid}}}} = {{{\rm{d}}\tau } \over {{\rm{d}}{S_{\rm{n}}}}} = {c \over {2\sqrt {{\tau ^2} - {S_{\rm{n}}}\tau } }}$$
Note that the tensional strength (T) is negative here. The ratio of cohesion and tensional strength is not predefined in our Eq. (5). However, the ratio according to Griffith’s theory c/T is −2, therefore c 2/T 2 = 4 (Sibson, Reference Sibson2000 a; Pollard and Fletcher, Reference Pollard and Fletcher2005; Jaeger et al. Reference Jaeger, Cook and Zimmerman2007; Gudmundsson Reference Gudmundsson2011). Equation (5) implies that the hybrid angle of internal friction depends on the ratio of c and T. A problem is that this may lead to a discontinuity in ψ as S n increases from negative to positive. With c/T = −2, the angle of internal friction is 45° at σ n = 0 (Eq. 5), although angles of internal friction may vary widely for σ n ≥ 0 (Gudmundsson, Reference Gudmundsson2011). Issues with the transition from hybrid failure to pure shear failure have been discussed by various authors (some examples are Secor, Reference Secor1965; Phillips, Reference Phillips1972; Engelder, Reference Engelder1999; Ramsey & Chester, Reference Ramsey and Chester2004; Zhu, Reference Zhu2017), but details of hybrid failure are not the main focus of this paper.
Although the Mohr–Coulomb–Griffith criterion has proven to be a very useful, or at least often employed, tool for the prediction of the onset of failure, as well as the type and orientation of resulting fractures, it cannot predict where a fracture would form, as the actual location where a fracture nucleates is controlled by the presence of flaws that perturb the local stress field (Pollard & Aydin, Reference Pollard and Aydin1988). The Mohr–Coulomb–Griffith criterion does, however, include the presence of such flaws, as these affect the tensional strength, cohesion and angle of internal friction.
3.a.2. The effect of fluid pressure
So far, we have not considered how a pore fluid affects the stress state at which a rock fails. We have seen that with increasing confining pressure the Mohr circle required to reach failure shifts to the right and increases in size, and hence the required differential stress (S 1 − S 3) increases. This is because the confining pressure presses grains together, making it more difficult for them to separate and slide past each other. The basic failure envelope is thus essentially for a dry rock. The presence of a pore fluid with a pressure P f modifies the stresses at grain contacts and will thus affect the point of failure. Rather than to account for this by adapting the failure envelope, the failure envelopes are kept as they are, and the concept of ‘effective stress’ is used. The effective stresses are calculated from the actual stresses and the fluid pressure in such a way that the rock with a pressurized pore fluid can be compared with the equivalent dry rock.
The simplest, and in geology most commonly used, way to determine the effective stresses (σ ij ) is by subtracting the fluid pressure from the actual stresses (S ij ), following the Terzaghi principle (Terzaghi, Reference Terzaghi1923):
 $${\sigma _{ij}} = {S_{ij}} - {\delta _{ij}}{P_{\rm{f}}}$$
In the Mohr diagram this has the effect of shifting the Mohr circle to the left by the amount of P f (Fig. 2a). When one keeps increasing the fluid pressure the rock will fail at some stage. The rationale is that the pore fluid carries part of the load applied to a rock and thus effectively reduces the stresses within the solid matrix. It should be noted that with the Terzaghi principle the size of the Mohr circle, and thus the differential stress, does not change as a function of P f.
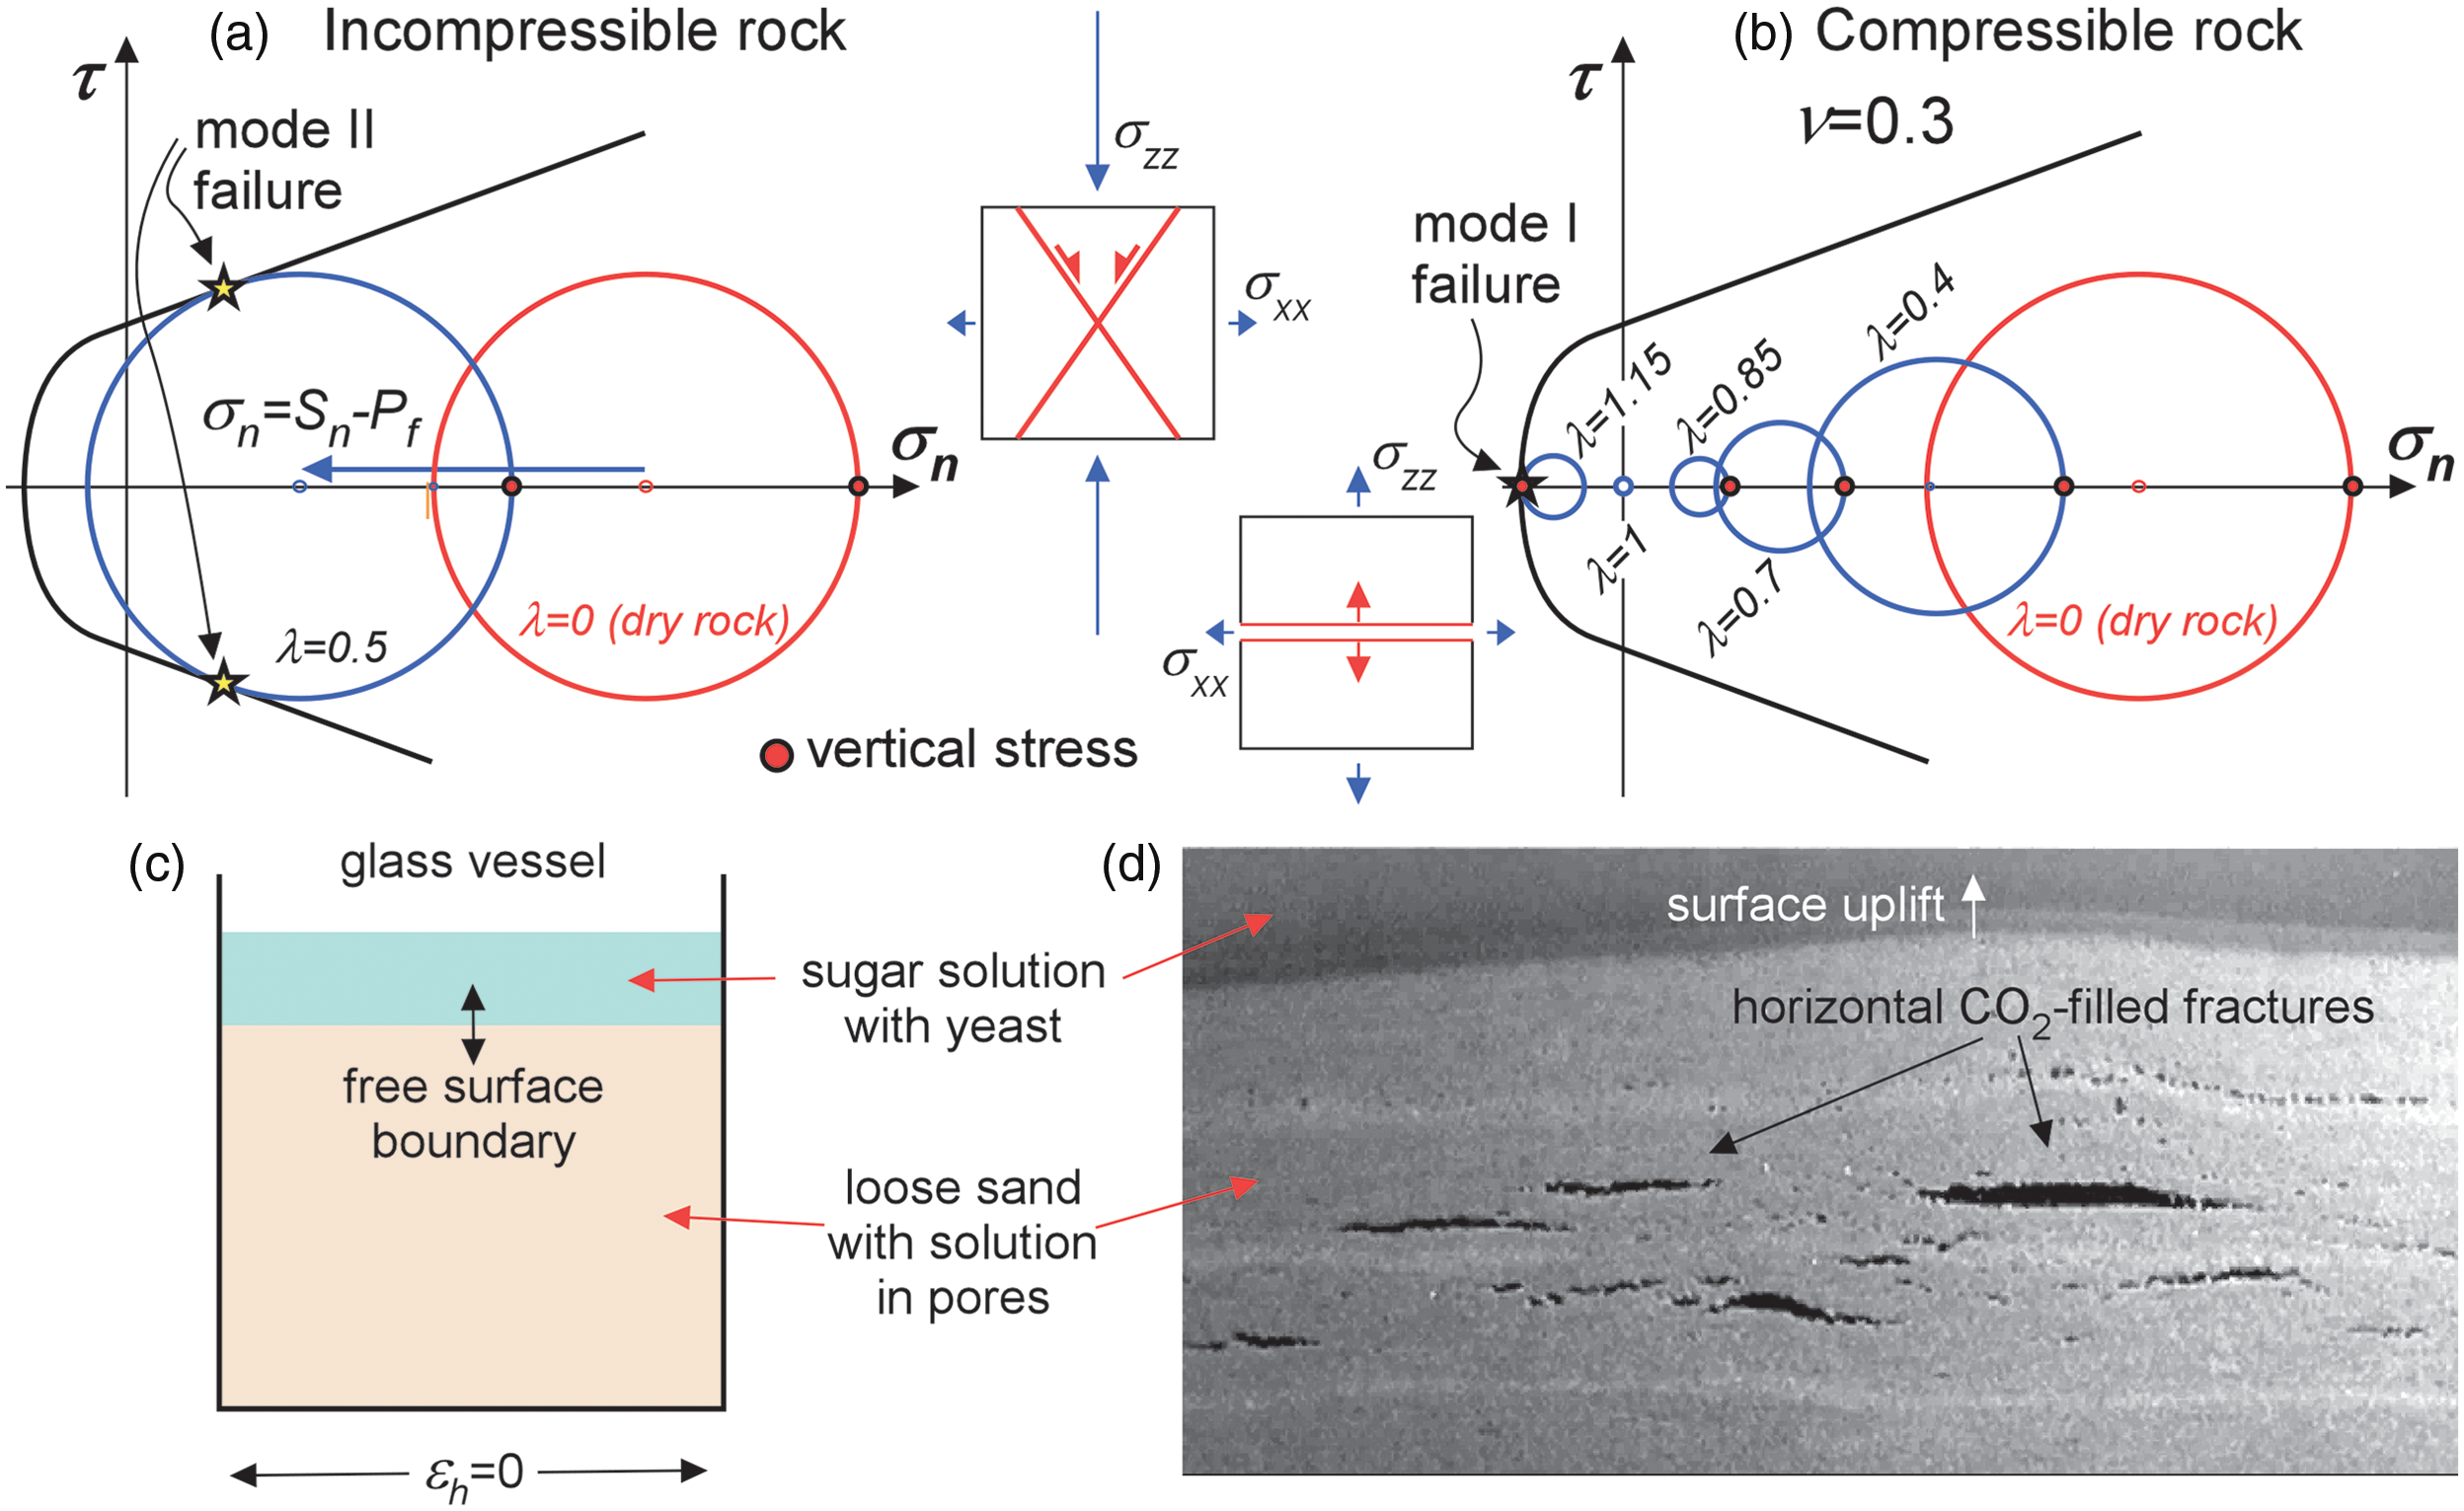
(a) Terzaghi scenario for an incompressible material with the Mohr circle for the effective stress state moving by an amount of P f towards the left-hand side without a change in differential stress. In the example with a vertical maximum stress (red dot), increasing the fluid pressure would eventually lead to shear failure. (b) Effect of compressibility in a situation where the vertical total stress is a function of the overburden load, and the horizontal stress is constrained by an imposed zero horizontal strain. Increasing the fluid pressure not only shifts the Mohr circle to the left, but also changes its size. Once fluid pressure exceeds the total vertical stress (λ > 1) the effective vertical stress (red dot) becomes the smallest stress and horizontal fractures form in case of failure. (c) Simple experiment illustrating the formation of horizontal extensional or mode-I fractures of Bons & van Milligen (Reference Bons and van Milligen2001). A glass vessel is filled with sand and water with dissolved sugar and yeast. Pressure of the fermentation product CO2 increases until horizontal fractures form, as shown in (d).
However, the Terzaghi principle is in some cases an oversimplification of the system and may lead to wrong interpretations, as discussed by many authors (e.g. Cleary & Wong, Reference Cleary and Wong1985; Meyer, Reference Meyer1986; Gordeyev & Zazovsky, Reference Gordeyev and Zazovsky1992; Tzschichholz et al. Reference Tzschichholz, Herrmann, Roman and Pfuff1994; Hillis, Reference Hillis2003; Cobbold & Rodrigues, Reference Cobbold and Rodrigues2007; Ghani et al. Reference Ghani, Koehn, Toussaint and Passchier2013; Koehn et al. Reference Koehn, Piazolo, Sachau and Toussaint2020). The reason is that the Terzaghi principle essentially ignores that rocks are poroelastic, which means that both the pores and solid matrix, and therefore the bulk rock, change their volume if their pressures are changed. The basic theory for poroelasticity was developed for soils by Biot (Reference Biot1941, Reference Biot1956) and elaborated on, or modified, by various others (see review by Guerriero & Mazzoli (Reference Guerriero and Mazzoli2021), and references therein). Proposed equations for effective stress that take into account poroelasticity are mostly of the form:
 $${\sigma _{ij}} = {S_{ij}} - (1 - \alpha ){\delta _{ij}}{P_f}$$
As summarized in de Boer & Ehlers (Reference de Boer and Ehlers1988, Reference de Boer and Ehlers1990) and Guerriero & Mazzoli (Reference Guerriero and Mazzoli2021), a number of models for the parameter a have been proposed, such as a equals the porosity (Fillunger, Reference Fillunger1936), a = K rock/K solid (for volume change with K the bulk modulus (Skempton, Reference Skempton, Bjerrum, Casagrande, Peek and Skempton1960; Nur & Byerlee, Reference Nur and Byerlee1971)), or a = 1 − ν/(1 − ν) (with ν the Poisson’s ratio; Hillis, Reference Hillis2003) that we discuss below.
Terzaghi’s model is a special case with a = 0 of the more general Biot model. This is the case when the solid matrix is rigid and load-bearing. Terzaghi’s model with a = 0 thus applies if the fluid overpressure is building up in a single pore, or in a restricted cell with overpressure in the crust. This is, however, often not even approximately the case, especially in porous sediments that are far from incompressible and therefore have a Poisson’s ratio of ν < 0.5.
Boundary conditions become important when poroelasticity is relevant. If constant stresses on the boundaries are given, an increase in fluid overpressure will lead to a decrease in the principal effective stresses, but with a constant differential stress as was shown in numerical simulations (Koehn et al. Reference Koehn, Piazolo, Sachau and Toussaint2020) and experiments (Cobbold & Rodrigues, Reference Cobbold and Rodrigues2007). This means that the size of the Mohr circle remains unchanged with a change in P f and the Mohr circle shifts to the left or right according to Eq. (6). If, however, elastic strain is the boundary condition for the volume under consideration, things become more complicated as, for example, Hillis (Reference Hillis2003), Cobbold & Rodrigues (Reference Cobbold and Rodrigues2007) and Olson et al. (Reference Olson, Laubach and Lander2009) point out. The reason is that a change in pore pressure requires a change in the applied stresses (S ij ) to maintain the given strain.
Hillis (Reference Hillis2003) provided an example where a simple application of the Therzagi principle does not work. The author examined an overpressure zone below a seal in a sedimentary basin and related the lowest effective stress below the seal to the vertical stress (S v) and fluid pressure. The example considers a basin at rest so that it is neither extending nor shortening. The horizontal elastic strain is therefore zero (ϵ h = 0), while the vertical stress (S v) on the rock is the overburden weight (S z = <ρ>gz). This is a case of mixed strain and stress boundary conditions.
If fluid pressure is zero (dry rock equivalent), the horizontal (S h) and vertical (S v) stresses are related by (using Hooke’s law for linear elasticity and uniaxial strain and stress: S h = S x = S y ):
 $$E{\varepsilon _h} = {S_h} - v{S_h} - v{S_Z} = 0 \Leftrightarrow {S_h} = {v \over {1 - v}}{S_Z}$$
In an incompressible rock (ν = 0.5) this gives S h = S v, that is, zero differential stress. Although this would be correct for an incompressible rock, the resulting zero differential stress cannot simply be applied to a compressible rock. This would mean that the rock would compact equally in all directions and the basin would contract laterally. It is not permissible to use this stress state and simply subtract a non-zero fluid pressure to determine the effective stresses to assess potential failure or compaction. This is because total stresses change with increasing fluid pressure to maintain the boundary conditions. In an Andersonian stress state (Anderson, Reference Anderson1905, Reference Anderson1939) the vertical effective stress, resulting from a vertical stress boundary condition, does follow the straightforward Terzaghi model:
 $${\alpha _z} = {S_z} - {P_{\rm{f}}},\,{\rm{giving}}\,{{{\rm{d}}{\sigma _z}} \over {{\rm{d}}{P_{\rm{f}}}}} = - 1$$
The horizontal effective stress, however, is a function of the zero horizontal strain boundary condition and the vertical fluid-pressure dependent effective stress, giving (Hillis, Reference Hillis2003; Cobbold & Rodrigues, Reference Cobbold and Rodrigues2007):
 $${\sigma _{\rm{h}}} = \left( {{\nu \over {1 - \nu }}} \right){\sigma _z},\,{\rm{giving}}\,{{{\rm{d}}{\sigma _{\rm{h}}}} \over {{\rm{d}}{P_{\rm{f}}}}} = {{ - \nu } \over {1 - \nu }}$$
This means that with increasing P f the vertical effective stress is reduced faster than the horizontal effective stress so that both will become zero when S z = P f (Fig. 2b). Once the principal stresses reach negative values, the horizontal and vertical stress will become negative, where now the vertical stress is more negative and a horizontal fracture will develop upon failure (Cobbold & Rodrigues, Reference Cobbold and Rodrigues2007; Koehn et al. Reference Koehn, Piazolo, Sachau and Toussaint2020). This can be illustrated with a very simple experiment (Bons & van Milligen, Reference Bons and van Milligen2001) of a jar filled with loose sand and a pore fluid that initially consists of water, dissolved sugar and yeast (Fig. 2c). The glass walls of the jar provide zero horizontal strain boundary conditions. The top of the wet sand can move vertically, so here we have a stress boundary, with the total vertical stress increasing downwards according to the material density. Fermentation produces CO2 gas that has a high wetting angle with the sugar solution. Permeability for CO2 flow is therefore very low, as the gas tends to form bubbles in the pores and is inhibited from flow through the pore throats between the sand grains. The CO2 pressure (P f) increases as more and more CO2 is produced, until finally horizontal mode I extensional fractures form (Fig. 2d). Gas generation in organic-rich shales and coals has been reported to induce natural hydrofractures (e.g. Fall et al. Reference Fall, Eichhubl, Bodnar, Laubach and Davis2015).
The above should not be understood as taking sides in the discussion on whether Biot’s or Terzaghi’s theory (and derivations thereof) is right or preferred. Both are applicable depending on the rock properties and especially on the imposed boundary conditions. In the above case the vertical effective stress is S v − P f (Eq. 8), which is according to Terzaghi’s theory, but also Biot’s theory with a = 0 (Eq. 7). Terzaghi’s theory is also applied to calculate the effective horizontal stress as applied to Hooke’s linear elasticity law (Eq. 8). The difference with the straightforward application of Terzaghi’s principle is that, unlike the vertical stress, the total horizontal stress in this case is a function of the fluid pressure itself.
We have now seen that horizontal extensional fractures are expected to form in a basin at rest in which the fluid pressure is increased due to an influx of fluids from below (e.g. due to expulsion of compacting sediments, dehydration reactions, release of hydrocarbons). Typical fluid pressure profiles as a function of depth are shown in Figure 3. The presence of a low-permeability seal can locally bring the fluid pressure up to the failure condition (Fig. 3b) or in an overpressured layer, as modelled by Ghani et al. (Reference Ghani, Koehn, Toussaint and Passchier2013, Reference Ghani, Koehn, Toussaint and Passchier2015) and Koehn et al. (Reference Koehn, Piazolo, Sachau and Toussaint2020) (Fig. 4a,b). A tacit assumption so far was that there are no lateral gradients in fluid pressure. If these gradients exist, for example in laterally constrained high-pressure cells, the zero horizontal strain condition does not apply anymore and the simulations in Figure 4c–e show that an increase in fluid pressure leads to fractures in different orientations, and potentially shear fractures as well.
Depth profiles for a fluid influx of 5 × 10⁻¹¹ m s−1 from below and a permeability that decreases with depth according to Ingebritsen & Manning (Reference Ingebritsen and Manning1999), (a) without and (b) with a low-permeability seal. From left to right, we show absolute pressures, the fluid overpressure, the pore-fluid factor (λ) and finally the effective stresses for a basin at rest and a Poisson’s ratio of 0.4.

Variations of the geometry of a high fluid pressure zone in simulations leading to a variety of fracture patterns from horizontal to vertical as well as combinations. (a–e) upper pictures show fluid pressure in the model with red high and blue low pressure. (a–e) lower pictures show the developing opening fracture patterns for the specific cases in the models in white. (a) and (b) are cases where the boundaries are fixed, and fluid pressure builds up in a sedimentary basin or a horizontal layer and the resulting fracture is horizontal. (c–e) show a variation of localized high fluid pressure cells where fracturing can happen in a vertical and horizontal orientation. (f) shows the developing fractures as a function of fluid pressure for two end-member cases representing (a) a sedimentary basin with fixed boundaries in blue, and (c) a fluid pressure cell that represents a horizontal stress boundary in red. The corresponding solid stresses as a function of the fluid pressure are shown in (g) for both cases. Note that fractures develop early in case (c) and the evolving stress field follows Terzaghi’s law (blue curves). In case (a), represented by the red curves, differential and mean stress decay and fracturing happens at a much higher fluid pressure.

3.b. Beyond the initial fracture development
3.b.1. Fracture propagation and stress intensity factor
We now look at the propagation of simple cracks using linear elastic fracture mechanics and the idea that crack propagation costs energy because new surface area is created (Griffith, Reference Griffith1920). In order to conserve energy, the work per unit time of an applied load is equal to the rates of change in elastic $\left( {{{\dot U}_E}} \right)$
, plastic
$\left( {{{\dot U}_E}} \right)$
, plastic $\left( {{{\dot U}_{\rm{P}}}} \right)$
and kinetic energy (
$\left( {{{\dot U}_{\rm{P}}}} \right)$
and kinetic energy ( ${\dot U_{\rm{k}}}$
), as well as the energy per unit time spent to increase the crack area
${\dot U_{\rm{k}}}$
), as well as the energy per unit time spent to increase the crack area $\left( {{\rm{\dot \Gamma }}} \right)$
(Griffith, Reference Griffith1920; Richard & Sander, Reference Richard and Sander2016):
$\left( {{\rm{\dot \Gamma }}} \right)$
(Griffith, Reference Griffith1920; Richard & Sander, Reference Richard and Sander2016):
 $$\dot W = {\dot U_{\rm{E}}} + {\dot U_{\rm{P}}} + {\dot U_{\rm{k}}} + {\rm{\dot \Gamma }}$$
If we assume that the crack propagation is slow, then the kinetic energy can be neglected. With this the rate of change of potential energy of the system as a function of crack surface area change, i.e. crack growth, can be calculated.
For a simple extensional crack in an extensional system that is purely elastic this formulation leads to the Griffith criterion for extensional cracks where G, the crack extension force, is proportional to changes in elastic and surface area according to (Griffith, Reference Griffith1920; Richard & Sander Reference Richard and Sander2016):
 $$G = {{\partial {U_{\rm{E}}}} \over {\partial A}}$$
Using the stress solutions by Inglis (Reference Inglis1913), Griffith (Reference Griffith1920) derived a strength criterion that can be used to estimate at what stress (T) a material will fail:
 $$T = \sqrt {{E{\gamma r} \over {4lL}}} {\rm{\;}}$$
with E the elastic modulus, $\gamma $
the surface-free energy, r the radius of curvature of the crack tip, l the bond length of the material and L the crack length. It is worth noting that the original Griffith formulation was derived for a crack with internal stress on the walls, which is the same as an external extensional load on an infinite plate. Therefore, the simplest hydrofracture is an extensional fracture, where the internal fluid pressure is equivalent to an external negative stress on the medium. Of course, once the fracture propagates and opens, changes in the fluid pressure as well as geometrical changes of the crack have to be taken into account.
$\gamma $
the surface-free energy, r the radius of curvature of the crack tip, l the bond length of the material and L the crack length. It is worth noting that the original Griffith formulation was derived for a crack with internal stress on the walls, which is the same as an external extensional load on an infinite plate. Therefore, the simplest hydrofracture is an extensional fracture, where the internal fluid pressure is equivalent to an external negative stress on the medium. Of course, once the fracture propagates and opens, changes in the fluid pressure as well as geometrical changes of the crack have to be taken into account.
For certain scenarios the stress, strain and displacement fields for a crack propagation in an elastic medium can be solved analytically (Westergaard, Reference Westergaard1939). This leads to the following expressions for the state of stress
 $${\sigma _{ij}} = {{{K_i}} \over {\sqrt {2\pi r} }}{f_{ij}}\left( \theta \right)$$
and displacement
 $${u_{ij}} = {{{K_i}} \over {2\mu }}\sqrt {{r \over {2\pi }}} g\left( \theta \right)$$
with K the stress-intensity factors that contain loading as well as geometrical conditions, r the distance to the crack tip, and ${f_{ij}}\left( \theta \right)$
and
${f_{ij}}\left( \theta \right)$
and $g\left( \theta \right)\;$
functions of the angle
$g\left( \theta \right)\;$
functions of the angle $\theta $
relative to the long axis of the crack (Sih, Reference Sih1973; Rooke & Cartwright, Reference Rooke and Cartwright1976). Theoretically these formulations only work away from the actual crack tip, while at the tip (at r = 0) stresses form a singularity-dominated zone. The stress intensity factor varies for crack types such as extension versus shear as well as boundary conditions and crack geometries. For a simple hydrofracture in terms of the Griffith extensional crack we have:
$\theta $
relative to the long axis of the crack (Sih, Reference Sih1973; Rooke & Cartwright, Reference Rooke and Cartwright1976). Theoretically these formulations only work away from the actual crack tip, while at the tip (at r = 0) stresses form a singularity-dominated zone. The stress intensity factor varies for crack types such as extension versus shear as well as boundary conditions and crack geometries. For a simple hydrofracture in terms of the Griffith extensional crack we have:
 $${K_{\rm{i}}} = \sigma \sqrt{\pi L}$$
A geometrical factor needs to be added for more complex configurations. For constant geometries several known stress intensity factors can be added (Sih, Reference Sih1973; Rooke & Cartwright, Reference Rooke and Cartwright1976), which essentially leads to the Terzaghi criterion where stresses due to an internal fluid pressure cancel out stresses from an external loading, which leads to the idea of an ‘effective stress’. The superposition of stress intensity factors for variable stress fields known from literature offers advanced approaches extending the Mohr–Coulomb approaches, discussed above, to study hydrofractures that develop under variable boundary conditions in the Earth’s crust.
For more complicated fracture propagation problems, stress intensity factors can be determined in continuum simulations to calculate the most probable path of propagation and then re-mesh the model. Another possibility is the use of discrete element models where bonds with a critical breaking threshold break as will be discussed in the following.
3.b.2. Growth of individual fractures and fracture and vein networks
Hydrofractures in general are introduced into the system because there is an overpressure as a result of the difference between the surrounding fluid pressure and a zone where fluid pressure is elevated. The overpressure (ΔP) is a function of the local increase in pressure as a function of time and the advection of the overpressured fluid away from the zone of influx or fluid production. How much the fluid leaks into the system depends on the permeability of the host rock. If the fluid addition is faster than the leaking or if the rock is very impermeable the overpressure builds up until failure occurs. The creation of hydrofractures will now generate a higher permeability. The hydrofractures will grow until they have created enough permeability for the overpressure to dissipate into the rock at a given fluid addition rate. This is shown in a simulation in Figure 5 where the fluid overpressure at one point increases until a fracture network develops that drains the incoming fluid (for the numerical method see the Supplementary Material available online at https://doi.org/10.1017/S0016756822001042). The rock dynamically creates the permeability it needs to be able to drain the injected fluid.
(a) Injection of fluid and associated fracturing in a simulation (Ghani et al. Reference Ghani, Koehn, Toussaint and Passchier2013; Koehn et al. Reference Koehn, Piazolo, Sachau and Toussaint2020). The two dotted curves show the fluid pressure evolution over time, one directly at the centre and one for the whole model. The developing fractures are shown in pink, the inset on the left-hand side shows the fracture pattern in blue and the inset on the right-hand side the fluid pressure (red high, blue low). (b–d) Simulations of the development of a fracture network below a seal at the top of the model as a function of an increase in fluid overpressure. The number of fractures, shown in blue, increases with model time and fluid pressure. Vertical stress is highest due to gravity, and horizontal stress is a function of the vertical stress. Box walls at the bottom and the right- and left-hand side are fixed.

A similar situation to that of the injected fluid case can be envisioned in a scenario at geological timescales. When the system is too permeable the fluid overpressure will never build up to be high enough to cause rock failure. However, if a seal exists or the rock itself is impermeable (Fig. 3b), an increase in fluid overpressure may lead to fracturing. This increase can happen, for example, during exhumation, thermal expansion of fluids, a de-watering reaction, oil maturation or release of fluids from a subducting slab, among other processes. Once fractures form, they may in turn lead to an increase in permeability and leaking of the overpressure. If the pressure is not released the fracture pattern may evolve dynamically. This is illustrated in Figure 5 where fractures develop below a seal in a simulation. Here the initial fractures follow Terzaghi’s principle and are vertical and parallel to the largest principal stress (in this case vertical because of gravity). However, with increasing fluid pressure the pattern changes and the fluid pressure gradients work upwards and lead to the formation of an increasing number of horizontal fractures. The developing network is similar to a hydraulic breccia and forms because the seal is not broken. The final fracture network does contain fractures that formed in rather different stress fields. In a natural setting one may not be able to separate the different fractures from each other, making it hard to interpret the fracture network.
The system becomes even more complex when the fractures heal and form veins. It is important to note that veins are not equal to fractures, meaning that (a) the geometry of a vein does not necessarily reflect that of the original fracture, (b) not all veins represent fractures (e.g. in the case of replacement veins, veins filling dissolution vugs or fibrous veins; see below), (c) not all veins represent fractures that open at the same time (such as in the case of crack–seal veins; Bons et al. Reference Bons, Elburg and Gomez-Rivas2012; Virgo et al. Reference Virgo, Abe and Urai2014), (d) veins may refracture several times (Ramsay, Reference Ramsay1980) and (e) veins may change the properties of the system. An example is given in Figure 6 in a simulation following the general set-up of Ghani et al. (Reference Ghani, Koehn, Toussaint and Passchier2013). The fractures develop due to fluid overpressure build-up below a seal (in blue colour). In these simulations, the fractures can heal following the algorithm of Vass et al. (Reference Vass, Koehn, Toussaint, Ghani and Piazolo2014) and once they heal the new bonds can have different properties. New veins either fracture more easily (weak in Fig. 6) or are more difficult to fracture (strong in Fig. 6) than the host rock. The properties of the veins change the system completely and influence the development of new fractures. The two pictures on the left-hand side in Figure 6 show the open fractures at a given time step, and the picture on the right-hand side the vein network. One can see that the vein network and the fracture network are very different and that they vary significantly as a function of the failure properties of the veins. The weak veins have a memory and continue to open, leading to a large connected fracture network that breaks the seal. The hard veins produce a system with a large number of veins that do not refracture, while the material hardens and only a small number of open fractures remain. The important message is that we need to be extremely careful to relate vein networks directly to networks of active or open fractures. In the case of Figure 6, a large vein network means very few actually open fractures, because the system clogs itself. The relevance of this issue is illustrated with the discussion on how melt is extracted from partially molten rocks towards dykes that feed plutons and magma chambers. Marchildon & Brown (Reference Marchildon and Brown2003) used outcrops of networks of granitic dykes as evidence for magma transport through hydrofracture networks in support of the ‘rivulets-feeding-rivers’ model. Bons et al. (Reference Bons, Becker, Elburg and Urtson2009), however, argued that these networks are the cumulative product of many individual hydrofracture events, whereby new hydrofractures cut already fully solidified dykes. As such, there never was a fully percolating network of hydrofractures that were all filled with liquid magma, which the authors used as an argument against the ‘rivulets-feeding-rivers’ model.
Healing of fractures and the creation of veins with different breaking strength. Fractures in (a) in green colour and veins in (b) in green (early veins) and white (late veins). Weak veins that fracture more easily than the host rock are shown in the upper pictures, and hard veins that fracture less easily than the host rock in the lower pictures (see also Vass et al. Reference Vass, Koehn, Toussaint, Ghani and Piazolo2014). Fluid pressure injected below a seal as in Figure 4 b–d over the whole width of the model.

3.b.3. Compressible fluids and hydromechanical interactions
Although not always considered, fluid compressibility is an important factor (e.g. Engelder & Lacazette, Reference Engelder, Lacazette, Barton and Stephansson1990). The compressibility of aqueous fluids typically is one order of magnitude lower than that of solids (e.g. Gibiansky & Torquato, Reference Gibiansky and Torquato1998). In order to understand the interaction between fluid and solid after a hydrofracture network developed, one needs to take the compressibility of both media into account. The resulting structures form fracture channels of high porosity and compacted areas that dynamically open and close. This can be observed in numerical models (Fig. 7), as well as in experiments with granular media and injecting fluids or air, which in fact is also a fluid (Flekkøy, Reference Flekkøy2002; Johnsen et al. Reference Johnsen, Toussaint, Måløy and Flekkøy2006, Reference Johnsen, Toussaint, Måløy, Flekkøy and Schmittbuhl2008 a, b; Vinningland et al. Reference Vinningland, Johnsen, Flekkøy, Toussaint and Måløy2007 a, b, Reference Vinningland, Johnsen, Flekkøy, Toussaint and Måløy2010, Reference Vinningland, Toussaint, Niebling, Flekkøy and Måløy2012; Goren et al. Reference Goren, Aharonov, Sparks and Toussaint2010, Reference Goren, Aharonov, Sparks and Toussaint2011; Niebling et al. Reference Niebling, Flekkøy, Måløy and Toussaint2010 a, b; Ghani et al. Reference Ghani, Koehn, Toussaint and Passchier2013, Reference Ghani, Koehn, Toussaint and Passchier2015; Aleksans et al. Reference Aleksans, Koehn, Toussaint and Daniel2020; Koehn et al. Reference Koehn, Piazolo, Sachau and Toussaint2020). In the numerical model the fractures are first created and are then followed by the development of fracture channels that form as connected fractures that can open while the surroundings are compacted and thus closed. This dynamic system can lead to characteristic length scales in the model between sets of opening fracture channels that can be observed in experiments and may also be present in real systems.
Opening fracture channels that develop in a numerical model with a compressible fluid and full hydrodynamic interactions (see also Koehn et al. Reference Koehn, Piazolo, Sachau and Toussaint2020). Colours are porosity with yellow low and red high porosities. Gravity is applied vertically and increase in fluid pressure is concentrated within the centre of the model. Large vertical fracture channels develop that drain the fluid and open and close dynamically.

3.b.4. Wholesale propagation of hydrofractures
Fluids in a fracture usually have a lower density than the surrounding wall rock. In the case of aqueous fluids this difference can be significant. The resulting buoyancy of the fluid can lead to unidirectional, upwards propagation at the upper tip of a fluid-filled fracture. Igneous dykes emanating from a magma chamber have a contiguous source volume that can feed the dyke for a prolonged period of time (Secor & Pollard, Reference Secor and Pollard1975; Clemens & Mawer, Reference Clemens and Mawer1992; Rubin, Reference Rubin1995; Gudmundsson, Reference Gudmundsson2011). However, when the fracture is sourced from a partially molten region or is filled with an aqueous fluid a large single feeder volume is usually absent and influx of fluid into the fracture may not keep up with the increasing fracture volume (Bons et al. Reference Bons, Becker, Elburg and Urtson2009). In that case the fracture would begin to close at its bottom end (Bons et al. Reference Bons, Dougherty-Page and Elburg2001; Rivalta et al. Reference Rivalta, Taisne, Bunger and Katz2015). Weertman (Reference Weertman1971) first proposed that if a fracture that is filled with a buoyant fluid is tall enough, it may keep propagating at its upper end, while closing at its bottom end. As a result, the fracture propagates together with its contained fluid. Such hydrofractures have been called ‘Weertman (–Nunn) fractures’ (Rivalta et al. Reference Rivalta, Taisne, Bunger and Katz2015) or ‘mobile hydrofractures’ (Bons, Reference Bons2001). The basic theory was further developed by e.g. Secor & Pollard (Reference Secor and Pollard1975), Pollard (Reference Pollard1976), Nunn (Reference Nunn1996), Dahm (Reference Dahm2000) and Dahm et al. (Reference Dahm, Hainzl and Fischer2010) and extensively reviewed by Rivalta et al. (Reference Rivalta, Taisne, Bunger and Katz2015). Takada (Reference Takada1990), Dahm (Reference Dahm2000), Bons (Reference Bons2001), Bons et al. (Reference Bons, Dougherty-Page and Elburg2001) and Rivalta et al. (Reference Rivalta, Böttinger and Dahm2005) published analogue experiments of the ascent of mobile hydrofractures.
A non-horizontal fracture experiences a normal pressure gradient as the pressure in the wall rock increases faster with depth than inside the fracture that is filled with a lower-density fluid (Fig. 8). Fluid pressure inside the fracture and elastic strain of the wall rock adapt such that the fluid exceeds the pressure of the wall rock at the upper tip, the amount of which increases with the fracture length L. At a certain length the stress intensity at the upper tip reaches the fracture toughness, K c, at which point the fracture will start to propagate upwards, while it closes at the base. The critical length, L c, is given by Dahm (Reference Dahm2000):
 $${L_c} = 2{\left( {{{{K_c}} \over {\sqrt {{\pi}} g ({\rho _{{rock}}} - {\rho _{f}})}}} \right)^{{2 \over 3}}}$$
(a) Fluid pressure in a vertical open fracture in relation to lithostatic pressure that acts as a normal stress on the fracture, plotted as a function of depth. (b) Giant quartz vein from Poolamacca Station, far-west New South Wales, Australia, attributed by Bons (Reference Bons2001) to fluid transport by mobile hydrofractures. (c) Similar giant quartz vein northeast of the town of Roses, far-eastern Pyrenees, Spain.

The vertical critical length may range from as low as a few metres for a water-filled fracture to kilometres for dykes in the mantle, depending on the density difference between the rock and the fluid, and the poorly constrained fracture toughness, for which estimates range from <1 MPa m1/2 to a few GPa m1/2 (see discussion in Dahm, Reference Dahm2000). Once a fracture becomes unstable and starts propagating, its velocity is controlled by the viscous drag of the contained fluid that has to flow upwards in the narrow fracture, as well as the fracture toughness at the propagating upper tip. Theoretical estimates for the ascent rate of critical-length mobile hydrofractures range from <m/yr a−1 to >m/ s−1 (Spence & Turcotte, Reference Spence and Turcotte1985; Nunn, Reference Nunn1996; Dahm, Reference Dahm2000). Velocities up to m s−1 have also been inferred from lifting by the fluid of clasts and mineral fragments in veins and breccias (Oliver et al. Reference Oliver, Rubenach, Fu, Baker, Blenkinsop, Cleverley, Marshall and Ridd2006 b; Okamoto & Tsuchiya, Reference Okamoto and Tsuchiya2009; Weisheit et al. Reference Weisheit, Bons and Elburg2013 a). The critical length is the length at which instability is reached, and the ascending fracture may get arrested as soon as conditions change. However, channelling along structures, such as faults or pathways of earlier mobile hydrofractures, may lead to the accumulation of multiple fluid batches to create more voluminous and faster mobile hydrofractures that can ascend far up the crust (Maaløe, Reference Maaløe1987; Sleep, Reference Sleep1988; Bons, Reference Bons2001).
A problem with mobile hydrofractures is that, due to their very nature of being mobile, one cannot find these in their mobile state in the fossil record. Indications for active ascent of hydrofractures can be derived from rising microseismicity fronts (Dahm et al. Reference Dahm, Hainzl and Fischer2010) or pulsed discharge rates of oil in mud volcanoes in the Gulf of Mexico (MacDonald et al. Reference MacDonald, Buthman, Sager, Peccini and Guinasso2000). The fossil record can only provide indirect indications of fluid transport by mobile hydrofractures.
Mobile hydrofractures can theoretically transport batches of fluid upward very rapidly. At 0.1 m s−1, a batch of fluid can ascend 10 km in about a day. This means that the fluid may not have time to equilibrate with the rapidly changing ambient conditions, except for adiabatic cooling, and can carry its dissolved mineral content up the crust to where the mobile hydrofracture is finally arrested. According to Bons (Reference Bons2001), this transport mechanism may explain the occurrence of huge quartz veins at Poolamacca station in far west New South Wales, Australia (individual vein volume up to an estimated 5 × 10⁵ m3) (Fig. 8b), and also be found throughout the world, in, for example, the Pyrenees (Fig. 8c; González-Esvertit et al. Reference González-Esvertit, Canals, Bons, Casas and Gomez-Rivas2022), the Sperrin Mountains of northern Ireland (Rice et al. Reference Rice, Mark, Selby, Neilson and Davidheiser-Kroll2016), the Bavarian Pfahl zone of the Bohemian Massif (Schaarschmidt et al. Reference Schaarschmidt, Haase, de Wall, Bestmann, Krumm and Regelous2019), the Monte Rosa area in the Western Alps (Pettke & Diamond, Reference Pettke and Diamond1996), the Bundelkhand craton in the central Indian shield (Pati et al. Reference Pati, Patel, Pruseth, Malviya, Arima, Raju, Pati and Prakash2007) or the Alaskan Cordillera (Goldfarb et al. Reference Goldfarb, Snee and Pickthorn1993). However, other authors have also invoked different mechanisms for the formation of large quartz veins based on structural and geochemical arguments (e.g. Sharp et al. Reference Sharp, Masson and Lucchini2005), and thus the origin and significance of these impressive structures still raises questions.
Although the theory of mobile hydrofractures was originally based on water-filled crevasses in glaciers (Weertman, Reference Weertman1971), it is mostly applied to magma transport in dykes, where it remains controversial. In particular Lister & Kerr (Reference Lister, Kerr, Parker, Rickwood and Tucker1990, Reference Lister and Kerr1991) and Petford et al. (Reference Petford, Kerr and Lister1993) objected that it is (i) theoretically impossible to completely close a fracture at the rear end if the contained fluid has a non-zero viscosity and that the fracture would thus lose fluid, and (ii) that a fracture that is just at its critical length L c would still be so narrow that it would freeze quickly as it ascends into cooler crustal levels. The first point was addressed by Bons et al. (Reference Bons, Dougherty-Page and Elburg2001), who emphasized that initial critical-length mobile hydrofractures may get stalled and then merge with subsequently arriving hydrofractures, to form mobile hydrofractures that are well beyond the critical length L c . The second point only applies to igneous fluids that can freeze. However, tall igneous dykes do exist, which is consistent with the fact that such dykes may tap large magma reservoirs that allow continuous feeding of a dyke and avoid pinching off to form isolated ascending magma batches. This is also related to the viscosity of the fluid, which is generally much higher for magmas than for aqueous or hydrocarbon fluids, as is comprehensively discussed in Rivalta et al. (Reference Rivalta, Taisne, Bunger and Katz2015).
3.b.5. Dynamics of crustal-scale flow in hydrofractures
Hydraulic breccias (Jébrak, Reference Jébrak1997; Weisheit et al. Reference Weisheit, Bons and Elburg2013 a) and crack–seal veins (Ramsay, Reference Ramsay1980) indicate stress states that frequently reach the failure criterion, and in some cases fast and localized fluid flow. In fact, many authors identified episodic pulses of rapid fluid flow (Sibson et al. Reference Sibson, Moore and Rankin1975, Reference Sibson, Robert and Poulsen1988; Hunt, Reference Hunt1990; Nakashima, Reference Nakashima1993; Cartwright, Reference Cartwright1994; Cox, Reference Cox1995; Eichhubl, Reference Eichhubl2000; Cox, Reference Cox2005; Okamoto & Tsuchiya, Reference Okamoto and Tsuchiya2009). It is worth noting that crack–sealing by itself is not necessarily evidence for rapid fluid flow (Becker et al. Reference Becker, Eichhubl, Laubach, Reed, Lander and Bodnar2010). However, Darcian flow (e.g. Bear, Reference Bear1988) is often used in crustal-scale fluid flow models, where fluid is assumed to flow continuously and slowly through pore space, driven by, for example, topography differences (Oliver, Reference Oliver1986; Oliver et al. Reference Oliver, McLellan, Hobbs, Cleverley, Ord and Feltrin2006 a; Person et al. Reference Person, Mulch, Teyssier and Gao2007) or fluid density gradients associated with thermal instabilities (Matthäi et al. Reference Matthäi, Heinrich and Driesner2004; Zhao et al. Reference Zhao, Hobbs and Ord2008). When hydraulic head gradients are low, Darcian porous flow can be described as ‘diffusional’, because the fluid overpressure evolves in a diffusional way according to a diffusion coefficient related to the permeability. When the rock’s permeability is insufficient to drain the fluid, fluid pressure builds up until the failure threshold is reached, thus activating hydrofractures. Open fractures suddenly increase the local permeability, and therefore fluid drainage, or can rapidly propagate together with their contained batch of fluid as mobile hydrofractures (Bons, Reference Bons2001). These very rapid fluid-flow modes can be termed ‘ballistic’ (Bons & van Milligen, Reference Bons and van Milligen2001).
Permeability, as one of the main controls on fluid flux, varies from 10−7 m2 in well-sorted gravels to < 10−23 m2 in some crystalline rocks. It generally decreases logarithmically with depth (Ingebritsen & Manning, Reference Ingebritsen and Manning1999; Manning & Ingebritsen, Reference Manning and Ingebritsen1999; Cox, Reference Cox2005). In the Earth’s crust, permeability changes due to a variety of processes, such as compaction and decompaction, fluid flow and fluid production (e.g. dehydration reaction, fluid release by crystallizing magma), tectonism, and seismicity (e.g. Sibson et al. Reference Sibson, Moore and Rankin1975; Walder & Nur, Reference Walder and Nur1984; Yardley, Reference Yardley, Walther and Wood1986; Nor & Walder, Reference Nor and Walder1992; Connolly, Reference Connolly1997; Cox, Reference Cox2005; Hooker & Fisher, Reference Hooker and Fisher2021), and has therefore been described as a dynamically self-adjusting property (Townend & Zoback, Reference Townend and Zoback2000; Rojstaczer et al. Reference Rojstaczer, Ingebritsen and Hayba2008; Ghani et al. Reference Ghani, Koehn, Toussaint and Passchier2015; Weis, Reference Weis2015; Koehn et al. Reference Koehn, Piazolo, Sachau and Toussaint2020; Fig. 5). As permeability can change suddenly over many orders of magnitude, Miller and Nur (Reference Miller and Nur2000) described the self-adjustment as a toggle switch that can lead to intermittency and self-organization (Sibson et al. Reference Sibson, Robert and Poulsen1988; Sibson, Reference Sibson2000 a, b; Cox, Reference Cox2005; Weis, Reference Weis2015; Preisig et al. Reference Preisig, Eberhardt, Gischig, Roche, van der Baan, Valley, Kaiser, Duff, Lowther, Gleeson and Ingebritse2016).
Dynamic fluid transport has been numerically modelled with cellular automata in several studies (Miller & Nur, Reference Miller and Nur2000; Bons and van Milligen, Reference Bons and van Milligen2001; de Riese et al. Reference de Riese, Bons, Gomez-Rivas and Sachau2020; Hooker & Fisher, Reference Hooker and Fisher2021; Wangen, Reference Wangen2022). Miller and Nur (Reference Miller and Nur2000) and Bons and van Milligen (Reference Bons and van Milligen2001) both showed that fluid flow self-organizes as soon as a critical state is reached, which activates hydrofracture-controlled fluid flow as a ballistic fluid transport mode, resulting in power-law distributed frequencies of hydrofracture sizes. Wangen (Reference Wangen2022) utilized the same approach to model fluid expulsion from compacting sediments. In reality, transport of fluid through the crust is never exclusively diffusive Darcian, or intermittent hydrofracture flow only, but rather a combination of the two end members (e.g. Shapiro & Dinske, Reference Shapiro and Dinske2009). The interaction between these two end members of fluid flow was investigated in detail in de Riese et al. (Reference de Riese, Bons, Gomez-Rivas and Sachau2020), and the resulting patterns are shown in Figures 9 and 10. A description of the model is given in the Supplementary Material (available online at https://doi.org/10.1017/S0016756822001042). The model box (Fig. 9a, b) illustrates a 10 km tall vertical section through the Earth’s crust, with a constant fluid flux entering at the base of the model that is characteristic for crustal metamorphic fluid fluxes at a depth of c. 10–15 km (Ingebritsen & Manning, Reference Ingebritsen and Manning1999). The model only considers overpressure, which diffuses to simulate porous flow through the rock matrix. The effective pressure diffusion coefficient, D (see Supplementary Material), is varied, which implies a variation in permeability, and allows investigating the interaction of hydrofracture- and Darcian-dominated fluid flow.
Modelling results showing behaviour of hydrofracture and Darcian porous flow and the transition between them. (a–b) Snapshots of the pressure distribution in the model box with fluid influx from below: (a) for three different fluid-pressure diffusion coefficients D with D = 0 (no diffusion), D = 2 × 10⁻⁶ (slow diffusion) and D = 1 × 10⁻⁴ (fast diffusion), and (b) for three time steps of the simulation with D = 2 × 10⁻⁶, where a hydrofracture reaches the top of the model at time t = 1. With time the pressure diffuses into the drained parts of the model and the initially sharp boundary becomes fuzzy. (c) Mean pressure in the model box versus time. A small diffusion coefficient produces irregular and intermittent behaviour. A high diffusion coefficient produces periodical pressure fluctuations. Modified after figures 3 and 4 of de Riese et al. (Reference de Riese, Bons, Gomez-Rivas and Sachau2020).

Frequency distributions of hydrofracture sizes (area) for different pressure diffusion coefficients (D). Hydrofractures that do not reach the surface of the model follow a power law distribution as they plot on a straight line in the log–log plot. Modified after de Riese et al. (Reference de Riese, Bons, Gomez-Rivas and Sachau2020).

Fluid production induces increasing fluid pressures, depending on the fluid overpressure diffusivity D (Fig. 9a). As soon as fluid pressure reaches the failure criterion (lithostatic pressure), a hydrofracture develops in the model. It can subsequently propagate depending on the fluid overpresssure in its vicinity. At a very high permeability relative to the fluid flux (D = 10−4) almost all fluid overpressure is dissipated by diffusional matrix flow towards the top of the model. In case of zero permeability (D = 0) all fluid transport takes place by hydrofracture propagation only. Hydrofractures that reach the top of the model domain drain all the fluid they contain, which effectively means the fluid overpressure is set to zero in that hydrofracture. Figure 9b shows the pressure field evolution with time of a simulation with D = 2 × 10⁻⁶ where both transport modes are active. Drainage of large hydrofractures results in low fluid overpressures in the top half of the model. The pressure field shows how the sharp boundaries of a hydrofracture become fuzzy with time as fluid flows in or out of the fracture after its arrest or drainage out of the top of the model. The mean pressure versus time in the system is shown in Figure 9c. In the case of pure hydrofracture flow the fluid pressure fluctuates strongly, although the input flux is constant. With increasing D, pressure fluctuations start to become periodical, while hydrofracture events become less frequent. When permeability is very high (D = 10−4) the mean pressure becomes highly periodical, as fluid pressure can simultaneously build up in the whole model until a single very large hydrofracture discharges all the fluid and the fluid overpressure is reset to a low value throughout.
Sizes of hydrofractures that do not reach the surface have a power-law distribution (Fig. 10). Hydrofractures that can reach the surface have frequency size distributions that do not follow a power law. These hydrofractures are always large and scarce. With an increasing diffusion coefficient D, the hydrofracture frequency decreases, especially the frequency of hydrofractures that do not reach the surface (Fig. 10). Meanwhile, the size and fraction of fractures reaching the surface increases. Hydrofractures that are not able to reach the surface are constrained to the bottom part of the model, just above the fluid source. They spread the fluid within the crust. Their power-law distributions show that large but rare events transport most of the fluid, and indicate self-organized criticality (SOC) in the transport dynamics (Bak et al. Reference Bak, Tang and Wiesenfeld1988; Turcotte, Reference Turcotte1999). Self-organization develops due to the existence of a failure threshold, which leads to the activation of a ballistic transport mode and the discharge of the excess fluid as soon as the failure threshold is locally overcome.
Hydrofractures reaching the surface of the model domain transport the entire fluid volume with few but large events (Fig. 10). These large events can be called ‘dragon kings’ (Sornette, Reference Sornette2009), which are outliers coexisting with power-law distributions, but taking on very high values far beyond those of the power-law distribution. They are usually associated with the development of a tipping point or a bifurcation (Sornette, Reference Sornette2009). They are linked to the small hydrofractures that self-organize the fluid-pressure distribution, trigger avalanches and therefore initiate large fluid-escape events (Bons et al. Reference Bons, Becker, Elburg and Urtson2009; de Riese et al. Reference de Riese, Bons, Gomez-Rivas and Sachau2020). These large fluid-escape events transport very large fluid volumes with a high velocity from depth to shallow levels in the crust, where they can form hydraulic breccias. If the ascent of fluid is fast enough, as in the case of hydrofracture propagation (Bons, Reference Bons2001), fluids would not be able to decrease their temperature significantly and, as they may have high concentrations of dissolved elements, these fluids could deposit ores and cause extensive rock alteration. The Black Forest ore province (SW Germany) is characterized by a large number of small ore deposits (Staude et al. Reference Staude, Bons and Markl2009), which could have been produced by a large number of small fluid escape events (Bons et al. Reference Bons, Fusswinkel, Gomez-Rivas, Markl, Wagner and Walter2014). It is of interest to note that the volumes of these deposits follow a power law (fig. 4 in Staude et al. Reference Staude, Bons and Markl2009).
4. When is a fracture or vein a hydrofracture?
In this section we address the question how to determine whether a fracture or vein found in the geological record was formed as a hydrofracture, and thus could be an indicator of elevated fluid pressure at the time of its formation. Hydrofracturing may appear obvious in the case of igneous dykes, i.e. originally magma-filled fractures. With the frozen magma still preserved inside the fractures it is clear that the fluid ‘magma’ caused or at least played a significant role in the formation, opening and propagation of the fractures. In other cases, the question may be more difficult to answer.
4.a. Hydrofractures and depth
Extensional veins are often assumed to have formed from tensional failure (see discussion below), and therefore to indicate elevated fluid pressure or hydrofracturing (e.g. Cobbold & Rodrigues, Reference Cobbold and Rodrigues2007) on Earth, but also on Mars (e.g. Caswell & Milliken, Reference Caswell and Milliken2017; Kronyak et al. Reference Kronyak, Kah, Edgett, Van Bommel, Thompson, Wiens, Sun and Nachon2019). The rationale is that the Mohr circle for stress must touch the failure envelope in the negative normal stress region to induce extensional (pure mode I or hybrid) fractures. This implies that both the mean stress (midpoint of the Mohr circle) and the differential stress (the diameter of the Mohr circle) are limited in magnitude, because a larger Mohr circle would touch the failure envelope in the non-dilatant shear-fracture regime. Without an elevated fluid pressure, a small mean stress is only found at shallow depths. At greater depths this can only be achieved with an elevated fluid pressure. Etheridge (Reference Etheridge1983) used this logic to argue that under metamorphic conditions fluids are usually overpressured and differential stresses are limited because extensional veins are common in metamorphic rocks.
Extensional fractures that formed under metamorphic conditions, at depths greater than c. 10 km, are hydrofractures as they can only occur when the fluid pressure is raised significantly. However, for extensional fractures formed at shallow depths it is less clear whether they are hydrofractures as they could potentially also be caused by tectonic stresses without a reduction of the effective stresses due to an elevated fluid pressure. We define the critical depth (z crit) as the depth below which extensional fractures can be assumed to be hydrofractures. Both Sibson (Reference Sibson2000 a) and Gudmundsson (Reference Gudmundsson2011) use g ρ rock z crit = −3T that is derived from the Griffith criterion to obtain a maximum depth of 1–2 km for purely tectonic extensional fractures, i.e. those that formed without a contribution of the fluid pressure. Both authors base their outcome on the generally low tensional strengths of bulk rocks, between −3 and −6 MPa according to Gudmundsson (Reference Gudmundsson2011). However, Hooker et al. (Reference Hooker, Larson, Eakin, Laubach, Eichhubl, Fall and Marrett2015) describe quartz veins that they argue formed as infill of c. 6 km deep tectonic fractures in the absence of an elevated fluid pressure. The authors used c = 60 MPa, T = −25 MPa and µ = 0.6.
Above we defined hydrofractures as those fractures whose failure was caused primarily by fluid overpressure (P f). We now define ‘primarily’ as P f ≥ (σ 1 − σ 3)/2, with σ 1 and σ 3 the effective stresses at the point of failure to take into account that the Mohr circle can change in size as fluid pressure changes (Fig. 2). This means that for a hydrofracture the shift of the Mohr circle is larger than the radius of the Mohr circle at the moment of failure.
The Griffith criterion only takes T into account and not the angle of internal friction for σ n > 0. Here we propose to also use the criteria for shear failure (c and µ or ψ), in addition to T. We neglect hybrid failure, but the poorly constrained hybrid failure criteria allow this simplification. The intention is to find a rough depth below which extensional fractures are most likely hydrofractures. Using these failure criteria, one can find the Mohr circle that touches the failure envelope both at the tensional failure criterion and at that for shear failure (orange circle in Figs 1c and 11a) (Behrmann, Reference Behrmann1991). A smaller circle positioned further left will only cause tensional failure, while a larger circle further to the right will only cause shear failure. The principal stresses for a circle that touches the shear failure criterion are given by:
 $${{({\sigma _1} - {\sigma _3})} \over 2}\cos \psi = c + \tan \psi \left( {{{{\sigma _1} + {\sigma _3}} \over 2} - {{{\sigma _1} - {\sigma _3}} \over 2}\sin \psi } \right)$$
Maximum depth of tectonic extensional fractures. (a) Mohr–Coulomb diagram with Mohr circle that touches (stars) the failure envelope at both the criterion for tensional failure and for shear failure. When P f is more than the radius of the Mohr circle, we regard failure as dominantly caused by the elevated fluid pressure, i.e. a hydrofracture. The depth at which this occurs is z crit. (b–d) Graphs of different values of z crit as a function of cohesion (c) and absolute tensional strength (T), and for different angles of internal friction for the Earth’s gravitational acceleration of g = 9.81 m s−2 and an assumed rock density of ρ rock = 2500 kg m−3. (e–f) Same graphs for Mars with g = 3.721 m s−2 and ρ rock = 3000 kg m−3.

The circle reaches the tensional failure criterion at the same time, giving σ 3 = T, giving:
 $${\sigma _1} = {{{{2c} \over {\tan \psi }} + \left( {{{\cos \psi } \over {\tan \psi }} + 1 + \sin \psi } \right)T} \over {{{\cos \psi } \over {\tan \psi }} - 1 + \sin \psi }}$$
In an Andersonian stress configuration the vertical stress at depth z is ρrock gz, but the horizontal stress can deviate from this value. A vertical extensional fracture can form if the horizontal effective stress is reduced enough to reach T. We combine the criteria that at the critical depth both tensional and shear failure occur (Eq. 19) and that the fluid pressure is half the diameter of the Mohr circle to obtain:
 $${\sigma _1} + {P_{\rm{f}}} = {\sigma _1} + {{{\sigma _1} - T } \over 2} = \rho g{z_{{\rm{crit}}}} \Leftrightarrow {z_{{\rm{crit}}}} = {{3{\sigma _1} - T} \over {2\rho g}}$$
Note that we only deal with stress conditions and can thus use Terzaghi’s principle without taking into account poroelastic effects. For these the reader is referred to Olson et al. (Reference Olson, Laubach and Lander2009).
Combining Eqs (19) and (20) now gives the critical depth, below which fluid pressure must have contributed at least 50 % to tensional failure, as a function of c, T and ψ. We see in Figure 11 that z crit strongly depends on the assumed failure criteria and can theoretically reach well over 5 km, especially if cohesion is high. However, if the effective tensional strength and cohesion of bulk rocks are indeed rather small, much shallower critical depths are obtained, such as the ∼1 km of Gudmundsson (Reference Gudmundsson2011) or ∼2 km of Sibson (Reference Sibson2000 a). As our derivation of z crit is not for a dry rock, but for a 50 % contribution to failure of fluid pressure, we suggest using a critical depth range of c. 2–3 km below which extensional fractures under most circumstances must have formed with a significantly elevated fluid pressure and can thus be regarded as hydrofractures. This maximum depth of tensional failure without high fluid pressure roughly coincides with the calculations of Bourne (Reference Bourne2003) for the formation of extensional fractures in multilayer systems that are subjected to remote compression in which alternating beds have contrasting elastic properties. This of course cannot simply be applied to extensional fractures that form part of a fracture network, like extensional jogs in a shear fracture. The above Mohr–Coulomb construction of an isotropic rock does not apply to such more complex systems (Koehn et al. Reference Koehn, Arnold, Passchier, Gapais, Brun and Cobbold2005). Based on similar approaches to those presented in this section, other studies proposed shallow depths for the formation of hydrofractures for vein networks, using the elastic crack theory and the vein mean aspect ratio (Phillip, Reference Phillip2012).
Mineral veins in sediments on Mars have been interpreted as hydrofractures (Kronyak et al. Reference Kronyak, Kah, Edgett, Van Bommel, Thompson, Wiens, Sun and Nachon2019). However, gravitational acceleration on Mars is only 3.721 m s−2. Although the olivine-rich clastic sediments may have a higher density, the product of rock density by g on Mars is less than half that on Earth, when using rock densities of 3000 kg m−3 and 2500 kg m−3, respectively. This means (Eq. 20) that z crit on Mars is more than double that on Earth for the same failure criteria. Unless the depth of formation of the Mars veins can be constrained, care must be taken in using the presence of veins as evidence for hydrofracturing.
The above certainly does not imply that all fractures that formed at a shallower depth than z crit are not hydrofractures. It only means that the mere presence of extensional fractures is not enough to state that fluid pressure was the dominant cause for the fracturing. Additional information can of course further constrain the fluid pressure state. In a basin at rest, for example, one knows that tectonic stresses cannot have caused the fracturing, as otherwise it would not be at rest. Horizontal extensional fractures in such a basin must have formed from fluid overpressure (Eq. 10). However, on Mars, for example, palaeostress conditions are poorly constrained and meteorite impacts may also have contributed significantly to fracturing.
4.b. Veins as potential fossil hydrofractures
Formerly open fractures in the geological record are typically identified as veins that are originally open fractures in which the fluid-filled space is now filled by minerals that precipitated from a fluid (Bons et al. Reference Bons, Elburg and Gomez-Rivas2012). There is no reason to assume that open fractures are always filled with minerals. Instead, they can also remain open, or completely or partially close again. Becker et al. (Reference Becker, Eichhubl, Laubach, Reed, Lander and Bodnar2010), for example, show that quartz veins in the East Texas Basin (USA) remained (partially) open for 48 Ma. The opposite would be the case in mobile hydrofractures (Bons, Reference Bons2001), where the fracture propagates and opens at its upper end while closing at its lower one. This process is assumed to be rapid enough to not allow for any significant mineral precipitation to occur in the time that at any one location the fracture is open. Especially for quartz these assumptions seem warranted considering the slow growth rates of <1 mm Ma−1 up to 250 °C reported by Lander and Laubach (Reference Lander and Laubach2015). These authors, but also for example Laubach et al. (Reference Laubach, Reed, Olson, Lander and Bonnell2004), describe how cracks can be partially filled with bridging crystals that leave fracture porosity in between, as revealed by cathodoluminescence. In some cases it may be possible to recognize a formerly open fracture that subsequently closed again, maybe only partially filled with minerals, by the distortion of the rock around the former fracture (Fisher & Brantley, Reference Fisher and Brantley1992; Bons et al. Reference Bons, Druguet, Castaño and Elburg2008) (Fig. 12).
(a) Network of quartz veins in basement rocks of the Jabal Akhdar dome in Oman (Gomez-Rivas et al. Reference Gomez-Rivas, Bons, Koehn, Urai, Arndt, Virgo, Laurich, Zeeb, Stark and Blum2014; Ghani et al. Reference Ghani, Koehn, Toussaint and Passchier2015). (b) Drawing of the veins and traces of the main tectonic foliation. Inward bending of the foliation indicates that the original fractures, now filled with quartz, partly collapsed.

Veins can provide indications of the stress and fluid pressure conditions at the time of their formation, firstly, by their shape or orientation, and secondly by their internal structure. Moreover, fluid inclusions within vein cement can be used to systematically unravel palaeo-fluid pressures (Becker et al. Reference Becker, Eichhubl, Laubach, Reed, Lander and Bodnar2010). Durney and Ramsay (Reference Durney, Ramsay, De Jong and Scholten1973) introduced the basic terminology and classification of internal vein structures that is still widely used today. It consists of (i) the growth direction of vein crystals relative to the wall rock, and (ii) the morphology of these crystals. This results in three main vein categories (Bons et al. Reference Bons, Elburg and Gomez-Rivas2012): first, syntaxial veins with blocky or elongate blocky crystals that consistently grow from the wall-rock substrate towards the middle of the vein (Fig. 13a); second, stretching, or ataxial veins with stretched crystals that grew by repeated fracturing and sealing (Ramsay, Reference Ramsay1980) and that may not show any preferred growth direction (Fig. 13b–c); finally, antitaxial veins with fibrous crystals that grow against the wall rock as the vein widens (Fig. 13d–e).
Representative images of (a) syntaxial, (b–c) stretching, and (d–f) antitiaxial or beef vein types. (a) Syntaxial calcite vein from Biure (NE Spain) showing clear growth competition in the upward growth direction. (b) Stretching vein from the Jabal Akhdar dome, Oman, with long stretched calcite and quartz crystals. The tips of the vein show that the vein formed by many individual crack–seal events. (c) Quartz vein with stretched crystals with parallel serrate boundaries, indicating multiple crack seal events. Yudnamutana, Mount Painter Inlier, South Australia. (d) Antitaxial, fibrous (beef) vein from Oppaminda Creek, Mount Painter Inlier, South Australia. The vein formed by outward growth from originally narrow en échelon crack–fills shown below. (e) Antitxial fibrous vein from same locality, showing symmetry of curvature of the smooth fibres (compare with (c)) on both sides of the median zone, which itself has a very different internal structure. (f) Fibrous vein where the fibres are not seeded on a median zone, but on a layer of pyrite. Minor coarsening of the smooth fibres shows the growth direction, with the fibre tips growing against the host-rock shale. Drill core sample of the Lower Silurian Longmaxi Formation shale, Luzhou Block, Southern Sichuan Basin, China.

The crack–seal theory of Ramsay (Reference Ramsay1980) is fundamental to understanding the formation of veins from fractures. He showed that veins can form by repeated failure that results in opening of a fracture (the ‘crack’ stage), and subsequent filling of the fluid-filled space with minerals (the ‘seal’ stage). Mineral precipitation is usually by epitaxial overgrowth of mineral grains at the fracture surfaces, as can be seen from the optical continuity between old and new growth stages (Urai et al. Reference Urai, Williams and van Roermund1991; Laubach et al. Reference Laubach, Reed, Olson, Lander and Bonnell2004; Späth et al. Reference Späth, Spruženiece, Urai, Selzer, Arndt and Nestler2021). A crack–sealing cycle can occur once for a vein, but also many times, each time adding a slice of mineral precipitate to the widening vein. If the width of the open fracture is large relative to the width of the seed crystals for the mineral veins, we usually observe competitive growth of vein crystals from the fracture surfaces into the fracture space. As a result, some crystals outgrow their neighbours, and the mean crystal width increases towards the middle of the vein (Fig. 13a). This is the classical syntaxial vein geometry in which the crystals typically have blade-like or elongate-blocky shapes (Durney & Ramsay, Reference Durney, Ramsay, De Jong and Scholten1973; Fisher & Brantley, Reference Fisher and Brantley1992; Hilgers et al. Reference Hilgers, Koehn, Bons and Urai2001; Okamoto & Sekine, Reference Okamoto and Sekine2011; Späth et al. Reference Späth, Spruženiece, Urai, Selzer, Arndt and Nestler2021). Although the original work of Ramsay (Reference Ramsay1980) and many other subsequent papers assume that the whole crack fills with minerals before the next crack event, this is not always the case, especially under diagenetic conditions. Isolated crystals may already span the crack, while leaving open pore space in between (Laubach et al. Reference Laubach, Reed, Olson, Lander and Bonnell2004; Kling et al. Reference Kling, Schwarz, Wendler, Enzmann and Blum2017; Späth et al. Reference Späth, Urai and Nestler2022), or cracks may only fill completely near their tips, but not in their wider central parts (Bons et al. Reference Bons, Elburg and Gomez-Rivas2012).
The crack–seal cycle can also occur many times during the growth of a single vein. The narrow width of the open fracture in each individual crack–seal event inhibits growth competition (Hilgers et al. Reference Hilgers, Koehn, Bons and Urai2001). Furthermore, the location of each new open fracture may differ from that of the previous one. As a result, individual vein crystals are stretched by inserting slice after slice of epitaxially grown mineral in the gap formed in the crystal each crack–seal cycle. These vein crystals therefore do not usually show a consistent widening in one direction, but can become long and narrow (Fig. 13b), often called ‘fibres’, although we prefer the term ‘stretched crystals’ (Bons et al. Reference Bons, Elburg and Gomez-Rivas2012). The veins are termed ‘stretching veins’ or ‘ataxial veins’ (Passchier & Trouw, Reference Passchier and Trouw2005), as their crystals show no consistent growth direction. Repeated crack–sealing can be recognized by the stretched-crystal morphology, where the boundaries between individual crystals are often serrate on the length scale of the individual fracture widths (‘radiator structure’; Fig. 13c), and the presence of fracture-parallel bands of fluid inclusions, wall-rock particles or secondary minerals (Ramsay, Reference Ramsay1980; Renard et al. Reference Renard, Andréani, Boullier and Labaume2005). It should also be noted that an open crack need not fill evenly, but some individual crystals may outgrow others to form bridges across the crack and incrementally restore cohesion until a new failure event occurs (Laubach et al. Reference Laubach, Lander, Criscenti, Anovitz, Urai, Pollyea, Hooker, Narr, Evans, Kerisit, Olson, Dewers, Fisher, Bodnar, Evans, Dove, Bonnell, Marder and Pyrak-Nolte2019; Späth et al. Reference Späth, Urai and Nestler2022). Crystal morphology in crack–seal veins can therefore be variable and repeated crack–sealing may sometimes only be revealed with cathodoluminescence (Laubach et al. Reference Laubach, Reed, Olson, Lander and Bonnell2004; Gale et al. Reference Gale, Lander, Reed and Laubach2010). Syntaxial and ataxial vein growth are end members of a continuum, and both growth modes may operate in a single vein (Bons et al. Reference Bons, Elburg and Gomez-Rivas2012).
Recognizing crack–sealing in veins is important as each crack–seal cycle represents a point in time where the stress and fluid-pressure conditions were such that a dilatant fracture could form to provide the space for subsequent sealing by mineral growth. It is therefore also of equal importance to recognize those veins whose internal structure does not indicate crack–sealing.
Some veins consist of distinctly fibrous crystals that are aligned parallel to each other and that have smooth boundaries. They are often referred to as ‘beef veins’, as the fibrous texture is reminiscent of beef (Buckland & De La Beche, Reference Buckland and De La Beche1835). Gypsum, calcite and quartz are the most common minerals to form beef veins (Cobbold et al. Reference Cobbold, Zanella, Rodrigues and Løseth2013). Durney and Ramsay (Reference Durney, Ramsay, De Jong and Scholten1973) introduced the term ‘antitaxial’ for veins in which the vein-filling crystals grow outwards towards the vein/wall-rock interfaces (Fig. 13d). Crystal growth in antitaxial veins is seeded on what they termed a ‘median line’, but which Oliver and Bons (Reference Oliver and Bons2001) termed a ‘median zone’, as it usually has a finite width (Fig. 13e). Antitaxial veins can be also called beef veins, as their vein crystals are smooth and fibrous. In the literature, the term ‘beef’ is often used for bedding-parallel fibrous veins, while ‘antitaxial’ is more often used for fibrous veins in general orientations. Beef veins may lack a median zone,which forms part of the definition of antitxial veins (Durney & Ramsay, Reference Durney, Ramsay, De Jong and Scholten1973; Passchier & Trouw, Reference Passchier and Trouw2005; Bons et al. Reference Bons, Elburg and Gomez-Rivas2012). It should also be noted that the term ‘fibrous’ is sometimes used for any elongate vein crystals (e.g. Cox, Reference Cox1987; Zhang et al. Reference Zhang, Yin, Gu, Zhang, Yan and Wang2015) and then erroneously compared to antitaxial or beef veins, because these are fibrous. The term ‘fibrous’ should therefore only apply to very to extremely elongate crystals with parallel smooth boundaries (Oliver & Bons, Reference Oliver and Bons2001).
Many authors recognized the association of fibrous calcite (±quartz) veins with hydrocarbon generation during thermal maturation of organic matter (Bredehoeft et al. Reference Bredehoeft, Wolff, Keys and Shuter1976; Osborne & Swarbrick, Reference Osborne and Swarbrick1997; Cobbold & Rodrigues, Reference Cobbold and Rodrigues2007; Cobbold et al. Reference Cobbold, Zanella, Rodrigues and Løseth2013; Zanella et al., Reference Zanella, Cobbold and Boassen2015 a; Wang et al. Reference Wang, Chen, Song, Steele-MacInnis, Liu, Wang, Zhang, Zhao, Liu, Zhang and Zhou2018; Hooker et al. Reference Hooker, Ruhl, Dickson, Hansen, Idiz, Hesselbo and Cartwright2020). Fibrous calcite veins are most common in organic carbon-rich shales (Fig. 13f) and often contain solid bitumen inclusions or hydrocarbon inclusions, which are further indications that the vein formation was synchronous with hydrocarbon generation (Zanella et al. Reference Zanella, Cobbold, Ruffet and Leanza2015 b; Wang et al. Reference Wang, Chen, Song, Steele-MacInnis, Liu, Wang, Zhang, Zhao, Liu, Zhang and Zhou2018; Su et al. Reference Su, Bons, Chen, Feng, Zhao and Song2021). The assumption that fibrous veins are formed by extensional fracturing has led the aforementioned authors and others (e.g. Cosgrove, Reference Cosgrove2001) to infer that these veins indicate hydrofracturing due to fluid overpressure, possibly caused by hydrocarbon generation during thermal maturation of organic matter. If the veins are parallel to horizontal bedding, this would imply that the fluid pressure must have exceeded the vertical overburden load (Section 3.a.2). However, as discussed by Cobbold et al. (Reference Cobbold, Zanella, Rodrigues and Løseth2013), it is far from certain that fibrous crystal growth is the result of crack–sealing.
It was already suggested by Taber (Reference Taber1918) that growth must have been continuous, with the crystal-growth front at all times keeping track with the diverging wall rock (Durney & Ramsay, Reference Durney, Ramsay, De Jong and Scholten1973; Urai et al. Reference Urai, Williams and van Roermund1991). This is consistent with the smooth fibre boundaries and lack or suppression of growth competition (Mügge, Reference Mügge1928; Hilgers et al. Reference Hilgers, Koehn, Bons and Urai2001; Bons & Montenari, Reference Bons and Montenari2005). A further argument against growth of the fibres in an open fracture is that fibrous veins can grow simultaneously on both sides of a vein and it seems mechanically improbable that two parallel fractures exist on both sides of a growing vein (Bons & Montenari, Reference Bons and Montenari2005). The simultaneous growth on the outer surfaces of antitaxial veins is particularly conspicuous at intersections of antitaxial veins of different orientations. Here we can observe that both the old and new generation keep widening at their outer surface (fig. 7 in Oliver & Bons, Reference Oliver and Bons2001).
This aggregate of arguments suggests that fibrous growth occurs in the absence of open fractures (Taber, Reference Taber1918; Mügge, Reference Mügge1928; Bons & Jessell, Reference Bons and Jessell1997; Means & Li, Reference Means and Li2001; Oliver & Bons, Reference Oliver and Bons2001; Wiltschko & Morse, Reference Wiltschko and Morse2001; Luan et al. Reference Luan, Dong, Azmy, Lin, Ma, Ren and Zhu2019; Meng et al. Reference Meng, Hooker and Cartwright2019; Su et al. Reference Su, Bons, Chen, Feng, Zhao and Song2021). It should be noted that median zones tend to have a different microstructure, typically one that does indicate crack–sealing (Fig. 13e), which led Bons & Montenari (Reference Bons and Montenari2005) to propose that fibrous veins can be seeded on (narrow) crack–seal veins, but that fibrous growth subsequently undergoes a switch in the growth mechanism without crack–sealing (Su et al. Reference Su, Bons, Chen, Feng, Zhao and Song2021). However, some fibrous veins lack a median zone (Fig. 13f) and they may thus never have experienced any crack–sealing. Instead, the fibrous crystals appear to be seeded on a bed interface or lamination. A number of driving forces for fibrous growth in the absence of an open fracture have been suggested, such as the force of crystallization (Means & Li, Reference Means and Li2001), concentration gradients due to stress or pressure gradients that drive dissolution–precipitation reactions (Fletcher & Merino, Reference Fletcher and Merino2001; Bons & Montenari, Reference Bons and Montenari2005), or even microbial activity (Bons et al. Reference Bons, Montenari, Bakker and Elburg2007).
As the mechanism of fibrous or beef growth remains enigmatic, care should be taken before inferring fluid pressure from such veins and they should not be automatically equated with hydrofractures. We favour distinguishing between the conditions of (i) vein initiation where the median zone (even when completely on one side) is formed from (ii) the subsequent fibrous growth by which the vein widens. Geometry, orientation and internal microstructure of the median zone may indicate a significantly elevated fluid pressure at time of formation. In particular, the median zones of horizontal fibrous or beef veins in organic-matter-rich shales are probably the result of elevated fluid pressure (Eq. 10; Fig. 2b) due to hydrocarbon release (see references above). However, the ‘Taber school’ (based on Taber, Reference Taber1918) argues that the outer vein surface is not a crack, but a cohesive interface, where the fibres grow against the wall rock. Whether they do will depend on the ambient tectonic stress (Fletcher & Merino, Reference Fletcher and Merino2001) and probably fluid pressure as well, and of course the rock type, minerals involved, etc. Still if the fibres grow in the absence of a fracture, the resulting fibrous vein cannot be called a hydrofracture.
4.c. Breccias
Breccias are rock masses composed of broken rock fragments. Breccias can be of a variety of origins. Aside from impact and sedimentary breccias, or those formed by tectonic diminution in faults due to tectonic stresses (e.g. Sibson, Reference Sibson1986; Keulen et al. Reference Keulen, Heilbronner, Stünitz, Boullier and Ito2007; Mort & Woodcock, Reference Mort and Woodcock2008), they can also develop by intensive hydrofracturing due to fluid overpressure as of interest here (Laznicka, Reference Laznicka1989; Jébrak, Reference Jébrak1997; Lorilleux et al. Reference Lorilleux, Jébrak, Cuney and Baudemont2002; Weisheit et al. Reference Weisheit, Bons and Elburg2013 a). Long-distance transport of clasts, and structures that indicate fluidization, suggest that fluid flow velocities may be as high as m s−1 (Oliver et al. Reference Oliver, Rubenach, Fu, Baker, Blenkinsop, Cleverley, Marshall and Ridd2006 b). Eichhubl (Reference Eichhubl2000) and Okamoto & Tsuchiya (Reference Okamoto and Tsuchiya2009) estimated fluid velocities of 0–01–0.1 m s−1, while Oliver et al. (Reference Oliver, Rubenach, Fu, Baker, Blenkinsop, Cleverley, Marshall and Ridd2006 b) estimated velocities of 5 m s−1 in the case of a fluidized breccia with m-sized clasts.
To give an example, the Hidden Valley breccia in the Northern Flinders Ranges of South Australia is a massive hydrothermal breccia with a size of c. 10 km2 in outcrop (Weisheit et al. Reference Weisheit, Bons and Elburg2013 a). The breccia features a continuous power-law distribution of clast sizes that span over six orders of magnitude. Mixed clasts that were originally several km vertically apart are observed. Using thermogeochronology, Weisheit et al. (Reference Weisheit, Bons, Danišík and Elburg2013 b) inferred that the breccia formation extended over a period of >150 Ma during the exhumation of basement gneisses by >12 km. The estimated total fluid budget responsible for the development of this breccia is c. 20 km3 (Weisheit et al. Reference Weisheit, Bons and Elburg2013 a). Biotite dehydration seems to be the main fluid source in this case.
To distinguish hydraulic breccias from other types of breccias, the clast size morphology and distribution can be used, in particular their fractal dimension, which is related to the rock fragmentation process (Blenkinsop, Reference Blenkinsop1991; Jébrak, Reference Jébrak1997; Lorilleux et al. Reference Lorilleux, Jébrak, Cuney and Baudemont2002; Barnett, Reference Barnett2004; Keulen et al. Reference Keulen, Heilbronner, Stünitz, Boullier and Ito2007; Weisheit et al. Reference Weisheit, Bons and Elburg2013 a). The fractal dimension for the size distribution is defined as the absolute power-law exponent (m) that is obtained when the number of breccia clasts that are larger than a certain size is plotted against that size (see e.g. Blenkinsop (Reference Blenkinsop1991) for the calculation). Weisheit et al. (Reference Weisheit, Bons and Elburg2013 a) found a constant exponent m 2D of about 1 (using the two-dimensional clast area as the measure of size) for clast areas from c. 1 mm2 to almost 1 km2. The power-law distribution evidences that the fragmentation process is scale-invariant (Turcotte, Reference Turcotte1986), and also emphasizes the dynamical behaviour of the fluid flow that produced the breccia. Jébrak (Reference Jébrak1997) and Barnett (Reference Barnett2004) found that hydraulic brecciation results in a small exponent (m ≈ 1), whereas wear abrasion and shear results in larger exponents (m ≈ 2–3), meaning there are relatively many small clasts compared to large ones. The small exponent of about 1 obtained for the Hidden Valley breccia by Weisheit et al. (Reference Weisheit, Bons and Elburg2013 a) thus indicates it formed by hydraulic brecciation. Round clast shapes and the absence of tectonic structures further confirm a hydraulic origin (Weisheit et al. Reference Weisheit, Bons and Elburg2013 a). Another indicator is the strong alteration of this breccia which indicates the passage of large fluid volumes.
Weisheit et al. (Reference Weisheit, Bons and Elburg2013 a) argued that, assuming a porosity of 10 % and a flow rate of 1 m s−1, the estimated cumulative duration of flow through each part of the breccia would be c. 2 × 10⁴ s, which is less than a day. Even if the flow rate were much smaller, the total flow duration would still be a minute fraction of the tens of million of years it took to form the breccia. The required fast fluid flow must therefore be highly intermittent, with short bursts of flow and very long periods of fluid pressure build-up. The Hidden Valley brecciation could be equivalent to the extremely large fluid escape events in the numerical simulations of de Riese et al. (Reference de Riese, Bons, Gomez-Rivas and Sachau2020) and shown in Figures 9 and 10 with a high proportion of fluid pressure diffusion to accumulate the large fluid volume to create the 10 km2 breccia.
4.d Recognizing hydrofractures in the geological record
This subsection provides some examples of hydrofracturing in different tectonic settings. Examples of different vein sets from the Ligurian Units near Sestri Levante, Italy, are given in Figure 14. The units represent the marine Palombini shales that are thrusted first southwards and later eastwards towards the Apennine mountain chain. Veins in the units show a variety of geometries that point towards different importance of fluid overpressure during the initial fracturing, assuming the veins represent at least partly the original fracture pattern. Examples for high fluid overpressure and thus real hydrofractures include very intense veining in soft layers and within small sheared units (Fig. 14a–b), geometries where bedding-parallel and -perpendicular veins switch even though the veins are of the same age (Fig. 14a), and early bedding-parallel veins (Fig. 14d). Examples where differential stresses dominated the pattern include conjugate vein sets on bedding surfaces (Fig. 14c), fracture boudinage type veins that fractured layers (Fig. 14d), and extensional fold-axis-parallel veins that may have developed during folding (Fig. 14c). All the latter examples may have needed local or larger-scale fluid overpressure to overcome tensile or shear stresses, but fluid overpressure does not seem to have dominated the pattern. Therefore, we would not term them ‘hydrofractures’. Real hydrofractures that develop due to a dominance of fluid overpressure are shown in the simulations in Figure 4. Figure 4a–b show the development of horizontal fractures in layers or in a sedimentary basin when the fluid overpressure increases at the same rate in all nodes. This pattern represents the developing bedding-parallel veins in Figure 14d, which were produced by fluid overpressure. The more complicated branching pattern with horizontal and vertical fractures as well as potentially many small and very closely aligned fractures develops in the simulations when a local region in the rock is overpressured (Fig. 4c). If the pressurizing fluid is locally produced in layers within laterally confined cells, then a combination of the patterns shown in Figure 4c and e may develop, which also fits the pattern in Figure 14a. The pattern shown in Figure 14b that develops in a small fault zone is extreme and potentially would be a further development of the simulation shown in Figure 4c in combination with shearing. It could also be compared with the numerical hydraulic breccia pattern shown in Figure 5.
Veins from the Ligurian Units at Sestri Levante, Italy, representing different effects of the fluid pressure assuming they represent the initial fracture geometries. (a) Complex inter-fingering between bedding-perpendicular and bedding-parallel veins. (b) Intense veining in a small thrust fault zone. (c) Veins in folded layers with early conjugate and later fold-axis-parallel veins. (d) Early bedding-parallel veins and fracture boudinage type veins in a layer.
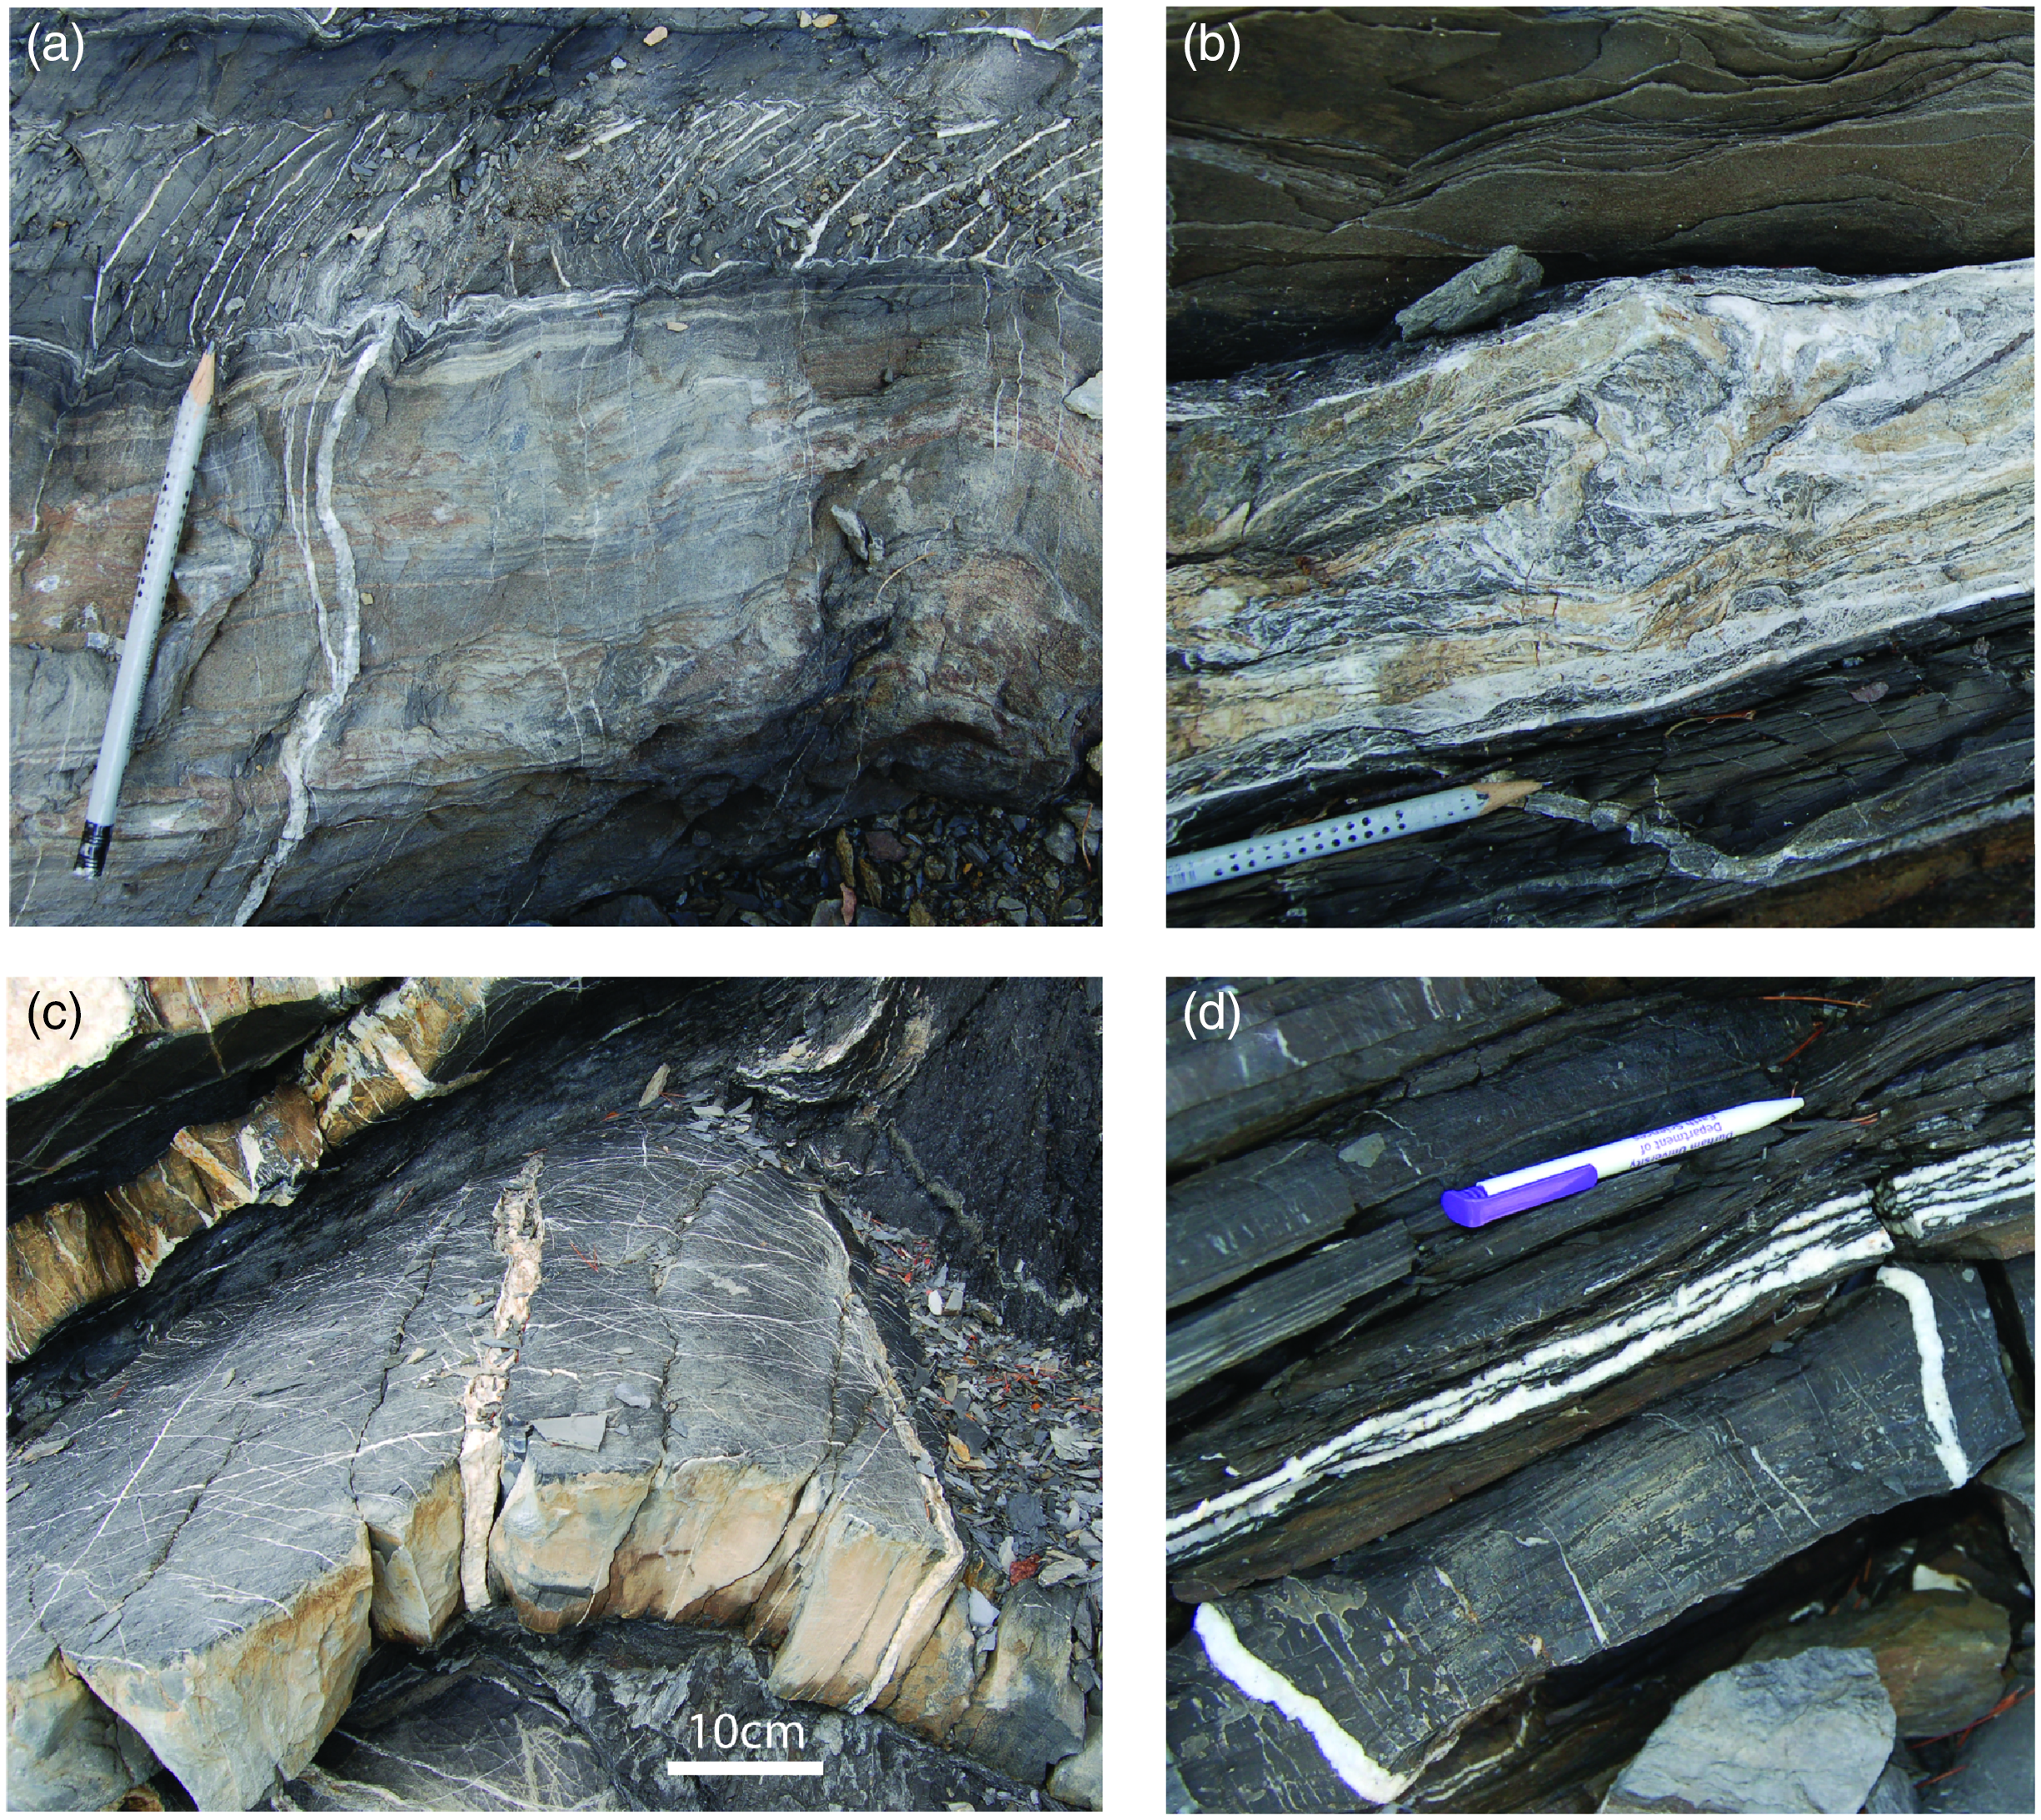
Another well-studied area with examples of the effect of fluid pressure on fracture and vein formation is the Jabal Akhdar Dome in the Oman Mountains (Oman) (Fig. 15). The complex tectonic evolution of this area can be traced from the cross-cutting relationships of different faults and sets of calcite veins (Gomez-Rivas et al. Reference Gomez-Rivas, Bons, Koehn, Urai, Arndt, Virgo, Laurich, Zeeb, Stark and Blum2014). The area was first buried >8 km under the Semail ophiolite and Hawasina nappes. It subsequently underwent strike-slip deformation from the Late Cretaceous to the Eocene due to the northwards movement of the neighbouring Indian plate. Although exhumation by erosion may have started during this time, the main exhumation happened after the main veining events discussed below. Strike-slip deformation led to the formation of intense calcite vein networks in conjugate sets. Such veins are hosted in limestones of the Cretaceous Shams, Nahr Umr and Natih Fm., just below the Muti Fm., which likely acted as a regional seal for interstitial fluids and fluids derived from the basement (Fig. 12). Extensional and hybrid veins that formed at depths around 8 km would require a significant fluid overpressure and may be assumed to have formed as hydrofractures (Section 4a). A hydrofracture origin is consistent with zones of intensive fracturing that resulted in the formation of veins with chaotic orientations (Fig. 15a–c). In this area there are also pavements (Fig. 14d–e) that contain networks of calcite veins typically arranged in en échelon conjugate sets (and with crack–seal microstructures; Fig. 13b) (Bons et al. Reference Bons, Elburg and Gomez-Rivas2012; Gomez-Rivas et al. Reference Gomez-Rivas, Bons, Koehn, Urai, Arndt, Virgo, Laurich, Zeeb, Stark and Blum2014) that formed under a rotating strike-slip stress field. Individual vein segments are oriented at a very low angle with respect to the principal compressive stress, while the acute angle between conjugate sets is also low (typically 15–30°). These orientations reveal that such vein systems formed as hybrid fractures, with some individual segments also formed as extensional fractures, again indicating a system characterized by high fluid pressure. However, with these more regular vein sets that indicate a tectonic contribution to fracture orientations, it becomes difficult to ascertain the actual role of fluid overpressure, especially where the depth of fracturing is not well constrained.
Examples of calcite veins hosted in limestones of the Natih Formation from the Jabal Akhdar dome (Oman Mountains, Oman), which are interpreted to have formed in a system with relatively high fluid pressure. (a) Dense calcite vein networks with some veins showing systematic orientations while others form a chaotic mesh (Gorge pavement). (b) Detail of a zone with intense and chaotic calcite veining in (a). (c) Damage zone of an outcrop-scale strike-slip fault showing a dense mesh of calcite veins with variable orientations (Wadi Dam). (d) Pavement with different sets of systematically oriented conjugate crack–seal veins formed under different strike-slip stress fields (Wadi Guhl). (e) Detail of conjugate sets of en échelon strike-slip veins (Gorge pavement). The acute angle between both sets is typically in the range 15–30°, while individual segments form a very low angle with respect to the principal compressive stress. The dense vein meshes of (a), (b) and (c) clearly formed in a setting dominated by high fluid pressure at a certain depth, and thus formed by hydrofracturing. Systematically oriented strike-slip vein sets can be considered as formed from hybrid fractures in a system with relatively high fluid pressure, owing to their orientation with respect to σ1. For a detailed description of these veins see Gomez-Rivas et al. (Reference Gomez-Rivas, Bons, Koehn, Urai, Arndt, Virgo, Laurich, Zeeb, Stark and Blum2014).

Palaeostress inversion techniques aim to unravel the stress fields under which fractures, faults and other geological structures (e.g. veins, stylolites) formed. Some studies consider fluid pressure as a key parameter for palaeostress determination. Jolly and Sanderson (Reference Jolly and Sanderson1997) propose and demonstrate a Mohr circle construction for the analysis of veins or dykes that allows to graphically estimate stress magnitudes and the relative fluid pressure, providing the range of fracture orientations that can open, together with their opening directions. This method is based on the approach by Delaney et al. (Reference Delaney, Pollard, Zioney and McKee1986) that assumes that fractures are opened by fluid pressure when it exceeds the normal stress on the fracture planes. Yamaji et al. (Reference Yamaji, Sato and Tonai2010) apply the same principle to propose a method for the estimation of the stress of state from clusters of veins formed from multiple events of ascending warm fluids with variable fluid pressures, assuming that most batches arrive at a lower fluid pressure than the maximum one. For that, they evaluate the stress state of each vein cluster from an orientation distribution that best fits the vein orientation. Other authors carried out palaeostress determinations from veins, and palaeofluid pressure determinations from fluid inclusion microthermometry data (André et al. Reference André, Sausse and Lespinasse2001) or in combination with geothermometers (Jaques & Pascal, Reference Jaques and Pascal2017). The latter authors applied this method to a case study from the Panasqueira Mine (Portugal), to conclude that horizontal mode I veins formed as hydrofractures at a lithostatic fluid pressure at depths of c. 10 km in a compressive stress regime. The reader is referred to Pascal (Reference Pascal2021) for a thoughtful review of palaeostress inversion techniques.
5. Effects of hydrofractures in hydrocarbon and ore deposit systems and their relationship with geochemistry
Both natural and human-induced hydrofractures can either favour or constrain the origin, evolution and exploitation of hydrocarbons. Moreover, understanding the formation mechanisms of hydrofractures and being able to predict their zones of formation is also key for the exploration and production of ore deposits (e.g. vein stockworks and vein-type deposits; Liu, et al. Reference Liu, Xing and Zhang2017; Sun et al. Reference Sun, Wang, Wang, Zhang and Zhao2021), to enhance the production of geothermal energy (e.g. Moska et al. Reference Moska, Labus and Kasza2021) and to ensure the safe geological storage of geo-energy products, such as captured CO2, hydrogen, compressed air and natural gas (e.g. US Nuclear Regulatory Commission, 2009; Stork et al. Reference Stork, Verdon and Kendall2015).
Human-induced hydrofracturing in hydrocarbon reservoirs has enabled two major innovations in the energy sector: (i) the enhanced recovery of reserves from producing fields, and (ii) the exploitation of unconventional reservoirs, i.e. those low-permeability, ‘tight’ reservoirs that cannot be exploited by using traditional extraction methods (including shale gas, tight sands gas and coal bed methane gas) (Bennion et al. Reference Bennion, Thomas and Bietz1996; Stanchits et al. Reference Stanchits, Mayr, Shapiro and Dresen2011; Wang et al. Reference Wang, Chen, Jha and Rogers2014). Hydraulic fracturing is nowadays the principal technique for increasing and maintaining well productivity (Montgomery & Smith, Reference Montgomery and Smith2010).
In the mining sector, hydrofracturing is also employed as a pre-conditioning and pre-weakening technique to induce caving and fragmentation of the ore bodies in preparation for extraction (Katsaga et al. Reference Katsaga, Riahi, DeGagne, Valley and Damjanac2015; He et al. Reference He, Suorineni and Oh2016). The occurrence of hydraulic fracturing is, however, also seen as a hazard during some types of mining operations. For example, during in situ leach uranium recovery, lixiviant excursions can take place through the formation and propagation of hydrofractures in the ore zone and surrounding rocks, giving rise to an unintended spread that may affect the groundwater quality near the well fields (US Nuclear Regulatory Commission, 2009). Natural hydrofracturing processes are also a key phenomenon for the formation and evolution of ore deposits. It is well known that ore deposits are often related to zones of localized deformation, such as fault zones, shear zones, fracture networks and other rock discontinuities (e.g. Groves et al. Reference Groves, Santosh, Goldfarb and Zhang2018; Chauvet, Reference Chauvet2019). Hydrofracturing is an important mechanism for the generation of some such zones, and the resulting hydrofractures can act either as conduits or barriers to fluids that transfer heat and chemical components at different levels of the Earth’s crust. In particular, those ore deposits genetically related to extensional fractures and that formed at a depth below 2–3 km from the Earth’s surface are, according to what has been suggested above, the result of hydrofracturing processes. The role of hydrofractures as fluid baffles or conduits mainly depends on whether they are sealed by mineral precipitation or, alternatively, remain open. In the first scenario, fluid-pressure drops linked to failure events can trigger mineral precipitation, and if this process is repeated over a geological time, it can give rise to multi-stage mineralizations of different types (e.g. Xiong et al. Reference Xiong, Zuo, Clarke, Miller and Wang2020; Sun et al. Reference Sun, Wang, Wang, Zhang and Zhao2021). Otherwise, in the second scenario, the permeability enhancement produced by hydrofracturing can favour subsequent fluid circulation through fracture networks. However, not all fracture-related ore deposits are the result of hydrofracturing, and neither are all hydrofractures ore deposits. For example, Groves et al. (Reference Groves, Santosh, Goldfarb and Zhang2018) suggested that the occurrence of hydrofractures in Neoarchaean terranes could have caused high-pressure variations leading to gold deposition through related chemical responses and fluid un-mixing episodes. However, in the same tectonic settings, the existence of ‘late fractures’ (possibly hydrofractures) is also reported and linked to orogenic collapse, in all cases postdating the gold deposition (Vielreicher et al. Reference Vielreicher, Groves and McNaughton2016; Groves et al. Reference Groves, Santosh, Goldfarb and Zhang2018). Furthermore, when ore deposits are related to hydrofracturing, the cyclical evolution of fluid pressure and resulting failure events generally give rise to complex geochemical patterns that evolve from repeated depletion to enrichment patterns and from randomly distributed to spatially clustered structures, as demonstrated by Xiong et al. (Reference Xiong, Zuo, Clarke, Miller and Wang2020) through numerical modelling. Recent advances in the understanding of the relationships between fluid composition, chemical reactions, fracture formation and fracture propagation demonstrate that, in the diagenetic regime (∼50–200 °C), there are more profound interactions between these factors than assumed so far (see a review in Laubach et al. Reference Laubach, Lander, Criscenti, Anovitz, Urai, Pollyea, Hooker, Narr, Evans, Kerisit, Olson, Dewers, Fisher, Bodnar, Evans, Dove, Bonnell, Marder and Pyrak-Nolte2019).
6. Conclusions
Hydrofracturing, the process of rock failure that is primarily induced by an elevated fluid pressure, is an omnipresent tool in hydrocarbon and ore production, but also geothermal energy generation and underground storage of CO2, natural gas or nuclear waste. Here we also show that most natural extensional fractures (pure mode I or hybrid) that formed below c. 2–3 km depth on Earth can, for typical rock mechanical properties, probably only have formed as hydrofractures.
We discuss the two main approaches to assess the effect on failure of an elevated fluid pressure: the effective stress according to Terzaghi’s and Biot’s theory. The two theories are not contradictory but apply depending on the stress and/or elastic strain boundary conditions.
Initial failure can be predicted with the Mohr–Coulomb–Griffith theory and appropriate effective stresses. Systems with fractures, however, evolve after fractures first form. Depending on the rate of overpressure generation, a system may reach an equilibrium in which fractures form and provide sufficient additional permeability to drain the fluid influx that caused the overpressure. Such systems can also become highly dynamic and self-organize. This leads to fluctuations in fluid pressure and fracture activity. We discuss how the interplay between porous flow and dynamic fracture flow can result in cyclical behaviour and major fluid drainage events.
Finally, we discuss, with examples, veins and breccias that are the products of hydrofracturing. Numerical models show that patterns of veins can be indications of hydrofracturing, especially chaotic or breccia-like vein patterns. However, we also emphasize that not all veins are former fractures, for example fibrous or ‘beef’ veins.
Supplementary material
To view supplementary material for this article, please visit https://doi.org/10.1017/S0016756822001042
Acknowledgements
This study was supported by research projects PID2020-118999GB-I00 and PGC2018-093903-B-C22 (Spanish Ministry of Science and Innovation (MCIN)/State Research Agency of Spain (AEI)). HT and DC acknowledge funding by the Chinese Scholarship Council (CSC) with grant numbers 202006440101 and 202006440128, respectively. EGE acknowledges the PhD grant 2021 FI_B 00165 funded by the Generalitat de Catalunya and the European Social Fund. EGE and EGR acknowledge funding provided by the Grup Consolidat de Recerca ‘Geologia Sedimentària’ (2017SGR-824). IN wishes to acknowledge funding provided by the DAAD: German Academic Exchange Service (DAAD), Section ST32, grant nr. 91731924. DK acknowledges funding by the Bavarian Ministry of Science and Art (StMWK) funded projects ‘langfristig’ and ‘regional’ of the Geothermal Alliance Bavaria (GAB). EGR acknowledges the Ramón y Cajal Fellowship RYC2018-026335-I, funded by the Spanish Ministry of Science and Innovation (MCIN)/State Research Agency of Spain (AEI)/European Regional Development Fund (ERDF) /10.13039/501100011033. We thank our four reviewers for their abundant and constructive comments.
Declaration of interest
The authors declare none.


 Open access