


1. Introduction
Insurance companies typically operate in multiple lines of business and face different types of risks. It is important for them to evaluate the joint distribution of these different losses. Quite commonly, each type of these losses could be described by an aggregated loss model, which usually comprises two important components – loss frequency and loss size. Then, the joint distribution is a function of the interplay between the frequencies and sizes of different types of losses and the dependence among them (Wang, Reference Wang1998).
In the literature, there are several types of multivariate aggregate loss models. In one type, claim frequencies are dependent but claim sizes are independent. See for example, Hesselager (Reference Hesselager1996), Cossette et al. (Reference Cossette, Mailhot and Marceau2012), Kim et al. (Reference Kim, Jang and Pyun2019) and references therein. In another type, the claim frequency is one-dimensional, while each claim may cause multiple types of possibly dependent losses. See for example Sundt (Reference Sundt1999). Recently, models that allow dependence between claim frequencies and claim sizes have been developed. For example, in generalized linear model-based insurance pricing models such as Gschlöß l and Czado (2007) and Garrido et al. (Reference Garrido, Genest and Schulz2016), the regression of claim size includes claim count as a covariate. Alternatively, the expected values of claim frequency and claim size may depend on the same latent variables, as in Oh et al. (Reference Oh, Shi and Ahn2020).
Computing the risk measures for compound random variables, even for univariate cases, is not trivial, because the explicit formulas for the distribution functions usually do not exist. Listed below are some of the recent advances in the actuarial literature. Cossette et al. (Reference Cossette, Mailhot and Marceau2012) derived the capital allocation formulas for multivariate compound distributions under the Tail-Value-at-Risk measure, where the claim frequencies are dependent, the claim sizes are of the mixture Erlang type and mutually independent, and the claim frequency and size are independent. Kim et al. (Reference Kim, Jang and Pyun2019) derived a recursive algorithm to compute the risk measures of multivariate compound mixed Poisson models, where the Poisson-type claim frequencies depend on the same latent variables in a linear fashion. Denuit (Reference Denuit2020) derived formulas for the tail conditional expectations (TCE) of some univariate compound distributions. Denuit and Robert (Reference Denuit and Robert2021) presented some results for the TCE of a compound mixed Poisson model, where both the claim frequencies and sizes depend on several latent variables. Ren (Reference Ren2021) derived the formulas for the TCE and tail variance (TV) of multivariate compound models based on Sundt (Reference Sundt1999), where claim frequency is one-dimensional and one claim can yield multiple dependent losses.
The main goal of this paper is to present some easy-to-use formulas for computing the TCE and TV of some multivariate compound loss models, where the claim frequencies are dependent while the sizes are independent. Particularly, we study in detail the important dependence models in Hesselager (Reference Hesselager1996) and their extensions, which are widely used in the risk theory literature. See, for example, Cummins and Wiltbank (Reference Cummins and Wiltbank1983), Bermúdez (Reference Bermúdez2009), Cossette et al. (Reference Cossette, Mailhot and Marceau2012) and the references therein. We also discuss a case where the claim frequencies and sizes are dependent through a common mixing variable, following Denuit and Robert (Reference Denuit and Robert2021).
Methodologically, we apply the moment transform (which is also named as the size-biased transform) technique to our problems. The concept of moment transforms has a long history and is widely used in statistics (see, e.g., Patil and Ord Reference Patil and Ord1976; Arratia and Goldstein Reference Arratia and Goldstein2010, and the references therein). Its relevance to the study of actuarial risk measures has been exploited in the risk theory literature. For example, Furman and Landsman (Reference Furman and Landsman2005) applied the moment transform technique in computing the TCE of a portfolio of independent risks. Furman and Zitikis (Reference Furman and Zitikis2008) used it in determining TV and many other weighted risk measures. More recently, Denuit (Reference Denuit2020) applied this method in analyzing the TCE of univariate compound distributions. The concept of multivariate moment transform was studied in Denuit and Robert (Reference Denuit and Robert2021) and applied in analyzing multivariate risks. Ren (Reference Ren2021) applied this technique to study the tail risk of a multivariate compound sum introduced by Sundt (Reference Sundt1999), where the claim frequency is one-dimensional while each claim is a multidimensional random vector with dependent components.
The main contributions of this paper are summarized as follows. We first establish the relationship between the moment transform of a multivariate compound loss with those of its claim frequencies and sizes. It is shown that in many cases, the moment-transformed compound distribution can be represented by the convolution of a compound distribution, which is a mixture of some compound distributions that are in the same family of the original one, and the distribution of the moment transformed claim size. Such a representation allows us to evaluate the moment transform of a multivariate compound distribution efficiently by using either the fast Fourier transform (FFT) or recursive method, which are readily available in the literature (e.g., Hesselager Reference Hesselager1996). After deriving the moment transforms of multivariate compound distributions, we use them to evaluate the tail risks of multivariate aggregated losses and perform the associated capital allocation. Our main result also shows the effect of the distributions of claim frequencies and sizes on the tail risks of such aggregated losses. Our results generalize those in Denuit (Reference Denuit2020) and Kim et al. (Reference Kim, Jang and Pyun2019).
The remaining parts of the paper are organized as follows. Section 2 provides definitions and some preliminary results. Section 3 presents the main result for the moment transform of a general multivariate compound model with dependent claim frequencies and independent claim sizes. Section 4 studies the moment transform of the claim frequency in great detail. The case where claim frequencies and sizes are dependent is also studied. Section 5 provides numerical examples showing the risk capital allocation computation for each of the studied models.
2. Preliminaries and definitions
Suppose that an insurance company underwrites a portfolio of K types of risks. Let $\mathcal{K}=\{1,\cdots, K\}$
and for
$\mathcal{K}=\{1,\cdots, K\}$
and for $k\in \mathcal{K}$
, let
$k\in \mathcal{K}$
, let $N_k$
denote the number of type k claims. Let
$N_k$
denote the number of type k claims. Let $ \mathbf{N}=(N_1, \cdots, N_K)$
, whose joint probability function is denoted by
$ \mathbf{N}=(N_1, \cdots, N_K)$
, whose joint probability function is denoted by
 \begin{equation*}p_{\mathbf{N}}(\mathbf{n})=\Pr[(N_1, \cdots, N_K)=(n_1, \cdots,n_K)].\end{equation*}
For $k\in \mathcal{K}$
, let
$k\in \mathcal{K}$
, let
 \begin{equation*}{S}_{N_k}= \sum_{i=1}^{N_k} {X}_{k,i},\end{equation*}
where ${X}_{k,i}, i=1, 2, \cdots, N_k,$
are i.i.d. random variables representing the size of a type k claim. They are assumed to have cumulative distribution function
${X}_{k,i}, i=1, 2, \cdots, N_k,$
are i.i.d. random variables representing the size of a type k claim. They are assumed to have cumulative distribution function $F_{X_k}$
. Loss size variables of different types are mutually independent and independent of
$F_{X_k}$
. Loss size variables of different types are mutually independent and independent of $\mathbf{N}$
.
$\mathbf{N}$
.
Let
 \begin{equation} \mathbf{S}_{\mathbf{N}}= (S_{N_1},\cdots, S_{N_K})\end{equation}
denote the multivariate aggregate loss and
 \begin{equation*}S_{\bullet}= \sum_{k=1}^{K} S_{N_k}\end{equation*}
denote the total amount of all K types of claims.
In this paper, we study the following risk measures of $\mathbf{S}_{\mathbf{N}}$
:
$\mathbf{S}_{\mathbf{N}}$
:
The multivariate tail expectation (MTCE) of $\mathbf{S}_{\mathbf{N}}$
at some level
$\mathbf{s}_{q}$
, which is defined by (see Landsman et al., Reference Landsman, Makov and Shushi2018) (2.2)where
\begin{equation} \text{MTCE}_{\mathbf{S}_{\mathbf{N}}}(\mathbf{s}_{q}) = \mathbb{E}[\mathbf{S}_{\mathbf{N}} |\mathbf{S}_{\mathbf{N}} > \mathbf{s}_{q}], \end{equation}
$\mathbf{s}_q = (s_{q_1}, \cdots, s_{q_K})$
and the expectation operation is taken to be element-wise.
$\mathbf{S}_{\mathbf{N}}$
at some level
$\mathbf{s}_{q}$
, which is defined by (see Landsman et al., Reference Landsman, Makov and Shushi2018) (2.2)where
\begin{equation} \text{MTCE}_{\mathbf{S}_{\mathbf{N}}}(\mathbf{s}_{q}) = \mathbb{E}[\mathbf{S}_{\mathbf{N}} |\mathbf{S}_{\mathbf{N}} > \mathbf{s}_{q}], \end{equation}
$\mathbf{s}_q = (s_{q_1}, \cdots, s_{q_K})$
and the expectation operation is taken to be element-wise.
The multivariate tail covariance (MTCOV) of
$\mathbf{S}_{\mathbf{N}}$
at some level
$\mathbf{s}_{q}$
, which is defined by (2.3)
\begin{align} \text{MTCOV}_{\mathbf{S}_{\mathbf{N}}}(\mathbf{s}_q) & = \mathbb{E}[(\mathbf{S}_{\mathbf{N}}-\text{MTCE}_{\mathbf{S}_{\mathbf{N}}}(\mathbf{s}_q))(\mathbf{S}_{\mathbf{N}}-\text{MTCE}_{\mathbf{S}_{\mathbf{N}}}(\mathbf{s}_q))^\top |\mathbf{S}_{\mathbf{N}} > \mathbf{s}_q].\nonumber \\ & \end{align}


MTCE and MTCOV are multivariate extensions of univariate risk measures TCE and TV. They provide important information of the expected values and the variance––covariance dependence structure of the tail of a vector of dependent variables. Their properties are studied in Landsman et al. (Reference Landsman, Makov and Shushi2018).
To manage their insolvency risks, insurance companies are required to hold certain amount of capital, which is available to pay the claims arising from the adverse development of one or several types of risks. In order to measure and compare the different types of risks, it is important to determine how much capital should be assigned to each of them. Therefore, a capital allocation methodology is needed (Cummins, Reference Cummins2000). Methods for determining capital requirement and allocation have been studied extensively in the insurance/actuarial science literature. For more detailed discussions of such methods, one could refer to, for example, Cummins (Reference Cummins2000), Dhaene et al. (Reference Dhaene, Henrard, Landsman, Vandendorpe and Vanduffel2008), Furman and Landsman (Reference Furman and Landsman2008) and references therein. Since this paper focuses on tail risk measures such as TCE and TV, we apply the TCE- and TV-based capital allocation methods, which are described briefly in the following.
According to the TCE-based capital allocation rule, the capital required for the type k risk is given by
 \begin{equation} \text{TCE}_{S_{N_k}|S_{\bullet}}(s_q)=\mathbb{E}[S_{N_k}|S_{\bullet}>s_q], \quad k \in \mathcal{K}.\end{equation}
It is straightforward that
 \begin{equation*}\sum_{k=1}^{K}\text{TCE}_{S_{N_k}|S_{\bullet}}(s_q)= \mathbb{E}[S_\bullet|S_\bullet>s_q]= \text{TCE}_{S_\bullet}(s_q),\end{equation*}
where $\text{TCE}_{S_\bullet}(s_q)$
is a commonly used criterion for determining the total capital requirement.
$\text{TCE}_{S_\bullet}(s_q)$
is a commonly used criterion for determining the total capital requirement.
Likewise, according to the TV-based capital allocation rule, the capital required for the type $k\in \mathcal{K}$
risk is given by
$k\in \mathcal{K}$
risk is given by
 \begin{equation} \text{TV}_{S_{N_k}|S_{\bullet}}(s_q)= \text{Cov} [(S_{N_k},S_{\bullet})|S_\bullet>s_q],\end{equation}
which satisfies
 \begin{equation*}\sum_{k=1}^{K}\text{TV}_{S_{N_k}|S_{\bullet}}(s_q)= \text{Var}[S_\bullet|S_\bullet>s_q]= \text{TV}_{S_\bullet}(s_q),\end{equation*}
where $\text{TV}_{S_\bullet}(s_q)$
is another commonly used criterion for determining total capital requirement. It is worth pointing out that
$\text{TV}_{S_\bullet}(s_q)$
is another commonly used criterion for determining total capital requirement. It is worth pointing out that $\text{TV}_{S_{N_k}|S_{\bullet}}(s_q)$
can be computed through the quantities
$\text{TV}_{S_{N_k}|S_{\bullet}}(s_q)$
can be computed through the quantities
 \begin{equation} Cov[(S_{N_{k_1}},S_{N_{k_2}} )|S_{\bullet}>s_q], \quad k_1, k_2 \in \mathcal{K},\end{equation}
for which we will provide formulas in this paper.
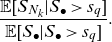
Sometimes, the total capital is set exogenously by regulators or internal managers and may not necessarily be the TCE/TV of the sum $S_\bullet$
. The TCE/TV allocation rule can still be applied if tail risk is of the main concern. For example, with TCE allocation rule, the proportion of the total capital allocated to the type k risk can be determined by
$S_\bullet$
. The TCE/TV allocation rule can still be applied if tail risk is of the main concern. For example, with TCE allocation rule, the proportion of the total capital allocated to the type k risk can be determined by
 \begin{equation*}\frac{\mathbb{E} [S_{N_k}|S_{\bullet} > s_q]}{\mathbb{E} [S_{\bullet}|S_{\bullet} > s_q]}.\end{equation*}
This ratio is computed in Section 5 for the specific models studied in this paper.
In the following sections, we develop methods to compute the MTCE and MTCOV of $\mathbf{S}_{\mathbf{N}}$
, and the associated quantities for capital allocation. We do this by utilizing the moment transform of the random vector
$\mathbf{S}_{\mathbf{N}}$
, and the associated quantities for capital allocation. We do this by utilizing the moment transform of the random vector $\mathbf{S}_{\mathbf{N}}$
. For this purpose, we next introduce some definitions and preliminary results for moment transforms (see also Patil and Ord, Reference Patil and Ord1976).
$\mathbf{S}_{\mathbf{N}}$
. For this purpose, we next introduce some definitions and preliminary results for moment transforms (see also Patil and Ord, Reference Patil and Ord1976).
Definition 2.1. Let X be a non-negative random variable with distribution function $F_X$
and moment
$F_X$
and moment $\mathbb{E}[X^\alpha]<\infty$
for some positive integer
$\mathbb{E}[X^\alpha]<\infty$
for some positive integer $\alpha$
. A random variable
$\alpha$
. A random variable $\tilde{X}^{[\alpha]}$
is said to be a copy of the
$\tilde{X}^{[\alpha]}$
is said to be a copy of the $\alpha$
th moment transform of X if its cumulative distribution function (c.d.f.) is given by
$\alpha$
th moment transform of X if its cumulative distribution function (c.d.f.) is given by
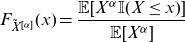 \begin{eqnarray} F_{\tilde{X}^{[\alpha]}}(x) = \frac{\mathbb{E}[X^{\alpha} \mathbb{I}(X\le x)]}{\mathbb{E}[X^{\alpha}]} \end{eqnarray}
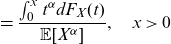 \begin{eqnarray*} =\frac{\int_0^x {t^{\alpha} d F_X(t)}}{\mathbb{E}[X^{\alpha}]}, \quad x>0 \end{eqnarray*}
The first moment transform of X is simply denoted as $\tilde{X}$
.
$\tilde{X}$
.
Definition 2.2. Let $\mathbf{X}=(X_1,\cdots, X_K)$
be a random vector with distribution function
$\mathbf{X}=(X_1,\cdots, X_K)$
be a random vector with distribution function $F_{\mathbf{X}}$
and moments
$F_{\mathbf{X}}$
and moments $\mathbb{E}[X_{k}^{\alpha}]<\infty$
and
$\mathbb{E}[X_{k}^{\alpha}]<\infty$
and $\mathbb{E}[X_{k_1}^{\alpha_1}X_{k_2}^{\alpha_2}]<\infty$
for some
$\mathbb{E}[X_{k_1}^{\alpha_1}X_{k_2}^{\alpha_2}]<\infty$
for some $k, k_1,k_2\in \{1,\cdots, K\}$
and positive integers
$k, k_1,k_2\in \{1,\cdots, K\}$
and positive integers $\alpha$
,
$\alpha$
, $\alpha_1$
and
$\alpha_1$
and $\alpha_2$
.
$\alpha_2$
.
The kth component $\alpha$
th moment transform of
$\alpha$
th moment transform of $\mathbf{X}$
is any random vector
$\mathbf{X}$
is any random vector $\widehat{\mathbf{X}}^{[k^{[\alpha]}]}$
with c.d.f.
$\widehat{\mathbf{X}}^{[k^{[\alpha]}]}$
with c.d.f.
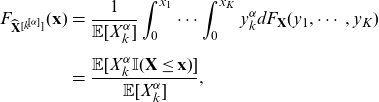 \begin{eqnarray} F_{\widehat{\mathbf{X}}^{[k^{[\alpha]}]}} (\mathbf{x}) &=& \frac{1}{\mathbb{E}[X_{k}^{\alpha}]}\int_0^{x_1} \cdots \int_0^{x_K}{y_{k}^{\alpha} d F_{\mathbf{X}} (y_1,\cdots, y_K)}\nonumber\\[5pt] &=&\frac{\mathbb{E}[X_{k}^{\alpha} \mathbb{I} (\mathbf{X} \le \mathbf{x})] }{\mathbb{E}[X_{k}^{\alpha}]}, \end{eqnarray}
where $\mathbf{x}=(x_1,\cdots,x_K)$
. The kth component first moment transform of
$\mathbf{x}=(x_1,\cdots,x_K)$
. The kth component first moment transform of $\mathbf{X}$
is denoted as
$\mathbf{X}$
is denoted as $\hat{\mathbf{X}}^{[k]}$
.
$\hat{\mathbf{X}}^{[k]}$
.
The $(k_1,k_2)$
th component
$(k_1,k_2)$
th component $(\alpha_1,\alpha_2)$
th moment transform of
$(\alpha_1,\alpha_2)$
th moment transform of $\mathbf{X}$
is any random vector
$\mathbf{X}$
is any random vector $\widehat{\mathbf{X}}^{[k_1^{[\alpha_1]},k_2^{[\alpha_2]}]}$
with c.d.f.
$\widehat{\mathbf{X}}^{[k_1^{[\alpha_1]},k_2^{[\alpha_2]}]}$
with c.d.f.
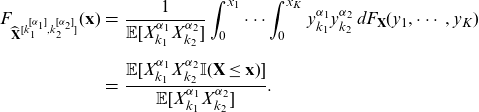 \begin{eqnarray} F_{\widehat{\mathbf{X}}^{[k_1^{[\alpha_1]},k_2^{[\alpha_2]}]}} (\mathbf{x}) &=& \frac{1}{\mathbb{E}[X_{k_1}^{\alpha_1}X_{k_2}^{\alpha_2}]}\int_0^{x_1} \cdots \int_0^{x_K}{y_{k_1}^{\alpha_1}y_{k_2}^{\alpha_2} \, d F_{\mathbf{X}} (y_1,\cdots, y_K)}\nonumber\\[5pt] &=&\frac{\mathbb{E}[X_{k_1}^{\alpha_1}X_{k_2}^{\alpha_2} \mathbb{I} (\mathbf{X} \le \mathbf{x})] }{\mathbb{E}[X_{k_1}^{\alpha_1}X_{k_2}^{\alpha_2}]}. \end{eqnarray}
The $(k_1,k_2)$
th component, (1,1)th moment transform of
$(k_1,k_2)$
th component, (1,1)th moment transform of $\mathbf{X}$
is denoted as
$\mathbf{X}$
is denoted as $\widehat{\mathbf{X}}^{[{k_1,k_2}]}$
.
$\widehat{\mathbf{X}}^{[{k_1,k_2}]}$
.
Remark 2.1. We have used the symbol $\tilde{X}$
to denote the moment transform of a univariate variable X and
$\tilde{X}$
to denote the moment transform of a univariate variable X and $\hat{\mathbf{X}}$
for the moment transform of a multivariate variable
$\hat{\mathbf{X}}$
for the moment transform of a multivariate variable $\mathbf{X}$
. In the sequel, we denote
$\mathbf{X}$
. In the sequel, we denote $\widehat{\mathbf{X}}^{[k^{[\alpha]}]}=(\widehat{{X}}_1^{[k^{[\alpha]}]}, \cdots, \widehat{{X}}_K^{[k^{[\alpha]}]})$
. In particular,
$\widehat{\mathbf{X}}^{[k^{[\alpha]}]}=(\widehat{{X}}_1^{[k^{[\alpha]}]}, \cdots, \widehat{{X}}_K^{[k^{[\alpha]}]})$
. In particular, $\widehat{{X}}_i^{[k]}$
denotes the ith element of
$\widehat{{X}}_i^{[k]}$
denotes the ith element of $\widehat{\mathbf{X}}^{[k]}$
, which is the kth component first moment transform of the random vector
$\widehat{\mathbf{X}}^{[k]}$
, which is the kth component first moment transform of the random vector $\mathbf{X}$
. It is not to be confused with
$\mathbf{X}$
. It is not to be confused with $\widetilde{{X}_i}^{[\alpha]}$
, which stands for the
$\widetilde{{X}_i}^{[\alpha]}$
, which stands for the $\alpha$
th moment transform of a univariate random variable
$\alpha$
th moment transform of a univariate random variable $X_i$
. The same convention applies to other components or moment transforms.
$X_i$
. The same convention applies to other components or moment transforms.
For discrete distributions, we work with factorial moment transform (Patil and Ord, Reference Patil and Ord1976). To this end, for some integers I and $\alpha$
, we define
$\alpha$
, we define
 \begin{equation*}I^{(\alpha)}=\left\{\begin{array}{l@{\quad}l}I(I-1)\cdots (I-\alpha+1), & \text{if}\ \alpha \le I,\\[5pt]0, & \text{other cases}.\end{array}\right.\end{equation*}
Definition 2.3. Let N be a discrete random variable having probability mass function $p_N(n)$
for
$p_N(n)$
for $n\ge 0$
. A random variable
$n\ge 0$
. A random variable $\tilde{N}^{[(\alpha)]}$
is said to be a copy of the
$\tilde{N}^{[(\alpha)]}$
is said to be a copy of the $\alpha$
th factorial moment transform of N if its probability mass function is given by
$\alpha$
th factorial moment transform of N if its probability mass function is given by
 \begin{equation} p_{\tilde{N}^{[(\alpha)]}}(n)=\frac {\mathbb{E}[N^{(\alpha)} \mathbb{I}(N=n)]}{\mathbb{E}[N^{(\alpha)}]} =\frac {n^{(\alpha)} p_N(n)}{\mathbb{E}[N^{(\alpha)}]}, \quad n\ge 0. \end{equation}
In the sequel, we denote the first factorial moment transform of N by $\tilde{N}$
.
$\tilde{N}$
.
Definition 2.4. Let $\mathbf{N}= (N_1,\cdots, N_K)$
be a vector of discrete random variables having probability mass function
$\mathbf{N}= (N_1,\cdots, N_K)$
be a vector of discrete random variables having probability mass function $p_{\mathbf{N}}(\mathbf{n})$
. A random vector
$p_{\mathbf{N}}(\mathbf{n})$
. A random vector $\hat{\mathbf{N}}^{[k^{[(\alpha)]}]}$
is said to be a copy of the kth component
$\hat{\mathbf{N}}^{[k^{[(\alpha)]}]}$
is said to be a copy of the kth component $\alpha$
th factorial moment transform of
$\alpha$
th factorial moment transform of $\mathbf{N}$
if its probability mass function is given by
$\mathbf{N}$
if its probability mass function is given by
 \begin{equation} p_{\hat{\mathbf{N}}^{[k^{[(\alpha)]}]}}(\mathbf{n})=\frac {\mathbb{E}[N_k^{(\alpha)} \mathbb{I}(\mathbf{N}=\mathbf{n})]}{\mathbb{E}[N_k^{(\alpha)}]} =\frac {n_k^{(\alpha)} p_{\mathbf{N}}(\mathbf{n})}{\mathbb{E}[N_k^{(\alpha)}]}, \quad \mathbf{n}\ge \mathbf{0}.\end{equation}
The kth component first moment transform of $\mathbf{N}$
is denoted as
$\mathbf{N}$
is denoted as $\hat{\mathbf{N}}^{[k]}$
.
$\hat{\mathbf{N}}^{[k]}$
.
A random vector $\hat{\mathbf{N}}^{[k_1^{[(\alpha_1)]}, k_2^{[(\alpha_2)]}]}$
is said to be a copy of the
$\hat{\mathbf{N}}^{[k_1^{[(\alpha_1)]}, k_2^{[(\alpha_2)]}]}$
is said to be a copy of the $(k_1,k_2)$
th component
$(k_1,k_2)$
th component $(\alpha_1,\alpha_2)$
th order factorial moment transform of
$(\alpha_1,\alpha_2)$
th order factorial moment transform of $\mathbf{N}$
if its probability mass function is given by
$\mathbf{N}$
if its probability mass function is given by
 \begin{equation} p_{\hat{\mathbf{N}}^{[k_1^{[(\alpha_1)]},k_2^{[(\alpha_2)]}]}}(\mathbf{n})=\frac {\mathbb{E}[N_{k_1}^{(\alpha_1)} N_{k_2}^{(\alpha_2)} \mathbb{I}(\mathbf{N}=\mathbf{n})]}{\mathbb{E}[N_{k_1}^{(\alpha_1)} N_{k_2}^{(\alpha_2)}]} =\frac {n_{k_1}^{(\alpha_1)} n_{k_2}^{(\alpha_2)} p_{\mathbf{N}}(\mathbf{n})}{\mathbb{E}[N_{k_1}^{(\alpha_1)} N_{k_2}^{(\alpha_2)}]}, \quad \mathbf{n}\ge \mathbf{0}.\end{equation}
The reason why we work with the factorial moment transforms for the discrete distributions is that they have simple representations in many cases. See, for example, Table 2 of Patil and Ord (Reference Patil and Ord1976).
The relationship between risk measures such as TCE and TV and the moment transform of random variables has been studied extensively in the literature. In particular, the relationship
 \begin{equation} \mathbb{E} [X^\alpha|X>x] = \mathbb{E}[X^\alpha] \frac{\Pr(\tilde{X}^{[\alpha]}>x)}{\Pr(X>x)} \end{equation}
has been introduced and utilized in, for example, Furman and Landsman (Reference Furman and Landsman2005), Furman and Zitikis (Reference Furman and Zitikis2008), Denuit (Reference Denuit2020), and the references therein.
In the multivariate case, the MTCE and MTCOV of a random vector $\mathbf{X}=(X_1, \cdots, X_K)$
are related to its multivariate moment transform. We state the results in the following.
$\mathbf{X}=(X_1, \cdots, X_K)$
are related to its multivariate moment transform. We state the results in the following.
Lemma 2.1. Let $\mathcal{K} = \{1,2,\cdots, K\}$
,
$\mathcal{K} = \{1,2,\cdots, K\}$
, $\mathbf{X}=(X_1,\cdots, X_K)$
and
$\mathbf{X}=(X_1,\cdots, X_K)$
and $X_{\bullet}=\sum_{i=1}^{K} X_i$
, we have
$X_{\bullet}=\sum_{i=1}^{K} X_i$
, we have
-
(i) For
$k \in \mathcal{K}$
and
$\alpha\ge 1$
, (2.14)
\begin{equation} \mathbb{E} [X_k^\alpha | \mathbf{X} >\mathbf{x}] = \mathbb{E}[X_k^\alpha] \frac{\Pr\left(\hat{\mathbf{X}}^{[k^{[\alpha]}]}>\mathbf{x}\right)}{\Pr(\mathbf{X} >\mathbf{x})}.\end{equation}
-
(ii) For
$k_1, k_2 \in \mathcal{K}$
and
$\alpha_1, \alpha_2\ge 1$
, (2.15)
\begin{equation} \mathbb{E} [X_{k_1}^{\alpha_1} X_{k_2}^{\alpha_2} | \mathbf{X} >\mathbf{x}] = \mathbb{E}[X_{k_1}^{\alpha_1}X_{k_2}^{\alpha_2}] \frac{\Pr\left(\hat{\mathbf{X}}^{[k_1^{[\alpha_1]}, k_2^{[\alpha_2]}]}>\mathbf{x}\right)}{\Pr(\mathbf{X} >\mathbf{x})}.\end{equation}
-
(iii) For
$k_1, k_2 \in \mathcal{K}$
and
$\alpha_1, \alpha_2\ge 1$
, (2.16)where
\begin{equation} \mathbb{E} [X_{k_1}^{\alpha_1} X_{k_2}^{\alpha_2} | X_{\bullet} >x] = \mathbb{E}[X_{k_1}^{\alpha_1}X_{k_2}^{\alpha_2}] \frac{\Pr\left(\hat{X}_{\bullet}^{[k_1^{[\alpha_1]}, k_2^{[\alpha_2]}]}>{x}\right)}{\Pr(X_{\bullet} >x)},\end{equation}
and
\begin{equation*}\hat{X}_{\bullet}^{[k_1^{[\alpha_1]}, k_2^{[\alpha_2]}]} = \sum_{k=1}^K \hat{X}_k^{[k_1^{[\alpha_1]}, k_2^{[\alpha_2]}]}\end{equation*}
$\hat{X}_k^{[k_1^{[\alpha_1]}, k_2^{[\alpha_2]}]}$
is the kth element of
$\;\hat{\mathbf{X}}^{[k_1^{[\alpha_1]}, k_2^{[\alpha_2]}]}$
.


Proof. Statements (i) and (ii) are the direct results of Definition 2.2 of moment transforms. Statement (iii) is similar to Proposition 3.1 of Denuit and Robert (Reference Denuit and Robert2021), to which we refer the readers for more details.
With Lemma 2.1, we are ready to study the tail risk measures of the compound sum vector $\mathbf{S}_{\mathbf{N}}$
through its moment transforms.
$\mathbf{S}_{\mathbf{N}}$
through its moment transforms.
3. Evaluation of the tail risk measures of multivariate compound variables via moment transforms
In this section, we derive the explicit formulas for moment transforms of the compound sum vector $\mathbf{S}_{\mathbf{N}}$
. These formulas not only unveil the relationships between the moment transforms of
$\mathbf{S}_{\mathbf{N}}$
. These formulas not only unveil the relationships between the moment transforms of $\mathbf{S}_{\mathbf{N}}$
and those of
$\mathbf{S}_{\mathbf{N}}$
and those of $\mathbf{N}$
and
$\mathbf{N}$
and $X_k$
(for some
$X_k$
(for some $k\in\mathcal{K}$
) but also provide a method to compute the MTCE and MTCOV of
$k\in\mathcal{K}$
) but also provide a method to compute the MTCE and MTCOV of $\mathbf{S}_{\mathbf{N}}$
and to perform capital allocations (Equations (2.2)–(2.6)).
$\mathbf{S}_{\mathbf{N}}$
and to perform capital allocations (Equations (2.2)–(2.6)).
We first assume that $\mathbf{N}$
is a non-random vector, that is
$\mathbf{N}$
is a non-random vector, that is $\mathbf{N}=\mathbf{n}=(n_1,\cdots, n_K)$
. For
$\mathbf{N}=\mathbf{n}=(n_1,\cdots, n_K)$
. For $k\in \mathcal{K}$
, let
$k\in \mathcal{K}$
, let
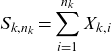 \begin{equation*}S_{k,n_k}=\sum_{i=1}^{n_k} X_{k,i}\end{equation*}
and
 \begin{equation*}\mathbf{S}_{\mathbf{n}}=(S_{1,n_1}, S_{2,n_2}, \cdots, S_{K,n_K}).\end{equation*}
Then by the results in Furman and Landsman (Reference Furman and Landsman2005) or Lemmas 2.1 and 2.2 of Ren (Reference Ren2021), for a positive integer $\alpha$
such that
$\alpha$
such that $\mathbb{E}[X_k^\alpha]<\infty$
, we have for
$\mathbb{E}[X_k^\alpha]<\infty$
, we have for $i\in(1,\cdots, n_k)$
that
$i\in(1,\cdots, n_k)$
that
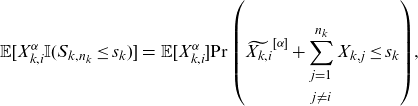 \begin{eqnarray} \mathbb{E}[X_{k,i}^\alpha \mathbb{I}(S_{k,n_k}\le s_k)]&=& \mathbb{E}[X_{k,i}^\alpha] {\Pr\left(\widetilde{X_{k,i}}^{[\alpha]}+\sum_{\substack{j=1 \\[5pt] j\neq i}}^{n_k} X_{k,j}\le s_k\right)},\end{eqnarray}
where all the variables in the parenthesis are mutually independent. Because $X_{k,i}$
’s are assumed to be i.i.d., we have
$X_{k,i}$
’s are assumed to be i.i.d., we have
 \begin{eqnarray} \mathbb{E}[S_{k,n_k} \mathbb{I}(S_{k,n_k}\le s_k)]&=& n_k \mathbb{E}[X_{k,1}] {\Pr\left(\widetilde{X_{k,1}}+\sum_{\substack{j=2}}^{n_k} X_{k,j}\le s_k\right)},\end{eqnarray}
and
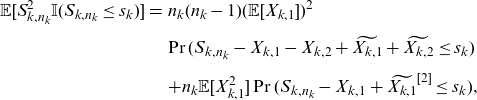 \begin{eqnarray} \mathbb{E}[S_{k,n_k}^2 \mathbb{I}(S_{k,n_k}\le s_k)]&=& n_k(n_k-1) (\mathbb{E}[X_{k,1}])^2 \nonumber \\[5pt] && {\Pr(S_{k,n_k}-X_{k,1}-X_{k,2}+\widetilde{X_{k,1}}+\widetilde{X_{k,2}}\le s_k)} \nonumber\\[5pt] \qquad &&+ n_k \mathbb{E}[X_{k,1}^2]\Pr(S_{k,n_k}-X_{k,1}+\widetilde{X_{k,1}}^{[2]}\le s_k),\end{eqnarray}
where all the variables in the parenthesis are mutually independent.
Since $\{S_{k,n_k}\}_{k=1,\cdots, K}$
are mutually independent, we have
$\{S_{k,n_k}\}_{k=1,\cdots, K}$
are mutually independent, we have
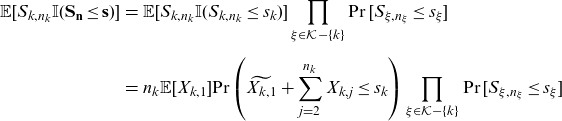 \begin{eqnarray} \mathbb{E}[S_{k,n_k} \mathbb{I}(\mathbf{S}_{\mathbf{n}}\le \mathbf{s})] &=& \mathbb{E}[S_{k,n_k} \mathbb{I}(S_{k,n_k}\le s_k)] \prod_{\xi \in \mathcal{K}-\{k\}} \Pr[S_{\xi,n_\xi}\le s_\xi]\nonumber \\[5pt] &=& n_k \mathbb{E}[X_{k,1}] {\Pr\left(\widetilde{X_{k,1}}+\sum_{j=2}^{n_k} X_{k,j}\le s_k\right)} \prod_{\xi\in \mathcal{K}-\{k\}} \Pr[S_{\xi,n_\xi}\le s_\xi] \nonumber \\[5pt] && \end{eqnarray}
and
 \begin{eqnarray} \mathbb{E}[S_{k,n_{k}}^2 \mathbb{I}(\mathbf{S}_{\mathbf{n}}\le \mathbf{s})] &=& \mathbb{E}[S_{k,n_{k}}^2 \mathbb{I}(S_{k,n_{k}}\le s_{k})] \prod_{\xi \in \mathcal{K}-\{k\}} \Pr[S_{\xi,n_\xi}\le s_\xi], \end{eqnarray}
where the first term on the right side is given in (3.3).
Further, for $k_i,k_j \in \mathcal{K}$
,
$k_i,k_j \in \mathcal{K}$
,
 \begin{eqnarray*} &&\mathbb{E}[S_{k_i,n_{k_i}} S_{k_j,n_{k_j}} \mathbb{I}(\mathbf{S}_{\mathbf{n}}\le \mathbf{s})] \nonumber\\[5pt] &=& \mathbb{E}[S_{k_i,n_{k_i}} \mathbb{I}(S_{k_i,n_{k_i}}\le s_{k_i})] \mathbb{E}[S_{k_j,n_{k_j}} \mathbb{I}(S_{k_j,n_{k_j}}\le s_{k_j})] \prod_{\xi \in \mathcal{K}-\{k_i,k_j\}} \Pr[S_{\xi,n_\xi}\le s_\xi] \end{eqnarray*}
 \begin{eqnarray}&=& n_{k_i} n_{k_j} \mathbb{E}[X_{k_i,1}]\mathbb{E}[X_{k_j,1}] {\prod_{\xi \in \{k_i,k_j\}}\!\Pr\!\left(\!\widetilde{X_{\xi,1}}+\sum_{j=2}^{n_{\xi}} X_{\xi,j}\le s_{\xi}\!\!\right)} \!\prod_{\xi \in \mathcal{K}-\{k_i,k_j\}} \!\!\Pr[S_{\xi,n_\xi}\le s_\xi], \nonumber \\[5pt] && \end{eqnarray}
where all the variables in the parenthesis are mutually independent.
Now we are ready to present the results for the moment transforms of the compound sum vector $\mathbf{S}_{\mathbf{N}}$
.
$\mathbf{S}_{\mathbf{N}}$
.
Theorem 3.1. For $k\in \mathcal{K}$
, let
$k\in \mathcal{K}$
, let $\mathbf{1}^{[k]}$
denote a K dimensional vector with kth element being one and all others are zero. Let
$\mathbf{1}^{[k]}$
denote a K dimensional vector with kth element being one and all others are zero. Let
 \begin{equation*}\mathbf{L}^{[k]}= \hat{\mathbf{N}}^{[k]}- \mathbf{1}^{[k]},\end{equation*}
whose ith element is denoted by ${L}_i^{[k]}$
and
${L}_i^{[k]}$
and
 \begin{equation*}\mathbf{S}_{\mathbf{L}^{[k]}}=\left(\sum_{j=1}^{{L}_i^{[k]}} X_{i,j}, i\in \mathcal{K}\right),\end{equation*}
then
 \begin{equation} \widehat{\mathbf{S}_{\mathbf{N}}}^{[k]} \stackrel{d}{=} \mathbf{S}_{\mathbf{L}^{[k]}} + \widetilde{X_{k,1}} \times \mathbf{1}^{[k]}. \end{equation}
Further, let
 \begin{equation} \mathbf{L}^{[k^{[2]}]}= \hat{\mathbf{N}}^{[k^{[(2)]}]}- 2 \times \mathbf{1}^{[k]}, \end{equation}
then
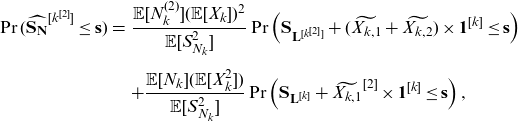 \begin{eqnarray} \Pr(\widehat{\mathbf{S}_{\mathbf{N}}}^{[k^{[2]}]}\le \mathbf{s}) &=& \frac{\mathbb{E}[N_k^{(2)}](\mathbb{E}[X_k])^2}{\mathbb{E}[S_{N_k}^{2}]} \Pr\left(\mathbf{S}_{\mathbf{L}^{[k^{[2]}]}} + (\widetilde{X_{k,1}}+\widetilde{X_{k,2}}) \times \mathbf{1}^{[k]}\le \mathbf{s}\right)\nonumber\\[5pt] &&+ \frac{\mathbb{E}[N_k](\mathbb{E}[X_k^2])}{\mathbb{E}[S_{N_k}^{2}]} \Pr\left({\mathbf{S}_{\mathbf{L}^{[k]}} + \widetilde{X_{k,1}}^{[2]}\times \mathbf{1}^{[k]}}\le \mathbf{s}\right), \end{eqnarray}
where $\widetilde{X_{k,1}}$
and
$\widetilde{X_{k,1}}$
and $\widetilde{X_{k,2}}$
are two independent copies of the first moment transform of
$\widetilde{X_{k,2}}$
are two independent copies of the first moment transform of ${X_{k}}$
and
${X_{k}}$
and $\widetilde{X_{k,1}}^{[2]}$
is a copy of the second moment transform of
$\widetilde{X_{k,1}}^{[2]}$
is a copy of the second moment transform of ${X_{k}}$
. All random variables in the above are mutually independent.
${X_{k}}$
. All random variables in the above are mutually independent.
In addition, for $k_1\ne k_2\in \mathcal{K}$
let
$k_1\ne k_2\in \mathcal{K}$
let
 \begin{equation} \mathbf{L}^{[k_1,k_2]}= \hat{\mathbf{N}}^{[k_1,k_2]}- \mathbf{1}^{[k_1]}-\mathbf{1}^{[k_2]}, \end{equation}
then
 \begin{equation} \widehat{\mathbf{S}_{\mathbf{N}}}^{[k_1,k_2]} \stackrel{d}{=} \mathbf{S}_{\mathbf{L}^{[k_1,k_2]}} + \widetilde{X_{k_1,1}} \times \mathbf{1}^{[k_1]} +\widetilde{X_{k_2,1}} \times \mathbf{1}^{[k_2]}. \end{equation}
Proof. The proof of the above three statements is similar. We next prove statement (3.9).
Firstly, by the law of total probability,
 \begin{equation*} \mathbb{E} [S_{N_k}^2 \mathbb{I}(\mathbf{S}_{\mathbf{N}}\le \mathbf{s})]=\sum_{\mathbf{n}\in (\mathbb{Z}^+)^K} p_{\mathbf{N}}(\mathbf{n}) \mathbb{E}[S_{k,n_k}^2 \mathbb{I}(\mathbf{S}_{\mathbf{N}}\le \mathbf{s})], \end{equation*}
which after applying (3.5) becomes
 \begin{eqnarray*} &&\mathbb{E} [S_{N_k}^2 \mathbb{I}(\mathbf{S}_{\mathbf{N}}\le \mathbf{s})] \nonumber\\[8pt] &=& \sum_{\mathbf{n}\in (\mathbb{Z}^+)^K} p_{\mathbf{N}}(\mathbf{n}) \left( n_k(n_k-1) (\mathbb{E}[X_{k,1}])^2 \Pr\left(\widetilde{X_{k,1}}+\widetilde{X_{k,2}}+\sum_{j=3}^{n_k}X_{k,j} \right. \right. \nonumber \\[8pt] && \left. \left. \le s_k, \sum_{j=1}^{{n_m}}X_{m,j} \le s_m, m\in \mathcal{K}-\{k\}\right)\right. \nonumber\\[8pt] & & \quad \left. +n_k \mathbb{E}[X_{k,1}^2]\Pr\left(\widetilde{X_{k,1}}^{[2]}+\sum_{j=2}^{n_k}X_{k,j} \le s_k, \sum_{j=1}^{{n_m}}X_{m,j}\le s_m, m\in \mathcal{K}-\{k\}\right) \right) \nonumber\\[8pt] &=& \mathbb{E}[N_k^{(2)}] (\mathbb{E}[X_{k,1}])^2 \Pr\left(\widetilde{X_{k,1}}+\widetilde{X_{k,2}}+\sum_{j=1}^{\hat{N}_k^{[k^{[(2)]}]}-2}X_{k,j} \right. \nonumber \\[8pt] &&\left. \le s_k, \sum_{j=1}^{\hat{N}_m^{[k^{[(2)]}]}} X_{m,j}\le s_m, m\in \mathcal{K}-\{k\}\right) \nonumber\\[8pt] & & \quad + \mathbb{E}[N_k]\mathbb{E}[X_{k,1}^2]\Pr\left(\widetilde{X_{k,1}}^{[2]}+\sum_{j=1}^{\hat{N}_k^{[k]}-1} X_{k,j} \le s_k, \sum_{j=1}^{{\hat{N}_m}^{[k]}}X_{m,j}\le s_m, m\in \mathcal{K}-\{k\}\right). \nonumber \end{eqnarray*}
Dividing both sides of the above by $\mathbb{E}[S_{N_k}^2]$
and making use the definitions of
$\mathbb{E}[S_{N_k}^2]$
and making use the definitions of $\mathbf{L}^{[k]}$
and
$\mathbf{L}^{[k]}$
and $\mathbf{L}^{[k^{[2]}]}$
leads to (3.9).
$\mathbf{L}^{[k^{[2]}]}$
leads to (3.9).
Similarly, applying the law of total probability to Equations (3.4) and (3.6) respectively yields
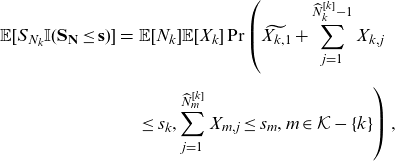 \begin{eqnarray} \mathbb{E}[S_{N_k} \mathbb{I}(\mathbf{S}_{\mathbf{N}}\le \mathbf{s})] &=& \mathbb{E}[N_k]\mathbb{E}[X_k] \Pr\left(\widetilde{X_{k,1}}+\sum_{j=1}^{\widehat{N}_k^{[k]}-1} X_{k,j} \right. \nonumber \\[5pt] && \left. \le s_k, \sum_{j=1}^{\widehat{N}_m^{[k]}}X_{m,j} \le s_m, m\in \mathcal{K}-\{k\} \right), \nonumber\\[5pt] \end{eqnarray}
and
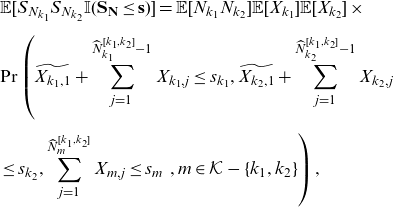 \begin{eqnarray} && \mathbb{E}[S_{N_{k_1}}S_{N_{k_2}} \mathbb{I}(\mathbf{S}_{\mathbf{N}}\le \mathbf{s})] = \mathbb{E}[N_{k_1}N_{k_2}]\mathbb{E}[X_{k_1}]\mathbb{E}[X_{k_2}] \times \nonumber\\[5pt] &&\Pr\left(\widetilde{X_{k_1,1}}+\sum_{j=1}^{\widehat{N}_{k_1}^{[k_1,k_2]}-1} X_{k_1,j}\le s_{k_1}, \widetilde{X_{k_2,1}}+\sum_{j=1}^{\widehat{N}_{k_2}^{[k_1,k_2]}-1} X_{k_2,j} \right. \nonumber \\[5pt] && \left. \le s_{k_2}, \sum_{j=1}^{\widehat{N}_{m}^{[k_1,k_2]}}X_{m,j}\le s_m \,\,, m\in \mathcal{K}-\{k_1,k_2\} \right),\nonumber\\[5pt] \end{eqnarray}
Remark 3.1. Theorem 3.1 generalizes Proposition 1 in Denuit (Reference Denuit2020) and Theorem 2 of Ren (Reference Ren2021), which gave formulas for the moment transforms of univariate compound distributions. In particular, with $K=1$
and denoting
$K=1$
and denoting $S_N=\sum_{i=1}^{N} X_i$
, Equation (3.9) becomes
$S_N=\sum_{i=1}^{N} X_i$
, Equation (3.9) becomes
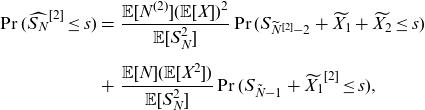 \begin{eqnarray} \Pr(\widehat{S_{N}}^{{[2]}}\le {s}) &=& \frac{\mathbb{E}[N^{(2)}](\mathbb{E}[X])^2}{\mathbb{E}[S_{N}^{2}]} \Pr(S_{\widetilde{N}^{[2]}-2} + \widetilde{X_{1}}+\widetilde{X_{2}} \le s)\nonumber\\[5pt] &+& \frac{\mathbb{E}[N](\mathbb{E}[X^2])}{\mathbb{E}[S_{N}^{2}]} \Pr(S_{\tilde{N}-1} + \widetilde{X_{1}}^{[2]}\le {s}), \end{eqnarray}
which is the result in Theorem 2 of Ren (Reference Ren2021).
Theorem 3.1 is different from Theorem 3 of Ren (Reference Ren2021), which is valid for cases with one dimensional claim frequency and multidimensional claim sizes.
Remark 3.2. Theorem 3.1 relates the moment transform of ${\mathbf{S}_{\mathbf{N}}}$
with those of
${\mathbf{S}_{\mathbf{N}}}$
with those of $\mathbf{N}$
and X. For example, Equation (3.9) shows that the distribution of
$\mathbf{N}$
and X. For example, Equation (3.9) shows that the distribution of $\widehat{\mathbf{S}_{\mathbf{N}}}^{[k^{[2]}]}$
is a mixture of
$\widehat{\mathbf{S}_{\mathbf{N}}}^{[k^{[2]}]}$
is a mixture of
 \begin{equation*}W_1 \;=:\;\mathbf{S}_{\mathbf{L}^{[k^{[2]}]}}+(\widetilde{X_{k,1}}+\widetilde{X_{k,2}}) \times \mathbf{1}^{[k]}\end{equation*}
and
 \begin{equation*}W_2 \;=:\;\mathbf{S}_{\mathbf{L}^{[k]}} + \widetilde{X_{k,1}}^{[2]}\times \mathbf{1}^{[k]}.\end{equation*}
Loosely speaking, to obtain $W_1$
, we first obtain
$W_1$
, we first obtain $\hat{\mathbf{N}}^{[k^{[(2)]}]}$
, which is the second factorial moment transform of
$\hat{\mathbf{N}}^{[k^{[(2)]}]}$
, which is the second factorial moment transform of $\mathbf{N}$
. Then, we replace two type k claims from
$\mathbf{N}$
. Then, we replace two type k claims from $\mathbf{S}_{\hat{\mathbf{N}}^{[k^{[(2)]}]}}$
with their independent moment transformed versions
$\mathbf{S}_{\hat{\mathbf{N}}^{[k^{[(2)]}]}}$
with their independent moment transformed versions $\widetilde{X_{k,1}}$
and
$\widetilde{X_{k,1}}$
and $\widetilde{X_{k,2}}$
. To obtain
$\widetilde{X_{k,2}}$
. To obtain $W_2$
, we replace a type k claim from
$W_2$
, we replace a type k claim from $\mathbf{S}_{\hat{\mathbf{N}}^{[k]}}$
with its independent second moment transformed version,
$\mathbf{S}_{\hat{\mathbf{N}}^{[k]}}$
with its independent second moment transformed version, $\widetilde{X_{k,1}}^{[2]}$
.
$\widetilde{X_{k,1}}^{[2]}$
.
Remark 3.3. Theorem 3.1 provides an approach to calculate the distributions of the moment transformed $\mathbf{S}_{\mathbf{N}}$
. For example, to compute the distribution of
$\mathbf{S}_{\mathbf{N}}$
. For example, to compute the distribution of $\widehat{\mathbf{S}_{\mathbf{N}}}^{[k^{[2]}]}$
, we do the following.
$\widehat{\mathbf{S}_{\mathbf{N}}}^{[k^{[2]}]}$
, we do the following.
-
(i) Determine the distribution functions of
$\mathbf{L}^{[k]}$
and
$\mathbf{L}^{[k^{[2]}]}$
. This is studied in great detail in Section 4 of this paper, where we show that for several commonly used models
$\mathbf{N}$
studied in Hesselager (Reference Hesselager1996) and Kim et al. (Reference Kim, Jang and Pyun2019), the distribution of the
$\mathbf{L}$
’s are in fact mixture of some distributions in the same family as
$\mathbf{N}$
and can be conveniently computed. -
(ii) Determine the distribution functions of
$\mathbf{S}_{\mathbf{L}^{[k^{[2]}]}}$
and
$\mathbf{S}_{\mathbf{L}^{[k]}}$
. This can be done by either (a) applying the recursive methods introduced in Hesselager (Reference Hesselager1996) and Kim et al. (Reference Kim, Jang and Pyun2019) or (b) applying the FFT method if the characteristic functions of
$\mathbf{N}$
(therefore
$\mathbf{L}$
’s) and
$\mathbf{X}$
are known. For details of the FFT method, see for example, Wang (Reference Wang1998) and Embrechts and Frei (Reference Embrechts and Frei2009). -
(iii) Determine the distribution functions of
$W_1$
and
$W_2$
. Since the elements in
$W_1$
and
$W_2$
are independent, this can be done by applying direct (multivariate) convolution or FFT. -
(iv) Mixing the distribution functions of
$W_1$
and
$W_2$
using the weights in Equation (3.9).


With Theorem 3.1, the MTCE and MTCOV of $\mathbf{S}_{\mathbf{N}}$
, defined in (2.2) and (2.3) respectively, can be computed by applying items (i) and (ii) of Lemma 2.1. We summarize the results as follows.
$\mathbf{S}_{\mathbf{N}}$
, defined in (2.2) and (2.3) respectively, can be computed by applying items (i) and (ii) of Lemma 2.1. We summarize the results as follows.
 \begin{equation} \mathbb{E} [S_{N_k} | \mathbf{S}_{\mathbf{N}} > \mathbf{s}_q] = \mathbb{E}[S_{N_k}] \frac{\Pr(\widehat{\mathbf{S}_{\mathbf{N}}}^{[k]}>\mathbf{s}_q)}{\Pr(\mathbf{\mathbf{S}_{\mathbf{N}}} >\mathbf{s}_q)}, \quad k \in \mathcal{K}\end{equation}
 \begin{equation} \mathbb{E} [S_{N_k}^{2} | \mathbf{S}_{\mathbf{N}} > \mathbf{s}_q] = \mathbb{E}[S_{N_k}^2] \frac{\Pr(\widehat{\mathbf{S}_{\mathbf{N}}}^{[k^{[2]}]}>\mathbf{s}_q)}{\Pr(\mathbf{\mathbf{S}_{\mathbf{N}}} >\mathbf{s}_q)}, \quad k \in \mathcal{K}\end{equation}
and
 \begin{equation} \mathbb{E} [S_{N_{k_1}} S_{N_{k_2}} | \mathbf{S}_{\mathbf{N}} > \mathbf{s}_q] = \mathbb{E}[S_{N_{k_1}} S_{N_{k_2}}] \frac{\Pr(\widehat{\mathbf{S}_{\mathbf{N}}}^{[k_1,k_2]}>\mathbf{s}_q)}{\Pr(\mathbf{\mathbf{S}_{\mathbf{N}}} >\mathbf{s}_q)}, \quad k_1, k_2 \in \mathcal{K}.\end{equation}
To determine the quantities defined in (2.4) and (2.6) related to the capital allocation problem, we make use of item (iii) of Lemma 2.1. This yields
 \begin{equation} \mathbb{E} [S_{N_k} | S_{\bullet}>{s}] = \mathbb{E}[S_{N_k}] \frac{\Pr[\widehat{S}_{\bullet}^{[k]} > s]}{\Pr[S_{\bullet} > s]},\end{equation}
where $\widehat{S}_{\bullet}^{[k]} = \sum_{j=1}^K \widehat{S}_{N_j}^{[k]}$
, and
$\widehat{S}_{\bullet}^{[k]} = \sum_{j=1}^K \widehat{S}_{N_j}^{[k]}$
, and $\widehat{S}_{N_j}^{[k]}$
is the jth element of
$\widehat{S}_{N_j}^{[k]}$
is the jth element of $\widehat{\mathbf{S}_{\mathbf{N}}}^{[k]}$
, whose (joint) distribution can be computed using (3.7). Then, the probability
$\widehat{\mathbf{S}_{\mathbf{N}}}^{[k]}$
, whose (joint) distribution can be computed using (3.7). Then, the probability $\Pr[\widehat{S}_{\bullet}^{[k]} > s]$
can be calculated. For example, in the bivariate case, if the FFT method is used for
$\Pr[\widehat{S}_{\bullet}^{[k]} > s]$
can be calculated. For example, in the bivariate case, if the FFT method is used for $\widehat{\mathbf{S}_{\mathbf{N}}}^{[k]}$
, then the distribution of
$\widehat{\mathbf{S}_{\mathbf{N}}}^{[k]}$
, then the distribution of $\widehat{S}_{\bullet}^{[k]} $
can be obtained by the inverse fast Fourier transform of the diagonal terms of the array of the FFT of
$\widehat{S}_{\bullet}^{[k]} $
can be obtained by the inverse fast Fourier transform of the diagonal terms of the array of the FFT of $\widehat{\mathbf{S}_{\mathbf{N}}}^{[k]}$
.
$\widehat{\mathbf{S}_{\mathbf{N}}}^{[k]}$
.
In addition, for $k_1,k_2\in \mathcal{K}$
 \begin{eqnarray} \mathbb{E} [S_{N_{k_1}} S_{N_{k_2}} | (S_{\bullet}>{s})]=\mathbb{E}[S_{N_{k_1}} S_{N_{k_2}}] \frac{\Pr[\widehat{S}_{\bullet}^{[k_1,k_2]} > s]}{\Pr[S_{\bullet} > s]}, \end{eqnarray}
where
 \begin{equation*}\widehat{S}_{\bullet}^{[k_1,k_2]}= \sum_{j=1}^K \widehat{S}_{N_j}^{[k_1,k_2]}.\end{equation*}
These quantities can be computed by applying Equations (3.9) and (3.11).
From Equations (3.15) to (3.19), it is seen that we essentially change the problem of computing tail moments to the problem of computing the tail probabilities of the moment transformed distributions. All the required quantities for computing the risk measures and performing the capital allocations can be determined if the moment transformed distributions of $\mathbf{S}_{\mathbf{N}}$
can be computed.
$\mathbf{S}_{\mathbf{N}}$
can be computed.
By Theorem 3.1, it is seen that the distribution functions of the moment transforms of $\mathbf{S}_{\mathbf{N}}$
rely on the distribution functions of
$\mathbf{S}_{\mathbf{N}}$
rely on the distribution functions of $\mathbf{L}^{[k]}$
,
$\mathbf{L}^{[k]}$
, $\mathbf{L}^{[k_1,k_2]}$
and
$\mathbf{L}^{[k_1,k_2]}$
and $\mathbf{L}^{[k^{[2]}]}$
. Therefore, in the next section, we derive formulas for determining them when
$\mathbf{L}^{[k^{[2]}]}$
. Therefore, in the next section, we derive formulas for determining them when $\mathbf{N}$
follows some commonly used multivariate discrete distributions, as introduced in Hesselager (Reference Hesselager1996) and Kim et al. (Reference Kim, Jang and Pyun2019).
$\mathbf{N}$
follows some commonly used multivariate discrete distributions, as introduced in Hesselager (Reference Hesselager1996) and Kim et al. (Reference Kim, Jang and Pyun2019).
4. Multivariate factorial moment transform of some commonly used discrete distributions
As discussed in Section 4.2 of Denuit and Robert (Reference Denuit and Robert2021), common mixture is a very flexible and useful method for constructing dependence models. It plays a fundamental role in the following derivations. Therefore, we first present a general result on moment transform of a random vector with common mixing variables.
Let $\mathbf{X}=(X_1,\cdots, X_K)$
. An external environment, described by a random variable
$\mathbf{X}=(X_1,\cdots, X_K)$
. An external environment, described by a random variable $\Lambda$
, affects each element of
$\Lambda$
, affects each element of $\mathbf{X}$
such that
$\mathbf{X}$
such that $\mathbf{X}\stackrel{d}{=} \mathbf{X}(\Lambda)$
and
$\mathbf{X}\stackrel{d}{=} \mathbf{X}(\Lambda)$
and $X_i \stackrel{d}{=} X_i(\Lambda)$
. Let
$X_i \stackrel{d}{=} X_i(\Lambda)$
. Let $\mathbf{X}(\lambda)$
be the random vector with the conditional distribution of
$\mathbf{X}(\lambda)$
be the random vector with the conditional distribution of $\mathbf{X}$
given
$\mathbf{X}$
given $\Lambda=\lambda$
, and then, we have the following result for the moment transform of
$\Lambda=\lambda$
, and then, we have the following result for the moment transform of $\mathbf{X}$
.
$\mathbf{X}$
.
Proposition 4.1. The distribution function of the $(k_1, k_2)$
th component
$(k_1, k_2)$
th component $(\alpha_1, \alpha_2)$
th order moment transform of
$(\alpha_1, \alpha_2)$
th order moment transform of $\mathbf{X}=\mathbf{X}(\Lambda)$
is given by
$\mathbf{X}=\mathbf{X}(\Lambda)$
is given by
 \begin{eqnarray} F_{\widehat{\mathbf{X}}^{[k_1^{[\alpha_1]},k_2^{[\alpha_2]}]}} (\mathbf{x}) &=& \int F_{\widehat{\mathbf{X}(\lambda)}^{[k_1^{[\alpha_1]},k_2^{[\alpha_2]}]}} (\mathbf{x}) \, d F_{\Lambda^*} (\lambda), \end{eqnarray}
where
 \begin{equation*}d F_{\Lambda^*} (\lambda)=\frac{\mathbb{E}[X_{k_1}(\lambda)^{\alpha_1}X_{k_2}(\lambda)^{\alpha_2}]}{\mathbb{E}[X_{k_1}(\Lambda)^{\alpha_1}X_{k_2}(\Lambda)^{\alpha_2}]} \, d F_\Lambda (\lambda).\end{equation*}
Proof.
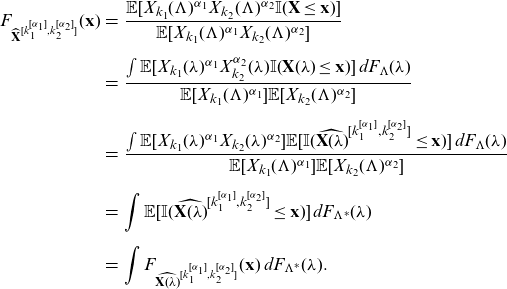 \begin{eqnarray*} F_{\widehat{\mathbf{X}}^{[k_1^{[\alpha_1]},k_2^{[\alpha_2]}]}} (\mathbf{x}) &=& \frac{\mathbb{E}[X_{k_1}(\Lambda)^{\alpha_1}X_{k_2}(\Lambda)^{\alpha_2} \mathbb{I}(\mathbf{X}\le \mathbf{x})] }{\mathbb{E}[X_{k_1}(\Lambda)^{\alpha_1}X_{k_2}(\Lambda)^{\alpha_2}]}\nonumber\\[5pt] &=& \frac{\int \mathbb{E}[X_{k_1}(\lambda)^{\alpha_1}X_{k_2}^{\alpha_2}(\lambda) \mathbb{I}(\mathbf{X}(\lambda)\le \mathbf{x})] \, d F_{\Lambda} (\lambda)}{\mathbb{E}[X_{k_1}(\Lambda)^{\alpha_1}]\mathbb{E}[X_{k_2}(\Lambda)^{\alpha_2}]}\nonumber\\[5pt] &=& \frac{\int \mathbb{E}[X_{k_1}(\lambda)^{\alpha_1}X_{k_2}(\lambda)^{\alpha_2}] \mathbb{E}[\mathbb{I}({\widehat{\mathbf{X}(\lambda)}^{[k_1^{[\alpha_1]},k_2^{[\alpha_2]}]}} \le \mathbf{x})] \, d F_{\Lambda}(\lambda)}{\mathbb{E}[X_{k_1}(\Lambda)^{\alpha_1}]\mathbb{E}[X_{k_2}(\Lambda)^{\alpha_2}]}\nonumber\\[5pt] &=& \int \mathbb{E}[\mathbb{I}({\widehat{\mathbf{X}(\lambda)}^{[k_1^{[\alpha_1]},k_2^{[\alpha_2]}]}} \le \mathbf{x})] \, d F_{\Lambda^*} (\lambda)\nonumber\\[5pt] &=& \int F_{\widehat{\mathbf{X}(\lambda)}^{[k_1^{[\alpha_1]},k_2^{[\alpha_2]}]}} (\mathbf{x}) \, d F_{\Lambda^*} (\lambda). \end{eqnarray*}
This proposition is used in several settings in the sequel, where the moment transforms of several commonly used multivariate models for claim frequency are studied.
4.1. Multinomial – (a,b,0) mixture
This is model A of Hesselager (Reference Hesselager1996). Let M be a counting random variable whose probability mass function $p_M$
is in the (a,b,0) class with parameters a and b. That is,
$p_M$
is in the (a,b,0) class with parameters a and b. That is,
 \begin{equation} p_M(k)=\left(a+\frac{b}{k}\right)p_M(k-1), k=1,2,3, \cdots.\end{equation}
Assume that conditional on $M=m$
,
$M=m$
, $\mathbf{N}=(N_1, \cdots, N_K)$
follows a multinomial (MN) distribution with parameters
$\mathbf{N}=(N_1, \cdots, N_K)$
follows a multinomial (MN) distribution with parameters $(m,q_1, \cdots, q_K)$
. That is
$(m,q_1, \cdots, q_K)$
. That is
 \begin{equation*}\Pr(\mathbf{N}=\mathbf{n}|M=m)=\frac{m!}{n_1! n_2! \cdots, n_K!}q_1^{n_1}\cdots q_K^{n_K}, \text{ when }n_1+n_2+\cdots+n_K=m\end{equation*}
for non-negative $n_1,\cdots, n_K$
. It is understood that
$n_1,\cdots, n_K$
. It is understood that $\mathbf{N}=\mathbf{0}$
when
$\mathbf{N}=\mathbf{0}$
when $m=0$
.
$m=0$
.
As illustrated in Hesselager (Reference Hesselager1996), this model has a natural application in claim reserving where M is the total number of claims incurred in a fixed period and $n_1\sim n_K$
are the number of claims in different stages of settlement (reported, not-reported, paid, and so on).
$n_1\sim n_K$
are the number of claims in different stages of settlement (reported, not-reported, paid, and so on).
In the following, we refer to the unconditional distribution of $\mathbf{N}$
as the HMN distribution and write
$\mathbf{N}$
as the HMN distribution and write $\mathbf{N} \sim HMN(M, q_1, \cdots, q_K)$
. To obtain the moment transforms of
$\mathbf{N} \sim HMN(M, q_1, \cdots, q_K)$
. To obtain the moment transforms of $\mathbf{N}$
, we observe that M can be regarded as a common mixing variable for
$\mathbf{N}$
, we observe that M can be regarded as a common mixing variable for $(N_1, \cdots, N_K)$
. Thus, we write
$(N_1, \cdots, N_K)$
. Thus, we write $\mathbf{N} \stackrel{d}{=} \mathbf{N}(M) $
and let
$\mathbf{N} \stackrel{d}{=} \mathbf{N}(M) $
and let $\mathbf{N}(m)=(N_1(m), \cdots, N_K(m))$
denote the random vector with distribution
$\mathbf{N}(m)=(N_1(m), \cdots, N_K(m))$
denote the random vector with distribution $MN(m, q_1, \cdots, q_K)$
.
$MN(m, q_1, \cdots, q_K)$
.
By simple substitution, it is easy to verify that
for
$k\in \mathcal{K}$
and
$m\ge 1$
, (4.3)
\begin{equation} \mathbf{L}^{[k]}(m) = \widehat{\mathbf{N}(m)}^{[k]}- \mathbf{1}^{[k]} \sim MN(m-1, q_1, \cdots, q_K), \end{equation}
for
$k_1\neq k_2\in \mathcal{K}$
and
$m\ge 2$
(4.4)
\begin{equation} \mathbf{L}^{[k_1,k_2]}(m) = \widehat{\mathbf{N}(m)}^{[k_1,k_2]} - \mathbf{1}^{[k_1]} - \mathbf{1}^{[k_2]} \sim MN(m-2, q_1, \cdots, q_K),\end{equation}
for
$k\in \mathcal{K}$
and
$m\ge 2$
, (4.5)
\begin{equation} \mathbf{L}^{[k^{[2]}]}(m) = \left(\widehat{\mathbf{N}(m)}^{[k^{[(2)]}]} - 2\times \mathbf{1}^{[k]} \right)\sim MN(m-2, q_1, \cdots, q_K)\end{equation}


Combining Proposition 4.1 and the above three points yields the following results.
Theorem 4.1. Let $\mathbf{N}\sim HMN(M, q_1, \cdots, q_k)$
, then
$\mathbf{N}\sim HMN(M, q_1, \cdots, q_k)$
, then
 \begin{equation} \mathbf{L}^{[k]}=\widehat{\mathbf{N}}^{[k]}- \mathbf{1}^{[k]} \sim HMN(\tilde{M}-1, q_1, \cdots, q_K),\end{equation}
 \begin{equation} \mathbf{L}^{[k^{[2]}]}= \widehat{\mathbf{N}}^{[k^{[(2)]}]} - 2\times \mathbf{1}^{[k]} \sim HMN(\tilde{M} ^{[(2)]}-2, q_1, \cdots, q_K),\end{equation}
 \begin{equation} \mathbf{L}^{[k_1,k_2]}=\widehat{\mathbf{N}}^{[k_1,k_2]} - \mathbf{1}^{[k_1]}- \mathbf{1}^{[k_2]} \sim HMN(\tilde{M} ^{[(2)]}-2, q_1, \cdots, q_K).\end{equation}
Proof. By Proposition 4.1,
 \begin{equation*}p_{\hat{\mathbf{N}}^{[k]}} (\mathbf{n}) = \sum_m p_{\widehat{\mathbf{N}(m)}^{[k]}} (\mathbf{n}) p_{{M_{k}^*}}(m),\end{equation*}
where
 \begin{eqnarray*}p_{{M_{k}^*}}(m)&=&\frac{\mathbb{E}[N_k(m)]}{\mathbb{E}[N_k(M)]} p_{{M}}(m)\nonumber\\[5pt]&=&\frac{mq_k}{\mathbb{E}[M]q_k}p_{{M}}(m)\nonumber\\[5pt]&=& p_{\tilde{M}}(m).\end{eqnarray*}
Therefore,
 \begin{equation*}p_{\mathbf{L}^{[k]}} (\mathbf{n}) = \sum_m p_{\mathbf{L}^{[k]}(m)} (\mathbf{n}) p_{{M_{k}^*}}(m),\end{equation*}
which by (4.3) indicates (4.6).
Similarly,
 \begin{equation*} \mathbf{L}^{[k_1,k_2]} \sim HMN(M_{k_1,k_2}^*-2, q_1, \cdots, q_K),\end{equation*}
where
 \begin{eqnarray*} p_{{M_{k_1,k_2}^*}}(m)&=&\frac{\mathbb{E}[N_{k_1}(m)N_{k_2}(m)]}{\mathbb{E}[N_{k_1}(M)N_{k_2}(M)]} p_{{M}}(m)\nonumber\\[5pt] &=&\frac{m(m-1)q_{k_1}q_{k_2}}{\mathbb{E}[M(M-1)]q_{k_1}q_{k_2}}p_{{M}}(m)\nonumber\\[5pt] &=& p_{\tilde{M}^{[(2)]}}(m),\end{eqnarray*}
which leads to (4.7). In addition,
 \begin{equation*}\mathbf{L}^{[k^{[2]}]} \sim HMN(M_{k^{[2]}}^*-2, q_1, \cdots, q_K)\end{equation*}
where
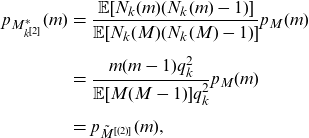 \begin{eqnarray*} p_{{M_{k^{[2]}}^*}}(m)&=&\frac{\mathbb{E}[N_{k}(m)(N_{k}(m)-1)]}{\mathbb{E}[N_{k}(M)(N_{k}(M)-1)]} p_{{M}}(m)\nonumber\\[5pt] &=&\frac{m(m-1)q_{k}^2}{\mathbb{E}[M(M-1)]q_{k}^2}p_{{M}}(m)\nonumber\\[5pt] &=& p_{\tilde{M}^{[(2)]}}(m),\end{eqnarray*}
which leads to (4.8).
It was shown in Ren (Reference Ren2021) that if M is in (a,b,0) class with parameter (a,b), then $\tilde{M}-1$
is in the (a,b,0) class with parameter
$\tilde{M}-1$
is in the (a,b,0) class with parameter $(a,a+b)$
, and
$(a,a+b)$
, and $\tilde{M}^{[(2)]}-2$
is in the (a,b,0) class with parameter
$\tilde{M}^{[(2)]}-2$
is in the (a,b,0) class with parameter $(a,2a+b)$
. Therefore, the distributions of
$(a,2a+b)$
. Therefore, the distributions of $\mathbf{L}^{[k]}$
,
$\mathbf{L}^{[k]}$
, ${\mathbf{L}}^{[k^{[2]}]}$
,
${\mathbf{L}}^{[k^{[2]}]}$
, $\mathbf{L}^{[k_1,k_2]}$
, and the original
$\mathbf{L}^{[k_1,k_2]}$
, and the original $\mathbf{N}$
are all in the same HMN family of Binomial-(a,b,0) mixture distributions. Thus, all the nice properties discussed in Hesselager (Reference Hesselager1996) are preserved. A particular important fact is that the corresponding compound distributions of
$\mathbf{N}$
are all in the same HMN family of Binomial-(a,b,0) mixture distributions. Thus, all the nice properties discussed in Hesselager (Reference Hesselager1996) are preserved. A particular important fact is that the corresponding compound distributions of $\mathbf{S}_{\mathbf{L}^{[k]}}$
,
$\mathbf{S}_{\mathbf{L}^{[k]}}$
, $\mathbf{S}_{{\mathbf{L}}^{[k^{[2]}]}}$
,
$\mathbf{S}_{{\mathbf{L}}^{[k^{[2]}]}}$
, $\mathbf{S}_{\mathbf{L}^{[k_1,k_2]}}$
can be evaluated recursively by using Theorem 2.2 of Hesselager (Reference Hesselager1996). Alternatively, the characteristic functions of
$\mathbf{S}_{\mathbf{L}^{[k_1,k_2]}}$
can be evaluated recursively by using Theorem 2.2 of Hesselager (Reference Hesselager1996). Alternatively, the characteristic functions of $\mathbf{S}_{\mathbf{L}^{[k]}}$
,
$\mathbf{S}_{\mathbf{L}^{[k]}}$
, $\mathbf{S}_{{\mathbf{L}}^{[k^{[2]}]}}$
,
$\mathbf{S}_{{\mathbf{L}}^{[k^{[2]}]}}$
, $\mathbf{S}_{\mathbf{L}^{[k_1,k_2]}}$
can be found easily, and their distribution functions can be computed using the FFT method. Consequently, Theorem 3.1 can be applied to compute the distributions of
$\mathbf{S}_{\mathbf{L}^{[k_1,k_2]}}$
can be found easily, and their distribution functions can be computed using the FFT method. Consequently, Theorem 3.1 can be applied to compute the distributions of $\widehat{\mathbf{S}_{\mathbf{N}}}^{[k]}$
,
$\widehat{\mathbf{S}_{\mathbf{N}}}^{[k]}$
, $\widehat{\mathbf{S}_{\mathbf{N}}}^{[k^{[2]}]}$
and
$\widehat{\mathbf{S}_{\mathbf{N}}}^{[k^{[2]}]}$
and $\widehat{\mathbf{S}_{\mathbf{N}}}^{[k_1,k_2]}$
.
$\widehat{\mathbf{S}_{\mathbf{N}}}^{[k_1,k_2]}$
.
4.2. Additive common shock
For $k\in \{0\}\cup \mathcal{K}$
, let
$k\in \{0\}\cup \mathcal{K}$
, let $\{M_k\}$
be independent non-negative discrete random variables with distribution functions in the (a,b,0) class with parameters
$\{M_k\}$
be independent non-negative discrete random variables with distribution functions in the (a,b,0) class with parameters $\{(a_k,b_k)\}$
. For
$\{(a_k,b_k)\}$
. For $k\in \mathcal{K}$
, let
$k\in \mathcal{K}$
, let $N_k=M_0+M_k$
. We consider the vector
$N_k=M_0+M_k$
. We consider the vector $\mathbf{N}=(N_1,\cdots, N_K)$
.
$\mathbf{N}=(N_1,\cdots, N_K)$
.
The moment transforms of $\mathbf{N}$
could be derived by treating
$\mathbf{N}$
could be derived by treating $M_0$
as a common mixing random variable. However, we next take a seemingly more direct approach.
$M_0$
as a common mixing random variable. However, we next take a seemingly more direct approach.
Theorem 4.2. The kth component first moment transform of $\mathbf{N}$
is given by
$\mathbf{N}$
is given by
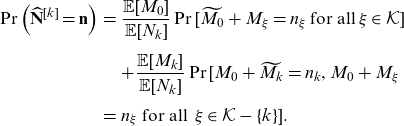 \begin{eqnarray} \Pr\left(\widehat{\mathbf{N}}^{[k]}=\mathbf{n}\right)&=& \frac{\mathbb{E}[M_0]}{\mathbb{E}[N_k]} \Pr[\widetilde{M_0}+M_{\xi}=n_\xi \, \text{for all}\, \xi \in \mathcal{K} ]\nonumber\\[5pt] && +\frac{\mathbb{E}[M_k]}{\mathbb{E}[N_k]} \Pr[M_0+\widetilde{M_k}=n_k, M_0+M_\xi \nonumber \\[5pt] &=& n_\xi \text{ for all }\, \xi \in \mathcal{K} -\{k\}]. \end{eqnarray}
The kth component second factorial moment transform of $\mathbf{N}$
is given by
$\mathbf{N}$
is given by
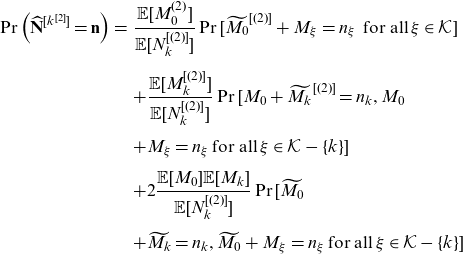 \begin{eqnarray} \Pr\left(\widehat{\mathbf{N}}^{[k^{[2]}]} =\mathbf{n}\right)&=& \frac{\mathbb{E}[M_0^{(2)}]}{\mathbb{E}[N_k^{[(2)]}]} \Pr[\widetilde{M_0}^{[(2)]}+M_\xi=n_\xi \, \text{ for all}\, \xi \in \mathcal{K} ]\nonumber\\[5pt] &&+\frac{\mathbb{E}[M_k^{[(2)]}]}{\mathbb{E}[N_k^{[(2)]}]} \Pr[M_0+\widetilde{M_k}^{[(2)]}=n_k, M_0 \nonumber \\[5pt] && +M_\xi=n_\xi \, \text{for all}\,\xi \in \mathcal{K} -\{k\}]\nonumber\\[5pt] && +2\frac{\mathbb{E}[M_0]\mathbb{E}[M_k]}{\mathbb{E}[N_k^{[(2)]}]} \Pr[\widetilde{M_0} \nonumber \\[5pt] &&+\widetilde{M_k}=n_k, \widetilde{M_0}+M_\xi=n_\xi \, \text{for all}\,\xi \in \mathcal{K} -\{k\}] \end{eqnarray}
For $k_1\neq k_2 \in\mathcal{K}$
, the
$k_1\neq k_2 \in\mathcal{K}$
, the $(k_1,k_2)$
th component first-order moment transform of
$(k_1,k_2)$
th component first-order moment transform of $\mathbf{N}$
is given by
$\mathbf{N}$
is given by
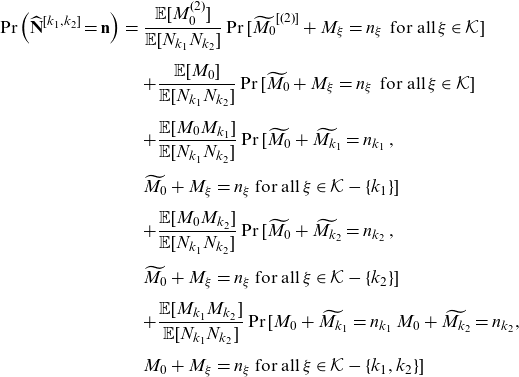 \begin{eqnarray} \Pr\left(\widehat{\mathbf{N}}^{[k_1,k_2]}=\mathbf{n}\right)&=& \frac{\mathbb{E}[M_0^{(2)}]}{\mathbb{E}[N_{k_1}N_{k_2}]} \Pr[\widetilde{M_0}^{[(2)]}+M_\xi=n_\xi \, \text{ for all}\, \xi \in \mathcal{K} ]\nonumber\\[5pt] &&+ \frac{\mathbb{E}[M_0]}{\mathbb{E}[N_{k_1}N_{k_2}]} \Pr[\widetilde{M_0}+M_\xi=n_\xi \, \text{ for all}\, \xi \in \mathcal{K} ]\nonumber\\[5pt] &&+\frac{\mathbb{E}[M_0 M_{k_1}]}{\mathbb{E}[N_{k_1}N_{k_2}]} \Pr[\widetilde{M_0}+\widetilde{M_{k_1}}=n_{k_1} \,, \nonumber\\[5pt] &&\widetilde{M_0}+M_\xi = n_\xi \text{ for all}\, \xi \in \mathcal{K}-\{k_1\} ]\nonumber\\[5pt] &&+\frac{\mathbb{E}[M_0 M_{k_2}]}{\mathbb{E}[N_{k_1}N_{k_2}]} \Pr[\widetilde{M_0}+\widetilde{M_{k_2}}=n_{k_2} \,, \nonumber\\[5pt] && \widetilde{M_0}+M_\xi = n_\xi \text{ for all}\, \xi \in \mathcal{K}-\{k_2\} ]\nonumber\\[5pt] &&+\frac{\mathbb{E}[M_{k_1} M_{k_2}]}{\mathbb{E}[N_{k_1}N_{k_2}]} \Pr[{M_0}+\widetilde{M_{k_1}}=n_{k_1} \, {M_0}+\widetilde{M_{k_2}}=n_{k_2}, \nonumber\\[5pt] && {M_0}+M_\xi = n_\xi \text{ for all}\, \xi \in \mathcal{K}-\{k_1,k_2\}]\nonumber\\[5pt]\end{eqnarray}
Proof. The proof of three statements is similar. We only prove (4.11) in the following.
 \begin{eqnarray*} \Pr\left(\widehat{\mathbf{N}}^{[k_1,k_2]}=\mathbf{n}\right)&=&\frac{\mathbb{E}[N_{k_1}N_{k_2} \mathbb{I}(\mathbf{N}=\mathbf{n})]}{\mathbb{E}[N_{k_1}N_{k_2}]}\nonumber\\[5pt] &=&\frac{\mathbb{E}[(M_0^{(2)}+M_0+M_0M_{k_1}+M_0M_{k_2}+M_{k_1}M_{k_2}) \mathbb{I}(\mathbf{N}=\mathbf{n})]}{\mathbb{E}[N_{k_1}N_{k_2}]} \end{eqnarray*}
Now, because $M_0, M_1, \cdots, M_K$
are mutually independent, we have for the first multiplication in the above
$M_0, M_1, \cdots, M_K$
are mutually independent, we have for the first multiplication in the above
 \begin{equation*} \mathbb{E}[M_0^{(2)} \mathbb{I}(\mathbf{N}=\mathbf{n})]=\mathbb{E}[M_0^{(2)}] \Pr\left(\widetilde{M_0}^{[(2)]}+M_\xi=n_\xi \, \text{ for all}\, \xi \in \mathcal{K} \right), \end{equation*}
which results in the first line of (4.11). Other terms can be obtained similarly.
Remark 4.1. Some insights can be gleaned from the results. Firstly, (4.9) indicates that the distribution of $\hat{\mathbf{N}}^{[k]}$
is a mixture of those of
$\hat{\mathbf{N}}^{[k]}$
is a mixture of those of $\mathbf{N}_A = \left(\widetilde{M_0}+M_1, \cdots, \widetilde{M_0}+M_k, \cdots, \widetilde{M_0}+M_K\right)$
and
$\mathbf{N}_A = \left(\widetilde{M_0}+M_1, \cdots, \widetilde{M_0}+M_k, \cdots, \widetilde{M_0}+M_K\right)$
and $\mathbf{N}_B = \left({M_0}+M_1, \cdots, {M_0}+\widetilde{M_k}, \cdots, {M_0}+M_K\right)$
.
$\mathbf{N}_B = \left({M_0}+M_1, \cdots, {M_0}+\widetilde{M_k}, \cdots, {M_0}+M_K\right)$
.
The Poisson case is especially interesting. Suppose that $M_\xi \sim \text{ Poisson } (\lambda_\xi)$
for
$M_\xi \sim \text{ Poisson } (\lambda_\xi)$
for $\xi \in \{0\}\cup \mathcal{K}$
. Then,
$\xi \in \{0\}\cup \mathcal{K}$
. Then, $\widetilde{M_\xi} \stackrel{d}{=} M_\xi+1$
for all
$\widetilde{M_\xi} \stackrel{d}{=} M_\xi+1$
for all $\xi$
. As a result, the distribution of
$\xi$
. As a result, the distribution of $\hat{\mathbf{N}}^{[k]}$
is a mixture of those of
$\hat{\mathbf{N}}^{[k]}$
is a mixture of those of $\mathbf{N}_A = \mathbf{N} + \mathbf{1}$
, where
$\mathbf{N}_A = \mathbf{N} + \mathbf{1}$
, where $\mathbf{1}$
is a K dimensional vector of ones, and
$\mathbf{1}$
is a K dimensional vector of ones, and $\mathbf{N}_B = \mathbf{N} + \mathbf{1}^{[k]}$
, with weights
$\mathbf{N}_B = \mathbf{N} + \mathbf{1}^{[k]}$
, with weights $\frac{\lambda_0}{(\lambda_0+\lambda_k)}$
and
$\frac{\lambda_0}{(\lambda_0+\lambda_k)}$
and $\frac{\lambda_k}{(\lambda_0+\lambda_k)}$
respectively. It is obvious that
$\frac{\lambda_k}{(\lambda_0+\lambda_k)}$
respectively. It is obvious that $\hat{\mathbf{N}}^{[k]}$
is larger than
$\hat{\mathbf{N}}^{[k]}$
is larger than ${\mathbf{N}}$
in the sense of multivariate first-order stochastic dominance. For a general result about the stochastic order of a multivariate random variable and its moment transform, please refer to Property 2.1 of Denuit and Robert (Reference Denuit and Robert2021). In addition, note that more weights are given to
${\mathbf{N}}$
in the sense of multivariate first-order stochastic dominance. For a general result about the stochastic order of a multivariate random variable and its moment transform, please refer to Property 2.1 of Denuit and Robert (Reference Denuit and Robert2021). In addition, note that more weights are given to $(\mathbf{N} + \mathbf{1})$
when
$(\mathbf{N} + \mathbf{1})$
when $\mathbb{E}[M_0]$
is large.
$\mathbb{E}[M_0]$
is large.
Having obtained the distributions of $\widehat{\mathbf{N}}^{[k]}$
,
$\widehat{\mathbf{N}}^{[k]}$
, $\widehat{\mathbf{N}}^{[k_1,k_2]}$
and
$\widehat{\mathbf{N}}^{[k_1,k_2]}$
and $\widehat{\mathbf{N}}^{[k^{[2]}]}$
, the distributions of
$\widehat{\mathbf{N}}^{[k^{[2]}]}$
, the distributions of $\mathbf{L}^{[k]}$
,
$\mathbf{L}^{[k]}$
, $\mathbf{L}^{[k_1,k_2]}$
, and
$\mathbf{L}^{[k_1,k_2]}$
, and $\mathbf{L}^{[k^{[2]}]}$
can be computed. For example, for the Poisson case in Remark 4.1,
$\mathbf{L}^{[k^{[2]}]}$
can be computed. For example, for the Poisson case in Remark 4.1, $\mathbf{L}^{[k]}=\widehat{\mathbf{N}}^{[k]}-\mathbf{1}^{[k]}$
is a mixture of
$\mathbf{L}^{[k]}=\widehat{\mathbf{N}}^{[k]}-\mathbf{1}^{[k]}$
is a mixture of $\mathbf{N} + \mathbf{1}- \mathbf{1}^{[k]}$
and
$\mathbf{N} + \mathbf{1}- \mathbf{1}^{[k]}$
and $\mathbf{N}$
. Therefore, the corresponding compound distributions required in Theorem 3.1 can be evaluated using either the FFT method or the recursive formulas in Theorem 3.2 of Hesselager (Reference Hesselager1996).
$\mathbf{N}$
. Therefore, the corresponding compound distributions required in Theorem 3.1 can be evaluated using either the FFT method or the recursive formulas in Theorem 3.2 of Hesselager (Reference Hesselager1996).
4.3. Common Poisson mixture
We consider the mixture model studied in Kim et al. (Reference Kim, Jang and Pyun2019), which is more general than Model B of Hesselager (Reference Hesselager1996).
Let $\Lambda$
be a random variable defined on
$\Lambda$
be a random variable defined on $(0,\infty)$
. Conditional on
$(0,\infty)$
. Conditional on $\Lambda=\lambda$
, the claim frequencies
$\Lambda=\lambda$
, the claim frequencies $\{N_k\}_{k\in \mathcal{K}}$
are independent Poisson random variables, where the type k frequency has mean
$\{N_k\}_{k\in \mathcal{K}}$
are independent Poisson random variables, where the type k frequency has mean $a_k \lambda +b_k$
for some non-negative constants
$a_k \lambda +b_k$
for some non-negative constants $a_k$
and
$a_k$
and $b_k$
. Without loss of generality, we assume that
$b_k$
. Without loss of generality, we assume that $\mathbb{E}[\Lambda]=1$
.
$\mathbb{E}[\Lambda]=1$
.
We have the following result.
Theorem 4.3.
 \begin{equation*} \Pr\left(\mathbf{L}^{[k]}=\mathbf{n}\right)= \int \prod_{k\in \mathcal{K}} \Pr\left(N_k(\lambda)=n_k\right) \, d F_{\Lambda_k^*} (\lambda), \end{equation*}
where
 \begin{equation} F_{\Lambda_k^*} (\lambda)=\frac{a_k F_{\tilde{\Lambda}} (\lambda)+ b_k F_{\Lambda} (\lambda)}{a_k+b_k}. \end{equation}
 \begin{equation*} \Pr\left(\mathbf{L}^{[k_1,k_2]}=\mathbf{n}\right)= \int \prod_{k\in \mathcal{K}} \Pr\left(N_k(\lambda)=n_k\right) \, d F_{\Lambda_{k1k2}^*} (\lambda), \end{equation*}
where
 \begin{equation} F_{\Lambda_{k1k2}^*} (\lambda)=\frac{a_{k_1}a_{k_2}\mathbb{E}[\Lambda^2] F_{\tilde{\Lambda}^{[2]}} (\lambda)+ (a_{k_1}b_{k_2}+a_{k_2}b_{k_1}) F_{\tilde{\Lambda}^{[1]}} (\lambda) +b_{k_1}b_{k_2}F_{\Lambda}(\lambda) }{a_{k_1}a_{k_2} \mathbb{E}[\Lambda^2]+a_{k_1}b_{k_2}+a_{k_2}b_{k_1}+b_{k_1}b_{k_2}}. \end{equation}
 \begin{equation} \Pr\left(\mathbf{L}^{[k^{[2]}]}=\mathbf{n}\right)= \int \prod_{k\in \mathcal{K}} \Pr\left(N_k(\lambda)=n_k\right) \, d F_{\Lambda_{k^{[2]}}^*} (\lambda), \end{equation}
where
 \begin{equation} F_{\Lambda_{k^{[2]}}^*} (\lambda)=\frac{a_k^2 \mathbb{E}[\Lambda^2] F_{\tilde{\Lambda}^{[2]}} (\lambda)+ 2a_kb_k F_{\tilde{\Lambda}^{[1]}} (\lambda) +b_k^2 F_{\Lambda}(\lambda) }{a_k^2 \mathbb{E}[\Lambda^2]+2a_k b_k+b_k^2} \end{equation}
Proof. The proof of the three statements is similar. We only present the proof of (4.14) in the following.
First, due to Proposition 4.1, we have
 \begin{equation*} \Pr\left(\hat{\mathbf{N}}^{[k^{[(2)]}]}=\mathbf{n}\right)= \int \Pr\left({\widehat{\mathbf{N}(\lambda)}^{[k^{[(2)]}]}}=\mathbf{n}\right) \, d F_{\Lambda_{k^{[2]}}^*} (\lambda), \end{equation*}
where
 \begin{eqnarray*} dF_{\Lambda_{k^{[2]}}^*} (\lambda)&=& \frac{\mathbb{E}[N_k(\lambda)^{(2)}]}{\mathbb{E}[N_k(\Lambda)^{(2)}]} \, d F_{\Lambda} (\lambda)\nonumber\\[5pt] &=&\frac{(a_k\lambda+b_k)^2}{\mathbb{E}[(a_k\Lambda+b_k)^2]} \, d F_{\Lambda} (\lambda)\nonumber\\[5pt] &=&\frac{a_k^2\lambda^2 \, d F_{\Lambda}(\lambda)+2a_kb_k\lambda \, d F_{\Lambda}(\lambda)+b_k^2 \, d F_{\Lambda}(\lambda)}{a_k^2\mathbb{E}[\Lambda^2]+2a_kb_k\mathbb{E}[\Lambda]+b_k^2}\nonumber\\[5pt] &=&\frac{a_k^2\mathbb{E}[\Lambda^2]dF_{\tilde{\Lambda}^{[2]}}(\lambda)+2a_kb_kdF_{\tilde{\Lambda}}(\lambda)+b_k^2dF_{\Lambda}(\lambda)}{a_k^2 \mathbb{E}[\Lambda^2] + 2a_kb_k+b_k^2}, \end{eqnarray*}
which is (4.15). Notice that we have used $\mathbb{E}[\Lambda]=1$
.
$\mathbb{E}[\Lambda]=1$
.
Next, since
 \begin{equation*}\mathbf{L}^{[k^{[2]}]}=\widehat{\mathbf{N}}^{[k^{[(2)]}]}-2\times \mathbf{1}^{[k]},\end{equation*}
we have
 \begin{equation} \Pr\left(\mathbf{L}^{[k^{[2]}]}=\mathbf{n}\right)= \int \Pr\left({\mathbf{L}^{[k^{[2]}]}(\lambda)}=\mathbf{n}\right) \, d F_{\Lambda_{k^{[2]}}^*} (\lambda). \end{equation}
However, because $N_k(\lambda), k\in \mathcal{K}$
are independent Poisson random variables,
$N_k(\lambda), k\in \mathcal{K}$
are independent Poisson random variables,
 \begin{equation*}\mathbf{L} ^{[k]}(\lambda)= \widehat{\mathbf{N}(\lambda)}^{[k]}- \mathbf{1}^{[k]} \stackrel{d}{=} \mathbf{N}(\lambda),\end{equation*}
 \begin{equation} \mathbf{L}^{[k^{[2]}]}(\lambda)=\widehat{\mathbf{N}(\lambda)}^{[k^{[(2)]}]}-2\times \mathbf{1}^{[k]} \stackrel{d}{=} \mathbf{N}(\lambda) \end{equation}
and
 \begin{equation*}\mathbf{L}^{[k_1,k_2]}(\lambda) = \widehat{\mathbf{N}(\lambda)}^{[k_1,k_2]}- \mathbf{1}^{[k_1]}- \mathbf{1}^{[k_2]} \stackrel{d}{=} \mathbf{N}(\lambda).\end{equation*}
Remark 4.2. It is seen from Theorem 4.3 that the distributions of $\mathbf{L}^{[k]}$
,
$\mathbf{L}^{[k]}$
, $\mathbf{L}^{[k^{[2]}]}$
and
$\mathbf{L}^{[k^{[2]}]}$
and $\mathbf{L}^{[k_1,k_2]}$
are similar to that of
$\mathbf{L}^{[k_1,k_2]}$
are similar to that of $\mathbf{N}$
, with mixing parameters given by
$\mathbf{N}$
, with mixing parameters given by $\Lambda_{[k]}^*$
,
$\Lambda_{[k]}^*$
, $\Lambda_{k^{[2],}}^*$
and
$\Lambda_{k^{[2],}}^*$
and $\Lambda_{[k_1,k_2],}^*$
respectively. In addition, the distributions of
$\Lambda_{[k_1,k_2],}^*$
respectively. In addition, the distributions of $\Lambda_{[k]}^*$
,
$\Lambda_{[k]}^*$
, $\Lambda_{k^{[2]}}^*$
and
$\Lambda_{k^{[2]}}^*$
and $\Lambda_{[k_1,k_2]}^*$
are the mixtures of those of
$\Lambda_{[k_1,k_2]}^*$
are the mixtures of those of $\tilde{\Lambda}^{[1]}$
,
$\tilde{\Lambda}^{[1]}$
, $\tilde{\Lambda}^{[2]}$
, and
$\tilde{\Lambda}^{[2]}$
, and ${\Lambda}$
. Therefore, they can be evaluated if the distributions of
${\Lambda}$
. Therefore, they can be evaluated if the distributions of $\tilde{\Lambda}^{[1]}$
and
$\tilde{\Lambda}^{[1]}$
and $\tilde{\Lambda}^{[2]}$
can be determined. In fact, this is true for many choices of the distribution of
$\tilde{\Lambda}^{[2]}$
can be determined. In fact, this is true for many choices of the distribution of $\Lambda$
(Patil and Ord, Reference Patil and Ord1976). For example, if
$\Lambda$
(Patil and Ord, Reference Patil and Ord1976). For example, if $\Lambda$
has a gamma
$\Lambda$
has a gamma $(\alpha, \beta)$
distribution with p.d.f
$(\alpha, \beta)$
distribution with p.d.f
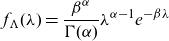 \begin{equation*}f_{\Lambda} (\lambda) = \frac{\beta^\alpha}{\Gamma(\alpha)} \lambda^{\alpha-1} e^{-\beta \lambda}\end{equation*}
then $\tilde{\Lambda}^{[1]}$
and
$\tilde{\Lambda}^{[1]}$
and $\tilde{\Lambda}^{[2]}$
follow gamma distributions with parameters
$\tilde{\Lambda}^{[2]}$
follow gamma distributions with parameters $(\alpha+1, \beta)$
and
$(\alpha+1, \beta)$
and $(\alpha+2, \beta),$
respectively. In such a case, the distributions of
$(\alpha+2, \beta),$
respectively. In such a case, the distributions of $\mathbf{L}$
’s are the finite mixtures of some Poisson-gamma mixtures. Consequently, the distribution of the compound sum
$\mathbf{L}$
’s are the finite mixtures of some Poisson-gamma mixtures. Consequently, the distribution of the compound sum $\mathbf{S}_{\mathbf{L}}$
can be computed using the recursive methods derived in Hesselager (Reference Hesselager1996) or the FFT method.
$\mathbf{S}_{\mathbf{L}}$
can be computed using the recursive methods derived in Hesselager (Reference Hesselager1996) or the FFT method.
4.4. Dependent claim frequency and size
As briefly discussed in Section 4.3 of Denuit and Robert (Reference Denuit and Robert2021), the general mixing method we used in this section can be applied to calculate the risk measures of the aggregate loss when the claim frequency and size are dependent through some common mixing variables. To illustrate the method, we use the setup of Section 4.3 of this paper, but now assume that the distributions of claim sizes also depend on the background parameter $\Lambda$
.
$\Lambda$
.
Theorem 4.4. Let $\Lambda$
be a random variable defined on
$\Lambda$
be a random variable defined on $(0,\infty)$
. Conditional on
$(0,\infty)$
. Conditional on $\Lambda=\lambda$
, let the claim frequencies
$\Lambda=\lambda$
, let the claim frequencies $N_k$
for
$N_k$
for $k\in \mathcal{K}$
be independent Poisson random variables with mean
$k\in \mathcal{K}$
be independent Poisson random variables with mean $a_k \lambda +b_k$
; let the corresponding claim sizes have distribution function
$a_k \lambda +b_k$
; let the corresponding claim sizes have distribution function $F_{X_k|\lambda}$
with mean
$F_{X_k|\lambda}$
with mean $c_k \lambda+d_k$
. Then,
$c_k \lambda+d_k$
. Then,
-
(i)
(4.18)where
\begin{eqnarray} \Pr \left(\widehat{\mathbf{S}}_{\mathbf{N}}^{[k]}\le \mathbf{s}\right) &=& \int \Pr \left(S_{N_1}(\lambda)\le s_1, \cdots, S_{N_k}(\lambda) \right. \nonumber \\[5pt] && \left. +\widetilde{X_k(\lambda)}\le s_k , \cdots, S_{N_K}(\lambda) \le s_K\right) d F_{\Lambda_{d,k^*}} (\lambda) \nonumber\\[5pt]\end{eqnarray}
(4.19)
\begin{eqnarray} && d F_{\Lambda_{d,k^*}} (\lambda) \nonumber \\[5pt] &=& \frac{\mathbb{E}\left[S_{N_k}(\lambda)\right]}{\mathbb{E}\left[S_{N_k}(\Lambda)\right]}d F_{\Lambda} (\lambda)\nonumber\\[5pt] &=& \frac{(a_k \lambda+b_k)(c_k \lambda+d_k)}{\mathbb{E}\left[(a_k \Lambda+b_k)(c_k \Lambda+d_k)\right]} \, d F_{\Lambda} (\lambda)\nonumber\\[5pt] &=& \frac{a_{k}c_{k}\mathbb{E}[\Lambda^2] \, d F_{\tilde{\Lambda}^{[2]}} (\lambda)+ (a_{k}d_{k}+b_{k}c_{k}) \mathbb{E}[\Lambda] \, d F_{\tilde{\Lambda}^{[1]}} (\lambda) +b_{k}d_{k} \,d F_{\Lambda}(\lambda) }{a_{k}c_{k} \mathbb{E}[\Lambda^2]+(a_{k}d_{k}+b_{k}c_{k})\mathbb{E}[\Lambda]+b_{k}d_{k}}. \nonumber \\ & & \end{eqnarray}
-
(ii)
(4.20)where
\begin{eqnarray} \Pr \left(\widehat{\mathbf{S}_{\mathbf{N}}}^{[k^{[2]}]}\le \mathbf{s}\right) & =& \int \Pr \left(S_{N_1}(\lambda)\le s_1, \cdots, \widetilde{S_{N_k}(\lambda)}^{[2]} \right. \nonumber \\[5pt] & & \quad \left. \le s_k , \cdots, S_{N_K}(\lambda) \le s_K\right) \, d F_{\Lambda_{d,k^{[2]}}^*} (\lambda) \nonumber\\ \end{eqnarray}
(4.21)and
\begin{eqnarray} d F_{\Lambda_{d,k^{[2]}}^*} (\lambda)&=& \frac{\mathbb{E}\left[S_{N_k}^2(\lambda)\right]}{\mathbb{E}\left[S_{N_k}^2(\Lambda)\right]} \, d F_{\Lambda} (\lambda) \end{eqnarray}
(4.22)
\begin{eqnarray} \Pr(\widetilde{S_{N_k}(\lambda)}^{[2]}\le s) &=& \frac{\mathbb{E}[N_k^{(2)}(\lambda)](\mathbb{E}[X_k(\lambda)])^2}{\mathbb{E}[S_{N_k}(\lambda)^{2}]} \Pr\left({S}_{N_k}(\lambda)\right. \nonumber \\[5pt] && \quad \left. + \widetilde{X_{k,1}(\lambda)}+\widetilde{X_{k,2}(\lambda)} \le {s}\right)\nonumber\\[5pt] \quad &+& \frac{\mathbb{E}[N_k(\lambda)](\mathbb{E}[X_k(\lambda)^2])}{\mathbb{E}[S_{N_k}(\lambda)^{2}]} \Pr({S_{N_k}(\lambda) + \widetilde{X_{k,1}(\lambda)}^{[2]}}\le {s}),\nonumber\\[5pt] \end{eqnarray}
-
(iii)
(4.23)with
\begin{eqnarray} \Pr \left(\widehat{\mathbf{S}_{\mathbf{N}}}^{[k_1,k_2]}\le \mathbf{s}\right) &=& \int \Pr \left(S_{N_1}(\lambda)\le s_1, \cdots, \widetilde{S_{N_{k_1}}(\lambda)} \le s_{k_1} , \cdots, \widetilde{S_{N_{k_2}}(\lambda)}\right. \nonumber \\[5pt] && \left. \le s_{k_2}, \cdots, S_{N_K}(\lambda) \le s_K\right)d F_{\Lambda_{d,(k_1,k_2)}^*} (\lambda) \nonumber\\[5pt]\end{eqnarray}
(4.24)
\begin{eqnarray} d F_{\Lambda_{d,(k_1,k_2)}^*} (\lambda)&=& \frac{\mathbb{E}\left[S_{N_{k_1}}(\lambda)S_{N_{k_2}}(\lambda)\right]}{\mathbb{E}\left[S_{N_{k_1}}(\Lambda)S_{N_{k_2}}(\Lambda)\right]} \,d F_{\Lambda} (\lambda). \end{eqnarray}


Proof. Since all variables in $\mathbf{S}_{\mathbf{N}}$
are independent conditional on
$\mathbf{S}_{\mathbf{N}}$
are independent conditional on $\Lambda$
, we have
$\Lambda$
, we have
 \begin{equation*} \widehat{\mathbf{S}_{\mathbf{N}} (\lambda)}^{[k_1^{[\alpha_1]},k_2^{[\alpha_2]}]} \stackrel{d}{=} \left(S_{N_1}(\lambda) \cdots, \widetilde{S_{N_{k_1}}(\lambda)}^{[k_1^{[\alpha_1]}]}, \cdots, \widetilde{S_{N_{k_2}}(\lambda)}^{[k_2^{[\alpha_2]}]}, \cdots, S_{N_K}(\lambda) \right).\end{equation*}
Then, the three statements can be proved by applying Proposition 4.1.
Equation (4.22) for $\widetilde{S_{N_k}(\lambda)}^{[2]}$
is due to (3.14).
$\widetilde{S_{N_k}(\lambda)}^{[2]}$
is due to (3.14).
Remark 4.3. When both the distributions of claim frequency and size depend on $\lambda$
, the distribution of
$\lambda$
, the distribution of $S_{N_k}$
cannot be computed using the recursive methods. However, its characteristic function can still be calculated. Thus, the FFT method is still applicable.
$S_{N_k}$
cannot be computed using the recursive methods. However, its characteristic function can still be calculated. Thus, the FFT method is still applicable.
5. Numerical examples
In this section, we provide numerical examples carrying out the capital allocation computation for each of the three models introduced in the previous section. In all the examples, we suppose that an insurer underwrites auto insurance policies that cover two types of claims: bodily injury (BI) and property damage (PD). Let the numbers of the two types of claims incurred in a time period be $\mathbf{N}=(N_1,N_2)$
and their sizes be
$\mathbf{N}=(N_1,N_2)$
and their sizes be $X_1$
and
$X_1$
and $X_2,$
respectively.
$X_2,$
respectively.
The distributions of claim frequencies and sizes and their parameters are selected hypothetically. However, they reflect the fact that the BI claims have relatively low frequencies and high severities. Our main goal is to illustrate the application of the formulas derived in this paper to compute the risk measures and capital allocations for multivariate aggregate loss models. Our results illustrate how low (or high) frequencies and high (or low) severities contribute to the tail risks.
To compare these two types of risks, in all the examples we report the following ratios.
The proportions of risk capital allocated to the two types of risks according to the TCE criterion
(5.1)
\begin{equation} \frac{\mathbb{E} [S_{N_k}|S_{\bullet} > s_q]}{\mathbb{E} [S_{\bullet}|S_{\bullet} > s_q]} \quad k=1,2.\end{equation}
The proportions of risk capital allocated to the two types of risks according to the TV criterion
(5.2)
\begin{equation}\frac{Cov \left[(S_{_k},S_{\bullet}) | S_{\bullet}>{s_q}\right]}{Var \left[S_{\bullet} | S_{\bullet}>{s_q}\right]} \quad k=1,2.\end{equation}


The computations are carried out using the following procedure.
Computation Procedure 5.1
-
(i) Determine the distributions of
$\mathbf{L}^{[k]}$
and
$\mathbf{L}^{[k^{[2]}]}$
for
$k=1,2$
, and
$\mathbf{L}^{[1,2]}$
using Theorems 4.1, 4.2, or 4.3.
-
(ii) Determine the distributions of
$\mathbf{S}_{\mathbf{L}^{[k]}}$
and
$\mathbf{S}_{\mathbf{L}^{[k^{[2]}]}}$
for
$k=1,2$
, and
$\mathbf{S}_{\mathbf{L}^{[1,2]}}$
. For the three models we discussed, this can be implemented by using the FFT or the recursive method proposed in Hesselager (Reference Hesselager1996). We choose to use the FFT method because of the simplicity of computer programming. -
(iii) Determine the distributions of
$\widehat{\mathbf{S}_{\mathbf{N}}}^{[k]}$
,
$\widehat{\mathbf{S}_{\mathbf{N}}}^{[k^{[2]}]}$
for
$k=1,2$
and
$\widehat{\mathbf{S}_{\mathbf{N}}}^{[1,2]}$
. This is implemented by using Theorem 3.1. The required convolutions are computed using the FFT method. -
(iv) Determine the MTCE and MTCOV of
$\mathbf{S}_{\mathbf{N}}$
using Equations (3.15), (3.16), and (3.17). -
(v) Determine the TCE- and TV-based capital allocations by using Equations (3.18) and (3.19).


A flowchart for computing $\frac{\mathbb{E} [S_{N_k} | S_{\bullet} > s_q]}{\mathbb{E} [S_{\bullet} | S_{\bullet} > s_q]}$
is shown in Figure 1. The steps for computing
$\frac{\mathbb{E} [S_{N_k} | S_{\bullet} > s_q]}{\mathbb{E} [S_{\bullet} | S_{\bullet} > s_q]}$
is shown in Figure 1. The steps for computing $\frac{Cov \left[(S_{_k},S_{\bullet})|S_{\bullet}>{s_q}\right]}{Var \left[S_{\bullet} | S_{\bullet}>{s_q}\right]}$
are similar and thus omitted.
$\frac{Cov \left[(S_{_k},S_{\bullet})|S_{\bullet}>{s_q}\right]}{Var \left[S_{\bullet} | S_{\bullet}>{s_q}\right]}$
are similar and thus omitted.
The steps for computing $\frac{\mathbb{E} [S_{N_k} | (S_{\bullet} > s_q)]}{\mathbb{E} [S_{\bullet}| (S_{\bullet} > s_q)]}$
.
$\frac{\mathbb{E} [S_{N_k} | (S_{\bullet} > s_q)]}{\mathbb{E} [S_{\bullet}| (S_{\bullet} > s_q)]}$
.
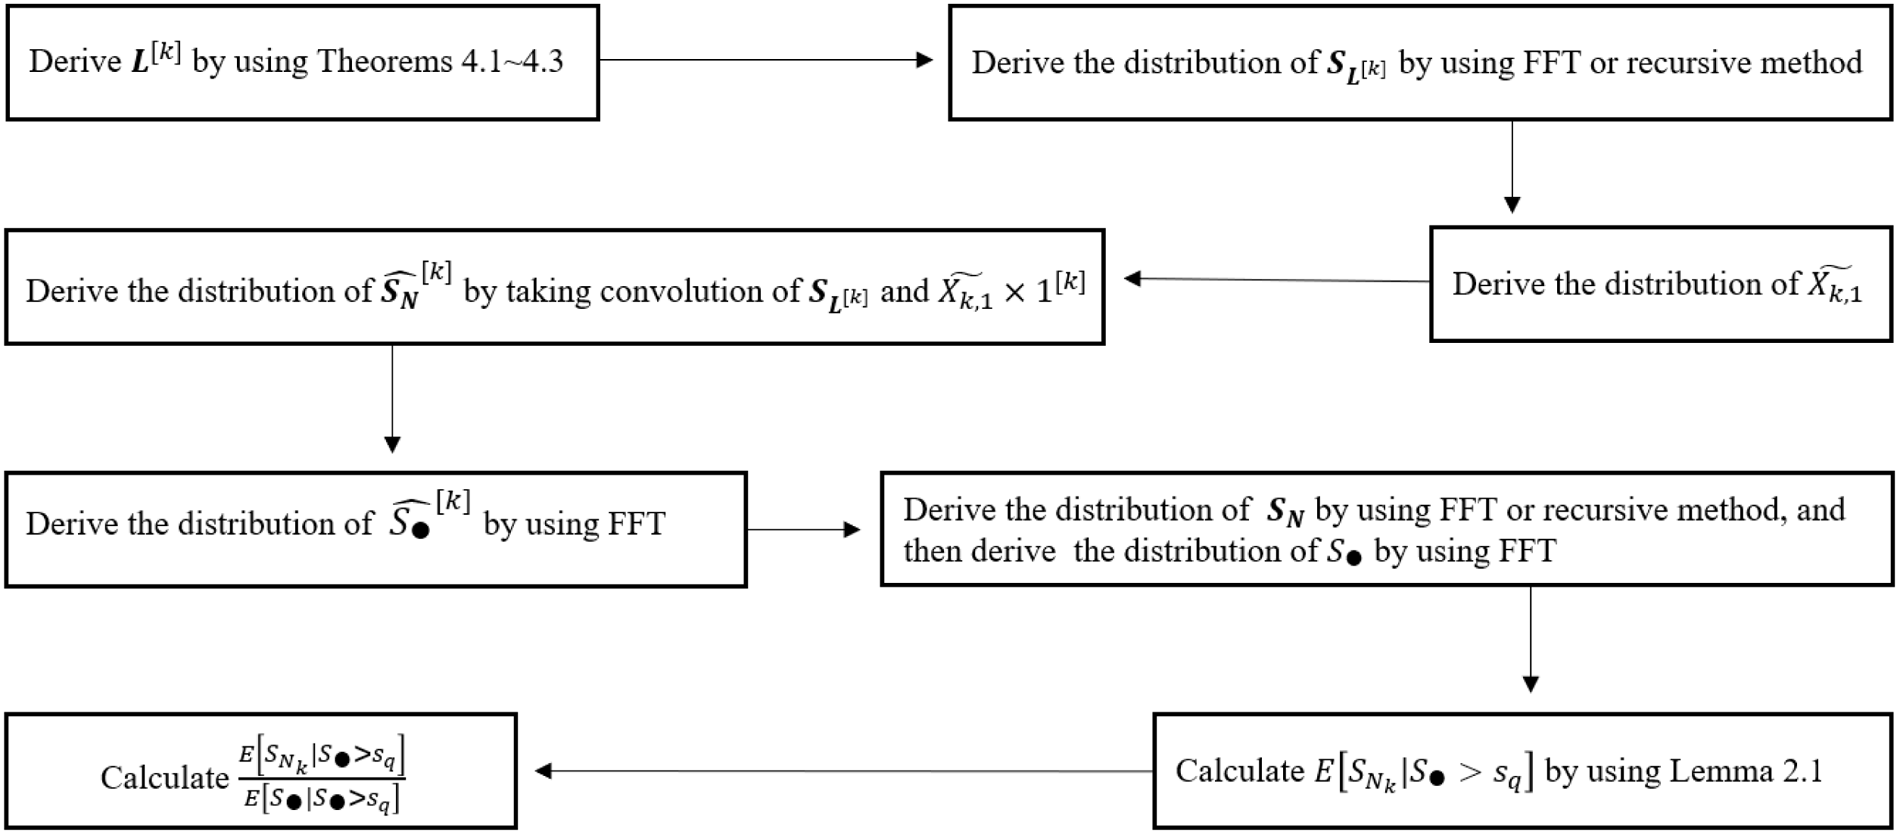
Since in all the three models studied, the claim frequencies are dependent but the claim sizes are independent, we have
 \begin{equation*}\mathbb{E}[S_k^{2}] = \mathbb{E}[N_k] \mathbb{E}[X_k^2] + \mathbb{E}[N_k^{(2)}](\mathbb{E}[X_k])^2, \quad k=1,2\end{equation*}
and
 \begin{equation*}\mathbb{E}[S_1 S_2] = \mathbb{E}[N_1 N_2] \mathbb{E}[X_1]\mathbb{E}[X_2].\end{equation*}
These quantities will be used in the calculations.
5.1. An example of the HMN model
Assume that $\mathbf{N}$
follows the HMN
$\mathbf{N}$
follows the HMN $(M,q_1, q_2)$
distribution with
$(M,q_1, q_2)$
distribution with $M\sim NB(r,\beta)$
whose probability mass function is given by (the parameterization in Klugman et al., Reference Klugman, Panjer and Willmot2019 is adopted)
$M\sim NB(r,\beta)$
whose probability mass function is given by (the parameterization in Klugman et al., Reference Klugman, Panjer and Willmot2019 is adopted)
 \begin{equation*}p_M(n)= \left(\substack{r+n-1 \\[4pt] n}\right) \left(\frac{\beta}{1+\beta}\right)^n \left(\frac{1}{1+\beta}\right)^{r}, \quad n\ge 0.\end{equation*}
It is easy to check that
 \begin{equation*}\mathbb{E}[N_k]= \mathbb{E}[M] q_k, \quad k=1,2,\end{equation*}
 \begin{equation*}\mathbb{E}[N_k^{(2)}]= \mathbb{E}[M^{(2)}] q_k^2, \quad k=1,2, \end{equation*}
 \begin{equation*}\mathbb{E}[N_1 N_2]= \mathbb{E}[M^{(2)}] q_1q_2,\end{equation*}
and
 \begin{equation*}Cov[N_1, N_2]= (Var(M) - \mathbb{E}[M]) q_1q_2.\end{equation*}
One interesting fact that the above equation reveals is that for the HMN model, the sign of the covariance of $N_1$
and
$N_1$
and $N_2$
depends on the relative sizes of the variance and mean of M. Clearly, if M follows a negative binomial distribution, then
$N_2$
depends on the relative sizes of the variance and mean of M. Clearly, if M follows a negative binomial distribution, then $N_1$
and
$N_1$
and $N_2$
are positively correlated; if M follows a Poisson distribution, then they are not correlated; if M is a binomial random variable, then they are negatively correlated.
$N_2$
are positively correlated; if M follows a Poisson distribution, then they are not correlated; if M is a binomial random variable, then they are negatively correlated.
Following Hesselager (Reference Hesselager1996), the joint PGF of $\mathbf{\mathbf{N}}$
is
$\mathbf{\mathbf{N}}$
is
 \begin{equation} \mathbf{P}_{\mathbf{N}}(z_1,z_2)=\left(1-\beta(q_1z_1+q_2z_2-1)\right)^{-r}\end{equation}
and the characteristic function of $\mathbf{S}_{\mathbf{N}}$
is
$\mathbf{S}_{\mathbf{N}}$
is
 \begin{equation}\psi_{\mathbf{S}_{\mathbf{N}}}(t_1,t_2)=\left(1-\beta(q_1\psi_{X_1}(t_1)+q_2\psi_{X_2}(t_2)-1)\right)^{-r},\end{equation}
where $\psi_{X_1}$
and
$\psi_{X_1}$
and $\psi_{X_2}$
are the characteristic functions of
$\psi_{X_2}$
are the characteristic functions of $X_1$
and
$X_1$
and $X_2,$
respectively.
$X_2,$
respectively.
With the above formulas, we may follow Computation Procedure 5.1 to evaluate the risks and perform the capital allocations for the aggregate losses $(S_1, S_2)$
. Some results for this model related to steps (i) and (ii) are given in the following. Steps (iii) to (v) are generic and can be followed for all the models.
$(S_1, S_2)$
. Some results for this model related to steps (i) and (ii) are given in the following. Steps (iii) to (v) are generic and can be followed for all the models.
Step (i): By Theorem 4.1,
 \begin{equation*}\mathbf{L}^{[k]} \sim (M_1,q_1, q_2), \quad k=1,2\end{equation*}
and
 \begin{equation*}\mathbf{L}^{[1^{[2]}]}\stackrel{d}{=}\mathbf{L}^{[2^{[2]}]}\stackrel{d}{=} \mathbf{L}^{[1,2]} \sim (M_2,q_1, q_2).\end{equation*}
Since $M \sim NB(r,\beta)$
, we have
$M \sim NB(r,\beta)$
, we have
 \begin{equation*}M_1 = \tilde{M}-1 \sim NB(r+1,\beta)\end{equation*}
and
 \begin{equation*}M_2 = \tilde{M}^{[(2)]}-2 \sim NB(r+2,\beta).\end{equation*}
Thus, for this model, all $\mathbf{L}$
’s follow HMN distributions.
$\mathbf{L}$
’s follow HMN distributions.
Step (ii): Because of the above, the characteristic functions of $\mathbf{S}_{\mathbf{L}^{[k]}}$
,
$\mathbf{S}_{\mathbf{L}^{[k]}}$
, $\mathbf{S}_{\mathbf{L}^{[k^{[2]}]}}$
for
$\mathbf{S}_{\mathbf{L}^{[k^{[2]}]}}$
for $k=1,2$
and
$k=1,2$
and $\mathbf{S}_{\mathbf{L}^{[1,2]}}$
can be derived in a similar way as that for
$\mathbf{S}_{\mathbf{L}^{[1,2]}}$
can be derived in a similar way as that for $\mathbf{S}_{\mathbf{N}}$
. Specifically,
$\mathbf{S}_{\mathbf{N}}$
. Specifically,
 \begin{equation}\psi_{\mathbf{S}_{\mathbf{L}^{[k]}}}(t_1,t_2)=\left(1-\beta(q_1\psi_{X_1}(t_1)+q_2\psi_{X_2}(t_2)-1)\right)^{-(r+1)}\end{equation}
and
 \begin{equation}\psi_{\mathbf{S}_{\mathbf{L}^{[k^{[2]}]}}}(t_1,t_2)=\psi_{\mathbf{S}_{\mathbf{L}^{[1,2]}}}(t_1,t_2)=\left(1-\beta(q_1\psi_{X_1}(t_1)+q_2\psi_{X_2}(t_2)-1)\right)^{-(r+2)}.\end{equation}
Therefore, their distributions can also be computed using the FFT method.
The capital allocation computations are performed by assuming that $M\sim NB(r=10, \beta=1)$
,
$M\sim NB(r=10, \beta=1)$
, $q_1=0.1$
,
$q_1=0.1$
, $q_2=0.9$
,
$q_2=0.9$
, $X_1\sim \text{Poisson}(5)$
and
$X_1\sim \text{Poisson}(5)$
and $X_2\sim \text{Poisson}(1)$
. Note that we assumed Poisson distributions with hypothetical parameters for the claim sizes for simplicity. If more realistic continuous distributions are assumed, they need to be discretized in order to use the FFT or recursive methods.
$X_2\sim \text{Poisson}(1)$
. Note that we assumed Poisson distributions with hypothetical parameters for the claim sizes for simplicity. If more realistic continuous distributions are assumed, they need to be discretized in order to use the FFT or recursive methods.
The proportions of capital allocated according to TCE with selected values of $s_q$
are plotted in the upper left panel of Figure 2. It shows that the proportion of risk capital allocated to BI (PD) claims increases (decreases) with
$s_q$
are plotted in the upper left panel of Figure 2. It shows that the proportion of risk capital allocated to BI (PD) claims increases (decreases) with $s_q$
. More capital is allocated to PD claims when
$s_q$
. More capital is allocated to PD claims when $s_q$
is small, whereas more risk capital is allocated to BI claims when
$s_q$
is small, whereas more risk capital is allocated to BI claims when $s_q$
is large. To put the numbers in the plot into context,
$s_q$
is large. To put the numbers in the plot into context, $S_{\bullet}$
has mean 14 and standard deviation
$S_{\bullet}$
has mean 14 and standard deviation $8.2$
.
$8.2$
.
Capital allocations for the HMN model.
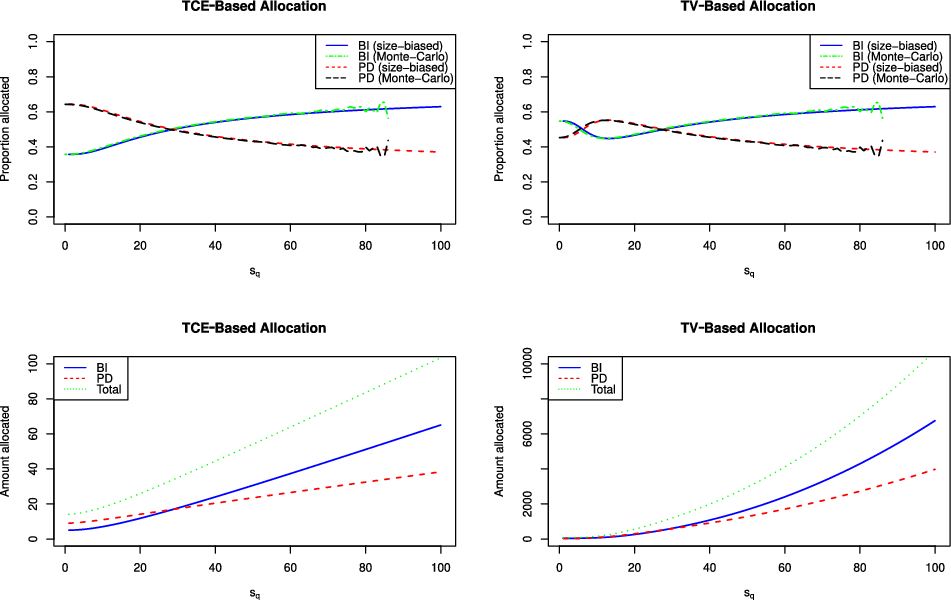
The proportions of capital allocated according to TV are shown in the upper right panel of Figure 2. We observe that the proportion allocated to BI claims is a decreasing function for small values of $s_q$
(roughly speaking, when
$s_q$
(roughly speaking, when $s_q$
is less than the mean value of
$s_q$
is less than the mean value of $S_\bullet$
, 14); it is increasing for large values of
$S_\bullet$
, 14); it is increasing for large values of $s_q$
. The opposite pattern is observed for PD claims.
$s_q$
. The opposite pattern is observed for PD claims.
Figure 2 also shows the capital allocation results obtained by using a Monte Carlo simulation with sample size $10^7$
. Clearly, the results obtained by the two methods agree. In addition, our elementary simulation results become unstable for large
$10^7$
. Clearly, the results obtained by the two methods agree. In addition, our elementary simulation results become unstable for large $s_q$
. To obtain more stable simulation results, one needs to either increase the sample size or apply certain variance reduction methods.
$s_q$
. To obtain more stable simulation results, one needs to either increase the sample size or apply certain variance reduction methods.
Note that the amounts of capital allocated to BI and PD risks both increase with $s_q$
, as shown in the lower panels of Figure 2.
$s_q$
, as shown in the lower panels of Figure 2.
5.2. An example of the common shock model
Let $N_1=M_0+M_1$
,
$N_1=M_0+M_1$
, $N_2=M_0+M_2$
, where
$N_2=M_0+M_2$
, where $M_0$
,
$M_0$
, $M_1$
, and
$M_1$
, and $M_2$
are independent Poison random variables with parameter
$M_2$
are independent Poison random variables with parameter $\lambda_0$
,
$\lambda_0$
, $\lambda_1$
,
$\lambda_1$
, $\lambda_2$
respectively. Then, we have
$\lambda_2$
respectively. Then, we have
 \begin{equation*}\mathbb{E}[N_k]= \lambda_0+\lambda_k, \quad k=1,2,\end{equation*}
 \begin{equation*}\mathbb{E}[N_k^{(2)}]= (\lambda_0+\lambda_k)^2,\quad k=1,2,\end{equation*}
and
 \begin{equation*}\mathbb{E}[N_1 N_2]= (\lambda_0+\lambda_1) (\lambda_0+\lambda_2)+\lambda_0.\end{equation*}
The characteristic function of $\mathbf{S}_{\mathbf{N}}$
is
$\mathbf{S}_{\mathbf{N}}$
is
 \begin{equation}\psi_{\mathbf{S}_{\mathbf{N}}}(t_1,t_2)=\exp\left(\lambda_0(\psi_{X_1}(t_1)\psi_{X_2}(t_2)-1)+\lambda_1(\psi_{X_1}(t_1)-1)+\lambda_2(\psi_{X_2}(t_2)-1)\right).\end{equation}
Some results for this model related to steps (i) and (ii) of Computation Procedure 5.1 are given in the following.
Step (i): By Equation (4.9), we have that $\mathbf{L}^{[1]}$
is a mixture of
$\mathbf{L}^{[1]}$
is a mixture of $\mathbf{N}+(0,1)$
and
$\mathbf{N}+(0,1)$
and $\mathbf{N}$
with weights
$\mathbf{N}$
with weights $\lambda_0/(\lambda_0+\lambda_1)$
and
$\lambda_0/(\lambda_0+\lambda_1)$
and $\lambda_1/(\lambda_0+\lambda_1),$
respectively.
$\lambda_1/(\lambda_0+\lambda_1),$
respectively. $\mathbf{L}^{[2]}$
is a mixture of
$\mathbf{L}^{[2]}$
is a mixture of $\mathbf{N}+(1,0)$
and
$\mathbf{N}+(1,0)$
and $\mathbf{N}$
with weights
$\mathbf{N}$
with weights $\lambda_0/(\lambda_0+\lambda_2)$
and
$\lambda_0/(\lambda_0+\lambda_2)$
and $\lambda_2/(\lambda_0+\lambda_2),$
respectively. Similarly, the distributions of
$\lambda_2/(\lambda_0+\lambda_2),$
respectively. Similarly, the distributions of $\mathbf{L}^{[k^{[2]}]}, k=1,2$
and
$\mathbf{L}^{[k^{[2]}]}, k=1,2$
and $\mathbf{L}^{[1,2]}$
are some mixtures of
$\mathbf{L}^{[1,2]}$
are some mixtures of $\mathbf{N}$
,
$\mathbf{N}$
, $\mathbf{N}+(0,1)$
,
$\mathbf{N}+(0,1)$
, $\mathbf{N}+(1,0)$
,
$\mathbf{N}+(1,0)$
, $\mathbf{N}+(0,2)$
,
$\mathbf{N}+(0,2)$
, $\mathbf{N}+(2,0)$
, and
$\mathbf{N}+(2,0)$
, and $\mathbf{N}+(1,1)$
. Therefore, their distributions can be computed.
$\mathbf{N}+(1,1)$
. Therefore, their distributions can be computed.
Step (ii): Since the distributions of $\mathbf{L}$
’s are the mixtures of the aggregate Poisson random variables and some constants. The characteristic function of the corresponding compound distribution can be obtained straightforwardly.
$\mathbf{L}$
’s are the mixtures of the aggregate Poisson random variables and some constants. The characteristic function of the corresponding compound distribution can be obtained straightforwardly.
With these steps, all the quantities needed for the capital allocations can be computed. The computation is carried out with $\lambda_0=0.5$
,
$\lambda_0=0.5$
, $\lambda_1=0.5$
,
$\lambda_1=0.5$
, $\lambda_2=5$
,
$\lambda_2=5$
, $X_1\sim \text{Poisson}(5)$
and
$X_1\sim \text{Poisson}(5)$
and $X_2\sim \text{Poisson}(1)$
. Figure 3 illustrates the results.
$X_2\sim \text{Poisson}(1)$
. Figure 3 illustrates the results.
Capital allocations for the common shock model.

5.3. An example of the Poisson Mixture model
Let $\Lambda$
follow a Gamma distribution with parameters
$\Lambda$
follow a Gamma distribution with parameters $(\alpha, \alpha),$
and thus, its mean is 1. Conditional on
$(\alpha, \alpha),$
and thus, its mean is 1. Conditional on $\Lambda=\lambda$
, for
$\Lambda=\lambda$
, for $k\in \{1,2\}$
,
$k\in \{1,2\}$
, $N_k$
’s are independent Poisson random variables with mean
$N_k$
’s are independent Poisson random variables with mean $a_k \lambda +b_k$
.
$a_k \lambda +b_k$
.
It is easy to check that for $ k=1,2$
 \begin{equation*}\mathbb{E}[N_k]= a_k+b_k,\end{equation*}
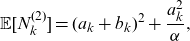 \begin{equation*}\mathbb{E}[N_k^{(2)}]= (a_k+b_k)^2+\frac{a_k^2}{\alpha},\end{equation*}
and
 \begin{equation*}\mathbb{E}[N_1 N_2]= (a_1+b_1)(a_2+b_2)+\frac{a_1a_2}{\alpha}.\end{equation*}
The characteristic function of $\mathbf{S}_{\mathbf{N}}$
is
$\mathbf{S}_{\mathbf{N}}$
is
 \begin{align}\psi_{\mathbf{S}_{\mathbf{N}}}(t_1,t_2)&=\exp(b_1(\psi_{X_1}(t_1)-1)+b_2(\psi_{X_2}(t_2)-1)) \nonumber \\[5pt] & \quad +\left(\frac{\alpha}{\alpha-a_1(\psi_{X_1}(t_1)-1)-a_2(\psi_{X_2}(t_2)-1)}\right)^\alpha\end{align}
Some results for this model related to steps (i) and (ii) of Computation Procedure 5.1 are given in the following.
Step (i): By Theorem 4.3, the distributions of $\mathbf{L}^{[1]}$
,
$\mathbf{L}^{[1]}$
, $\mathbf{L}^{[2]}$
,
$\mathbf{L}^{[2]}$
, $\mathbf{L}^{[1^{[2]}]}$
,
$\mathbf{L}^{[1^{[2]}]}$
, $\mathbf{L}^{[2^{[2]}]}$
, and
$\mathbf{L}^{[2^{[2]}]}$
, and $\mathbf{L}^{[1,2]}$
are all mixtures of Poisson-gamma mixtures.
$\mathbf{L}^{[1,2]}$
are all mixtures of Poisson-gamma mixtures.
Step (ii): Because of the above, the characteristic function of $\mathbf{S}_{\mathbf{L}}$
can be determined and the distribution function can be calculated using FFT.
$\mathbf{S}_{\mathbf{L}}$
can be determined and the distribution function can be calculated using FFT.
The capital allocation computations are carried out with $a_1=0.2$
,
$a_1=0.2$
, $a_2=0.4$
,
$a_2=0.4$
, $b_1=1$
,
$b_1=1$
, $b_2=2$
,
$b_2=2$
, $\alpha=2$
,
$\alpha=2$
, $X_1\sim \text{Poisson}(5)$
and
$X_1\sim \text{Poisson}(5)$
and $X_2\sim \text{Poisson}(1)$
. Figure 4 illustrates the results.
$X_2\sim \text{Poisson}(1)$
. Figure 4 illustrates the results.
Capital allocations for the Poisson mixture model.
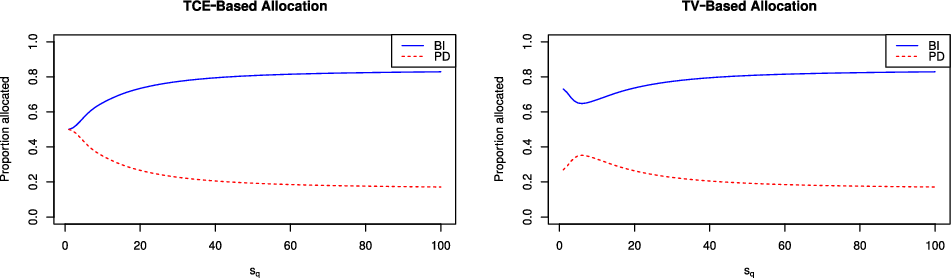
5.4. Findings of the numerical examples and other computational issues
In all of the three numerical examples we studied, the parameters are set such that BI claims are less frequent but more severe. The results show that, according to TCE allocation rule, the proportion of risk allocated to BI (PD) claims increases (decreases) with respect to the threshold level $s_q$
. According to TV allocation principle, the proportion allocated to BI claims first decreases and then increases. The opposite pattern is observed for PD claims. For all the cases, the proportions allocated to the two types of risk seem to converge to some constant as
$s_q$
. According to TV allocation principle, the proportion allocated to BI claims first decreases and then increases. The opposite pattern is observed for PD claims. For all the cases, the proportions allocated to the two types of risk seem to converge to some constant as $s_q$
goes to infinity.
$s_q$
goes to infinity.
We only provide examples that consider two types of risks. Computations are implemented using the software R (R Core Team, 2016). However, the formulas derived in Sections 3 and 4 are valid for compound variables of any finite dimension K. Nevertheless, the distribution of $\mathbf{S}_{\mathbf{N}}$
and its moment transform still need to be evaluated by multivariate recursive or FFT method, which may lead to numerical problems when K is very large. Exploring the behavior of the computational aspects of our model for the high-dimensional problem may be a good topic for future research.
$\mathbf{S}_{\mathbf{N}}$
and its moment transform still need to be evaluated by multivariate recursive or FFT method, which may lead to numerical problems when K is very large. Exploring the behavior of the computational aspects of our model for the high-dimensional problem may be a good topic for future research.
It is worth pointing out that our Equations (3.15)–(3.19) in fact lead to a novel approach to simulate the tail moments and perform the capital allocations. Particularly, instead of simulating the tail moments directly, one can simulate the ratio between the tail probabilities of the moment transformed distributions.
6. Conclusions
This paper presents the formulas for computing the multivariate TCE and TV for some types of multivariate compound distributions where the claim frequencies are dependent and the claim sizes are independent. We focus on the three important types of dependence models introduced in Hesselager (Reference Hesselager1996) and their extensions. The formulas are derived based on the moment transform of multivariate compound distributions, as discussed in Denuit and Robert (Reference Denuit and Robert2021) and the references therein.
As shown in Section 4.4, the methodology can be extended to the cases where the claim frequencies and claim sizes are dependent through a common shock. For future research, one could investigate whether such methodology can be applied to compute the risk measures of compound variables with more complicated dependence structures.
Acknowledgments
The authors are grateful to three anonymous referees for their constructive comments and suggestions, which greatly improved the quality of the paper. The authors also acknowledge the financial support received from the Natural Sciences and Engineering Research Council (NSERC) of Canada.


 Open access

