


Introduction
In patients with an atrioventricular septal defect, a more anteriorly located and narrowed left ventricular outflow tract is observed due to the position of the common atrioventricular valve. This can be appreciated as the typical “gooseneck” appearance of the left ventricular outflow tract on imaging.Reference Calkoen, Hazekamp and Blom 1 – Reference Suzuki, Ho and Anderson 4 After surgical atrioventricular septal defect correction, usually performed at an early age, the anatomical differences of the left ventricular outflow tract remain present.
At birth, in up to 17% of the patients the atrioventricular septal defect is associated with a coarctation of the ascending aorta.Reference Calkoen, Hazekamp and Blom 1 Post-surgical clinical aortic pathology is scarce in this population; however, studies suggest that the left ventricular outflow tract abnormalities have an influence on ascending aortic flow.Reference Shiokawa and Becker 3 As shown in a recent study applying 4D flow cardiovascular magnetic resonance in patients with a bicuspid aortic valve, altered valve morphology can lead to abnormalities in ascending aortic flow as well as increased wall shear stress. Wall shear stress is defined as the force per area tangent to the inner vascular wall, and can induce ascending aortic vessel wall remodelling and thereby influence left ventricular afterload.Reference Guzzardi, Barker and van Ooij 5
We hypothesised that the altered left ventricular outflow tract geometry in patients after atrioventricular septal defect repair causes blood flow changes and thereby influences ascending aortic haemodynamics. To test this hypothesis, we evaluated aortic wall shear stress in corrected atrioventricular septal defect patients using 4D flow cardiovascular MRI in relation to blood flow characteristics of the left ventricular outflow tract.
Methods
Patient selection
A total of 30 patients with repaired atrioventricular septal defect (age 27.6 ± 12.8 years, 68% women) were prospectively included from a surgical database. Inclusion criteria were age above 8 years and capability to undergo cardiovascular MRI, and patients with Down syndrome were excluded. Additionally, 28 healthy volunteers within a similar age range (age 24.8 ± 13.7 years, 53% women) without a history of cardiovascular disease were included. Participants in this study were also enrolled in other studies on cardiac function after atrioventricular septal defect repair performed by the Leiden University Medical Center.Reference Calkoen, Roest and Kroft 6 , Reference Calkoen, Westenberg and Kroft 7 None of these studies reported aortic flow patterns, wall shear stress, or aortic wall properties. All patients and volunteers underwent cardiovascular magnetic resonance and echocardiography. This study was approved by the local medical ethics committee and written informed consent was obtained from all patients and volunteers.
Cardiovascular magnetic resonance protocol
The cardiovascular magnetic resonance scanning protocol was according to previously published work, without the use of anaesthetics.Reference Calkoen, Roest and Kroft 6 , Reference Calkoen, Westenberg and Kroft 7 High-temporal 2D phase-contrast cardiovascular magnetic resonance with through-plane velocity encoding planned perpendicular to the ascending aorta at the level of the pulmonary trunk was performed with one-directional velocity encoding of 150 cm/s, 8-mm slice thickness, in-plane resolution 1.5 × 1.5 mm2, echo time/repetition time = 2.9/4.8, flip angle 10°, and maximal number of reconstructed phases. Temporal resolution was 2 × repetition time = 9.6 ms. Additionally, whole-heart 4D flow cardiovascular magnetic resonance was performed on a 3T MRI − scanner with free breathing, three-directional velocity encoding of 150 cm/s in all directions, spatial resolution 2.3 × 2.3 × 3.0–4.2 mm3 and 30 reconstructed phases.Reference Calkoen, de Koning and Blom 8 – Reference Elbaz, Calkoen, Westenberg and Lelieveldt 10 Parallel imaging with sensitivity encoding with an acceleration factor of two in anterior-posterior direction and echo planar imaging with a factor of five was used to speed up the acquisition. Echo time was 3.2 ms and repetition time was 7.7 ms. In total, 30 phases were reconstructed, leading to a true temporal resolution of 4 × repetition time = 31 ms.Reference Calkoen, Westenberg and Kroft 7
Cardiovascular magnetic resonance analyses
Both the mean and maximum velocity of flow in the ascending aorta were measured on cardiovascular magnetic resonance images. Mean velocity over the ascending aorta was calculated, and maximum velocity at the level of the pulmonary trunk was measured. Left ventricular function expressed as left ventricular ejection fraction was analysed using in-house developed software (MASS, Leiden University Medical Center, Leiden, The Netherlands). Percentage of left ventricular ejection fraction was calculated by manually tracing the endocardial borders at end-diastole and end-systole as obtained in short axis cardiovascular magnetic resonance slices by multi-slice multi-phase cine short-axis planimetry covering the full left ventricle using steady-state free-precession sequences with echo time/repetition time 1.5/3.0, 350 mm field-of-view, 45° flip angle, and 1.0 × 1.0 × 8.0 mm3 acquisition resolution.Reference Calkoen, Roest and Kroft 6
Pulse pressure in mmHg was estimated from the difference between the systolic and diastolic blood pressure from brachial cuff blood pressure, measured immediately after cardiovascular magnetic resonance with the subject still supine on MRI table using a semi-automated sphygmomanometer (Dinamap; Critikon, Tampa, Florida, United States of America; validated to ANSI/AAMI SP10 criteria).
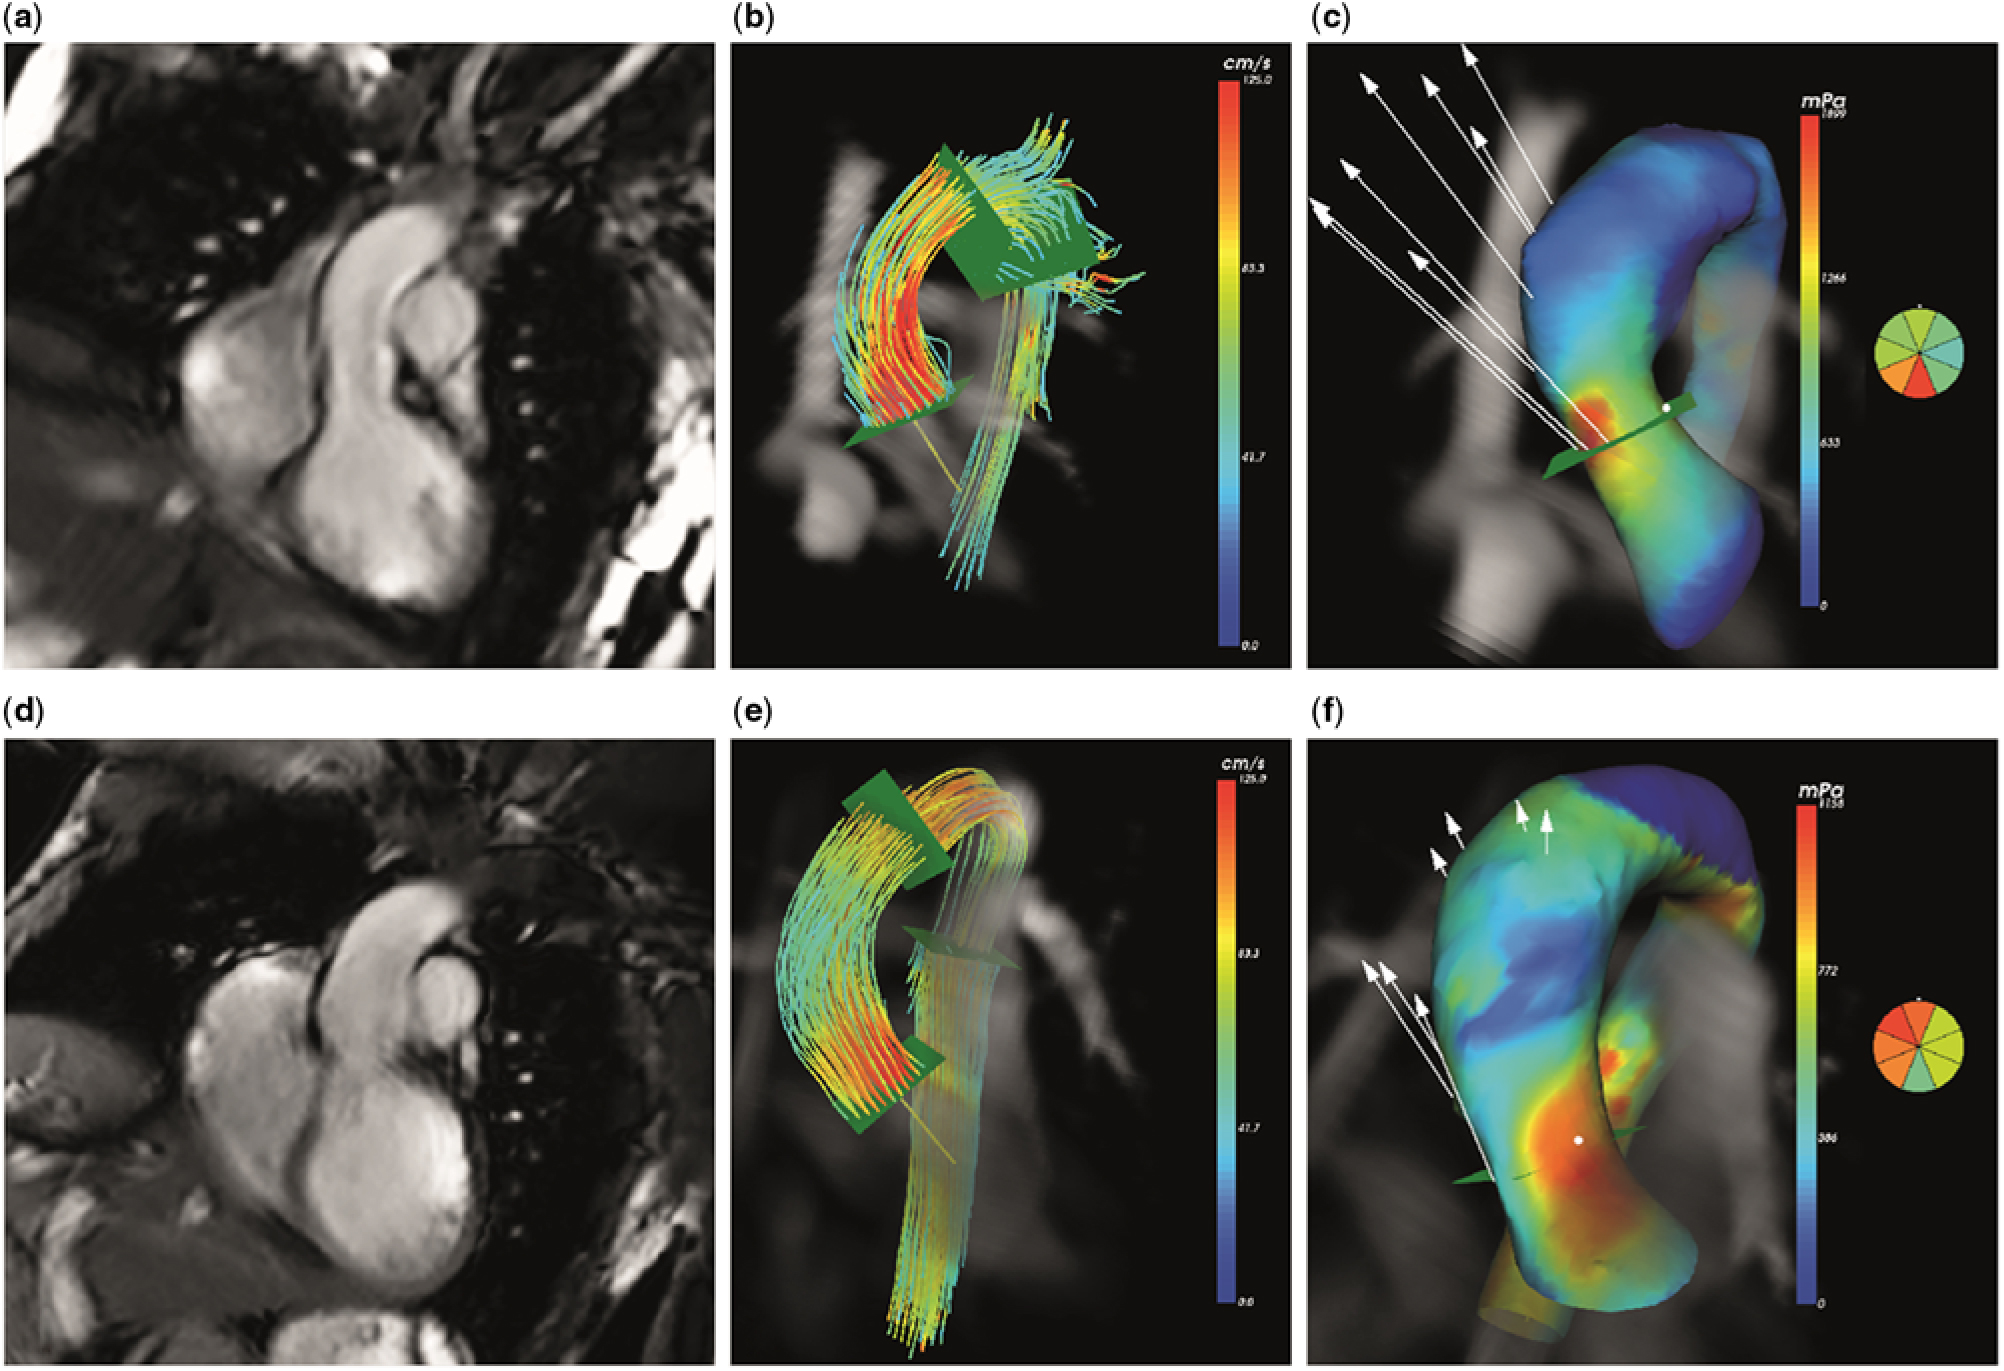
Wall shear stress over the ascending aorta was obtained from the 4D flow cardiovascular magnetic resonance data using CAAS MR 4D Flow 1.0 software (Pie Medical Imaging, Maastricht, The Netherlands) according to a recently validated approach.Reference van der Palen, Roest and van den Boogaard 11 In short, the surface of the segmented aorta at the moment of peak systole is represented by connected triangles, and the wall shear stress is defined as the spatial gradient of the 3D velocity vector in each edge point, perpendicular to the vessel wall. This algorithm has been previously published by Potters et al.Reference Potters, van Ooij, Marquering, vanBavel and Nederveen 12 The assessment of the wall shear stress is shown in Figure 1. First, an anatomical segmentation of the ascending aorta at the moment of peak systole is obtained using the CAAS 4D Flow software. On this segmentation, the location of the sinotubular junction is identified as the starting point of the ascending aorta, and the origin of the brachiocephalic artery is identified as the end point of the ascending aorta. On a cine coronal view of the proximal aorta, obtained with steady-state free-precession, the length of the ascending aorta is measured manually with a polyline along the aortic centreline, also at the moment of peak systole. Next, the 3D wall shear stress over the complete ascending aorta is determined and displayed on a colour-coded map. Peak wall shear stress is then sampled using this colour-coded map by manually placing a measurement plane at the location of peak wall shear stress, perpendicular to the centreline. Within this horizontal plane, CAAS 4D Flow software presents the wall shear stress at eight circumferential segments.
Four-dimensional (4D) flow cardiovascular magnetic resonance in ascending aorta: ( a – c ) healthy volunteer, ( d – f ) corrected atrioventricular septal defect patient. Anatomical representation of ascending aorta ( a and d ). Streamline representation of 4D flow cardiovascular magnetic resonance in peak systole ( b and e ). Map of 3D wall shear stress with colour coding to indicate peak wall shear stress ( c and f ).
Echocardiography
Transthoracic echocardiographic images were acquired using a commercially available system equipped with a 3.5 MHz transducer (Vivid 9; GE-Vingmed Ultrasound, Horton, Norway). The diameter of the left ventricular outflow tract in mm was measured on the parasternal long-axis view during systole. Peak velocity in m/s in the left ventricular outflow tract was measured using pulsed wave echocardiography in the apical 5 chamber view.
Intra- and inter-observer variation
Reproducibility of the wall shear stress calculations was evaluated by intra- and inter-observer analysis, by reanalysing the wall shear stress map in six patients and six volunteers, both randomly chosen from the study population. All primary cardiovascular magnetic resonance analyses were done by a single observer (B.E.) with 2 years’ experience in analysing cardiovascular imaging. The re-analysis of the imaging was done by an expert technician with over 25 years’ experience in MRI (P.v.d.B.).
Statistics
Data analysis was done using SPSS Statistics (version 24.0; IBM SPSS, Chicago, IL). Parametric data are presented as mean ± standard deviation, ordinal data and non-parametric data are presented as median (interquartile range). Patients and healthy volunteers were compared using parametric t-tests for parametric data and the Mann–Whitney U-test for non-parametric data. Correlations were calculated using the Pearson test for parametric regression and the Spearman rank test for non-parametric regression. A confidence interval of 95% was used, and p-values of <0.05 were considered to be significant. Stepwise multivariate regression analysis was performed to adjust for demographic and cardiovascular risk factors for wall shear stress. A binary logistic regression analysis was conducted to calculate the independent correlation between a history of atrioventricular septal defect and wall shear stress values. The intra- and inter-observer variations were tested using the intra-class correlation coefficient.
Results
Patient characteristics
Table 1 shows the patient and healthy volunteer characteristics. In total, 25 patients (78.1%) had a partial atrioventricular septal defect and seven patients (21.9%) had a complete atrioventricular septal defect. At our institution partial defects are repaired with a single patch and complete defects are repaired with two patches.Reference Kharbanda, Blom and Hazekamp 13 No difference in heart rate (76 ± 13 versus 70 ± 13 beats/minute, p = 0.10), pulse pressure (65.4 ± 11.7 versus 67.1 ± 9.2 mmHg, p = 0.53), stroke volume (88 ± 23 versus 89 ± 24 ml, p = 0.91), or cardiac output (6.6 (5.1–7.3) versus 6.4 (4.8–7.0) L/min, p = 0.42) was observed between patients and healthy volunteers. Left ventricular ejection fraction was significantly lower in patients compared to volunteers (55 ± 6 versus 61 ± 5%, p < 0.001). Of the 30 patients, 24 (80%) did not use any cardiac medication. One patient had an associated aortic coarctation which was corrected with an end-to-end anastomosis at the time of atrioventricular septal defect correction. This patient did not have notable wall shear stress values compared to the other patients included.
Patient characteristics

AVSD = atrioventricular septal defect; BSA = body surface area; CO = cardiac output; LV EF = left ventricular ejection fraction; SV = stroke volume.
Data are presented as mean ± standard deviation or median (interquartile range).
* p < 0.05.
Cardiovascular magnetic resonance
All cardiovascular magnetic resonance measurements are shown in Table 2. Mean velocity over the ascending aorta was decreased in patients compared to volunteers (0.53 ± 0.14 versus 0.66 ± 0.14 m/s, p < 0.001). Maximum velocity did not differ between patients and volunteers (1.23 ± 0.25 versus 1.22 ± 0.23 m/s, p = 0.93).
Imaging results

AAo = ascending aorta; LVOT = left ventricular outflow tract; WSS = wall shear stress.
Data are presented as mean ± standard deviation or median (interquartile range).
Patients showed a significantly higher mean ascending aortic wall shear stress compared to healthy volunteers (911 ± 173 versus 703 ± 154 mPa, p < 0.001). Peak wall shear stress was also found to be significantly increased in patients (1264 ± 302 versus 1009 ± 240 mPa, p = 0.001). In both groups, peak wall shear stress was detected to be on average at the same segment, namely segment 6 (5–8) versus 6 (5–8), p = 0.51), representing the outer segment of the ascending aorta. Subsequently, no significant difference was observed in distance from the end point of the ascending aorta to the location of peak wall shear stress between patients and volunteers (27 (23–38) versus 31 (25–42) mm, p = 0.20).
In patients, mean velocity in the ascending aorta was correlated with mean wall shear stress (r = 0.41, p = 0.03), and maximum velocity in the ascending aorta was correlated with both mean and peak wall shear stress (r = 0.42, p = 0.02 and r = 0.48, p = 0.008).
Binary logistic regression analysis showed mean but not peak wall shear stress to be independently associated with a history of atrioventricular septal defect (odds ratio mean wall shear stress 1.01 (1.00–1.02), p = 0.005 and peak wall shear stress 1.00 (0.99–1.00), p = 0.34).
Echocardiography
All echocardiographic data are presented in Table 2. No significant difference in diameter of the left ventricular outflow tract between patients and volunteers was found (10.5 ± 12.7 versus 11.6 ± 2.7 mm, p = 0.12). The peak velocity over the left ventricular outflow tract was higher in patients (1.5 (1.3–1.7) versus 1.2 (1.1–1.3) m/s, p < 0.001). This increased blood flow velocity over the left ventricular outflow tract was found to be well correlated with both mean and peak wall shear stress (r = 0.67, p < 0.001 and r = 0.77, p < 0.001). Multivariate regression analysis correcting for demographic and cardiovascular risk factors showed the velocity over the left ventricular outflow tract to significantly contribute to mean and peak wall shear stress (β = 0.54, p = 0.003 and β = 0.61, p < 0.001).
Intra- and inter-observer analyses
Results are presented in Table 3. Intra-observer analysis showed no significant difference in the assessment of mean wall shear stress (2.30 ± 60.55 mPa, p = 0.97), peak wall shear stress (18.0 ± 100.3 mPa, p = 0.86), or circumferential segment of peak wall shear stress (0 (0–1), p = 0.74). Strong intra-class correlations were found for re-analysis between both observations for mean and peak wall shear stress (intra-class correlation = 0.89, p < 0.001 and intra-class correlation = 0.91, p < 0.001) and circumferential segment of peak wall shear stress (intra-class correlation = 0.83, p < 0.001).
Results intra- and inter-observer analyses

WSS = wall shear stress.
Data are presented as mean ± standard deviation or median (interquartile range).
Inter-observer analysis showed no difference between the assessment of mean wall shear stress (4 ± 86 mPa, p = 0.86), peak wall shear stress (14 ± 94 mPa, p = 0.55) or circumferential segment of peak wall shear stress (0 (0–1), p = 0.64) between both observers. Moderate inter-observer correlation was found for mean wall shear stress (inter-class correlation = 0.86, p < 0.001), peak wall shear stress (inter-class correlation = 0.94, p < 0.001) and circumferential segment of peak wall shear stress (inter-class correlation = 0.48, p = 0.056).
Discussion
We evaluated blood flow characteristics in the ascending aorta in relation to left ventricular outflow tract haemodynamics in patients after atrioventricular septal defect repair using comprehensive cardiovascular magnetic resonance examinations. We showed increased ascending aortic wall shear stress in patients compared to healthy volunteers, and the increased wall shear stress to be correlated to increased blood flow velocity over the left ventricular outflow tract. These findings show the contribution of blood flow over the left ventricular outflow tract to ascending aortic haemodynamics.
Altered aortic haemodynamics in relation to left ventricular outflow tract changes
In our patient cohort increased wall shear stress was shown. Permanent increased shear stress on a vascular wall can cause intra- and extra-cellular wall changes.Reference Whitlock and Hundley 14 , Reference Lehoux and Tedgui 15 Guzzardi et al recently showed direct correlation between areas of increased wall shear stress as seen on cardiovascular magnetic resonance and pathological changes in the aortic wall in patients with bicuspid aortic valves. Increased wall shear stress was associated with decreased elastin expression, thinning of the wall muscle fibres, and increased distance between the muscle fibres.Reference Guzzardi, Barker and van Ooij 5
The increased wall shear stress in patients was correlated to increased velocities over the left ventricular outflow tract, supporting the hypothesis that altered geometry over the left ventricular outflow tract might have downstream vascular consequences. In atrioventricular septal defect patients, altered geometry of the left ventricular outflow tract is present with both an altered position and narrowing of the left ventricular outflow tract, still persisting after atrioventricular septal defect correction. This anterior placement of the aorta is possibly caused by improper wedging of the outflow tract during embryological development and the presence of a shorter ventricular septum.Reference Calkoen, Hazekamp and Blom 1 The presence of this misalignment between the aorta and the ventricular septum has been described in up to 62% of all atrioventricular septal defect patients.Reference Ebels, Meijboom and Anderson 2 , Reference Shiokawa and Becker 3 Furthermore, the compression of the left ventricular outflow tract between the ventricular septum and the fibrous posterior wall leads to a diminished diameter of the left ventricular outflow tract.Reference Ebels, Meijboom and Anderson 2 Although not significantly different between our patient cohort and healthy volunteers, we found a smaller left ventricular outflow tract diameter in patients and, more importantly, significantly increased velocities over the left ventricular outflow tract were observed, regarded as a result of the altered left ventricular outflow tract geometry.
Clinical implications
Although clinical aortic pathology after atrioventricular septal defect repair is rare,Reference Calkoen, Hazekamp and Blom 1 , Reference Ebels, Meijboom and Anderson 2 our findings are a proof of concept that altered geometry of the left ventricular outflow tract, present in many heart diseases such as transposition of the great arteries, double outlet right ventricle, and hypertrophic cardiomyopathy, leads to altered left ventricular outflow tract blood flow and may be associated with aortic vascular changes.Reference Guzzardi, Barker and van Ooij 5 , Reference Lehoux and Tedgui 15 Furthermore, the increased left ventricular outflow tract blood velocity resulting in increased wall shear stress in the ascending aorta may be a factor in the ventricular–arterial interaction and therefore be important in the follow-up of patient groups with altered position and/or geometry of the left ventricular outflow tract.Reference Grotenhuis, Aeschlimann and Hui 16 – Reference Grotenhuis, Ottenkamp and Westenberg 19
Limitations
Our relatively small sample did not show differences in left ventricular outflow tract diameter, although these findings have been described in previous studies.Reference Ebels, Meijboom and Anderson 2 In addition, all patients in our study were in good clinical condition. Furthermore, during the analyses of the wall shear stress, the placement of the horizontal planes at peak wall shear stress was done manually based on the colour-coding model, possibly leading to inter-observer variations. Although our reanalyses show strong correlation between multiple observers with non-significant differences for assessing mean and peak wall shear stress.
Conclusion
Comprehensive cardiovascular magnetic resonance revealed increased ascending aortic wall shear stress in patients after atrioventricular septal defect repair. The increase in wall shear stress was related to increased blood flow velocities over the left ventricular outflow tract, stressing that not only an abnormal aortic valve but also altered blood flow below the aortic valve can cause abnormal aortic flow in patients. These observations emphasise the need for further research on the ventricular–arterial interaction in other cardiovascular diseases with altered geometry of the left ventricular outflow tract region.
Financial Support
This research received no specific grant from any funding agency, commercial or not-for-profit sectors.
Conflicts of Interest
None.
Ethical Standards
The authors assert that all procedures contributing to this work comply with the ethical standards of the relevant national guidelines on human experimentation and with the Helsinki Declaration of 1975, as revised in 2008, and has been approved by the institutional ethical committee of the Leiden University Medical Center.


 Open access