

1. Introduction
Double chain ladder is a bridge between the chain ladder method (CLM) and mathematical statistics. Double chain ladder is modelling the full system of reported claims, their delay and the resulting claims. Bootstrapping it with or without parameter uncertainty is easy. Double chain ladder bootstrapping does not face the stability problems resulting when bootstrapping the CLM. The full model structure is the key here: bootstrapping a well-defined statistical model is simple and straightforward. The reason it is tricky to bootstrap the CLM is that only one part of the system is modelled: the aggregated paid or incurred claims. The full data-generation process is not known in classical chain ladder, and approximations have to be introduced to come up with some sort of bootstrapping. The typical assumption taken is that all adjusted residuals arise from the same distribution. But adjusted residuals on the aggregated paid data or incurred data models do not follow the same distribution. These residuals can be very close to the normal distribution and very right skewed depending on the underlying number of claims leading to this residual. Instability occurs if an unimportant right-skewed residual of little weight is reshuffled as a very important residual in the bootstrap. Double chain ladder is estimated from the exact same data structure as chain ladder. It uses triangle type of data on frequencies, paid and incurred data. Communicating the implementation and structure of double chain ladder to actuaries is therefore a simple exercise. Furthermore, double chain ladder gives – almost – the exact same reserve as chain ladder. One can therefore see double chain ladder as a more stable, better understood version of CLM with the clear advantage of being easy to generalise. When generalising or developing double chain ladder, the actuary can see any development as moving away from chain ladder. The vast amount of experience and tacit knowledge actuaries have invested in the chain ladder model is therefore directly useful when working with and interpreting double chain ladder and its extensions. In this paper we will consider double chain ladder, double chain ladder and Bornhuetter–Ferguson, incurred double chain ladder and reported but not settled (RBNS)-preserving double chain ladder, and we will give these four methods the acronyms DCL, BDCL, IDCL and PDCL. BDCL was the first published extension of DCL. It was verified that the severity inflation (inflation in cost per claim) in the underwriting year direction is the key to many of the hardest challenges of chain ladder, and it was shown that this severity inflation could be extracted from incurred data via a simple estimation trick. Replacing the paid data’s severity inflation in DCL with the incurred data’s severity inflation is the definition of BDCL. IDCL is simply defined as that severity inflation (cost per claim in the underwriting year direction) resulting exactly in the same reserves for every underwriting year as the reserve resulting from the CLM applied to incurred data. The advantage of having IDCL instead of the incurred chain ladder is similar to the advantages of having DCL instead of chain ladder given above. Finally, PDCL is one version of DCL that does not change the RBNS values. DCL was published via the three Astin Bulletin papers: Verrall et al. (Reference Schmidt and Zocher2010) and Martínez-Miranda et al. (Reference Martínez-Miranda, Nielsen and Verrall2011, Reference Martínez-Miranda, Nielsen, Nielsen and Verrall2012). BDCL was published in North American Actuarial Journal in Martínez-Miranda et al. (Reference Martínez-Miranda, Nielsen and Verrall2013b), PDCL is introduced in this British Actuarial Journal paper and IDCL was introduced in the Variance paper in Agbeko et al. (Reference Agbeko, Hiabu, Martínez-Miranda, Nielsen and Verrall2014). One could have that point of view that developments of DCL might become redundant, when full granular reserving based on micro models enter actuarial practice. While this might be true, then we believe that granular reserving should be developed in the exact same way as DCL was developed: one should be able to follow step by step how an aggregate chain ladder is changed into a granular model and developed. When progressing this way, one makes sure that the tacit knowledge and experience of actuaries, built via the CLM, is carried over to the granular data approach. We call this “the bathwater approach” to developing reserving techniques, because we do not want to throw the baby out with the bathwater and develop new methods missing important features and properties of classical methods. In section 6 below, a preliminary first approach to granular chain ladder called continuous chain ladder is described. Continuous chain ladder is a smooth structured density reflecting the fact that chain ladder could be viewed as a structured histogram. The difference between a structured smooth density and a structured histogram is just which non-parametric estimation procedure is applied. The histogram approach reproducing chain ladder or a smooth version of it called continuous chain ladder. As chain ladder itself is a granular method based on a suboptimal histogram approach, everything we develop via DCL and its extensions can indeed be viewed as granular methods with smooth continuous counterparts waiting to be formally defined.
The rest of the paper is structured as follows. Section 2 describes the data and the expert knowledge, introduces the notation and defines the model assumptions. Section 3 discusses the outstanding loss liabilities point estimates. Section 4 describes four methods to estimate the parameters in the model: DCL, BDCL, PDCL and IDCL. The validation of these four methods is considered in section 5 through a back-testing procedure. Section 6 describes the link between classical reserving and granular reserving. Section 7 provides some concluding remarks.
2. Data and First Moment Assumptions and Some Comments on Granular Data
This section describes the classical aggregated data used in most non-life insurance companies. However, in section 6 below we make it clear that working with this kind of aggregated data indeed is very closely connected to working with granular data. The resulting estimators of aggregated data are piece-wise constant or structured histograms, while the resulting estimators of continuous data are continuous and easier to optimise. Because the classical CLM is closely related to the continuous CLM, every single extension of DCL is also a contribution to granular methodology. One can – so to speak – develop the practical ideas on aggregated data and develop the continuous versions later. This paper will work on aggregated data, in the form of incremental run-off triangles, and contribute to the understanding and validation of chain ladder, but it will in particular introduce new ways of considering incurred data and expert opinion. We start by describing the data and expert knowledge extracted from incurred data, that we are going to work with. Data are aggregated incurred counts (data), aggregated payments (data) and aggregated incurred payments (expert knowledge). All of those three objects have the same structural form, i.e., they live on the upper triangle:
 $${\cal I}=\{ (i,\,j):i=1,\:\,\ldots\,\:,\,m,\,j=0,\:\,\ldots\,\:,\,m{\,\minus\,}1;\,i{\,\plus\,}j\leq m\} $$
m>1. Here, m is the number of underwriting years observed. It will be assumed that the reporting delay, that is the time from underwriting of a claim until it is reported, as well as the settlement delay, that is the delay between the report of a claim and its settlement, are bounded by m. This, in contrast to the classical CLM, will make it possible to also get estimates in the tail, that is when reporting delay plus settlement delay is greater than m. Our data can now be described as follows. The data:
Aggregated incremental incurred counts:  $$N_{{\cal I}} =\{ N_{{ik}} :(i,\,k)\in {\cal I}\} $$
, with N ik being the total number of claims of insurance incurred in year i which have been reported in year i+k, i.e., with k periods delay from year i.
$$N_{{\cal I}} =\{ N_{{ik}} :(i,\,k)\in {\cal I}\} $$
, with N ik being the total number of claims of insurance incurred in year i which have been reported in year i+k, i.e., with k periods delay from year i.
Aggregated incremental payments:  $$X_{{\cal I}} =\{ X_{{ij}} :(i,\,j)\in {\cal I}\} $$
, with X ij being the total payments from claims incurred in year i and paid with j periods delay from year i.
$$X_{{\cal I}} =\{ X_{{ij}} :(i,\,j)\in {\cal I}\} $$
, with X ij being the total payments from claims incurred in year i and paid with j periods delay from year i.
Note that the meaning of the second coordinate of triangle  $${\cal I}$$
varies between the two different data. While in the counts triangle it represents the reporting delay, in the payments triangle it represents the development delay, that is reporting delay plus settlement delay.
$${\cal I}$$
varies between the two different data. While in the counts triangle it represents the reporting delay, in the payments triangle it represents the development delay, that is reporting delay plus settlement delay.
To describe the aggregated incurred payments, we need some theoretical micro-structural descriptions. These micro-structural descriptions follow the line of Martínez-Miranda et al. (Reference Martínez-Miranda, Nielsen, Nielsen and Verrall2012) and also build the base of the forthcoming DCL assumptions.
By  $$N_{{ikl}}^{{{\rm paid}}} $$
, we will denote the number of the future payments originating from the N ik reported claims, which were finally paid with a delay of k+l, where l=0, … , m−1.
$$N_{{ikl}}^{{{\rm paid}}} $$
, we will denote the number of the future payments originating from the N ik reported claims, which were finally paid with a delay of k+l, where l=0, … , m−1.
Also, let  $$X_{{ikl}}^{{(h)}} $$
denote the individual settled payments that arise from
$$X_{{ikl}}^{{(h)}} $$
denote the individual settled payments that arise from  $$N_{{ikl}}^{{{\rm paid}}} $$
,
$$N_{{ikl}}^{{{\rm paid}}} $$
,  $$h=1,\:\,\ldots\,\:,\,N_{{ikl}}^{{{\rm paid}}} $$
. Finally, we define
$$h=1,\:\,\ldots\,\:,\,N_{{ikl}}^{{{\rm paid}}} $$
. Finally, we define
 $$X_{{ikl}} =\mathop{\sum}\limits_{h\,=\,0}^{N_{{ikl}}^{{{\rm paid}}} } X_{{ikl}}^{{(h)}} ,\quad (i,\,k)\in {\cal I},\;l=0,\:\,\ldots\,\:,\,m{\,\minus\,}1$$
that is, those payments originating from underwriting year i, which are reported after a delay of k and paid with an overall delay of k+l.
The aggregated incurred payments are then considered as unbiased estimators of  $$\mathop{\sum}\nolimits_{l\,=\,0}^{m{\,\minus\,}1} X_{{ikl}} $$
. Technically, we model the expert knowledge as follows.
$$\mathop{\sum}\nolimits_{l\,=\,0}^{m{\,\minus\,}1} X_{{ikl}} $$
. Technically, we model the expert knowledge as follows.
Expert knowledge:
Aggregated incremental incurred payments:  $$I_{{\cal I}} =\{ I_{{ik}} :(i,\,k)\in {\cal I}\} $$
, with I ik being
$$I_{{\cal I}} =\{ I_{{ik}} :(i,\,k)\in {\cal I}\} $$
, with I ik being
 $$I_{{ik}} =\mathop{\sum}\limits_{s\,=\,0}^k \mathop{\sum}\limits_{l\,=\,0}^{m{\,\minus\,}1} E[X_{{isl}} \!\mid\!{\cal F}_{{(i{\plus}k)}} ]{\,\minus\,}\mathop{\sum}\limits_{s\,=\,0}^{k{\,\minus\,}1} \mathop{\sum}\limits_{l\,=\,0}^{m{\,\minus\,}1} E[X_{{isl}} \!\mid\!{\cal F}_{{(i{\plus}k{\,\minus\,}1)}} ]$$
where  $${\cal F}_{h} $$
is an increasing filtration illustrating all the expert knowledge at calendar time h, which has influenced the case estimates.
$${\cal F}_{h} $$
is an increasing filtration illustrating all the expert knowledge at calendar time h, which has influenced the case estimates.
In this manuscript, we will only consider best estimates (or point-wise estimates) and for this we can define the DCL model just under first-order moment assumptions, i.e., assumptions on the mean. We show that the classical chain ladder multiplicative structure holds under very general underlying dependencies on the mean. For fixed i=1, … , m; k, l=0, … , m−1, and  $$h=1,\:\:\,\ldots\,\:,\,N_{{ikl}}^{{{\rm paid}}} $$
, the first-order moment conditions of the DCL model are formulated as follows:
$$h=1,\:\:\,\ldots\,\:,\,N_{{ikl}}^{{{\rm paid}}} $$
, the first-order moment conditions of the DCL model are formulated as follows:
A1 The counts, N ik, are random variables with mean having a multiplicative parametrisation  $$E[N_{{ik}} ]=\alpha _{i} \beta _{k} $$
, for given parameters
$$E[N_{{ik}} ]=\alpha _{i} \beta _{k} $$
, for given parameters  $$\alpha _{i} ,\,\beta _{j} $$
, under the identification
$$\alpha _{i} ,\,\beta _{j} $$
, under the identification  $$\mathop{\sum}\nolimits_{k\,=\,0}^{m{\,\minus\,}1} \beta _{k} =1$$
.
$$\mathop{\sum}\nolimits_{k\,=\,0}^{m{\,\minus\,}1} \beta _{k} =1$$
.
A2 The number of payments,  $$N_{{ikl}}^{{{\rm paid}}} $$
, representing the RBNS delay, are random variables with conditional mean
$$N_{{ikl}}^{{{\rm paid}}} $$
, representing the RBNS delay, are random variables with conditional mean  $$E[N_{{ikl}}^{{{\rm paid}}} \!\mid\!N_{{\cal I}} ]=N_{{ik}} \tilde{\pi }_l$$
, for given parameters
$$E[N_{{ikl}}^{{{\rm paid}}} \!\mid\!N_{{\cal I}} ]=N_{{ik}} \tilde{\pi }_l$$
, for given parameters  $$\tilde{\pi }_l$$
.
$$\tilde{\pi }_l$$
.
A3 The individual payments sizes  $$X_{{ikl}}^{{(h)}} $$
are random variables whose mean conditional on the number of payments and the counts is given by
$$X_{{ikl}}^{{(h)}} $$
are random variables whose mean conditional on the number of payments and the counts is given by  $$E[X_{{ikl}}^{{(h)}} \!\mid\!N_{{ikl}}^{{{\rm paid}}} ,\,N_{{\cal I}} ]=\tilde{\mu }_{{kl}} \gamma _{i} $$
, for given parameters
$$E[X_{{ikl}}^{{(h)}} \!\mid\!N_{{ikl}}^{{{\rm paid}}} ,\,N_{{\cal I}} ]=\tilde{\mu }_{{kl}} \gamma _{i} $$
, for given parameters  $\tilde{\mu }_{{kl}} ,\,\gamma _{i} $
.
$\tilde{\mu }_{{kl}} ,\,\gamma _{i} $
.
Assumption A1 is the classical chain ladder assumption applied on the counts triangle (see also Mack, Reference Mack1991). The main point hereby is the multiplicativity between underwriting year and reporting delay. Assumptions A2 and A3 are necessary to connect reporting delay, settlement delay and development delay – the main idea of DCL (see also Verrall et al., Reference Schmidt and Zocher2010; Martínez-Miranda et al., Reference Martínez-Miranda, Nielsen and Verrall2011, Reference Martínez-Miranda, Nielsen, Nielsen and Verrall2012).
Note that the observed aggregated payments can be written as
 $$X_{{ij}} =\mathop{\sum}\limits_{l\,=\,0}^j X_{{i,j{\,\minus\,}l,l}} =\mathop{\sum}\limits_{l\,=\,0}^j \mathop{\sum}\limits_{h\,=\,1}^{N_{{i,j{\,\minus\,}l,l}}^{{{\rm paid}}} } X_{{i,j{\,\minus\,}l,l}}^{{(h)}} $$
And then, using assumptions A1–A3, we can derive the mean of the aggregated payments conditional to the counts as follows:
 $$\eqalign{ E[X_{{ij}} \!\mid\!N_{{\cal I}} ]&= E\left[ {\mathop{\sum}\limits_{l\,=\,0}^j \mathop{\sum}\limits_{h=1}^{N_{{i,j{\,\minus\,}l,l}}^{{{\rm paid}}} } X_{{i,j{\,\minus\,}l,l}}^{{(h)}} \!\mid\!N_{{\cal I}} } \right] = \mathop{\sum}\limits_{l\,=\,0}^j E\left[ {\mathop{\sum}\limits_{h\,=\,1}^{N_{{i,j{\,\minus\,}l,l}}^{{{\rm paid}}} } E\bigg[X_{{i,\,j{\,\minus\,}l,l}}^{{(h)}} \!\mid\! N_{{\cal I}} ,\,N_{{i,\,j{\,\minus\,}l,l}}^{{{\rm paid}}} \bigg]\!\mid\!N_{{\cal I}} } \right] \cr&= \mathop{\sum}\limits_{l\,=\,0}^j E\bigg[N_{{i,j{\,\minus\,}l,l}}^{{{\rm paid}}} \tilde{\mu }_{{j{\,\minus\,}l,l}} \gamma _{i} \!\mid\!N_{{\cal I}} \bigg] = \gamma _{i} \mathop{\sum}\limits_{l\,=\,0}^j N_{{i,j{\,\minus\,}l}} \tilde{\pi }_{l} \tilde{\mu }_{{j{\,\minus\,}l,l}} $$
Thus, the unconditional mean is given by
 $$E[X_{{ij}} ]=\alpha _{i} \gamma _{i} \mathop{\sum}\limits_{l\,=\,0}^j \beta _{{j{\,\minus\,}l}} \tilde{\mu }_{{j{\,\minus\,}l,l}} \tilde{\pi }_{l} $$
Martínez-Miranda et al. (Reference Martínez-Miranda, Nielsen, Nielsen and Verrall2012) discussed how to estimate the parameters in the model using the triangles  $X_{{\cal I}} $
and
$X_{{\cal I}} $
and  $N_{{\cal I}} $
. To this goal they introduce the restriction
$N_{{\cal I}} $
. To this goal they introduce the restriction  $$\tilde{\mu }_{{k,l}} =\tilde{\mu }_{l} $$
to identify the parameters. With such simplification we define
$$\tilde{\mu }_{{k,l}} =\tilde{\mu }_{l} $$
to identify the parameters. With such simplification we define
 $$\mu =\mathop{\sum}\limits_{l\,=\,0}^{m{\,\minus\,}1} \tilde{\pi }_{l} \tilde{\mu }_{l} $$
and  $\pi _{l} =\tilde{\pi }_{l} \tilde{\mu }_{l} \mu ^{{{\,\minus}1}} $
, so that
$\pi _{l} =\tilde{\pi }_{l} \tilde{\mu }_{l} \mu ^{{{\,\minus}1}} $
, so that  $$\mu \pi _{l} =\tilde{\mu }_{l} \tilde{\pi }_{l} $$
and therefore the unconditional mean of the payments becomes
$$\mu \pi _{l} =\tilde{\mu }_{l} \tilde{\pi }_{l} $$
and therefore the unconditional mean of the payments becomes
 $$E[X_{{ij}} ]=\alpha _{i} \gamma _{i} \mu \mathop{\sum}\limits_{l\,=\,0}^j \beta _{{j{\,\minus\,}l}} \pi _{l} $$
Equation (4) is the key in deriving the outstanding loss liabilities. These are the values of X ij in the lower triangle and the tail (i.e. for i=1, … , m; j=1, … , 2m−1; i+j≥m+1). In the sequel we will write all the DCL parameters, i.e., the parameters involved in the DCL model, as
 $$(\alpha ,\,\beta ,\,\pi ,\,\gamma ,\,\mu )=(\alpha _{1} ,\:\,\ldots\,\:,\,\alpha _{m} ,\,\beta _{0} ,\:\,\ldots\,\:,\,\beta _{{m{\,\minus\,}1}} ,\,\pi _{0} ,\:\,\ldots\,\:,\,\pi _{{m{\,\minus\,}1}} ,\,\gamma _{1} ,\:\,\ldots\,\:,\,\gamma _{m} ,\,\mu )$$
In the next section, we will see that in a very natural way, we are able to distinguish between RBNS and incurred but not reported (IBNR) claims. This is possible due to the separation of the development delay into the reporting delay, β, and the settlement delay, π.
3. Forecasting Outstanding Claims: The RBNS and IBNR Reserves
To produce outstanding claims forecasts under the DCL model we need to estimate the DCL parameters. Section 4 below is devoted to this issue. In this section, we assume that the DCL parameters (α, β, π, γ, μ) have been already estimated by  $$(\hat{\alpha },\,\hat{\beta },\,\hat{\pi },\,\hat{\gamma },\,\hat{\mu })$$
, and show how easily point forecasts of the RBNS and IBNR components of the reserve can be calculated. Using the notation of Verrall et al. (Reference Schmidt and Zocher2010) and Martínez-Miranda et al. (Reference Martínez-Miranda, Nielsen and Verrall2011), we consider predictions over the triangles illustrated in Figure 1:
$$(\hat{\alpha },\,\hat{\beta },\,\hat{\pi },\,\hat{\gamma },\,\hat{\mu })$$
, and show how easily point forecasts of the RBNS and IBNR components of the reserve can be calculated. Using the notation of Verrall et al. (Reference Schmidt and Zocher2010) and Martínez-Miranda et al. (Reference Martínez-Miranda, Nielsen and Verrall2011), we consider predictions over the triangles illustrated in Figure 1:
 $${\cal J}_{1} =\{ i=2,\:\,\ldots\,\:,\,m;\,j=1,\:\,\ldots\,\:,\,m{\,\minus\,}1\,{\rm with}\,i{\plus}j\geq m{\plus}1\} $$
 $${\cal J}_{2} =\{ i=1,\:\,\ldots\,\:,\,m;\,j=m,\:\,\ldots\,\:,\,2m{\,\minus\,}1\,{\rm with}\,i{\plus}j\leq 2m{\,\minus\,}1\} $$
 $${\cal J}_{3} =\{ i=2,\:\,\ldots\,\:,\,m;\,j=m,\:\,\ldots\,\:,\,2m{\,\minus\,}1\,{\rm with}\,i{\plus}j\geq 2m\} $$
Index sets for aggregate claims data, assuming a maximum delay m−1

The classical CLM produces forecasts over only  $${\cal J}_{1} $$
. So, if the CLM is being used, it is necessary to construct tail factors in some way. For example, this is sometimes done by assuming that the run-off will follow a set shape, thereby making it possible to extrapolate the development factors. In contrast, under the DCL model it is possible to provide also the tail over
$${\cal J}_{1} $$
. So, if the CLM is being used, it is necessary to construct tail factors in some way. For example, this is sometimes done by assuming that the run-off will follow a set shape, thereby making it possible to extrapolate the development factors. In contrast, under the DCL model it is possible to provide also the tail over  $${\cal J}_{2} {\cup}{\cal J}_{3} $$
, just by using the underlying assumptions about the development.
$${\cal J}_{2} {\cup}{\cal J}_{3} $$
, just by using the underlying assumptions about the development.
Following Martínez-Miranda et al. (Reference Martínez-Miranda, Nielsen, Nielsen and Verrall2012), we calculate the forecasts using the expression for the mean of the aggregated payments derived in (4) and replacing the unknown DCL parameters by their estimates. Note that the RBNS component arises from claims reported in the past and therefore, as Martínez-Miranda et al. (Reference Martínez-Miranda, Nielsen, Nielsen and Verrall2012) discuss, it is possible to calculate the forecasts using the true observed value N ik instead of their chain ladder estimates,  $$\hat{\alpha }_{i} ,\,\hat{\beta }_{k} $$
, which are involved in the formulae (4). However, for the IBNR reserves, this is not possible as those values arise from claims reported in the future and then it is necessary to use all DCL parameters.
$$\hat{\alpha }_{i} ,\,\hat{\beta }_{k} $$
, which are involved in the formulae (4). However, for the IBNR reserves, this is not possible as those values arise from claims reported in the future and then it is necessary to use all DCL parameters.
From these comments we define the RBNS component as follows, where we consider two possibilities depending on whether the estimates of N ik are used or not:
 $$\hat{X}_{{ij}}^{{{\rm RBNS}(1)}} =\mathop{\sum}\limits_{l\,=\,i{\,\minus\,}m{\plus}j}^j N_{{i,j{\,\minus\,}l}} \hat{\pi }_{l} \hat{\mu }\hat{\gamma }_{i} ,\quad (i,\,j)\in {\cal J}_{1} {\cup}{\cal J}_{2} $$
and
 $$\hat{X}_{{ij}}^{{{\rm RBNS}(2)}} =\mathop{\sum}\limits_{l\,=\,i{\,\minus\,}m{\plus}j}^j \hat{N}_{{i,j{\,\minus\,}l}} \hat{\pi }_{l} \hat{\mu }\hat{\gamma }_{i} ,\quad (i,\,j)\in {\cal J}_{1} {\cup}{\cal J}_{2} $$
where  $$\hat{N}_{{ik}} =\hat{\alpha }_{i} \hat{\beta }_{k} $$
. In most cases, to shorten the notation, we will simply write
$$\hat{N}_{{ik}} =\hat{\alpha }_{i} \hat{\beta }_{k} $$
. In most cases, to shorten the notation, we will simply write  $$\hat{X}_{{ij}}^{{{\rm RBNS}}} $$
for the RBNS estimates. However, whenever it is necessary, we will state which version is taken. The IBNR component always needs all DCL parameters and it is calculated always as follows:
$$\hat{X}_{{ij}}^{{{\rm RBNS}}} $$
for the RBNS estimates. However, whenever it is necessary, we will state which version is taken. The IBNR component always needs all DCL parameters and it is calculated always as follows:
 $$\hat{X}_{{ij}}^{{{\rm IBNR}}} =\mathop{\sum}\limits_{l\,=\,0}^{i{\,\minus\,}m{\plus}j{\,\minus\,}1} \hat{N}_{{i,j{\,\minus\,}l}} \hat{\pi }_{l} \hat{\mu }\hat{\gamma }_{i} ,\quad (i,\,j)\in {\cal J}_{1} {\cup}{\cal J}_{2} {\cup}{\cal J}_{3} $$
By adding up the RBNS and IBNR components we have the outstanding loss liabilities point-wise forecasts, which spread out on the forecasting sets  $${\cal J}_{1} {\cup}{\cal J}_{2} {\cup}{\cal J}_{3} $$
as follows:
$${\cal J}_{1} {\cup}{\cal J}_{2} {\cup}{\cal J}_{3} $$
as follows:
 $$\hat{X}_{{ij}} =\left\{ {\matrix{ {\hat{X}_{{ij}}^{{{\rm RBNS}}} {\plus}\hat{X}_{{ij}}^{{{\rm IBNR}}} } \hfill & {\quad {\rm if}\;(i,\,j)\in {\cal J}_{1} {\cup}{\cal J}_{2} } \hfill \cr {\hat{X}_{{ij}}^{{{\rm IBNR}}} } \hfill & {\quad {\rm if}\;(i,\,j)\in {\cal J}_{3} } \hfill \cr } } \right.$$
The outstanding liabilities per accident year are the row sums of forecasts  $$\hat{X}_{{ij}} $$
above. For a fixed i, we write
$$\hat{X}_{{ij}} $$
above. For a fixed i, we write  $${\cal J}_{a} (i)=\{ j:(i,\,j)\in {\cal J}_{a} \} ,\,a=1,\,2,\,3$$
. Then the outstanding liabilities per accident year i=1, … , m are
$${\cal J}_{a} (i)=\{ j:(i,\,j)\in {\cal J}_{a} \} ,\,a=1,\,2,\,3$$
. Then the outstanding liabilities per accident year i=1, … , m are
 $$\hat{R}_{i} =\mathop{\sum}\limits_{j\,\in\, {\cal J}_{1} (i){\cup}{\cal J}_{2} (i)} \hat{X}_{{ij}}^{{{\rm RBNS}}} {\plus}\mathop{\sum}\limits_{j\,\in \,{\cal J}_{1} (i){\cup}{\cal J}_{2} (i){\cup}{\cal J}_{3} (i)} \hat{X}_{{ij}}^{{{\rm IBNR}}} $$
4. Estimation of the Parameters in the DCL Model
In the previous section we have described how to estimate the outstanding claims and thereby construct RBNS and IBNR reserves once the DCL parameters have been estimated. Now we describe how to get suitable estimators for the DCL parameters. Specifically, we are going to explore four different estimations methods, all of them based on the chain ladder algorithm.
4.1. The DCL Method
The DCL method is the simplest method to derive the parameters in the DCL model. It is the original method proposed by Martínez-Miranda et al. (Reference Martínez-Miranda, Nielsen, Nielsen and Verrall2012), which makes the following additional assumption on the payments triangle  $$X_{{\cal I}} $$
:
$$X_{{\cal I}} $$
:
B1 The payments X ij, with i=1, … , m and j=0, … , m, are random variables with mean having a multiplicative parametrisation:
 $$E[X_{{ij}} ]=\tilde{\alpha }_{i} \tilde{\beta }_{j} ,\quad \quad \mathop{\sum}\limits_{j\,=\,0}^{m{\,\minus\,}1} \tilde{\beta }_{j} =1$$
Then, merging the previously derived expression (4) and the above (10), we have that
 $$\alpha _{i} \gamma _{i} \mu \mathop{\sum}\limits_{l\,=\,0}^j \beta _{{j{\,\minus\,}l}} \pi _{l} =\tilde{\alpha }_{i} \tilde{\beta }_{j} $$
and then the DCL parameters can be identified from the chain ladder parameters,  $$\tilde{\alpha }_{i} ,\,\tilde{\beta }_{j} $$
, using the following equations:
$$\tilde{\alpha }_{i} ,\,\tilde{\beta }_{j} $$
, using the following equations:
 $$\alpha _{i} \mu \gamma _{i} =\tilde{\alpha }_{i} $$
 $$\mathop{\sum}\limits_{l\,=\,0}^j \beta _{{j{\,\minus\,}l}} \pi _{l} =\tilde{\beta }_{j} $$
Even though many other micro-structure formulations might exist, the above model can be considered as a detailed specification of the classical chain ladder. Martínez-Miranda et al. (Reference Martínez-Miranda, Nielsen, Nielsen and Verrall2012) discuss that if the RBNS component is estimated using (6), DCL completely replicates the results of CLM applied to the aggregated payments triangle. Thus, from the above two equations we can see how the underwriting and development chain ladder components are decomposed into separate components, which capture the separate sources of delay inherent in the way claims emerge and the severity specification.
Now, the main idea to derive the DCL parameters is to estimate the chain ladder parameters  $$(\hat{\alpha },\,\hat{\beta })$$
and
$$(\hat{\alpha },\,\hat{\beta })$$
and  $$(\hat{\tilde{\alpha }},\,\hat{\tilde{\beta }})$$
(cf. A1, B1) by applying the classical chain ladder algorithm on the counts triangle
$$(\hat{\tilde{\alpha }},\,\hat{\tilde{\beta }})$$
(cf. A1, B1) by applying the classical chain ladder algorithm on the counts triangle  $$N_{{\cal I}} $$
and the payments triangle
$$N_{{\cal I}} $$
and the payments triangle  $$X_{{\cal I}} $$
, respectively. Afterwards, the remaining DCL parameters, this is
$$X_{{\cal I}} $$
, respectively. Afterwards, the remaining DCL parameters, this is  $$(\hat{\gamma },\,\hat{\mu },\,\hat{\pi })$$
, can be calculated by simple algebra using (11) and (12).
$$(\hat{\gamma },\,\hat{\mu },\,\hat{\pi })$$
, can be calculated by simple algebra using (11) and (12).
For illustration of the chain ladder algorithm, we assume an incremental triangle (C ij) (in our case this would be  $$N_{{\cal I}} $$
or
$$N_{{\cal I}} $$
or  $$X_{{\cal I}} $$
), and that we want to estimate its chain ladder parameters
$$X_{{\cal I}} $$
), and that we want to estimate its chain ladder parameters  $$(\hat{\bar{\alpha }},\,\hat{\bar{\beta }})$$
. To apply the chain ladder algorithm, one has to transform the triangle (C ij) into a cumulative triangle (D ij):
$$(\hat{\bar{\alpha }},\,\hat{\bar{\beta }})$$
. To apply the chain ladder algorithm, one has to transform the triangle (C ij) into a cumulative triangle (D ij):
 $$D_{{ij}} =\mathop{\sum}\limits_{k\,=\,1}^j C_{{ik}} $$
Then, the chain ladder algorithm can be applied on (D ij). It will produce estimates of development factors, λ j, j=1, 2, … , m−1, which can be described by
 $$\hat{\lambda }_{j} ={{\mathop{\sum}\nolimits_{i\,=\,1}^{n{\,\minus\,}j{\plus}1} {D_{{ij}} } } \over {\mathop{\sum}\nolimits_{i\,=\,1}^{n{\,\minus\,}j{\plus}1} {D_{{i,j{\,\minus\,}1}} } }}$$
These development factors can be converted into estimates of  $$(\bar{\alpha },\,\bar{\beta })$$
using the following identities, which were derived in Verrall (Reference Verrall, Nielsen and Jessen1991):
$$(\bar{\alpha },\,\bar{\beta })$$
using the following identities, which were derived in Verrall (Reference Verrall, Nielsen and Jessen1991):
 $$\eqalignno{ & \hat{\bar{\beta }}_{0} ={1 \over {\prod\nolimits_{l\,=\,1}^{m{\,\minus\,}1} {\hat{\lambda }_{l} } }} \cr\hat{\bar{\beta }}_{j} ={{\hat{\lambda }_{j} {\,\minus\,}1} \over {\prod\nolimits_{l\,=\,j}^{m{\,\minus\,}1} {\hat{\lambda }_{l} } }} \cr\hat{\bar{\alpha }}_{i} =\mathop{\sum}\limits_{j\,=\,0}^{m{\,\minus\,}i} C_{{ij}} \prod\limits_{j\,=\,m{\,\minus\,}i{\plus}1}^{m{\,\minus\,}1} \hat{\lambda }_{j} $$
Alternatively, analytical expressions for the estimators can also be derived directly (rather than using the chain ladder algorithm), and further details can be found in Kuang et al. (Reference Kuang, Nielsen and Nielsen2009).
Once the chain ladder parameters  $$(\hat{\alpha },\,\hat{\beta })$$
and
$$(\hat{\alpha },\,\hat{\beta })$$
and  $$(\hat{\tilde{\alpha }},\,\hat{\tilde{\beta }})$$
are derived, the settlement delay parameter, π, can be estimated just by solving the following linear system:
$$(\hat{\tilde{\alpha }},\,\hat{\tilde{\beta }})$$
are derived, the settlement delay parameter, π, can be estimated just by solving the following linear system:
 $$\left( {\matrix{ {\hat{\tilde{\beta }}_{0} } \cr \vdots \cr \vdots \cr {\hat{\tilde{\beta }}_{{m{\,\minus\,}1}} } \cr } } \right)=\left( {\matrix{ {\hat{\beta }_{0} } & 0 & \cdots & 0 \cr {\hat{\beta }_{1} } & {\hat{\beta }_{0} } & \ddots & 0 \cr \vdots & \ddots & \ddots & 0 \cr {\hat{\beta }_{{m{\,\minus\,}1}} } & \cdots & {\hat{\beta }_{1} } & {\hat{\beta }_{0} } \cr } } \right)\left( {\matrix{ {\pi _{0} } \cr \vdots \cr \vdots \cr {\pi _{{m{\,\minus\,}1}} } \cr } } \right)$$
Let  $$\hat{\pi }$$
denote the solution of (13).
$$\hat{\pi }$$
denote the solution of (13).
Now we consider the estimation of the parameters involved in the means of individual payments. The model is technically over-parametrised as there are too many inflation parameters in (11). The simplest way to ensure identifiability is to set γ 1=1, and then the estimate of μ,  $$\hat{\mu }$$
, can be obtained from
$$\hat{\mu }$$
, can be obtained from
 $$\hat{\mu }={{\hat{\tilde{\alpha }}_{1} } \over {\hat{\alpha }_{1} }}$$
Using  $$\hat{\mu }$$
, the remaining estimates for γ i, i=2, … , m are directly derived from (11).
$$\hat{\mu }$$
, the remaining estimates for γ i, i=2, … , m are directly derived from (11).
The DCL estimation procedure described above has been implemented in the R package DCL created by Martínez-Miranda et al. (Reference Martínez-Miranda, Nielsen and Verrall2013c). Using this software, we have derived Table 1, which shows the values of  $$\hat{\alpha }$$
,
$$\hat{\alpha }$$
,  $$\hat{\beta }$$
,
$$\hat{\beta }$$
,  $$\hat{\pi }$$
and
$$\hat{\pi }$$
and  $$\hat{\gamma }$$
, calculated from a real data set included also in the DCL package.
$$\hat{\gamma }$$
, calculated from a real data set included also in the DCL package.
Double Chain Ladder (DCL) Parameter Estimates Derived by the DCL Method

4.2. Bornhuetter–Ferguson and Double Chain Ladder: The BDCL Method
The chain ladder and Bornhuetter–Ferguson (BF) methods are among the easiest claim reserving methods and, due to their simplicity, they are two of the most commonly used techniques in practice. Some recent papers on the BF method include Verrall (Reference Verrall2004), Mack (Reference Mack2008), Schmidt & Zocher (Reference Verrall2008), Alai et al. (Reference Alai, Merz and Wüthrich2009) and Alai et al. (Reference Alai, Merz and Wüthrich2010). The BF method introduced by Bornhuetter & Ferguson (Reference Bornhuetter and Ferguson1972) aims to address one of the well-known weaknesses of CLM, which is the effect outliers can have on the estimates of outstanding claims. Especially, the most recent underwriting years are the years with nearly no data and thus very sensitive to outliers. However, these recent underwriting years build the very major part of the outstanding claims. Hence, the CLM estimates of the outstanding liabilities might differ fatally from the true (unknown) values.
Acknowledging this problem, the BF method incorporates prior knowledge from experts and is therefore more robust than the CLM method, which relies completely on the data contained in the run-off triangle  $$X_{{\cal I}} $$
.
$$X_{{\cal I}} $$
.
In this section, we briefly summarise the BDCL method introduced in Martínez-Miranda et al. (Reference Martínez-Miranda, Nielsen and Verrall2013b), which mimics BF in the framework of DCL. The BDCL method starts with identical steps as DCL but instead of using the estimate of the inflation parameters, γ and μ, from the triangle of paid claims,  $$X_{{\cal I}} $$
, it deploys expert knowledge in the form of the incurred triangle,
$$X_{{\cal I}} $$
, it deploys expert knowledge in the form of the incurred triangle,  $$I_{{\cal I}} $$
, to adjust the estimation of the sensitive inflation parameter, γ. This is done as follows. First we show that
$$I_{{\cal I}} $$
, to adjust the estimation of the sensitive inflation parameter, γ. This is done as follows. First we show that
 $$E[I_{{ik}} ]=\tilde{\alpha }_{i} \beta _{k} $$
From the definition of I ik in equation (1) we have that
 $$E[I_{{ik}} ]=\mathop{\sum}\limits_{l\,=\,0}^{m{\,\minus\,}1} E[X_{{ikl}} ]=\mathop{\sum}\limits_{l\,=\,0}^{m{\,\minus\,}1} E\left[ {\mathop{\sum}\limits_{h\,=\,0}^{N_{{ikl}}^{{{\rm paid}}} } X_{{ikl}}^{{(h)}} } \right]$$
Now we use Wald’s identity and assumptions A1–A3 to deduce that
 $$E[I_{{ik}} ]=\mathop{\sum}\limits_{l\,=\,0}^{m{\,\minus\,}1} E\left[ {N_{{ikl}}^{{{\rm paid}}} } \right]E\left[ {X_{{ikl}}^{{(h)}} } \right]=\mathop{\sum}\limits_{l\,=\,0}^{m{\,\minus\,}1} \alpha _{i} \beta _{k} \tilde{\pi }_{l} \tilde{\mu }_{{kl}} \gamma _{i} =\alpha _{i} \mu \gamma _{i} \beta _{k} =\tilde{\alpha }_{i} \beta _{k} $$
where we have assumed that  $${\tilde\mu_{kl}} ={\tilde\mu_{l}}$$
and substituted
$${\tilde\mu_{kl}} ={\tilde\mu_{l}}$$
and substituted  $$\mu =\mathop{\sum}\nolimits_{l\,=\,0}^{m{\,\minus\,}1} {\tilde\mu_{kl}} \tilde{\pi }_{l} $$
as it was defined in (3). Hence, the incurred triangle,
$$\mu =\mathop{\sum}\nolimits_{l\,=\,0}^{m{\,\minus\,}1} {\tilde\mu_{kl}} \tilde{\pi }_{l} $$
as it was defined in (3). Hence, the incurred triangle,  $$I_{{\cal I}} $$
, has multiplicative mean and its underwriting year factor,
$$I_{{\cal I}} $$
, has multiplicative mean and its underwriting year factor,  $$\tilde{\alpha }$$
, is identical to the one of the payments triangle,
$$\tilde{\alpha }$$
, is identical to the one of the payments triangle,  $$X_{{\cal I}} $$
(cf. (10)). However, its estimation is less sensitive to outliers as it incorporates all incurred claims via expert knowledge. We conclude that we can replace the payments triangle by the incurred payments triangle when we calculate estimates of the inflation parameters, γ, μ, in (11). Note that the severity mean, μ, is going to remain the same as the first rows of
$$X_{{\cal I}} $$
(cf. (10)). However, its estimation is less sensitive to outliers as it incorporates all incurred claims via expert knowledge. We conclude that we can replace the payments triangle by the incurred payments triangle when we calculate estimates of the inflation parameters, γ, μ, in (11). Note that the severity mean, μ, is going to remain the same as the first rows of  $X_{{\cal I}} $
and
$X_{{\cal I}} $
and  $$I_{{\cal I}} $$
are identical.
$$I_{{\cal I}} $$
are identical.
Summarised, the BDCL method can be carried out as follows.
∙ Step 1: parameter estimation.
Estimate the DCL parameters (α, β, π, γ, μ) using the DCL method of section 4.1 with the data in the triangles
 $$N_{{\cal I}} $$
and
$$X_{{\cal I}} $$
and denote the parameter estimates by
$$(\hat{\alpha },\,\hat{\beta },\,\hat{\pi },\,\hat{\gamma },\,\hat{\mu })$$
.
$$N_{{\cal I}} $$
and
$$X_{{\cal I}} $$
and denote the parameter estimates by
$$(\hat{\alpha },\,\hat{\beta },\,\hat{\pi },\,\hat{\gamma },\,\hat{\mu })$$
.Repeat this estimation using the DCL method but replacing the triangle of paid claims,
$$X_{{\cal I}} $$
, by the triangle of incurred data,
$$I_{{\cal I}} $$
. Keep only the resulting estimated inflation parameters, denoted by
$$\hat{\gamma }^{{{\rm BDCL}}} $$
.∙ Step 2: BF adjustment.
Replace the inflation parameters
$$\hat{\gamma }$$
from the paid data by the estimate from the incurred triangle,
$$\hat{\gamma }^{{{\rm BDCL}}} $$
.


From these two steps, the final BDCL estimates of the DCL parameters are  $$\hat{\alpha }$$
,
$$\hat{\alpha }$$
,  $$\hat{\beta }$$
,
$$\hat{\beta }$$
,  $$\hat{\pi }$$
,
$$\hat{\pi }$$
,  $$\hat{\gamma }^{{{\rm BDCL}}} $$
and
$$\hat{\gamma }^{{{\rm BDCL}}} $$
and  $$\hat{\mu }$$
.
$$\hat{\mu }$$
.
Again, using the R package DCL, we can derive the Figure 2 that shows the severity inflation estimates derived by DCL and BDCL. BDCL, with the incorporated expert knowledge, seems to stabilise the severity inflation in the most recent underwriting years while keeping the values in the other years. The result is a more realistic estimate correcting the DCL parameter  $$\hat{\gamma }_{i} $$
exactly in its weakest point, that is in those years where the payments triangle,
$$\hat{\gamma }_{i} $$
exactly in its weakest point, that is in those years where the payments triangle,  $$X_{{\cal I}} $$
, has nearly no data. Again, those recent underwriting years contain the very major part of the outstanding liabilities.
$$X_{{\cal I}} $$
, has nearly no data. Again, those recent underwriting years contain the very major part of the outstanding liabilities.
Plot of severity inflation estimates. Double chain ladder (DCL):  $$\hat{\gamma }_{i} $$
(red), double chain ladder and Bornhuetter–Ferguson (BDCL):
$$\hat{\gamma }_{i} $$
(red), double chain ladder and Bornhuetter–Ferguson (BDCL):  $$\hat{\gamma }_{i}^{{{\rm BDCL}}} $$
(green)
$$\hat{\gamma }_{i}^{{{\rm BDCL}}} $$
(green)
4.3. The PDCL Method
In the previous section, we have described a method that incorporates expert knowledge in form of the incurred triangle,  $$I_{{\cal I}} $$
. The values in
$$I_{{\cal I}} $$
. The values in  $$I_{{\cal I}} $$
arise from case estimates for RBNS claims, developed in the case department of the insurance company and claims which are already paid. Thus, if one subtracts these already paid claims (which are given via the payments triangle
$$I_{{\cal I}} $$
arise from case estimates for RBNS claims, developed in the case department of the insurance company and claims which are already paid. Thus, if one subtracts these already paid claims (which are given via the payments triangle  $$X_{{\cal I}} $$
) from the incurred triangle, one can reconstruct the RBNS case estimates. However, as soon as this is done, it is obvious that these RBNS case estimates do not match with the RBNS estimates (5) and (6), using any DCL method (including BDCL). We conclude that the reserve department, using DCL (and also chain ladder), calculates different RBNS estimates than those given by the case department. If this difference is huge, consultation between the case department and reserve department is necessary. The case department possesses expert knowledge on every single claim that is reported and they can use that knowledge of the claims in conjunction with their expertise to improve estimation. Below we introduce an alternative reserving method preserving the RBNS estimates given by the case department. We call this method RBNS-PDCL.
$$X_{{\cal I}} $$
) from the incurred triangle, one can reconstruct the RBNS case estimates. However, as soon as this is done, it is obvious that these RBNS case estimates do not match with the RBNS estimates (5) and (6), using any DCL method (including BDCL). We conclude that the reserve department, using DCL (and also chain ladder), calculates different RBNS estimates than those given by the case department. If this difference is huge, consultation between the case department and reserve department is necessary. The case department possesses expert knowledge on every single claim that is reported and they can use that knowledge of the claims in conjunction with their expertise to improve estimation. Below we introduce an alternative reserving method preserving the RBNS estimates given by the case department. We call this method RBNS-PDCL.
The first step is to construct a preliminary square (S ij), i=1, … , m, j=0, … , m−1, which will yield new estimates for the DCL parameters. The upper triangle of the square (i.e.  $$(i,\,j)\in {\cal I}$$
) should have the same entries as the payments triangle
$$(i,\,j)\in {\cal I}$$
) should have the same entries as the payments triangle  $$(X_{{ij}} )$$
. The lower triangle (i.e.
$$(X_{{ij}} )$$
. The lower triangle (i.e.  $$(i,\,j)\in {\cal J}_{1} $$
) should consist of preliminary estimates of the outstanding loss liabilities. The outstanding loss liabilities comprise an RBNS and an IBNR part (cf. (8)). However, we only want to estimate the IBNR component of these outstanding loss liabilities while taking the RBNS case estimates as the RBNS component. More precisely, we do the following. We take the BDCL parameter estimates
$$(i,\,j)\in {\cal J}_{1} $$
) should consist of preliminary estimates of the outstanding loss liabilities. The outstanding loss liabilities comprise an RBNS and an IBNR part (cf. (8)). However, we only want to estimate the IBNR component of these outstanding loss liabilities while taking the RBNS case estimates as the RBNS component. More precisely, we do the following. We take the BDCL parameter estimates  $$(\hat{\alpha },\,\hat{\beta },\,\hat{\pi },\,\hat{\gamma }^{{{\rm BDCL}}} ,\,\hat{\mu })$$
and use these parameters to estimate the RBNS component
$$(\hat{\alpha },\,\hat{\beta },\,\hat{\pi },\,\hat{\gamma }^{{{\rm BDCL}}} ,\,\hat{\mu })$$
and use these parameters to estimate the RBNS component  $$(\hat{X}_{{ij}}^{{{\rm RBNS}}} )$$
and IBNR component
$$(\hat{X}_{{ij}}^{{{\rm RBNS}}} )$$
and IBNR component  $$(\hat{X}_{{ij}}^{{{\rm IBNR}}} )$$
using (6) and (7). As mentioned above, we want the RBNS estimate to be equal to the RBNS case estimates, which can only be reconstructed per accident year. For i=1, … , m, they can be described as
$$(\hat{X}_{{ij}}^{{{\rm IBNR}}} )$$
using (6) and (7). As mentioned above, we want the RBNS estimate to be equal to the RBNS case estimates, which can only be reconstructed per accident year. For i=1, … , m, they can be described as
 $$X_{i}^{{{\rm RBNS}{\rm .case}{\rm .estimate}}} =\mathop{\sum}\limits_{j\,=\,0}^{m{\,\minus\,}i} I_{{ij}} {\,\minus\,}\mathop{\sum}\limits_{j\,=\,0}^{m{\,\minus\,}i} X_{{ij}} $$
Hence, we define the RBNS-preserving components
 $$\hat{X}_{{ij}}^{{{\rm RBNS}{\rm .pres}}} ={{X_{i}^{{{\rm RBNS}{\rm .case}{\rm .estimate}}} } \over {\mathop{\sum}\sidelimits_{j\,\in\, {\cal J}_{1} (i){\cup}{\cal J}_{2} (i)} {\hat{X}_{{ij}}^{{{\rm RBNS}}} } }}\;\hat{X}_{{ij}}^{{{\rm RBNS}}} $$
which verifies that
 $$\mathop{\sum}\limits_{j\,\in\, {\cal J}_{1} (i){\cup}{\cal J}_{2} (i)} \hat{X}_{{ij}}^{{{\rm RBNS}{\rm .pres}}} =X_{i}^{{{\rm RBNS}{\rm .case}{\rm .estimate}}} $$
Thus, we define the preliminary square (S ij) as
 $$S_{{ij}} =\left\{ {\matrix{ {X_{{ij}} ,} & {\quad {\rm if}\,(i,\,j)\in {\cal I}} \cr {\hat{X}_{{ij}}^{{{\rm RBNS}{\rm .pres}}} {\plus}\hat{X}_{{ij}}^{{{\rm IBNR}}} ,} & {\quad {\rm if}\,(i,\,j)\in {\cal J}_{1} } \cr } } \right.$$
With this definition the payments square (S ij) has multiplicative mean that is approximately  $$E[S_{{ij}} ]\,\approx\,\tilde{\alpha }_{i} \tilde{\beta }_{j} $$
. In the upper triangle,
$$E[S_{{ij}} ]\,\approx\,\tilde{\alpha }_{i} \tilde{\beta }_{j} $$
. In the upper triangle,  $${\cal I}$$
, the approximation is exact as E[S ij]=E[X ij]. In the lower triangle,
$${\cal I}$$
, the approximation is exact as E[S ij]=E[X ij]. In the lower triangle,  $${\cal J}_{1} $$
, we first note that
$${\cal J}_{1} $$
, we first note that
 $$E[\hat{X}_{{ij}}^{{{\rm RBNS}{\rm .pres}}} ]=E\left[ {{{X_{i}^{{{\rm RBNS}{\rm .case}{\rm .estimate}}} } \over {\mathop{\sum}\sidelimits_{j\,\in\, {\cal J}_{1} (i){\cup}{\cal J}_{2} (i)} {\hat{X}_{{ij}}^{{{\rm RBNS}}} } }}\;\hat{X}_{{ij}}^{{{\rm RBNS}}} } \right]\,\approx\,E\left[ {\hat{X}_{{ij}}^{{{\rm RBNS}}} } \right]$$
where we have used that  $$\hat{X}_{{ij}}^{{{\rm RBNS}}} $$
is a consistent estimator of the RBNS reserve. Then we have that, in
$$\hat{X}_{{ij}}^{{{\rm RBNS}}} $$
is a consistent estimator of the RBNS reserve. Then we have that, in  $${\cal J}_{1} $$
,
$${\cal J}_{1} $$
,
 $$E[S_{{ij}} ]\,\approx\,E[\hat{X}_{{ij}}^{{{\rm RBNS}}} {\plus}\hat{X}_{{ij}}^{{{\rm IBNR}}} ]=E\bigg[\mathop{\sum}\limits_{l\,=\,0}^j \hat{N}_{{i,j{\,\minus\,}l}} \hat{\pi }_{l} \hat{\mu }\hat{\gamma }_{i} \bigg]=E[\tilde{\hat{\alpha }}_{i} \tilde{\hat{\beta }}_{j} ]\,\approx\,\tilde{\alpha }_{i} \tilde{\beta }_{j} $$
using expressions (5) and (7), or similarly with (6) and (7), and the consistency of the chain ladder estimators. Therefore, we can use (S ij) to completely replace  $$X_{{\cal I}} $$
to estimate the DCL parameters (cf. (10)).
$$X_{{\cal I}} $$
to estimate the DCL parameters (cf. (10)).
Note that in the BDCL method we were only able to balance the estimator of the inflation parameter  $$\tilde{\alpha }_{i} $$
(cf. (15)). Again, while in the BDCL method, we use the expert knowledge to only adjust the inflation parameters. Here, we can take full advantage of the triangle
$$\tilde{\alpha }_{i} $$
(cf. (15)). Again, while in the BDCL method, we use the expert knowledge to only adjust the inflation parameters. Here, we can take full advantage of the triangle  $$I_{{\cal I}} $$
and also equalise the delay parameters.
$$I_{{\cal I}} $$
and also equalise the delay parameters.
As (S ij) has a multiplicative structure, we use the CLM idea to estimate  $$\tilde{\alpha }_{i} $$
and
$$\tilde{\alpha }_{i} $$
and  $$\tilde{\beta }_{j} $$
. We define
$$\tilde{\beta }_{j} $$
. We define
 $$\hat{\tilde{\alpha }}_{i}^{{{\rm PDCL}}} =\mathop{\sum}\limits_{j\,=\,0}^{m{\,\minus\,}1} S_{{ij}} ,\quad \quad \hat{\tilde{\beta }}_{j}^{{{\rm PDCL}}} ={{\mathop{\sum}\nolimits_{i=1}^m {S_{{ij}} } } \over {\mathop{\sum}\sidelimits_{(i,j)\,\in\, {\cal I}{\cup}{\cal J}_{1} } {S_{{ij}} } }}$$
Exactly as in the previous sections, we can now apply (11) and (12) to derive the PDCL parameters  $$(\hat{\alpha }_{i} ,\,\hat{\beta }_{j} ,\,\hat{\pi }^{{{\rm PDCL}}} ,\,\hat{\gamma }^{{{\rm PDCL}^{{\asterisk}} }} ,\,\hat{\mu }^{{{\rm PDCL}}} )$$
. As this approach is still not RBNS preserving, we balance
$$(\hat{\alpha }_{i} ,\,\hat{\beta }_{j} ,\,\hat{\pi }^{{{\rm PDCL}}} ,\,\hat{\gamma }^{{{\rm PDCL}^{{\asterisk}} }} ,\,\hat{\mu }^{{{\rm PDCL}}} )$$
. As this approach is still not RBNS preserving, we balance  $$\hat{\gamma }^{{{\rm PDCL}^{{\asterisk}} }} $$
by defining a new scaled inflation factor estimate
$$\hat{\gamma }^{{{\rm PDCL}^{{\asterisk}} }} $$
by defining a new scaled inflation factor estimate  $$\hat{\gamma }^{{{\rm PDCL}}} $$
such that
$$\hat{\gamma }^{{{\rm PDCL}}} $$
such that
 $$\hat{\gamma }_{i}^{{{\rm PDCL}}} ={{X_{i}^{{{\rm RBNS}{\rm .case}{\rm .estimate}}} } \over {\mathop{\sum}\sidelimits_{j\,\in\, {\cal J}_{1} (i){\cup}{\cal J}_{2} (i)} {\hat{X}_{{ij}}^{{{\rm RBNS}}} } }}$$
where  $$\hat{X}_{{ij}}^{{{\rm RBNS}}} $$
is calculated with the parameters
$$\hat{X}_{{ij}}^{{{\rm RBNS}}} $$
is calculated with the parameters  $$(\hat{\alpha }_{i} ,\,\hat{\beta }_{j} ,\,\hat{\pi }^{{{\rm PDCL}}} ,\,\hat{\gamma }^{{{\rm PDCL}^{{\asterisk}} }} ,\,\hat{\mu }^{{{\rm PDCL}}} )$$
using (6).
$$(\hat{\alpha }_{i} ,\,\hat{\beta }_{j} ,\,\hat{\pi }^{{{\rm PDCL}}} ,\,\hat{\gamma }^{{{\rm PDCL}^{{\asterisk}} }} ,\,\hat{\mu }^{{{\rm PDCL}}} )$$
using (6).
4.4. The IDCL Method
One could look at the methods BDCL and PDCL as belonging to the tradition of reserving literature using paid–incurred information (see Happ et al., Reference Happ and Wüthrich2012; Happ & Wüthrich, Reference Happ, Merz and Wüthrich2013; Merz & Wüthrich, Reference Merz and Wüthrich2013). In the BDCL definition, we incorporate an additional triangle of incurred claims in order to produce a more stable estimate of the underwriting inflation parameter γ i. The derived BDCL method becomes a variant of the BF technique using prior knowledge contained in the incurred triangle. In the PDCL method, we use the additional information to get better IBNR estimates while preserving the RBNS estimates given by the claims department. But now, one natural question is whether one of those derived reserve estimates is the classical incurred chain ladder. However, this is not the case and neither the BDCL nor the PDCL method is replicating the results obtained by applying the classical CLM to the incurred triangle. Among practitioners, the incurred reserve seems to be more realistic for many data sets compared with the classical paid chain ladder reserve. From this motivation, Agbeko et al. (Reference Agbeko, Hiabu, Martínez-Miranda, Nielsen and Verrall2014) have introduced a new method to estimate the DCL parameters, which completely replicates the chain ladder reserve from incurred data. The method is called IDCL and it is easily defined just by rescaling the underwriting inflation parameter estimated from the DCL method. Specifically, a new scaled inflation factor estimate  $$\hat{\gamma }^{{{\rm IDCL}}} $$
is defined by
$$\hat{\gamma }^{{{\rm IDCL}}} $$
is defined by
 $$\hat{\gamma }_{i}^{{{\rm IDCL}}} ={{\hat{R}_{i}^{{\asterisk}} } \over {\hat{R}_{i} }}\hat{\gamma }_{i} $$
where  $$R_{i}^{{\asterisk}} $$
are the outstanding loss liabilities per underwriting year as predicted by applying the classical CLM on the incurred data,
$$R_{i}^{{\asterisk}} $$
are the outstanding loss liabilities per underwriting year as predicted by applying the classical CLM on the incurred data,  $$\hat{\gamma }_{i} $$
the inflation parameters estimated using the DCL method and
$$\hat{\gamma }_{i} $$
the inflation parameters estimated using the DCL method and  $${\hat{R}_{i} }$$
the outstanding loss liabilities per accident year calculated using the parameters estimated by the DCL method (see section 4.1).
$${\hat{R}_{i} }$$
the outstanding loss liabilities per accident year calculated using the parameters estimated by the DCL method (see section 4.1).
The final IDCL estimates of the DCL parameters are then  $$(\hat{\alpha },\,\hat{\beta },\,\hat{\pi },\,\hat{\gamma }^{{{\rm IDCL}}} ,\,\hat{\mu })$$
. With the new inflation parameter estimate,
$$(\hat{\alpha },\,\hat{\beta },\,\hat{\pi },\,\hat{\gamma }^{{{\rm IDCL}}} ,\,\hat{\mu })$$
. With the new inflation parameter estimate,  $$\hat{\gamma }^{{{\rm IDCL}}} $$
, the outstanding liabilities derived by the IDCL estimates of the parameters completely replicate the CLM forecasts on the incurred triangle.
$$\hat{\gamma }^{{{\rm IDCL}}} $$
, the outstanding liabilities derived by the IDCL estimates of the parameters completely replicate the CLM forecasts on the incurred triangle.
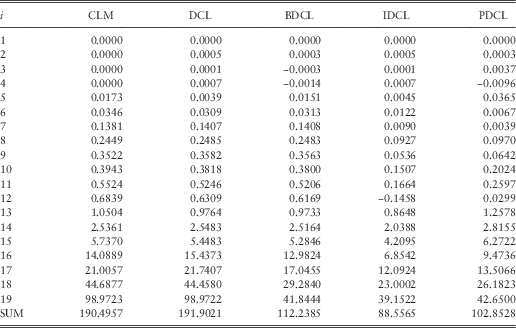
Figure 3 shows a plot of the four severity inflation parameters derived by DCL, BDCL, PDCL and IDCL. The impression is that the rather rough adjustment of the PDCL and IDCL method leads to fluctuations in the estimate. These fluctuations are stronger in the less important and older underwriting years. It coincides with the following intuition. CLM on incurred triangle relies on the RBNS case estimates, which are too small in older underwriting years. Thus, they lead to volatile estimates of the severity inflation in those years. However, the important most recent underwriting year estimates match the one from BDCL. In the most recent years one gets the impression that IDCL might underestimate the severity inflation. Table 2 shows the reserve estimates per underwriting year derived with the four different methods. In Figure 3, it is visualised that the underwriting inflation parameters of PDCL and IDCL might be too volatile in the first 5 years. However, these first 5 years have nearly no impact and account for far <0.1% of the total loss liabilities estimates. The very most recent years on the other hand account for the very major part of the outstanding liabilities. The unrealistic severity inflation of the DCL method in the most recent underwriting year nearly doubles the ultimate estimates. More realistic results are derived when incorporating the expert knowledge in form of the incurred triangle,  $$I_{{\cal I}} $$
, using BDCL, PDCL or IDCL.
$$I_{{\cal I}} $$
, using BDCL, PDCL or IDCL.
Plot of severity inflation estimates. Double chain ladder (DCL):  $$\hat{\gamma }_{i} $$
(red), double chain ladder and Bornhuetter–Ferguson (BDCL):
$$\hat{\gamma }_{i} $$
(red), double chain ladder and Bornhuetter–Ferguson (BDCL):  $$\hat{\gamma }_{i}^{{{\rm BDCL}}} $$
(green), preserving double chain ladder (PDCL):
$$\hat{\gamma }_{i}^{{{\rm BDCL}}} $$
(green), preserving double chain ladder (PDCL):  $$\hat{\gamma }_{i}^{{{\rm PDCL}}} $$
(blue), incurred double chain ladder (IDCL):
$$\hat{\gamma }_{i}^{{{\rm PDCL}}} $$
(blue), incurred double chain ladder (IDCL):  $$\hat{\gamma }_{i}^{{{\rm IDCL}}} $$
(black)
$$\hat{\gamma }_{i}^{{{\rm IDCL}}} $$
(black)
Outstanding Loss Liabilities Per Underwriting Year in Millions
CLM, chain ladder method; DCL, double chain ladder; BDCL, double chain ladder and Bornhuetter–Ferguson; IDCL, incurred double chain ladder; PDCL, preserving double chain ladder.
5. Model Validation
This section describes the validation process for the four methods DCL, BDCL, IDCL and PDCL discussed in section 4. We are able to compare all these reserving methods as DCL provides micro-structure information, which produces reserve forecasts by expanding the payments triangle, X ij, no matter which data is used. The validation process is based on back-testing data previously omitted while estimating the parameters for each method. See Agbeko et al. Reference Agbeko, Hiabu, Martínez-Miranda, Nielsen and Verrall(2014) for more details about this validation technique.
Note that classical incurred chain ladder and chain ladder are ad hoc not comparable as reserves are calculated on different triangles with different delay meanings. DCL solves this problem.
Below, we have omitted the most recent calendar year and the four most recent calendar years, respectively (in all three available triangles). Therefore, since our data set consists of m=19 years, there are 18 and 60 cells, respectively, to be compared with the true values.
Figure 4 shows two box plots of the 18 and 60 errors, respectively, calculated by taking the difference between estimated and true value. While we have also tried to omit different amounts of calendar years, the results were all similar and quiet clear. The three methods incorporating expert knowledge, i.e., BDCL, IDCL and PDCL, outperform the CLM and DCL method, which only work with real data.
Box plot of the cell errors. CLM, chain ladder method; BDCL, double chain ladder and Bornhuetter–Ferguson; PDCL, preserving double chain ladder
In the top panels of Figure 5, we have plotted the sum of the absolute cell errors (l 1 error). That is
 $${\rm Sum}\,{\rm of}\,{\rm absolute}\,{\rm cell}\,{\rm errors}=\mathop{\sum}\limits_{(i,j)\,\in\, {\cal B}_{c} } \!\mid\!\hat{X}_{{ij}} {\,\minus\,}X_{{ij}} \!\mid\,,$$
 $${\cal B}_{c} =\{ (i,\,j)\!\mid\!\;i=2,\:\,\ldots\,\:,\,m{\,\minus\,}c;\,j=0,\:\,\ldots\,\:,\,m{\,\minus\,}c{\,\minus\,}1;\,i{\plus}j=m{\,\minus\,}c{\plus}1,\:\,\ldots\,\:,\,m\} $$
where c is the number of recent calendar years omitted for back-testing (here 1 and 4).
Bar plot for the sum of absolute cell errors and the relative errors. CLM, chain ladder method; DCL, double chain ladder; BDCL, double chain ladder and Bornhuetter–Ferguson; IDCL, incurred double chain ladder; PDCL, preserving double chain ladder
The relative errors, i.e.,
 $${{{\rm Sum}\,{\rm of}\,{\rm absolute}\,{\rm cell}\,{\rm errors}} \over {{\rm Sum}\,{\rm of}\,{\rm absolute}\,{\rm true}\,{\rm values}}}={{\mathop{\sum}\limits_{(i,j)\,\in\, {\cal B}_{c} } {\!\mid\!\hat{X}_{{ij}} {\,\minus\,}X_{{ij}} \!\mid\!} } \over {\mathop{\sum}\limits_{(i,j)\,\in\, {\cal B}_{c} } {\!\mid\!X_{{ij}} \!\mid\!} }}$$
are shown in the bottom panels of Figure 5. The conclusion is the same as in the box plots. The estimates of BDCL, IDCL, PDCL are more accurate, while no great distinction can be made in between those winners.
6. Continuous Chain Ladder
This section is a motivating section. The message of this section is when DCL is extended, then it is also a contribution to granular reserving. This section gives a very short introduction of recent research interpreting the chain ladder model as a structured histogram. We do not provide theory here. We just give a taste of this new interpretation of chain ladder and its potential. Continuous chain ladder was first published in Martínez-Miranda et al. (Reference Martínez-Miranda, Nielsen, Sperlich and Verrall2013a), where it is verified that the classical reserving problem really is a multivariate density estimation problem and that the classical chain ladder technique is a structured histogram version of this density estimator. While histograms are not too bad, it is well known from smoothing theory that one can do better by introducing more smoothing. Also, many actuaries use the CLM without realising that when they choose weekly, monthly, quarterly or yearly data, they are really picking a smoothing parameter which could be optimised via validation methodology. Natural extension of classical CLM would be to smooth it via kernel smoother or some other smoothers. Hereby, one takes advantage on the vast literature of mathematical statistics, when deciding the amount of smoothing (week, month, quarter, year or something completely different) and perhaps allow one-self – in full consistency with the literature – to vary the smoothing according to the difference of information at different underwriting years. Martínez-Miranda et al. (Reference Martínez-Miranda, Nielsen, Sperlich and Verrall2013a) introduces these ideas and call the approach continuous chain ladder. In its simplest version, continuous chain ladder is based on simple kernel smoothers providing intuitive and natural improvement to histograms. Martínez-Miranda et al. (Reference Martínez-Miranda, Nielsen, Sperlich and Verrall2013a, Reference Mammen, Martínez-Miranda and Nielsen2015) consider the multiplicative density model  $$f(x,\,y)=f_{1} (x)f_{2} (y)$$
, where f 1 is the density in underwriting direction (corresponding to α) and f 2 the density in development direction (corresponding to β). They estimate these densities via a least squares or maximum-likelihood criterion. Notice that one hereby estimates one-dimensional functions, not parameters. The aim is to estimate the density components f 1(x) and f 2(y) from observations of the two-dimensional density provided in the triangle
$$f(x,\,y)=f_{1} (x)f_{2} (y)$$
, where f 1 is the density in underwriting direction (corresponding to α) and f 2 the density in development direction (corresponding to β). They estimate these densities via a least squares or maximum-likelihood criterion. Notice that one hereby estimates one-dimensional functions, not parameters. The aim is to estimate the density components f 1(x) and f 2(y) from observations of the two-dimensional density provided in the triangle  $${\cal I}$$
(see definition in section 2). Classical CLM considers histogram smoothers (with bins corresponding to the accident and delay periods) to estimate both f 1 and f 2. The natural context for continuous chain ladder is of course micro claims data or granular data; however, it can still be applied to aggregated data – the data traditionally used in reserving. Now, we illustrate how the continuous CLM can be applied to the paid data described in the previous sections and compared with the classical chain ladder histogram. The input data for both approaches are quarterly aggregated triangles for 76 quarters (this is 19 years). Figure 6 shows a histogram of the observed payments considering bins of four quarters (a year). Such a histogram is the first step in classical CLM, which leads to the predicted cash flow plotted in Figure 7. Continuous chain ladder replaces this yearly histogram with a more efficient local linear kernel density estimator shown in the left panel of Figure 8. A functional projection of this two-dimensional density down on a multiplicative space derives the smooth cash flow shown in the right panel of Figure 8. While the two approaches are quite similar, however, the chain ladder histogram approach results in piece-wise constant functions as shown in Figure 9, while continuous chain ladder indeed results in the continuous functions shown also in Figure 9.
$${\cal I}$$
(see definition in section 2). Classical CLM considers histogram smoothers (with bins corresponding to the accident and delay periods) to estimate both f 1 and f 2. The natural context for continuous chain ladder is of course micro claims data or granular data; however, it can still be applied to aggregated data – the data traditionally used in reserving. Now, we illustrate how the continuous CLM can be applied to the paid data described in the previous sections and compared with the classical chain ladder histogram. The input data for both approaches are quarterly aggregated triangles for 76 quarters (this is 19 years). Figure 6 shows a histogram of the observed payments considering bins of four quarters (a year). Such a histogram is the first step in classical CLM, which leads to the predicted cash flow plotted in Figure 7. Continuous chain ladder replaces this yearly histogram with a more efficient local linear kernel density estimator shown in the left panel of Figure 8. A functional projection of this two-dimensional density down on a multiplicative space derives the smooth cash flow shown in the right panel of Figure 8. While the two approaches are quite similar, however, the chain ladder histogram approach results in piece-wise constant functions as shown in Figure 9, while continuous chain ladder indeed results in the continuous functions shown also in Figure 9.
Histogram of the paid data using yearly bins: the starting point for classical chain ladder method
Classical chain ladder forecasts
The continuous chain ladder approach. Left panel shows the local linear kernel density estimator based on the observed data. Right panel shows the forecasts calculated assuming a multiplicative structure
Estimated density components. Top panel shows the underwriting component and bottom panel the development component. The smooth kernel estimates derived by continuous chain ladder are compared with the histograms provided by classical chain ladder method
7. Conclusions
This paper has developed a new method called PDCL, which combines classical CLM with expert knowledge via the DCL methodology. While the preceding IDCL method is able to replicate the incurred chain ladder reserves, which are most commonly used in practice, the new PDCL method replicates the exact expert knowledge of the claims handling department via the estimated RBNS reserves. Among a number of advantages, both PDCL and IDCL methods inherit the good mathematical statistical properties of the DCL methodology including a full statistical model and a stochastic cash flow interpretation. This in turn allows for a validation procedure cutting of recent payments and forecasting them. Such a validation procedure between paid chain ladder (or DCL) and incurred chain ladder (or IDCL) have hitherto not been available. We believe that our new results can upgrade the scientific quality of model selection in the perhaps most important single modelling process of a non-life insurance company. Now a scientifically based validation exist between DCL, BDCL, IDCL and PDCL, where the three latter are various version of combining expert knowledge with observed payment data. Finally, we have pointed out the close link between our methodology and granular reserving indicating that the insights of this paper could be transferred to granular reserving. Another recent trend is to use so-called granular data or micro data for reserving (see Antonio & Plat, Reference Antonio and Plat2014 for one of the most interesting recent contributions in that area).
Acknowledgements
The authors thank an anonymous reviewer for the careful reading of the paper and the helpful comments and suggestions. The third author gratefully acknowledges the financial support of the Spanish “Ministry of Economy and Competitiveness” by the grant MTM2013-41383P (European Regional Development Fund).