


1. Introduction
Differences in product quality have resulted in various grading systems being developed and adopted in agriculture, whether for plant or animal products. These systems generally provide differential pricing with higher-quality grades yielding higher prices than the lower-quality grades. Thus, profit-maximizing producers have an incentive to inform themselves of the additional benefits and the added costs associated with producing a higher-quality product that will grade higher. Relatively little research in the agricultural economics profession, however, has addressed producers’ knowledge of price differences by grade. How accurate are producers in their knowledge of price differentials by grade, and which producers tend to be the most accurate? In this study, we explore the accuracy of meat goat producers in predicting prices by grade or “selection class” as it is called in this industry. This study fits squarely into the literature addressing producer perceptions of factors influencing price differentials and distributions.
The U.S. meat goat industry has experienced rapidly increased production over the past couple of decades, with new entrants responding to increased goat meat demand, decreased government incentives for producing mohair, and the opportunity for small landholders to produce livestock on relatively small acreages. In response to industry growth and the need to compensate producers for quality, meat goat selection classes were developed in the late 1990s (McMillin et al., Reference McMillin, Fernandez, Pinkerton, Mellad, Phelps, Gebrelul, Simon, Dawkins and Yakubu1997, Reference McMillin, Michel, Phelps, Dawkins, Gebrelul, Mellad, Howard and Pinkerton1999). This classification system was adopted by the U.S. Department of Agriculture's (USDA) Agricultural Marketing Service in 2001 based on body conformation, with Selection 1 goats having the highest conformation, generally commanding the highest prices, and Selection 3 goats having the lowest conformation, generally commanding the lowest prices (USDA, 2001). With this classification system having been used for 13 years, meat goat producers selling live animals have had the opportunity to develop expertise in understanding price differentials among the selection classes. We examine producers’ subjective estimates of price differentials for goats by selection class and the types of meat goat producers most likely to correctly predict price differentials among the selection classes.
McMillin and Pinkerton (Reference McMillin, Pinkerton, Gipson, Merkel, Williams and Sahlu2005, p. 156) describe Selection 1, 2, and 3 goats as having, respectively, superior, average, and inferior “meat-type conformation without regard to the presence of fat cover.” Selection 1 meat goats are more robust in appearance with greater meat relative to bone, whereas Selection 3 goats are thin, with little meat relative to bone.
Limited previous research has measured producer perceptions of or ability to recognize price differentials among agricultural commodities by selection class or grade. Most economic literature addressing price differentials among livestock characteristics has focused on the beef industry, in which research has evaluated animal characteristics and/or value-added programs (Avent, Ward, and Lalman, Reference Avent, Ward and Lalman2004; Bulut and Lawrence, Reference Bulut and Lawrence2007; Williams et al., Reference Williams, Raper, DeVuyst, Peel and McKinney2012). Two studies have examined price expectations for meat goats using hedonic pricing models. Rodriguez et al. (Reference Rodriguez, Ali, Afzal, Shah and Mustafa1995) and Srinivas et al. (Reference Srinivas, Aw-Hassan, Rischkowsky, Tibbo, Rizvi and Naseri2013) analyzed premiums and discounts related to season and animal attributes in Pakistan and Afghanistan, respectively, with Srinivas et al. (Reference Srinivas, Aw-Hassan, Rischkowsky, Tibbo, Rizvi and Naseri2013) comparing those premiums and discounts to those reported by respondents from actual sales.
The present study differs from previous studies in that it uses publicly available goat pricing data to objectively estimate the value of meat goats of different selection classes, calculate the differences in meat goat prices by selection class, and compare those price differentials with subjective price differentials elicited from producers. Furthermore, it contributes to a wider literature dealing with producer perceptions versus objective assessment of factors influencing farm economics (i.e., Eales et al., Reference Eales, Engel, Hauser and Thompson1990; Sherrick, Reference Sherrick2002).
2. Challenges Associated with Subjectively Assessing Selection Premiums
The loosely organized U.S. meat goat industry creates marketing challenges for producers. Although more is currently known about the market than when Glimp (Reference Glimp1995) characterized it as “highly unstructured,” many of the challenges persist. Greater attention to the characteristics of goat meat that are demanded by consumers would assist the industry in progressing from its current relatively disorganized structure to a more efficient structure with lower transaction costs. In today's meat goat industry, animals may be sold via numerous marketing outlet types, and a goat may be sold multiple times before finally reaching the slaughterhouse. Furthermore, as Sande, Houston, and Epperson (Reference Sande, Houston and Epperson2005) discuss, data available for most aspects of meat goat production analysis are limited.
The importance of transaction costs in industry structure was first introduced by Coase (Reference Coase1937), and the concepts have been further developed since by economists such as Williamson (Reference Williamson1979). In essence, under a relatively disorganized industry structure such as that for meat goats, costs associated with transactions between buyers and sellers are high. Such a market structure does not efficiently transfer market price information from buyer to producer. The argument is that price discovery is “muddied,” with multiple market outlets being used and some animals being sold repeatedly, presumably at progressively higher prices as each seller seeks profit. Furthermore, sparse pricing data and few publications containing market-based price information increase search costs for producers to source price information. Gillespie, Nyaupane, and McMillin (Reference Gillespie, Nyaupane and McMillin2013) found that U.S. meat goat producers believed the lack of a clear marketing system for goats was among the biggest challenges faced by producers.
Assuming the objective of the meat goat producer is to maximize profit, the profit equation for the meat goat producer can be represented as follows:
 \begin{equation}
\pi = p(a) \times f(x) - \omega x - c,\end{equation}
\begin{equation}
\pi = p(a) \times f(x) - \omega x - c,\end{equation}
where π represents profit; p, the price received for goats sold; and a, the quality of goat produced. Price is a function of a and is, thus, nonconstant across all quality levels. Operator f(x) denotes the production function for meat goats where x represents inputs. Symbols ω and c represent input prices and fixed costs, respectively. At the level of input where the slope of π equals zero, profit is maximized,Footnote 1
 \begin{equation}
\frac{{\delta \pi }}{{\delta x}} = p(a) \times \frac{{\delta f(x)}}{{\delta x}} - \omega = 0,\end{equation}
\begin{equation}
\frac{{\delta \pi }}{{\delta x}} = p(a) \times \frac{{\delta f(x)}}{{\delta x}} - \omega = 0,\end{equation}
where 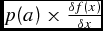 $p(a) \times \frac{{\delta f(x)}}{{\delta x}}$ represents the marginal value product (MVP); and ω, the marginal factor cost (MFC). As shown, for producers to maximize profit, they must know not only input prices (MFC, ω) but also MVP, where in this case, price is a function of the quality of product. In essence, producers must be able to determine whether the additional costs incurred via adopting technologies, management practices, and production systems will result in MVP that equals or exceeds the MFC incurred.
As illustrated in equations (1) and (2), in cases of premiums associated with a, the profit maximization problem is more complex than in cases in which output price is constant regardless of quality. This requires awareness of the premiums associated with quality or the differences in prices among selection classes in the case of meat goats. If producers are uninformed about quality premiums, it will be impossible to make decisions that can be deemed a priori to maximize profit. If producers are further uninformed or uncertain as to how to measure the quality of their products, as discussed by Hennessy (Reference Hennessy1996) with implications for vertical coordination, then they will encounter further difficulty in making profit-maximizing decisions.
Determination of meat goat prices is further muddied by seasonal pricing differences. Premiums paid by selection class vary by seasonal supply and demand ratios, with premiums narrowing close to holidays as supply dwindles (Pinkerton, Reference Pinkerton2013). Producers must educate themselves on marketing systems and pricing and be proactive as an industry in developing a clearer marketing system to overcome industry pricing challenges. It is noted, however, that although the challenges associated with developing a clearer marketing system may be particularly strong for the goat industry, the issue is also relevant to other industries, such as cattle, in which there have been efforts to more fully develop a value-based marketing system (Fausti, Fezu, and Wagner, Reference Fausti, Feuz and Wagner1998; Schroeder et al., Reference Schroeder, Ward, Mintert and Peel1998). The objectives of this study are to determine: (1) market-based predicted price differentials for meat goats of the three selection classes; (2) goat producers’ subjective estimates of price differentials for meat goats of the three selection classes; (3) closeness of producer subjective price differentials to market-based predicted differentials; and (4) types of producers who provide the most accurate estimates of price differentials and can most accurately assess the value of goats based on body conformation.
3. Data and Methods
During 2011–2012, a mail survey questionnaire was developed and sent to U.S. meat goat producers. Producers were identified via Internet search on sites including state goat producer associations and others where meat goat producers advertised. All meat goat producers for whom a mailing address could be found via the Internet were included in the mailing list. The questionnaire included questions about farm structure and system, knowledge of price differentials among goat selection classes, demographics, and other information. On July 2, 2012, following the tailored design method (Dillman, Smyth, and Christian, Reference Dillman, Smyth and Christian2009), the questionnaire, a signed and personally addressed cover letter, a business reply envelope, and an ink pen with a Louisiana State University Agricultural Center logo were mailed to 1,600 U.S. meat goat producers via first-class mail. A postcard reminder was mailed to all producers on July 9, 2012. On July 23, 2012, a second questionnaire with a signed and personally addressed cover letter and business reply envelope was mailed to all nonrespondents. On August 2, 2012, a second postcard reminder was mailed to all nonrespondents.
In total, 584 usable returns were received. Considering the return-to-sender returns with incorrect addresses and those for which the producer indicated discontinuance of goat production, this constituted a 43% return rate. Given the method through which the survey list was developed, the population represented by this survey consists of meat goat producers who are members of meat goat associations and/or advertise via the Internet.
3.1. Eliciting Farmer Perceptions of the Magnitude of Selection Premiums
Respondents were provided with the following definitions of selection classes from McMillin and Pinkerton (Reference McMillin, Pinkerton, Gipson, Merkel, Williams and Sahlu2005, p. 156): “Selection 1 = Pronounced bulging outside hind leg; full, rounded back strip; moderately thick outside shoulder”; “Selection 2 = Slightly thick outside leg; slightly full back strip; slightly thick to slightly thin outside shoulder”; and “Selection 3 = Narrow legs, back, and shoulder with angular and sunken appearance; inferior meat conformation.” Pictures of meat goats representing Selection 1, 2, and 3 animals accompanied the definitions (Figure 1). These pictures were of the same Selection 2 goat, but photoshopped to represent typical Selection 1 and Selection 3 goats. The Selection 2 picture was photoshopped to prevent respondents from providing subjective price premiums that were influenced by breed or markings. The pictures were approved by Dr. Kenneth McMillin, a meat scientist who was involved in developing the selection criteria, as representing the selection classes. Producers were then asked, “If you were selling a 50 lb. Selection 1 meat goat at a live auction today, how much more money would you expect to receive as compared with that of an equal weight Selection 2 meat goat?” The questions were open ended with respondents indicating the dollars/animal. A similar question was asked for the Selection 2–3 premium. It is emphasized that producers were asked about the premium they would expect to receive at a live auction rather than via their typical marketing outlet. By providing pictures of the meat goats and describing them by their selection criteria, we controlled for product quality uncertainty, as discussed by Hennessy (Reference Hennessy1996).
Pictures of Selection 1, 2, and 3, 50 lb. Slaughter Kid Goats Used in the Questionnaire

3.2. Determining Market-Based Predicted Price Differentials
To determine producer accuracy in estimating price differentials for 50 lb. Selection 1(2) versus Selection 2(3) slaughter kids, market-based price differential estimates were required. For this study, market-based predicted price differentials were determined as differences between selection category prices estimated via econometric procedures using market data from the USDA Agricultural Marketing Service. Our farm survey returns were received over the 13-week period from the second week of July through the first week of October. Because the question eliciting the subjective price differential specified that the respondent provide an estimate for “today,” the price estimate was to be made for the week of questionnaire completion. In practice, for the date we received the completed survey, the market-based predicted price differential for the previous week (as predicted from the pricing analysis) was used, assuming the respondent completed the questionnaire during that week.
To determine market-based predicted price differentials, prices for the first week of July through the last week of September for each selection class were estimated using ordinary least squares. This was the survey period and a period of no major religious or secular holidays that could distort usual pricing patterns. Differentials were estimated based on regression results. Regression results were used because (1) for some weeks, there were no sales in some locations for which to determine average prices, and (2) in some cases, prices in a particular location were higher or lower than generally expected because of idiosyncratic circumstances such as small numbers of buyers or sellers. Because of the nature of the data used to estimate the parameters, we estimated four sets of market-based predicted price differentials using different assumptions.
3.2.1. Scenario I: All Auction Data for the 13-Week Period for 20–80 lb. Slaughter Kid Categories
For this market-based predicted pricing scenario, all published sales data from auctions throughout the United States were collected for the 13-week survey period, for a total of 1,945 observations. U.S. auction weekly summaries were searched using the USDA Agricultural Marketing Service website for sales data for 20–80 lb. slaughter kids. For instance, for Alabama goat auctions, data released July 9, 2012, for the week of July 2–7, 2012, via the Ag Market News included Selection 1 slaughter kids of average weights 44, 50, and 65 lb. averaging $73.77, $77.50, and $105.00, respectively, and so forth. These data were available and collected for the following additional states: CO, GA, IL, IA, KY, MO, NE, NC, OK, PA, SC, TN, TX, VA, and WV (in some cases for multiple auctions). For some states, weekly auctions were not reported, and, in some cases, a particular selection class was not present because no animals of that selection class were sold that week.
To predict market-based predicted price levels for each state and for a particular week, the following model was estimated using ordinary least squares regression procedures:
 \begin{eqnarray}
\$ /{\it Head} &=& \alpha _0 + \beta _1 \times {\it Weight} + \beta _2 \times {\it Weight}^2 + \beta _3 \times {\it Volume}\nonumber\\
&&+ \sum_{i = 1}^{12} {\gamma _i } \times {\it State}_i + \sum_{j = 1}^{12} {\delta _j } \times {\it Week}_j + \sum_{k = 1}^4 {\theta _k } \times {\it Selection}_k \nonumber\\
&&+ \sum_{i = 1}^{12} {\vartheta _i } \times {\it Weight} \times {\it State}_i + \sum_{j = 1}^{12} {\mu _j } \times {\it Weight} \times {\it Week}_j \nonumber\\
&&+ \sum_{i = 1}^{12} {\sum_k^5 {\tau _{ik} } \times {\it State}_i \times {\it Selection}_k}\nonumber\\
&&+ {\sum_{j = 1}^{12} {\sum_{k = 1}^4 {\varphi _{jk} } } } \times Week_j \times Selection_k + \varepsilon
\end{eqnarray}
\begin{eqnarray}
\$ /{\it Head} &=& \alpha _0 + \beta _1 \times {\it Weight} + \beta _2 \times {\it Weight}^2 + \beta _3 \times {\it Volume}\nonumber\\
&&+ \sum_{i = 1}^{12} {\gamma _i } \times {\it State}_i + \sum_{j = 1}^{12} {\delta _j } \times {\it Week}_j + \sum_{k = 1}^4 {\theta _k } \times {\it Selection}_k \nonumber\\
&&+ \sum_{i = 1}^{12} {\vartheta _i } \times {\it Weight} \times {\it State}_i + \sum_{j = 1}^{12} {\mu _j } \times {\it Weight} \times {\it Week}_j \nonumber\\
&&+ \sum_{i = 1}^{12} {\sum_k^5 {\tau _{ik} } \times {\it State}_i \times {\it Selection}_k}\nonumber\\
&&+ {\sum_{j = 1}^{12} {\sum_{k = 1}^4 {\varphi _{jk} } } } \times Week_j \times Selection_k + \varepsilon
\end{eqnarray}
where Weight is the weight of the animal(s) sold in pounds, Volume is the number of head of goats sold in the market during that day, State is the state in the United States where the market was located, Week is the week of the sale, and Selection is the selection class of the animals. Heavier animals are expected to yield a greater return per head and lower per hundredweight (cwt); thus Weight was included. In markets with greater Volume, higher prices per head are expected; markets with lower volume generally attract fewer buyers. Area of the United States is of importance; the greater the distance from the major goat meat consumption areas of the Northeast where there is more extensive demand for goat meat among ethnic groups, the lower the expected price. State is included to account for price differences by region, which are impacted by supply and demand factors. Dummy variables for Week were included because prices vary over time. Producers may develop price expectations based on periodic market reports. Finally, Selection criteria (Selection 1, 2, or 3) was included with the expectation that Selection 1 animals command higher prices than Selection 2 animals and Selection 2 animals command higher prices than Selection 3 animals.
In some markets, $/cwt was reported; these measures were converted to $/head assuming the midpoint value of the associated weight range. For example, prices reported per cwt for “40–60 lb.” animals were converted to per head prices assuming the animals were 50 lb. For estimation purposes, because of few observations in several states, observations for GA and SC were combined, KY and TN were combined, and VA and WV were combined, reducing the number of States from 16 to 13. Several states reported “Selection 1–2” and “Selection 2–3” classes, suggesting that animals were deemed to fall between those selection classes or there were mixed groups containing animals from both selection classes. Thus, in addition to selection classes 1, 2, and 3 being included using two dummy variables in the regression analysis, two additional dummy variables for the Selection 1–2 and Selection 2–3 classes were included, for a total of four dummy variables.
Market-based predicted Selection 1(2)–Selection 2(3) meat goat price differentials for each respondent were determined as the difference between the two estimated prices for the week they completed the questionnaire and the state in which they resided, assuming a weight of 50 lb. Interaction terms among independent variables were included if any of the interactions of that type were significant at P ≤ 0.10. A squared term on the Weight variable allowed for a nonlinear relationship between weight and price. The adjusted R 2 value of 0.86 suggested a good model fit. Regression results are shown in Table A1 in the Appendix. Because not all surveyed states had auction markets, estimated prices from the nearest states were used when we subsequently compared market-based predicted premiums resulting from this regression with subjective estimates. The selection of these “substitute” states also considered where the markets were located and where the majority of meat goat production occurred in each of the states, assuming the producers were most likely to market their goats in the nearest market. We used PA prices for states in the northeastern United States and OH; GA, SC prices for FL; IL prices for IN, MI, and WI; AL prices for MS; TX prices for LA and NM; IA prices for MN, ND, NE, and SD; MO prices for AR; OK prices for KS; and CO prices for all other western states.
3.2.2. Scenario II: All Auction Data for the 13-Week Period for 20–80 lb. Slaughter Kid Categories, Less States for Which There Were No Auction Data
This scenario was similar to that of Scenario I except that in the follow-up regression models used to determine the impacts of independent variables on accuracy, observations from states for which there were no auction data were deleted (i.e., only the observations from AL, CO, GA, IL, IA, KY, MO, NE, NC, OK, PA, SC, TN, TX, VA, and WV were included). Neighboring state observations (i.e., FL, NY, UT, etc.) were not included.
3.2.3. Scenario III: Auction Data for the 13-Week Period for 50 lb. Slaughter Kid Category
To estimate market-based prices for this scenario, the USDA Agricultural Marketing Service website was used to find goat prices for the 13-week survey period, but only for the 50 lb. slaughter kid category. Through the agency website, custom weekly reports were run for the 13-week period for 40–60 lb. goats, slaughter kids, weekly. Separate reports were run for the Selection 1, 2, and 3 classes. Markets included in these reports were CO, GA, IA, KY, OK, PA, and TX. These market data included 189 observations. These observations thus constituted the data for which market based-prices, and thus estimated price differentials, were estimated.
To predict price levels for each location and week, the following model was estimated using ordinary least squares regression:
 \begin{eqnarray}
\$ /{\it Head} &=& \alpha _0 + \sum_{i = 1}^6 {\gamma _i } \times {\it State}_i + \sum_{j = 1}^{12} {\delta _j } \times Week_j\nonumber\\
&& +\;\sum_{k = 1}^2 {\theta _k } \times {\it Selection}_k + \sum_{i = 1}^6 {\sum_k^2 {\tau _{ik} } } \times {\it State}_i \times {\it Selection}_k\nonumber\\
&& +\;\sum_{i = 1}^6 {\sum_{j = 1}^{12} {\omega _{ij} } } \times {\it State}_i \times Week_j + \varepsilon .
\end{eqnarray}
\begin{eqnarray}
\$ /{\it Head} &=& \alpha _0 + \sum_{i = 1}^6 {\gamma _i } \times {\it State}_i + \sum_{j = 1}^{12} {\delta _j } \times Week_j\nonumber\\
&& +\;\sum_{k = 1}^2 {\theta _k } \times {\it Selection}_k + \sum_{i = 1}^6 {\sum_k^2 {\tau _{ik} } } \times {\it State}_i \times {\it Selection}_k\nonumber\\
&& +\;\sum_{i = 1}^6 {\sum_{j = 1}^{12} {\omega _{ij} } } \times {\it State}_i \times Week_j + \varepsilon .
\end{eqnarray}
Unlike in Scenario I, no Selections 1–2 or 2–3 were reported, and there were only seven states. As with Scenario I, interaction terms of a particular type were included if any of the interactions of that type were significant at P ≤ 0.10. Market-based predicted Selection 1(2)–Selection 2(3) price differentials for a particular individual were determined as the difference between the two prices for the week of questionnaire completion and state of residence. The adjusted R 2 value was 0.90, suggesting a good fit. Regression results are shown in Table A1 in the Appendix.
As with Scenario I, most states were not included in the market data. Thus, in the analysis comparing our respondents’ estimates of price differentials with the estimated price differentials derived from the market data, the following prices were used for the states not included: PA prices for the northeastern states and IL, OH, VA, and WV; GA prices for AL, FL, MS, NC, and SC; KY prices for TN; TX prices for LA and NM; OK prices for AR and KS; IA prices for IL, KS, MN, MO, ND, NE, SD, and WI; and CO prices for all other states (western states). As with Scenario II, we also estimated models that included only the data for the states for which we had price data: CO, GA, IA, KY, OK, PA, and TX. There were, however, only 89 observations, and the F statistics for these regressions were not significant. Thus, we have not included them.
3.2.4. Scenario IV: All Auction Data for the 13-Week Period for 20–80 lb. Slaughter Kid Categories, No Interaction Terms on Independent Variables in Pricing Regression
This scenario was similar to Scenario I except that in the pricing regression used to determine the price per head, no interaction terms were included. The reason for examining alternative models was that there is the possibility of overfitting (which occurs when the random error of the model is described by the model rather than the true underlying relationship itself) when there are too many independent variables in a model. We estimated several models that did not include interaction terms, State, and Week and compared them on the basis of the Akaike Information Criterion (AIC) and the Bayesian Information Criterion (BIC), both of which reward goodness of fit but penalize the use of additional parameters in the model and discourage overfitting. Of all the models considered, the most complex model (Scenario I) had the highest R 2, as expected. However, of the less complex models, the only one with a lower BIC (but still a slightly higher AIC) measure than the full model was the model without the interaction terms. Furthermore, its R 2 value was only slightly lower than that of the full model (0.82 vs. 0.86). We also considered a model that included Time, a trend variable instead of dummy variables for each of the weeks, as well as a squared term for Time; however, the performance on the basis of R 2, BIC, and AIC was lower than that used for this scenario. Having a predicted price that varies by week is of value because we are measuring the accuracy of a producer's perceived price differentials based on the week the survey was completed.
3.2.5. Scenario V: Auction Data for the 13-Week Period for 50 lb. Slaughter Kid Category, No Interaction Terms on Independent Variables in Pricing Regression
This scenario was similar to Scenario III except that in the pricing regression used to determine the price per head, no interaction terms were included. As with Scenario IV, R 2, the AIC, and the BIC were used to determine these models as having acceptable fit while discouraging overfitting.
It is noted that two additional scenarios were also run, both of which held State constant, one for all observations and the other including only those observations for which State estimates were available. The regressions to estimate prices in these cases had substantially lower adjusted R 2 measures, had higher AIC and BIC measures, and resulted in predicted price premium means that were outliers, so they were not reported.
3.3. Determining the Impacts of Farm and Demographic Characteristics on Producer Accuracy in Estimating Price Differentials
To determine producer accuracy in estimating price differentials between Selection 1, 2, and 3 goats, the formula in equation (5) was used:
 \begin{eqnarray}
{\it Accuracy} &=& \left| {\it Market\,Based\,Predicted\,Price\,Differential}\right.\nonumber\\
&&-\; \left.{\it Subjective\,Price\,Differential} \right|\end{eqnarray}
\begin{eqnarray}
{\it Accuracy} &=& \left| {\it Market\,Based\,Predicted\,Price\,Differential}\right.\nonumber\\
&&-\; \left.{\it Subjective\,Price\,Differential} \right|\end{eqnarray}
The absolute value of the difference between the respondent-provided subjective price differential and the model-estimated market-based predicted price differential provided a proxy for estimating farmer knowledge of the gains associated with producing 50 lb. Selection 3(2) versus 2(1) slaughter kids. Accuracy was then used as the dependent variable in ordinary least squares models to determine the types of producers most likely to be knowledgeable about the premiums associated with selection classification. The following conceptual model was estimated:
 \begin{eqnarray}
{\it Accuracy} &=& {\it f(Goats,\% Extensive,\% Drylot,\% Slaughter,Auction,Age,}\nonumber\\
&&{\it College, \%\; IncGoats,Southeast,Northeast,Midwest,West),} \ \ \
\end{eqnarray}
\begin{eqnarray}
{\it Accuracy} &=& {\it f(Goats,\% Extensive,\% Drylot,\% Slaughter,Auction,Age,}\nonumber\\
&&{\it College, \%\; IncGoats,Southeast,Northeast,Midwest,West),} \ \ \
\end{eqnarray}
with these independent variables defined in the following three sections.
It is noted that by analyzing the difference between the farmer's subjective price differential and the market-based predicted price differential and using that difference to determine Accuracy, we are implicitly assuming that the price reports provided by the USDA Agricultural Marketing Service are accurate. This has been an area of analysis (i.e., for cattle by Koontz [Reference Koontz1999]), and was a factor leading to greater interest in mandatory price reporting in livestock. We are, however, unaware of other data that have been collected with the purpose of providing objective price estimates for meat goats by selection class.
3.3.1. Farm Descriptor Variables
The number of breeding-aged meat goats on the farm, Goats, provided an estimate of the scale of the meat goat enterprise. Larger-scale producers were expected to provide more accurate estimates of price differentials because of greater sales volume and experience observing prices. Percentages of farms producing under extensive (%Extensive) and drylot (%Drylot) systems relative to pastured systems were included to determine whether system usage impacted accuracy in estimating price differentials. The extensive system was described in the questionnaire as “Goats kept on large tracts of pasture or rangeland, mostly ‘fending for themselves.’ Goats forage for food and care for young with minimal assistance.” Goats produced under extensive systems are generally managed less closely than those in pastured systems, suggesting lower emphasis on using technologies and management practices that might yield goats of higher selection classes. The drylot system was described as “Goats kept in a dry lot where there is no growing forage. Purchased feeds and/or hay fed.” Goats produced under drylot systems are generally closely managed, suggesting goats being classified in higher selection classes. The base system for analysis was a pastured system.
The percentage of the producer's 2011 goat sales that were for slaughter or as meat (%Slaughter), as opposed to for breeding stock or show, was included. Because selection classes are used primarily for determining slaughter meat goat conformation, greater accuracy among producers with higher percentages of goats sold for slaughter was expected. Farmers using live auctions (Auction) to market goats were expected to provide more accurate price differential estimates based on their experience observing auction market prices.
3.3.2. Farmer Demographic Variables
Farmer Age was included with the expectation that older farmers would more accurately estimate price differentials because of greater experience selling meat goats. Whether the farmer held a four-year College degree was included, with the expectation that more educated farmers would be more informed about pricing, therefore providing more accurate price differential estimates. Percentage of the producer's net household income from the goat enterprise (%IncGoats) was included, with the expectation that in cases in which the meat goat enterprise provided a higher percentage of the household income, there would be greater knowledge of pricing and more accurate subjective estimates of price differentials.
3.3.3. Regional Dummy Variables
Meat goat prices differ by region of the United States, so it is plausible that the accuracy of price differential estimates could also differ by region. To control for regional differences, the following variables were included. Southeast indicates the farm was located in AL, AR, FL, GA, KY, LA, MS, NC, SC, TN, VA, or WV. Northeast indicates the farm was located in CT, DE, ME, MA, MD, NH, NJ, NY, PA, RI, or VT. Midwest indicates the farm was located in IL, IN, IA, KS, MI, MN, MO, NE, ND, OH, SD, or WI. West indicates the farm was located in AZ, CA, CO, ID, MT, NV, NM, OR, UT, WA, or WY. The base, Southern Plains, includes OK and TX, which respectively had the fourth and first largest “meat and other goats” inventories in the United States (USDA, National Agricultural Statistics Service, 2012).
3.4. Probit Models for Overestimating versus Underestimating Price Differentials
To determine whether certain segments of the meat goat producer population were more likely to overestimate versus underestimate meat goat selection price differentials, probit models were estimated in which dependent variable Overestimate took the value of 1 if the producer overestimated the price differential and 0 if the producer underestimated the price differential according to our prediction models. The probit model is useful for cases in which there is a 0–1 dependent variable (such as yes, the differential was overestimated, or no, it was not) and the investigator desires to determine the type of respondent who was more likely to have responded in a certain way (such as with an overestimate). Given the common nature of the probit model in the agricultural economics literature, the reader is simply referred to Greene (Reference Greene2000) for a fuller discussion of probit models and their characteristics. Using the Scenario I and Scenario III results, we determined which of the respondents over- and underestimated Selection 1–Selection 2 and Selection 2–Selection 3 price differentials. We then used the independent variables discussed previously for the price differential models to determine the types of producers who were more likely to overestimate price differentials.
4. Results
Table 1 provides means for the variables of interest. The average producer responding to the price differential questions was 51 years old, 45% held four-year college degrees, and 14% of their household income was derived from the meat goat enterprise. The average farm had 60 breeding-aged goats. For the farms, 11% and 14% used extensive and drylot systems, respectively, and 48% of animal sales were for slaughter or as meat. Seventy-two percent marketed at least some goats via live auction.
Means and Standard Deviations of Variables of Interest

Note: Scenario II estimated price differentials less subjective estimates do not equal reported differences in the lower section because of fewer observations (244) in Scenario II.
Respondents were asked, “What are your primary sources of information for market prices for goats? (Circle all that apply).” The Internet was the source most frequently indicated, at 63%; followed by other farmers, at 37%; and media including television, radio, and magazines, at 25%. Sources ranging from 10% to 11% were the extension service, farm organizations, and “other.” Twelve percent indicated they did not attempt to obtain price information.
Table A1 (see Appendix) shows ordinary least squares regression results for estimating 50 lb. goat prices under the four scenarios. Variables were not included if no observations were available. Goodness of fit was highest for the regression in which only those observations for the 40–60 lb. slaughter goats were used, with R 2 = 0.90, followed by the regression in which all observations were used, R 2 = 0.86. Models with only the main effects had lower R 2 values. AIC and BIC show mixed results for model selection between full and main effects models for situations in which all data were used versus only main effects were considered. Robust standard errors were estimated for all models. We used the Hausman test to determine whether fixed effects models with individual-level (State) effects assumed to be random or random effects models were more appropriate. The tests showed random effects models to be superior. Although variance inflation factors indicated multicollinearity issues stemming primarily from the use of interaction terms, multicollinearity should not be of concern when the primary purpose of the regression is for prediction, as these models are used.
From Table 1, estimated price differentials for Selection 1–Selection 2, 50 lb. slaughter kids ranged from $14.36 to $19.74, depending on estimation method used and whether farmers located in states neighboring those included in the pricing data were included. Likewise, estimated price differentials for Selection 2–Selection 3, 50 lb. slaughter kids ranged from $8.29 to $14.12. In both cases, the largest estimated price differentials were assessed using Scenario V, which included prices for only the 40–60 lb. animals and in which no cross-terms were included in the regression models. In markets with more respondents, the estimated price differentials for those markets had strong impacts on the mean. These differences in estimated market-based predicted price differentials can be seen as indicative of some of the challenges producers face in estimating selection premiums.
Mean subjective price differentials estimated by respondents were $23.93 for Selection 1–Selection 2, 50 lb. slaughter kids and $24.05 for Selection 2–Selection 3, 50 lb. slaughter kids. Comparing market-based predicted Scenario I price differentials for Selection 1–Selection 2 and Selection 2–Selection 3 animals to these subjective estimates, 59% and 85%, respectively, of producers overestimated the price differentials. Using market-based predicted Scenario III price differentials for Selection 1–Selection 2 and Selection 2–Selection 3 animals, 71% and 74%, respectively, of producers overestimated the price differentials. Thus, results suggest a tendency for producers to overestimate price differentials among selection classes. This could be partially explained by the population of surveyed producers, which includes those advertising via the Internet. These producers are likely strong technology adopters if Internet advertising serves as a proxy for adoption; such producers may perceive greater returns than actually exist in moving higher among selection classes. Figures 2 and 3 show the distributions of responses of respondents’ subjective price premiums compared with the predicted price premiums for Scenarios I, II, and III. All price premiums were the same for Scenarios IV and V; thus, all were at the mean values for that scenario as shown in Table 1. Note the tendency for respondents to estimate subjective price premiums at higher levels, particularly for the Selection 2–3 differential.
Distributions of Subjective Price Differentials and Scenario I, II, and III Predicted Price Premiums, Selection 1–Selection 2 Meat Goats

Distributions of Subjective Price Differentials and Scenario I, II, and III Predicted Price Premiums, Selection 2–Selection 3 Meat Goats

Table 1 shows the means of subjective less predicted price differentials for 50 lb. animals. Note that, on average, the difference between the subjective and the predicted price differentials for Selection 1 versus Selection 2 animals ranged from $4.19 to $9.57 depending on the scenario. Likewise, the difference between the subjective and the predicted price differentials for Selection 2 versus Selection 3 animals ranged from $9.93 to $16.02 depending on the scenario. Figures 4 and 5 show the distributions of subjective less predicted price differentials. Note further evidence in these figures that most respondents overestimated the price differentials. The differences in these distributions by scenario show that the scenario chosen matters in determining the distribution of subjective less predicted price differentials.
Distribution of Subjective Less Predicted Price Differentials, Five Scenarios, Selection 1–Selection 2 Meat Goats

Distribution of Subjective Less Predicted Price Differentials, Five Scenarios, Selection 2–Selection 3 Meat Goats

On average, producers believed that of the animals they sold in 2011, 62%, 31%, and 6% were in the Selection 1, 2, and 3 classes, respectively. If this is the case, the greater experience in selling animals of Selection 1 and 2 goats versus Selection 3 goats may help to explain the greater accuracy of producers in estimating the Selection 1–Selection 2 price differential.
Auctions are not the only marketing outlets used for meat goats. Results indicate that 15% used dealers, brokers, or meat packers; 3% sold via wholesale or retail businesses; 5% used market pooling; 79% sold directly to consumers; 3% sold via cooperatives; and 65% used live auctions. When asked about price differentials actually received for Selection 1–Selection 2, 50 lb. slaughter goats using their current market outlets, the average was $40.35; for Selection 2–Selection 3, the average was $35.36. In the earlier questions that were extensively analyzed, we asked about price differentials at live auctions. However, if producers are truly receiving premiums of this magnitude for higher selection animals via their current markets, this might partially explain the overestimates of value provided for auction markets. Although ordinary least squares analysis was initially used to determine whether different marketing channels used by the producers could explain perceived price differentials (using current channels), no clear patterns were found.
4.1. Analyzing the Accuracy of Predicted Price Differentials
Table 2 provides regression results for producer accuracy in predicting price differentials. Fifteen producers estimated differentials exceeding $100; we used $100 as the cutoff over which it was assumed the producer misunderstood the question, so those observations were not included in the regressions. Furthermore, 162 producers did not answer the price differential questions. Considering these producers, as well as others who did not respond for some of the independent variables, 348 observations were used in Scenarios I, III, IV, and V. For Scenario II, in which only the observations from states where prices were reported for any size class were included, 215 observations were used. Huber-White heteroscedasticity-consistent robust standard errors were estimated. All variance inflation factors were <10 (the highest was 3.12), providing no evidence of multicollinearity (Kennedy, Reference Kennedy1992). Although R 2 values ranging from 0.05 to 0.16 did not suggest strong goodness of fit, lower R 2 values are typically found with cross-sectional data, and consistent signs for the independent variables across multiple regressions suggest we have identified a number of important Accuracy drivers. All F-tests were significant at P ≤ 0.05, with the exception of Scenario V for the Selection 1–2 analysis, which was significant at P ≤ 0.09.
Results of Accuracy Regressions, Selection 50 lb. Slaughter Kids

Notes: Asterisks (***, **, and *) indicate significance at the P ≤ 0.01, P ≤ 0.05, and P ≤ 0.10 levels, respectively.
Farm size was an indicator of price differential prediction accuracy; Goats was significant for 6 of the 10 regressions. For each additional breeding-aged goat on the farm, prediction accuracy improved by $0.02 for the Scenario III, IV, and V Selection 1–Selection 2, 50 lb. slaughter kid price differentials. Accuracy improved by $0.02 for the Selection 2–Selection 3 differentials under Scenario I and IV, and by $0.01 under Scenario V. Note that positive (negative) coefficient signs indicate respondents’ subjective estimates were further from (closer to) the market-based predicted estimates. As farms become larger, more goat sales are likely to occur, increasing the experience farmers have with observing differentials. Furthermore, farmers with higher sales volumes have greater incentives to become knowledgeable about price differentials.
Production system was a driver of prediction accuracy; extensive producers showed lower accuracy relative to pasture producers. Under Scenario I for the Selection 1–Selection 2, 50 lb. slaughter kid regression, movement from 0% to 100% extensive production resulted in an estimate that was $6.63 less accurate. For the Selection 2–Selection 3 regressions, %Extensive was significant for Scenarios II and IV, suggesting that movement from 0% to 100% extensive production resulted in estimated price differentials that were $4.97 to $9.33 less accurate. Lower accuracy among the extensive producers may be explained by the lower overall level of management associated with extensive goat production, which likely extends to management associated with marketing animals.
The percentage of animals sold for slaughter was a strong indicator of accuracy in predicting price differentials. For the Selection 1–Selection 2, 50 lb. slaughter kid price differential, %Slaughter was significant for two scenarios, indicating that moving from 0% to 100% slaughter sales resulted in greater prediction accuracy of $6.38 to $6.39. For the Selection 2–Selection 3 regressions, %Slaughter was significant in all five scenarios, indicating that moving from 0% to 100% slaughter sales resulted in greater prediction accuracy of $4.02 to $7.64. This result was as expected because breeders and show stock producers have less incentive to inform themselves of auction price differentials.
Whether the auction market was used for meat goat sales was an indicator of accuracy in predicting price differentials. For the Selection 1–Selection 2, 50 lb. slaughter kid price differential, Auction was significant for two scenarios, indicating that auction use resulted in greater prediction accuracy of $3.27 to $3.71. For the Selection 2–Selection 3 price differential, Auction was also significant for two of the scenarios, indicating that auction use resulted in greater prediction accuracy of $4.19 to $4.26. This result was as expected; producers selling via auction would be more familiar with price differentials at auctions.
Respondent age was an indicator of accuracy in predicting the Selection 2–Selection 3, 50 lb. slaughter kid price differential. An additional 15 years of age resulted in greater prediction accuracy of $1.48 to $2.05, likely reflecting the impact of experience observing price differentials. College was also an indicator of prediction accuracy. For the Selection 1–Selection 2, 50 lb. slaughter kid price differential, College was significant for two of the scenarios, indicating that producers holding four-year college degrees had greater prediction accuracy of $2.98 to $3.15. For the Selection 2–Selection 3 price differential, College was significant for all five scenarios, indicating that producers holding four-year college degrees had greater prediction accuracy of $4.41 to $7.03. Greater prediction accuracy of degree holders likely reflects the enhanced management skills of more highly educated producers. Although %IncGoats was included as an indicator of the economic importance of the goat enterprise to the producer, it was statistically significant in only two cases: for the Selection 1–Selection 2, 50 lb. slaughter kid price differential, Scenarios I and II, moving from 0% of farm income from goats to 100% of farm income from goats resulted in greater prediction accuracy of $1.72 to $2.79.
Strong differences were not found in prediction accuracy by region. In three cases for the Selection 1–Selection 2, 50 lb. slaughter kid price differential, West was significant, suggesting that western producers were $4.17 to $8.49 more accurate in their predictions than Southern Plains producers.
Although all of the accuracy regressions produced results that were consistent in sign (direction of prediction accuracy), only Scenario II, in which only producers from the states where the auctions were located were included, differed very much from results in which all producers were included. For instance, estimates for %IncGoats and West were of larger magnitude than those of the other Selection 1–Selection 2 scenarios, and estimates for %Extensive, %Slaughter, and College were of larger magnitude than those of the other Selection 2–Selection 3 scenarios. Furthermore, the Scenario II regressions had larger R 2 values, suggesting better goodness of fit. The trade-off between Scenario II versus the other scenarios is that better goodness of fit came at the expense of fewer observations. To more fully address the issue of accuracy, we suggest that further research be undertaken to discern more fully the auction markets where goat producers in states that do not report auction prices are selling their goats and the prices received in those markets.
An area examined in some alternative regressions was the impact of where the producer obtained price information for market prices for goats on accuracy. Generally, little statistical significance was found for these variables, probably because some of the categories included in the survey were not specific enough. Thus, they were not included in the final models. A source, however, that was significant in a number of models was “farm organizations,” suggesting that those who obtained pricing information via farm organizations responded with higher accuracy.
4.2. Analyzing the Types of Producers Who Were More Likely to Overestimate versus Underestimate Price Differentials
Table 3 presents the results of the probit models used to determine the types of producers who were more likely to over- versus underestimate the price differentials. For each of the four estimated probit models, producers who sold higher percentages of their animals for slaughter versus for breeding stock, show purposes, or other were less likely to overestimate the price differentials. Using three of the four models, respondents who indicated that they sold meat goats via auction markets were less likely to overestimate price differentials. With significant estimates for two models each, older producers and those holding college degrees were found to be less likely to overestimate price differentials. If we look closer at the probabilities of two of these independent variables, Auction and College, we see that producers who sold via auction and held college degrees were still more likely to overestimate than to underestimate price differentials, but lower percentages of these producers overestimated than those who did not sell via auction or hold college degrees. These results generally support the results of the previous section that suggest %Slaughter, Auction, Age, and College are among the drivers of accuracy in determining price differentials.
Probit Models for Whether Producers Tended to Overestimate versus Underestimate Price Differentials

Note: Asterisks (***, **, and *) indicate significance at the P ≤ 0.01, P ≤ 0.05, and P ≤ 0.10 levels, respectively.
5. Conclusions
This study was designed to determine producer knowledge of the price differentials they could expect from marketing Selection 1(2) versus Selection 2(3), 50 lb. slaughter kid meat goats. For the industry to progress to one of improved market efficiency, information regarding price differentials should be communicated to a “willing audience” of meat goat producers. It is recognized that meat goat demand changes throughout the year, depending partially on holiday seasons, with goat type demanded depending partially on the specific holiday tradition. Thus, consumer preferences for meat from a specific goat selection class may differ by season. Furthermore, the relatively disorganized structure of the meat goat industry does not make prevailing market prices easily accessible to producers. We queried producers about their perceptions of the price premiums they would expect to receive by selection class at the time they were filling out the questionnaire. To determine market-based predicted estimates of price differentials, differentials were estimated for the specific week when they completed the survey using USDA Agricultural Marketing Service survey data. Our market-based predicted estimates thus assume that the USDA Agricultural Marketing Service accurately represents market price data.
Producers generally overestimated the premiums they would receive when moving upward by selection class. In moving from Selection 3 to Selection 2 or from Selection 2 to Selection 1, 50 lb. slaughter kids, the average producer estimated an additional $24 would be received. Most producers overestimated the price differential.
Producers who were more accurate in estimating price differentials tended to operate larger-scale goat farms, were not using “extensive” systems, sold higher percentages of their meat goats for the slaughter market, were more likely to sell via auction, were older, and were more likely to hold college degrees. These results underscore the roles of farm size, system, experience, and propensity and ability to analyze pricing data in determining price differentials. To educate farmers on the price differentials, extension efforts could be targeted to smaller-scale, younger producers with less formal education.
Results of this study suggest that knowledge of price differentials among selection classes of goats is not being efficiently transferred to U.S. meat goat producers. Inefficiency in information transfer to producers is likely explained by a combination of industry structure problems, as discussed earlier, as well as by producers’ goal structures. Gillespie et al. (2013, p. 9) found that, of 14 reasons for entering goat production, “Goat production is profitable” and “Low cost to purchase and raise goats” ranked 12th and 13th, respectively, with lifestyle goals being more important. This goal hierarchy cannot be expected to lead producers to extensive research of price information. Regardless, we believe there are segments of the industry that are greatly concerned with price, so further research needs to be conducted to quantify the price differentials by market that can be expected by season. This information should be communicated to goat producers via industry and extension programs. Greater knowledge of prices that can be expected for goats of different selection classes will assist producers in managing their goat herds to maximize profit. As illustrated previously, producers cannot be expected to make decisions that maximize profit if they are unaware of the premiums they can expect from implementing enhanced management practices and advanced technologies. Furthermore, accurate price signals will provide incentives to producers to produce the types of goats consumers demand.
Appendix
Regression Results for Predicting Slaughter Kid Prices


 Open access

