

Introduction
The Arctic region is of significant interest for its potential opportunities. The importance of the Arctic is not only due to its geographical location: Polar ice melting caused by global warming will create convenient transportation routes. Additionally, the region is of great value due to its rich mineral deposits. The most significant of these are hydrocarbons, but other minerals are also of importance to the worldwide economy. According to Gauthier, Bird, Charpentier, Grantz, Houseknecht et al. (Reference Gauthier, Bird, Charpentier, Grantz, Houseknecht, Klett and Wandrey2009), the undiscovered oil reserves in the global Arctic may amount to 83 billion tons, and the reserves of natural gas may amount to 1,550 trillion cubic metres. Two-thirds of these reserves are located off the coast of Russia (Melamed, Avdeev, Pavlenko & Kutsenko, Reference Melamed, Avdeev, Pavlenko and Kutsenko2015). The Russian Arctic accounts for approximately 90% of Russia’s natural gas, 30% of associated gas, 14% of oil, over 90% of nickel and cobalt, 60% of copper, 95% of platinoids, 100% of barite, as well as many other minerals, such as diamonds, apatite, and coal (Pavlenko, Reference Pavlenko2013). Therefore, the Arctic holds significant economic importance. However, Russia’s interest in the Arctic is not only driven by economic factors but also rooted in its fundamental worldview.
The Arctic was an area of broad economic development that progressed rapidly during the Soviet Union. To a significant degree, this macroregion was exhibited as a testament to national accomplishments, highlighting the ability of the government to allocate resources towards the development of areas with challenging natural and climatic conditions. Nonetheless, the recognition that Russia’s prospects were tied to the Arctic had already been acknowledged before the 1917 revolution by M. V. Lomonosov (Reference Lomonosov1952, p. 490) and D. I. Mendeleev (Reference Mendeleev1948, p. 172). As a result, the Arctic holds a prominent position in Russian domestic policies.
Russia became more northern following the collapse of the USSR. Despite this fact, the Arctic was neglected for a long time, leading to adverse outcomes. It was only in the last decade that it began to be considered a development zone. However, this requires a large skilled population, which is not available in the Arctic at the moment. The authorities therefore face a challenging dilemma. They must choose between increasing the human capital of the local population or using shift employment. The latter model is currently preferred, but a change in the strategy of Arctic development and exploration is only a matter of time, given the severe shortage of labour – especially of skilled workers – that has long faced the Russian economy. Scientific and technological progress would be another solution to the population shortage; this would reduce the urgency of the problem in the Russian Arctic, but not solve it completely. This limitation is due to several factors – namely, the technological backwardness of the national economy, the difficult natural and climatic conditions and the unfavourable spatial disposition of the population. The demographic question is thus of crucial importance.
Demographic trends have turned negative since 1991 due to the sharp decline in living standards in the Arctic. Unprecedented migration was the resultant outcome. In Chukotka, for example, an average of 12 to 18 people out of every hundred left the region every year in the 1990s. The trends were better in other Arctic regions, but even there around 4–8 people per 100 inhabitants were leaving the region due to migration and increased mortality (Korovkin & Sinitsa, Reference Korovkin and Sinitsa2021). The situation was aggravated by the decline in birth rates that would have occurred in any case due to the beginning of the downward phase of the demographic wave. Active government policies could have lessened its impact, but that hasn’t been done. Presently, there is a continuing decline in the population, primarily due to migration.
Demographic loss is a major challenge for national Arctic policy, as the Russian population is rapidly ageing, birth rates remain low, and residents are leaving the northern territories, leading to an exacerbation of these problems. As a result, in contrast to the population growth in the foreign Arctic regions, Russia’s share of the Arctic population has declined to approximately 45% of the global Arctic population and to 1.5% of the Russian population (Heleniak, Reference Heleniak2021; Smirnov, Reference Smirnov2020). This occurred against a background of expanding interest in the Arctic both within the Arctic Council countries and globally. The issue’s significance is compounded by the deficient quality of public policy development and implementation at all levels of government, especially given that the Russian Arctic is highly diverse. Note that not only regions differ, but municipalities within the same region may also differ significantly. These features have been mentioned in the national literature (Mkrtchyan & Karachurina, Reference Mkrtchyan and Karachurina2010, Reference Mkrtchyan and Karachurina2013), but their thorough examination concerning the Arctic is scarce. Thus, a study that focuses on the demographic heterogeneity of the Arctic municipalities holds great significance.
I show the problem of demographic disparities on the example of the Republic of Sakha (Yakutia). It is the largest region in not only the Arctic but also in the entire country, with a substantial level of human capital and noteworthy potential for economic development, yet mostly unachieved in terms of both mineral and human resources, which is due to numerous social and economic problems that have accumulated over time. These problems are addressed in the Law of the Republic of Sakha (Yakutia) dated 19 December 2018, 2077-Z No. 45-VI “On the Strategy for socio-economic development of the Republic of Sakha (Yakutia) until 2032 with a target vision until 2050” (hereinafter referred to as the Strategy). However, the Strategy lacks sufficient emphasis on demographic issues, which are among the most pressing challenges confronting Russian society.
Since birth rates greatly exceed death rates, the primary demographic concern for the authorities of the Republic is the imbalance in migration flows. This problem is articulated as follows: “Spontaneous changes in the settlement system due to market factors and the expanding agglomeration of Yakutsk, the capital of the Republic.” The latter half of this statement is fully supported by the available data, but migratory processes, while spontaneous, still adhere to certain laws that determine the direction and intensity of the flows and that can be identified.
Unfortunately, there have been unfavourable trends in natural population movement. Nowadays, several municipalities have experienced a decline in population, as birth rates have grown more slowly than death rates since 2014. The indigenous peoples of the North make up a significant portion of Yakutia’s population and have higher birth rates than the Republic’s average. As a result, despite unfavourable trends, natural population growth Yakutia is expected to persist in the coming years.
Therefore, demographic analysis in the region should centre on migration. I believe that addressing the long-term population growth issue in Yakutia requires making the region more appealing to in-migrants, as the high natural population increase is almost entirely offset by an equally high migration flow out of the region. While both external and internal migration are worthy of study, the present article focuses only on the latter, because since the collapse of the USSR it has been the primary form of spatial mobility of the population (Sukneva, Reference Sukneva2008).
As I have already mentioned, the Russian regions are internally heterogeneous in terms of demographic indices. Yakutia is no exception. Studies of the causes of the differences in migration patterns in Yakutia are very relevant because the Republic exhibits significant economic heterogeneity with five distinct economic zones designated by the authorities for administrative purposes. These zones are described in detail in the methods of the study section.
Questions can therefore be raised about the extent and causes of the migration heterogeneity. For example, do variations in Yakutia’s economic zone specialisation and degree of economic development explain the differences in migration intensity? Or are these differences explained by the geographical concept of strengthening the centre at the expense of the periphery, particularly remote areas (Friedmann, Reference Friedmann and Hansen1972; Richardson, Reference Richardson1973; Todd, Reference Todd1974)? Or is there a strong influence of the ethnic factor? The answers to these questions will make it possible to better understand the patterns of internal migration in the Republic and to identify the factors that influence its intensity.
Literature review
Demographic issues in Yakutia are the best studied of all the Russian Arctic regions. This is attributed to the long history of settlement in the region, as well as the strong local demographic science. However, the literature has its limitations. Articles do not fully reflect current trends as they were written a long time ago (Sukneva & Trubina, Reference Sukneva and Trubina2009) and are limited to just a few years (Sukneva & Trubina, Reference Sukneva and Trubina2011), or they only examine a particular set of municipalities, mainly located in the Arctic (Savvinova, Filippova & Litvinenko, Reference Savvinova, Filippova and Litvinenko2021; Tomaska & Sannikova, Reference Tomaska and Sannikova2022). The only exception is Sinitsa (Reference Sinitsa2024), who nevertheless focussed on the geographical and climatic patterns of internal migration in Yakutia, without addressing the issue of internal migration within the context of the region’s economic zones.
More quantitative analysis should be used. Descriptive methods (Barashkova, Sukneva, Tarasova-Sivtseva & Struchkova, Reference Barashkova, Sukneva, Tarasova-Sivtseva and Struchkova2022; Sukneva, Reference Sukneva2010; Tomaska & Sannikova, Reference Tomaska and Sannikova2022) and population surveys (Barashkova et al., Reference Barashkova, Sukneva, Tarasova-Sivtseva and Struchkova2022; Sukneva, Reference Sukneva2010; Sukneva & Trubina, Reference Sukneva and Trubina2009) are commonly used. However, these methods provide only general information and do not allow for comparison of municipalities, as they are primarily based on the analysis of the number of migration events or migration intentions. Quantitative methods can demonstrate the extent of disparities among municipalities in both geographical and economic zones in Yakutia. Among quantitative methods, clustering is commonly used (Sukneva, Reference Sukneva2017; Sukneva & Trubina, Reference Sukneva and Trubina2009, Reference Sukneva and Trubina2011), and indices such as crude rates of in-migration, out-migration, and gross migration are applied. Expanding the number of indices used will allow for a more thorough examination of migration and yield fresh conclusions that had previously gone unnoticed.
Among all municipalities, Yakutsk is considered to be the most studied, which may be the result of a number of factors. Regional capitals like Yakutsk, being large cities, have better conditions for prosperous development (Buch, Hamann, Niebuhr & Rossen, Reference Buch, Hamann, Niebuhr and Rossen2014; Denisov, Reference Denisov2018; Glaeser & Shapiro, Reference Glaeser and Shapiro2003; Leksin, Reference Leksin2009; Nefedova, Slepukhina & Brade, Reference Nefedova, Slepukhina and Brade2016) and consequently attract residents from less-developed and smaller settlements. Yakutsk benefits from better infrastructure, higher standards of living, and a sizeable labour market (Fedorova & Ponomareva, Reference Fedorova and Ponomareva2014) contributing to the city’s superior position. Higher education institutions are also located there. But the case of Yakutsk is more intriguing than it initially seems. It stands apart as the only major northern city outside Khanty-Mansiysk and Yamalo-Nenets Autonomous Okrugs to experience significant population growth in the post-Soviet era (Sukneva & Laruelle, Reference Sukneva and Laruelle2019). The city’s remoteness from major extractive centres has prevented it from becoming a resource-based town, (e.g. Khanty-Mansiysk). Presently, it boasts a diverse economy with a well-established tertiary sector. Nevertheless, the rapid concentration of population in the capital is occurring at the expense of other municipalities, resulting in further depopulation of extremely sparsely populated areas. This prompts the inquiry into the causes behind such trends.
Population out-migration from small settlements in the Arctic stems from a complex set of factors (Bogdanova et al., Reference Bogdanova, Filant, Sukhova, Zabolotnikova, Filant, Raheem, Shaduyko, Andronov and Lobanov2022; Huskey, Reference Huskey2009; Savvinova et al., Reference Savvinova, Filippova and Litvinenko2021; Tomaska, Reference Tomaska2018). Economic factors include few job opportunities in most settlements, a significant number of monotowns, low salaries with high prices for goods and services, and high unemployment. Social factors can be attributed to inadequate social infrastructure, limited access to tertiary services, and low living standards. Additionally, there are other factors, such as poor transport accessibility to many settlements in the context of very poor quality roads or even their absence, harsh natural and climatic conditions, as well as a scattered population. However, these challenges were common in the former Soviet Union. For example, as early as the 1970s, it became clear to researchers that it would be impossible to attract a highly skilled labour force to the regions of Siberia and the Far East through economic measures alone (Zhuchenko & Steshenko, Reference Zhuchenko and Steshenko1972, p. 43). Therefore, suitable social infrastructure, housing, and utilities are crucial to prevent a significant migration outflow amidst a large migration influx. Several later studies (Gonina, Reference Gonina2016; Kalemeneva, Reference Kalemeneva2017; Karpov & Yudakova, Reference Karpov, Yudakova, Zhiromskaya and Stas’2015) have emphasised this point.
Articles discussing migration in the USSR highlight several factors, but economic ones are given priority (Buckley, Reference Buckley1995; Grandstaff, Reference Grandstaff1975; Mitchneck, Reference Mitchneck1991; Shubkin, Reference Shubkin1970; Zaslavskaya, Reference Zaslavskaya1970; Zhuchenko & Steshenko, Reference Zhuchenko and Steshenko1972). This is also true for the post-Soviet era (Andrienko & Guriev, Reference Andrienko and Guriev2004; Brown, Reference Brown1997; Fidrmuc, Reference Fidrmuc2004; Gerber, Reference Gerber2006; Vakulenko, Reference Vakulenko2019; Vakulenko & Mkrtchyan, Reference Vakulenko and Mkrtchyan2020). Studies on Yakutia confirm these findings, especially for the Arctic municipalities (Barashkova et al., Reference Barashkova, Sukneva, Tarasova-Sivtseva and Struchkova2022; Mostakhova & Tumanova, Reference Mostakhova and Tumanova2009; Sukneva & Laruelle, Reference Sukneva and Laruelle2019; Sukneva & Trubina, Reference Sukneva and Trubina2009; Tomaska, Reference Tomaska2018).
To summarise, it should be noted that while there are plenty of works describing the situation, there remains a need for articles studying migration over a sufficient period of time that are based on the current zoning of the Republic for state management purposes and include numerous migration intensity indices. This approach will enable identification of reliable and sustainable long-term trends at the municipal level, assessing potential disparities between various areas of Yakutia, and evaluating their magnitude. Galle, Burr & Potter (Reference Galle, Burr and Potter1993) provide a good example of such an approach for the USA.
Study methods
Studies have reported a significant rise in the intensity of internal migration in the Republic of Sakha (Yakutia) after 2011 (Sukneva & Tarasova-Sivtseva, Reference Sukneva, Tarasova-Sivtseva, Popova and Sukneva2018). Although high intensity of internal migration may not have a detrimental effect on the region’s development, the case of Yakutia shows that it requires particular attention due to population concentration in the capital, the most developed municipality, and population outflows from other municipalities.
This article therefore seeks to identify the patterns of internal migration in the economic zones of Yakutia. This objective is of particular relevance to Russian researchers, as it would clarify the trends in the internal migration in the northern regions – notably the case of an economically developed but heterogeneous region with a high proportion of indigenous peoples of the North in the population. This is particularly pertinent given the changes in the methodology for registering migrants that occurred in 2011 and the sanctions imposed on Russia after the conflict in Ukraine began in 2014. The results would also be of considerable value to those who research the global Arctic, as it elucidates the influence of unpredictable external global shocks (e.g. the 2008–2009 financial crisis and the COVID-19 pandemic) on migration patterns, as there is a paucity of research on these issues focussed on the Arctic.
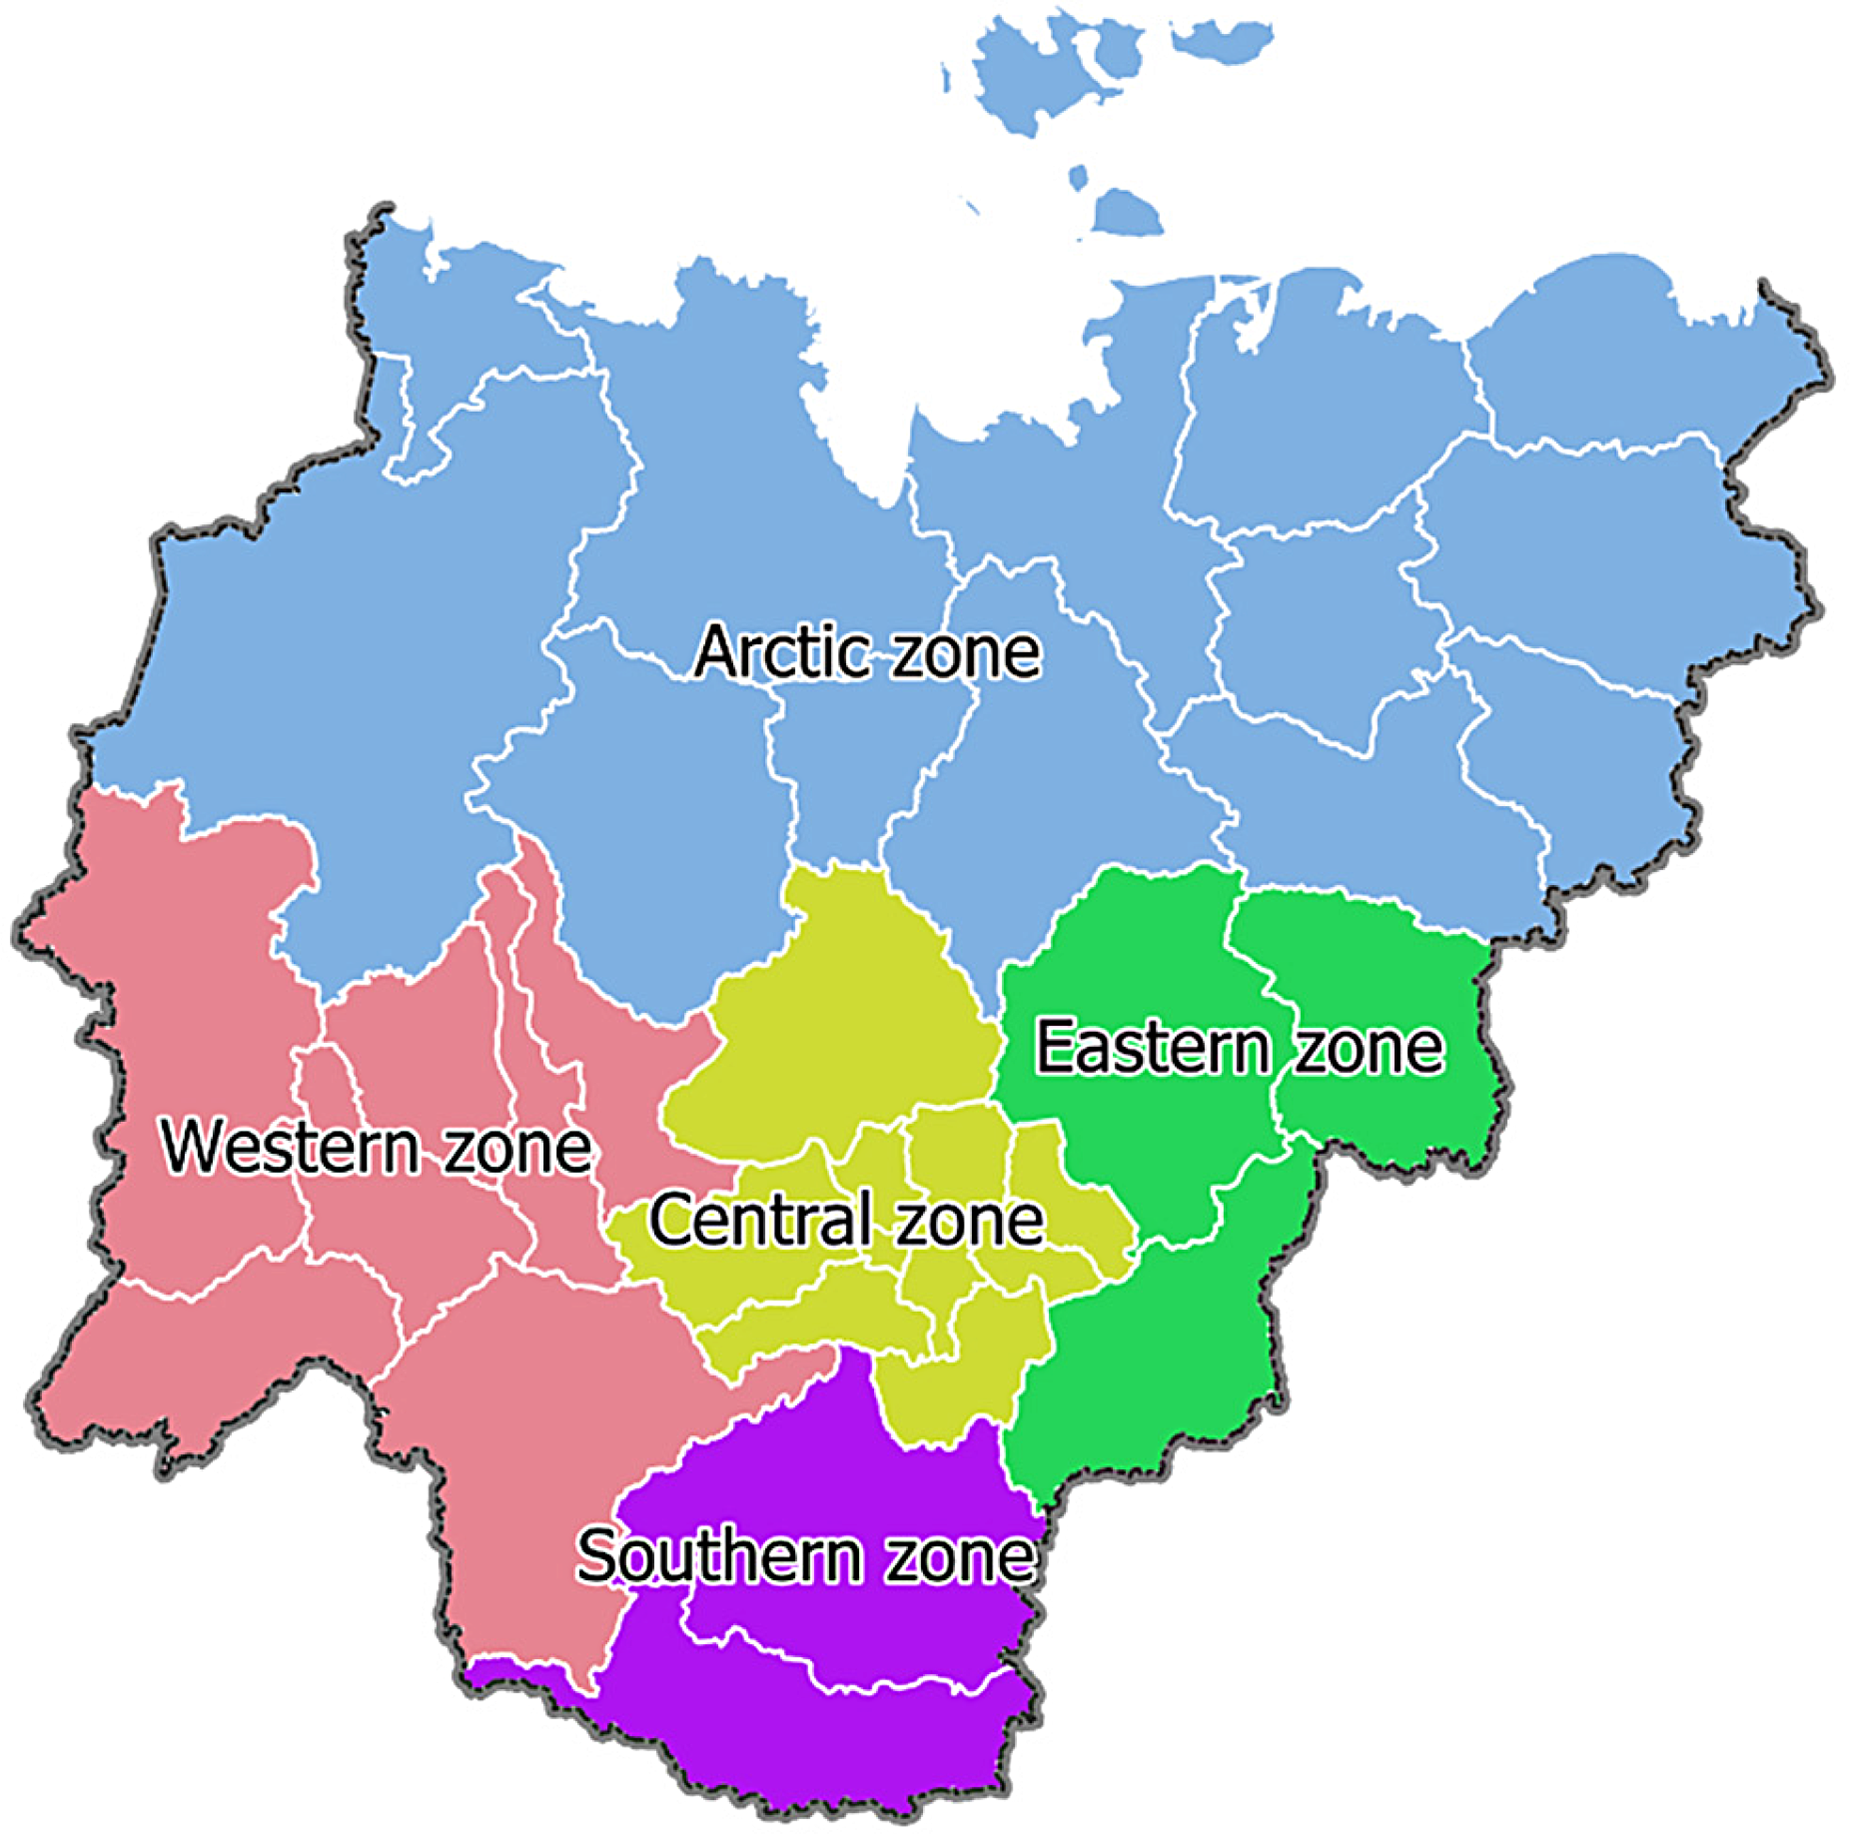
The structure of the economic zones is presented in the Strategy of socio-economic development of the Republic of Sakha (Yakutia) until 2032 (see Fig. 1). The Central economic zone (representing 54% of the total population of the Republic) comprises Amginsky, Churapchinsky, Gorny, Khangalassky, Kobyaysky, Megino-Kangalassky, Namsky, Tattinsky, and Ust-Aldansky municipal districts (uluses), along with the city of Yakutsk and its subordinate territories. The primary sectors of the economy there include manufacturing, services, finance, public administration, trade, and agriculture. The Western economic zone includes Lensky, Mirninsky, Nyurbinsky, Olyokminsky, Suntarsky, Verkhnevilyuysky, and Vilyuysky municipal districts, totalling 24% of the population. Industry specialisations include mining, transport, construction, and agriculture. The Southern economic zone consists of two economically developed municipal districts – Aldansky and Neryungrinsky. It is home to 12% of the total population. The primary industries in these districts are transportation, power generation and distribution, manufacturing, and construction. The Eastern economic zone which comprises 3% of the total population encompasses Oymyakonsky, Tomponsky, and Ust-Maysky districts that hold substantial reserves of non-ferrous metals. The Arctic zone (7% of the total population) stands out on its own. It comprises of Abyysky, Allaihovsky, Anabarsky (Dolgano-Evenki), Bulunsky, Eveno-Bytantaysky national, Momsky, Nizhnekolymsky, Olenyoksky (national Evenki), Srednekolymsky, Ust-Yansky, Verkhnekolymsky, Verkhoyansky, Zhigansky (national Evenki) uluses. It is primarily characterised by conventional forms of land utilisation, namely reindeer herding, hunting, fishing, and the collection of mammoth bones.
Economic zones in the Republic of Sakha (Yakutia).
For the analysis of migration trends, I use six indices. Since most of them are crude rates that depend on the age distribution of the population, they should be used with caution. However, the variations are negligible, as the age structure of the populations of the uluses is quite similar and stable over time. I also use the Pokrovsky-Pearl vital index (VI), that is a measure of the results of natural population movements.
The following notations are used in the formulae below:
B – live births during a year
D – deaths during a year
P – the mid-year population
I – total in-migration during a year
E – total out-migration during a year
II – internal in-migration during a year
EI – internal out-migration during a year
The formulae are as follows for internal migration:
 $${\rm{Crude \;rate \;of \;in}} \hbox- {\rm{migration}} \;\left( {{\rm{CI}}{{\rm{R}}_{\rm{I}}}} \right){\rm{ }} = {{{I_I}} \over P} \times 1000$$
 $${\rm{Crude \;rate\; of \;out \hbox- migration}}\;\left( {{\rm{CO}}{{\rm{R}}_{\rm{I}}}} \right) = {{{E_I}} \over P} \times 1000$$
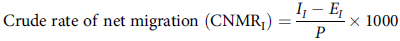 $${\rm{Crude \;rate \;of \;net \;migration }} \;\left( {{\rm{CNM}}{{\rm{R}}_{\rm{I}}}} \right) = {{{I_I} - {E_I}} \over P} \times 1000$$
 $${\rm{Crude \;rate\; of\; gross \;migration }}\;\left( {{\rm{CGM}}{{\rm{R}}_{\rm{I}}}} \right) = {{{I_I} + {E_I}} \over P} \times 1000$$
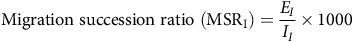 $${\rm{Migration \;succession \;ratio }}\;\left( {{\rm{MS}}{{\rm{R}}_{\rm{I}}}} \right) = {{{E_I}} \over {{I_I}}} \times 1000$$
 $${\rm{Migration \;effectiveness \;ratio }}\;\left( {{\rm{ME}}{{\rm{R}}_{\rm{I}}}} \right) = {{{I_I} - {E_I}} \over {{I_I} + {E_I}}} \times 100$$
Formula (5) takes the following form when the total migration is considered:
 $${\rm{Migration \;succession \;ratio }}\;\left( {{\rm{MSR}}} \right) = {E \over I} \times 1000$$
The following formula is used as a population reproduction measure:
 $${\rm{Pokrovsky \hbox- Pearl \;vital \;index }}\; \left( {{\rm{LI}}} \right) = {B \over D} \times 100$$
These ratios have been used for a long time and are well established in the literature. Worth mentioning are the migration succession and migration efficiency ratios, which are almost never used in studying the Russian Arctic. The first index is calculated as follows: Departures divided by arrivals multiplied by 1,000. A municipality loses population during migration exchange if the value is higher than 1,000, and gains population when it is lower than 1,000. If the value is less than 500, the exchange is considered successful.
The second index represents the net migration to gross migration ratio multiplied by 100. Low ratios indicate balanced inflows and outflows, while high ratios indicate that migration is highly efficient as a mechanism for spatial redistribution of the population. The crude rate of net migration and the migration efficiency ratio tend to have a close correlation (Plane, Reference Plane1984; Rogers & Raymer, Reference Rogers and Raymer1998) indicating the population’s response to changes in migration incentives and restrictions. Nevertheless, these two measurements assess different aspects of migration. The former is a measure of the impact of migration on changes in the size of the population, while the latter is a measure of the balance of migration flows. Finally, the crude rate of net migration is calculated using population size as the denominator, and consequently, is affected by past demographic trends. In contrast, the migration efficiency ratio is based on population movements into and out of a region over a given period of time. It is more sensitive to temporal and spatial changes in migration flows.
My main task is to determine if there are disparities in migration patterns between the economic zones of Yakutia. The study’s central hypothesis posits their existence, leading to considerable heterogeneity. The criteria for using ANOVA are not met. Therefore, as in (Sinitsa, Reference Sinitsa2024), I opt for the nonparametric van der Waerden test. After all, although the role of Yakutsk is frequently discussed, there is limited data available in the literature to evaluate its impact on the overall trend with figures. On the basis of formulas (1–6), I show how the capital differs from the other municipalities.
Yakutia is a region that contains more than 40 nationalities. It is therefore important to consider the role of ethnic factors in migration. It would be erroneous, however, to posit a dichotomy between Yakuts and the small indigenous minorities (SIMs) on the one hand and Russians on the other. Russians can be considered one of the indigenous peoples of Yakutia, given that Yakutia has been actively colonised since the 17th century (Barashkova & Sinitsa, Reference Barashkova and Sinitsa2023). It is thus essential to consider two distinct groups of the population: those who have established roots in the region and those who have not. The latter category encompasses Russians and individuals from other nationalities who migrated to Yakutia during the Soviet era but moved back in the 1990s.
Yakutia is the principal homeland of the Yakuts and several SIMs. Their role in external migration is thus less significant. It seems reasonable to posit that districts with a high proportion of Russians (i.e. the economically developed southern and western districts) were oriented towards external migration and had low values for gross migration and other crude rates. The rates in the remaining districts, which are dominated by Yakuts and the SIMs, demonstrated higher values of internal migration. A comparative analysis of the municipal districts is sufficient for examining the distinctions between the Russian and Yakut populations, given that the majority nationality accounts for 70%–90% of the total population in a significant number of them.
In comparing the SIMs with other nationalities, it is possible to make a distinction between the Arctic zone, where they represent a high proportion of the total population, and the remaining territory of the Republic. The Mann–Whitney test revealed that no such correlation exists at the expense of the central and eastern districts (Sinitsa, Reference Sinitsa2024), so this article has focussed on the behaviour of the population of relatively large settlements with at least an 80% share of the SIMs, situated in regions with a low overall SIMs population (i.e. places with concentrated SIMs settlement). A comparison was then made with the remainder of the district. The Mann–Whitney test was employed to ascertain whether an ethnic factor influenced internal migration. For the analysis, the following administrative-territorial units were selected: The villages of Iyengra (Neryungrinsky district), Topolinoye (Tomponsky ulus), Sebyan-Kyuyol (Kobyaysky ulus), and Ezhantsy (Ust-Maysky ulus). In examining the northern districts, the village of Andryushkino was selected for comparison with an urban settlement, Chersky (the capital of Nizhnekolymsky ulus), where there is a significant Russian population.
The results presented in the figures below cover entire economic zones rather than particular municipal districts. The calculations in Table 1 are based on the values of the indices (1–6) for the districts, resulting in uluses with varying population sizes receiving identical weights. Consequently, significant statistical differences may exist between uluses despite the graph lines being visually similar. On the other hand, there may be no statistically significant differences even with the widespread data on the graphs.
The study’s data originated from the local statistical body for the Republic of Sakha (Yakutia), which is called Sakhastat (https://14.rosstat.gov.ru/). My colleagues from Yakutia procured statistical yearbooks on migration to facilitate work on the project. The selected period of analysis was 2006–2023, which provides an adequate time frame to discern long-term trends. The decision to start the analysis in 2006 was solely based on the availability of data. Although there are more recent data, I initially planned to use 2020 as the upper limit, because migration dynamics were strongly influenced by COVID-19 starting in 2020. For that reason, migration in 2020–2021 deserves its own article. This work has already partly been done for Yakutia (Tomaska, Reference Tomaska2022), but one of the reviewers suggested that the study period be extended to 2023. I agreed with the proposals, but I should point out that the data are less reliable after the start of a new phase of the armed conflict in Ukraine.
My analysis is limited to long-term migrants and excludes temporary migrants, especially shift workers. The two time periods (2006–2010 and 2011–2023) are analysed separately, although they are presented together in the graphs. This is because migration data before and after 2011 are not comparable due to changes in the methodology for registering migrants. A more detailed discussion of these changes can be found in (Sinitsa, Reference Sinitsa2024).
Data sources on migration in the Republic of Sakha (Yakutia) and their availability
Lack of data is a significant challenge for the study of the Russian Arctic, particularly for foreign researchers. The lack of demand for analysis by government agencies and the poor quality of statistical monitoring in Russia are frequently highlighted, yet these problems persist and are becoming increasingly pronounced (Bessonov, Reference Bessonov2011, Reference Bessonov2021; Eliseeva, Reference Eliseeva2011). Despite its importance, migration statistics remain a neglected area of statistics (Chudinovskikh, Reference Chudinovskikh2004, Reference Chudinovskikh2017; Chudinovskikh & Stepanova, Reference Chudinovskikh and Stepanova2020). Numerous studies have shown that there are significant discrepancies (i.e. more than three million people) between the databases of the Federal State Statistics Service (Rosstat) and the Main Directorate for Migration of the Ministry of Interior (along with the Federal Migration Service). It is also impossible to compare different periods because of repeated changes in the methodology for registering migrants (in 1995, 2002 and 2011). The completeness of the registration of migration events is questionable. Significant amounts of data were also collected but not published; these data can only be obtained by making a direct request to Rosstat. When studying the Russian Arctic and Far North, one should also remember that only part of a region may belong to these areas. This is a big problem because obtaining municipal data can often be difficult.
It seems pertinent to begin by outlining the sources of data on the Far North in general. The bulletin “Economic and social indicators of the Far North and equated areas” (https://rosstat.gov.ru/compendium/document/13279) contains data on a wide range of topics, while the bulletin “Population size and migration in the Russian Federation” (https://rosstat.gov.ru/compendium/document/13283) presents data on migration. The webpage dedicated to demographic statistics (https://rosstat.gov.ru/folder/12781) also provides a considerable amount of data. No matter which source is used, however, the methodological notes must be read with great care, as Russian statistics have certain idiosyncrasies. The population censuses are currently the only source of data on the SIMs, because the statistical bulletin “Economic and social indicators of the areas inhabited by small-numbered indigenous peoples of the North” (https://rosstat.gov.ru/compendium/document/13296) has only been published for the period between 2005 and 2010.
The statistical yearbooks published by Sakhastat provide the most comprehensive data on demographic trends in Yakutia. The Statistical Yearbook of the Republic of Sakha (Yakutia) is the general but comprehensive data source, but Sakhastat also publishes statistical yearbooks on the following demographic issues: basic demographic indicators, population size as of 1 January, age-sex composition of the population (in two volumes), population migration, basic indicators of natural population movement (in two volumes) and mortality. Unfortunately, it is not easy for researchers living outside Yakutia – particularly those from abroad – to access these yearbooks. One can try making an official request, but there is no guarantee of receiving the data. Access is also contingent upon payment, with the exception of the statistical yearbook (the penultimate and pre-sequential issues are available online). One potential solution is to collaborate with an author from Yakutia who possesses access to statistics; this would be beneficial because local researchers have a more nuanced understanding of the developments and events in the region that receive little media coverage but are of significant consequence to local communities.
The database of indicators of municipal units (https://rosstat.gov.ru/dbscripts/munst/) can be used if one cannot consult with researchers from Yakutia. Note that data are provided starting from 2008 to 2014 (usually 2011) to the present, depending on the region and indicator. In some years, there might be no data or obviously erroneous data. Depending on the indicator, the proportion of such cases can range between 0% and 100%. To illustrate, the database lacks data regarding the number of internal migrants and migrants in general in Yakutsk between 2021 and 2023. Nevertheless, the Sakhastat website provides figures for the entire region. The number of migrants in Yakutsk can be calculated by subtracting the number of migrants in each municipal district from the total number of migrants. On occasion – and unrelated to the frequency of updates – the database may be unavailable for 1–2 weeks. Nevertheless, it remains a valuable source, as it enables the simultaneous retrieval of data by sex (men, women and total), age (by 5-year age groups) and migration direction (total, within Russia, intraregional, interregional, international, to the CIS countries, to other foreign countries).
Finally, within the framework of the dynamic series project “Figures of Yakutia (XIX–XXI centuries)” (https://14.rosstat.gov.ru/folder/209360), Sakhastat provides information on the size of the population (by region and municipal districts since 1855 and 1940, respectively); on the ethnic composition of the population (by region according to the population censuses since 1912); on marriage and divorce rates (by region according to the population censuses since 1926); on the number of families and the number of their members (by region according to the population censuses since 1959); on natural population movement (by region and municipal districts since 1862 and 1939, respectively); on migration (by region and municipal districts since 1936 and 1990, respectively); and on marriage rates in Yakutia by locality of residence since 1862, on divorce rates since 1940, and for municipal districts for both indices since 1980. In terms of the volume of published municipal data, Sakhastat is thus one of the leading (if not the best) territorial statistical agency.
General demographic and migration trends in the Republic of Sakha (Yakutia)
The population of Yakutia saw a significant increase during the reviewed period, setting it apart from most other Russian regions. Growth resulted from a natural increase of population, while migration had a negative impact.
With the exception of the Eastern and Southern zones, natural population growth was observed in all other economic zones (see Fig. 2). From 2006 to 2023, there were 263.4 thousand births and 157.4 thousand deaths in Yakutia, resulting in an average of 5.9 thousand more births per year. The Pokrovsky-Pearl VI, calculated using Eq. (7), fluctuated between 150 and 190, with negative dynamics after 2014.
Pokrovsky-Pearl vital index from 2006 to 2023.
In 2020, half of the districts exhibited the lowest values of the index across the entire period analysed. In the following years, many minima were updated. Aldansky, Oymyakonsky, Ust-Maysky, and Verkhnekolymsky uluses had the lowest average values (ranging between 82 and 88), followed by Lensky and Abyysky uluses with an average value of 111 and 113, respectively. The uluses with an average VI value exceeding 240 are Gorny and Namsky, whereas Churapchinsky falls short of this group.
The results of the van der Waerden test demonstrated the existence of strong disparities between economic zones. P-values greater than 0.01 were observed for the test statistic only in 2020–2021 and 2023. From an ethnic standpoint, the highest VI values were observed in the uluses with a significant Yakut population, and low values were characteristic of the uluses with a predominantly Russian population.
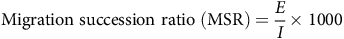
From 2006 to 2010, there were 97.1 thousand arrivals and 129.4 thousand departures. Between 2011 and 2023, these numbers rose to 534.3 and 574.1 thousand, respectively. In the first period, departures exceeded arrivals by an average of 6.5 thousand events per year, and in the second period by 3.1 thousand events. Migration therefore had a negative impact on population size. The migration succession ratio (MSR), calculated according to Eq. (5a), illustrates this. During the period studied, the MSR values decreased in all economic zones and approached 1,000, which indicates a decline in migration outflows (see Fig. 3), but they exceeded inflows only in 2020–2021 and 2023. In 2023, however, it was Yakutsk and Mirninsky district that exhibited a distinctive pattern, accounting for approximately half of the migration turnover. The other four districts with MSR values below 1,000 accounted for a further 10% of the turnover. The remaining 29 districts experienced a population decline due to migration.
Total migration succession ratios from 2006 to 2023.
Only Yakutsk, which attracted both internal migrants and migrants from outside Yakutia, maintained an MSR below 1,000 throughout the period. The MSR of municipal districts fell significantly behind it, but as the MSR in Yakutsk has increased and the MSR in the rest of the Republic have decreased, they became more comparable. The results of the van der Waerden test showed the existence of disparities between economic zones only in 2021 (at the 0.1 significance level). It is difficult to say whether ethnic patterns exist, but all the districts with the highest MSR values had a high proportion of Yakuts.
Dynamics of internal migration in the Republic of Sakha (Yakutia)
Internal migration is currently the main form of spatial mobility for the population of the Republic of Sakha (Yakutia), accounting for 65%–74% of all arrivals from 2006 to 2010 and 62%–68% in 2011–2018. By 2019, it decreased to 58.5%. From 2020 onwards, it was 48%–50%. Only in 2021, probably due to compensatory migration, it rose to 52%.
Internal out-migration has been less popular, accounting for 43%–60% until 2011 and 50%–60% in 2011–2019. With the exception of 2022 (47%), out-migration remained in the 50%–60% range after 2019.
Between 2006 and 2010, about 68.0 thousand people arrived within the framework of internal migration. From 2011 to 2023, they numbered approximately 311.6 thousand. The numbers of departures were the same, as Yakutia is a closed system for this type of migration. The Central (Churapchinsky, Khangalassky, Megino-Kangalassky, Namsky, and Ust-Aldansky districts and Yakutsk), partly the Western (Mirninsky and Vilyuysky districts) and the Southern (Neryungrinsky district) zones had the largest number of arrivals both before and after 2011. Fewest people moved to the Arctic (Abyysky, Allaihovsky, Anabarsky, Eveno-Bytantaysky, Momsky, Olenyoksky, Nizhnekolymsky, Verkhnekolymsky, and Zhigansky uluses) and the Eastern (Oymyakonsky ulus) zones. The Central zone accounted for 62%–72% of all arrivals, while the Western zone had a share of 14%–20%. The sparsely populated Eastern zone received 1.5%–3.0% of all in-migrants. 5%–7% of them came to the Southern zone, but as of 2016 closer to 5%. The Arctic zone’s share was 6%–9% of all arrivals.
Despite some idiosyncrasies, the distribution of the uluses by departures during internal migration was similar to the distribution by arrivals. Yakutsk differed less from the other municipalities in the number of departures. The majority of departures was in the Western (Nyurbinsky, Suntarsky districts) and Central (Churapchinsky, Khangalassky, Megino-Kangalassky, Namsky, and Ust-Aldansky uluses, and Yakutsk) economic zones. The Arctic zone (Abyysky, Allaihovsky, Anabarsky, Eveno-Bytantaysky, Momsky, Nizhnekolymsky, Olenyoksky, Verkhnekolymsky, and Zhigansky uluses), and Eastern (Oymyakonsky ulus) zones had the lowest number of departures. The Central zone accounted for 52%–60% of all departures, whereas the Western zone had a share of 22%–26%. The Eastern zone had 3%–4.5% of all out-migrants. 4.5%–6.5% of them moved from the Southern zone. Finally, the Arctic zone accounted for 10%–12% of all departures. The share of the Central zone increased, while the shares of the other zones decreased.
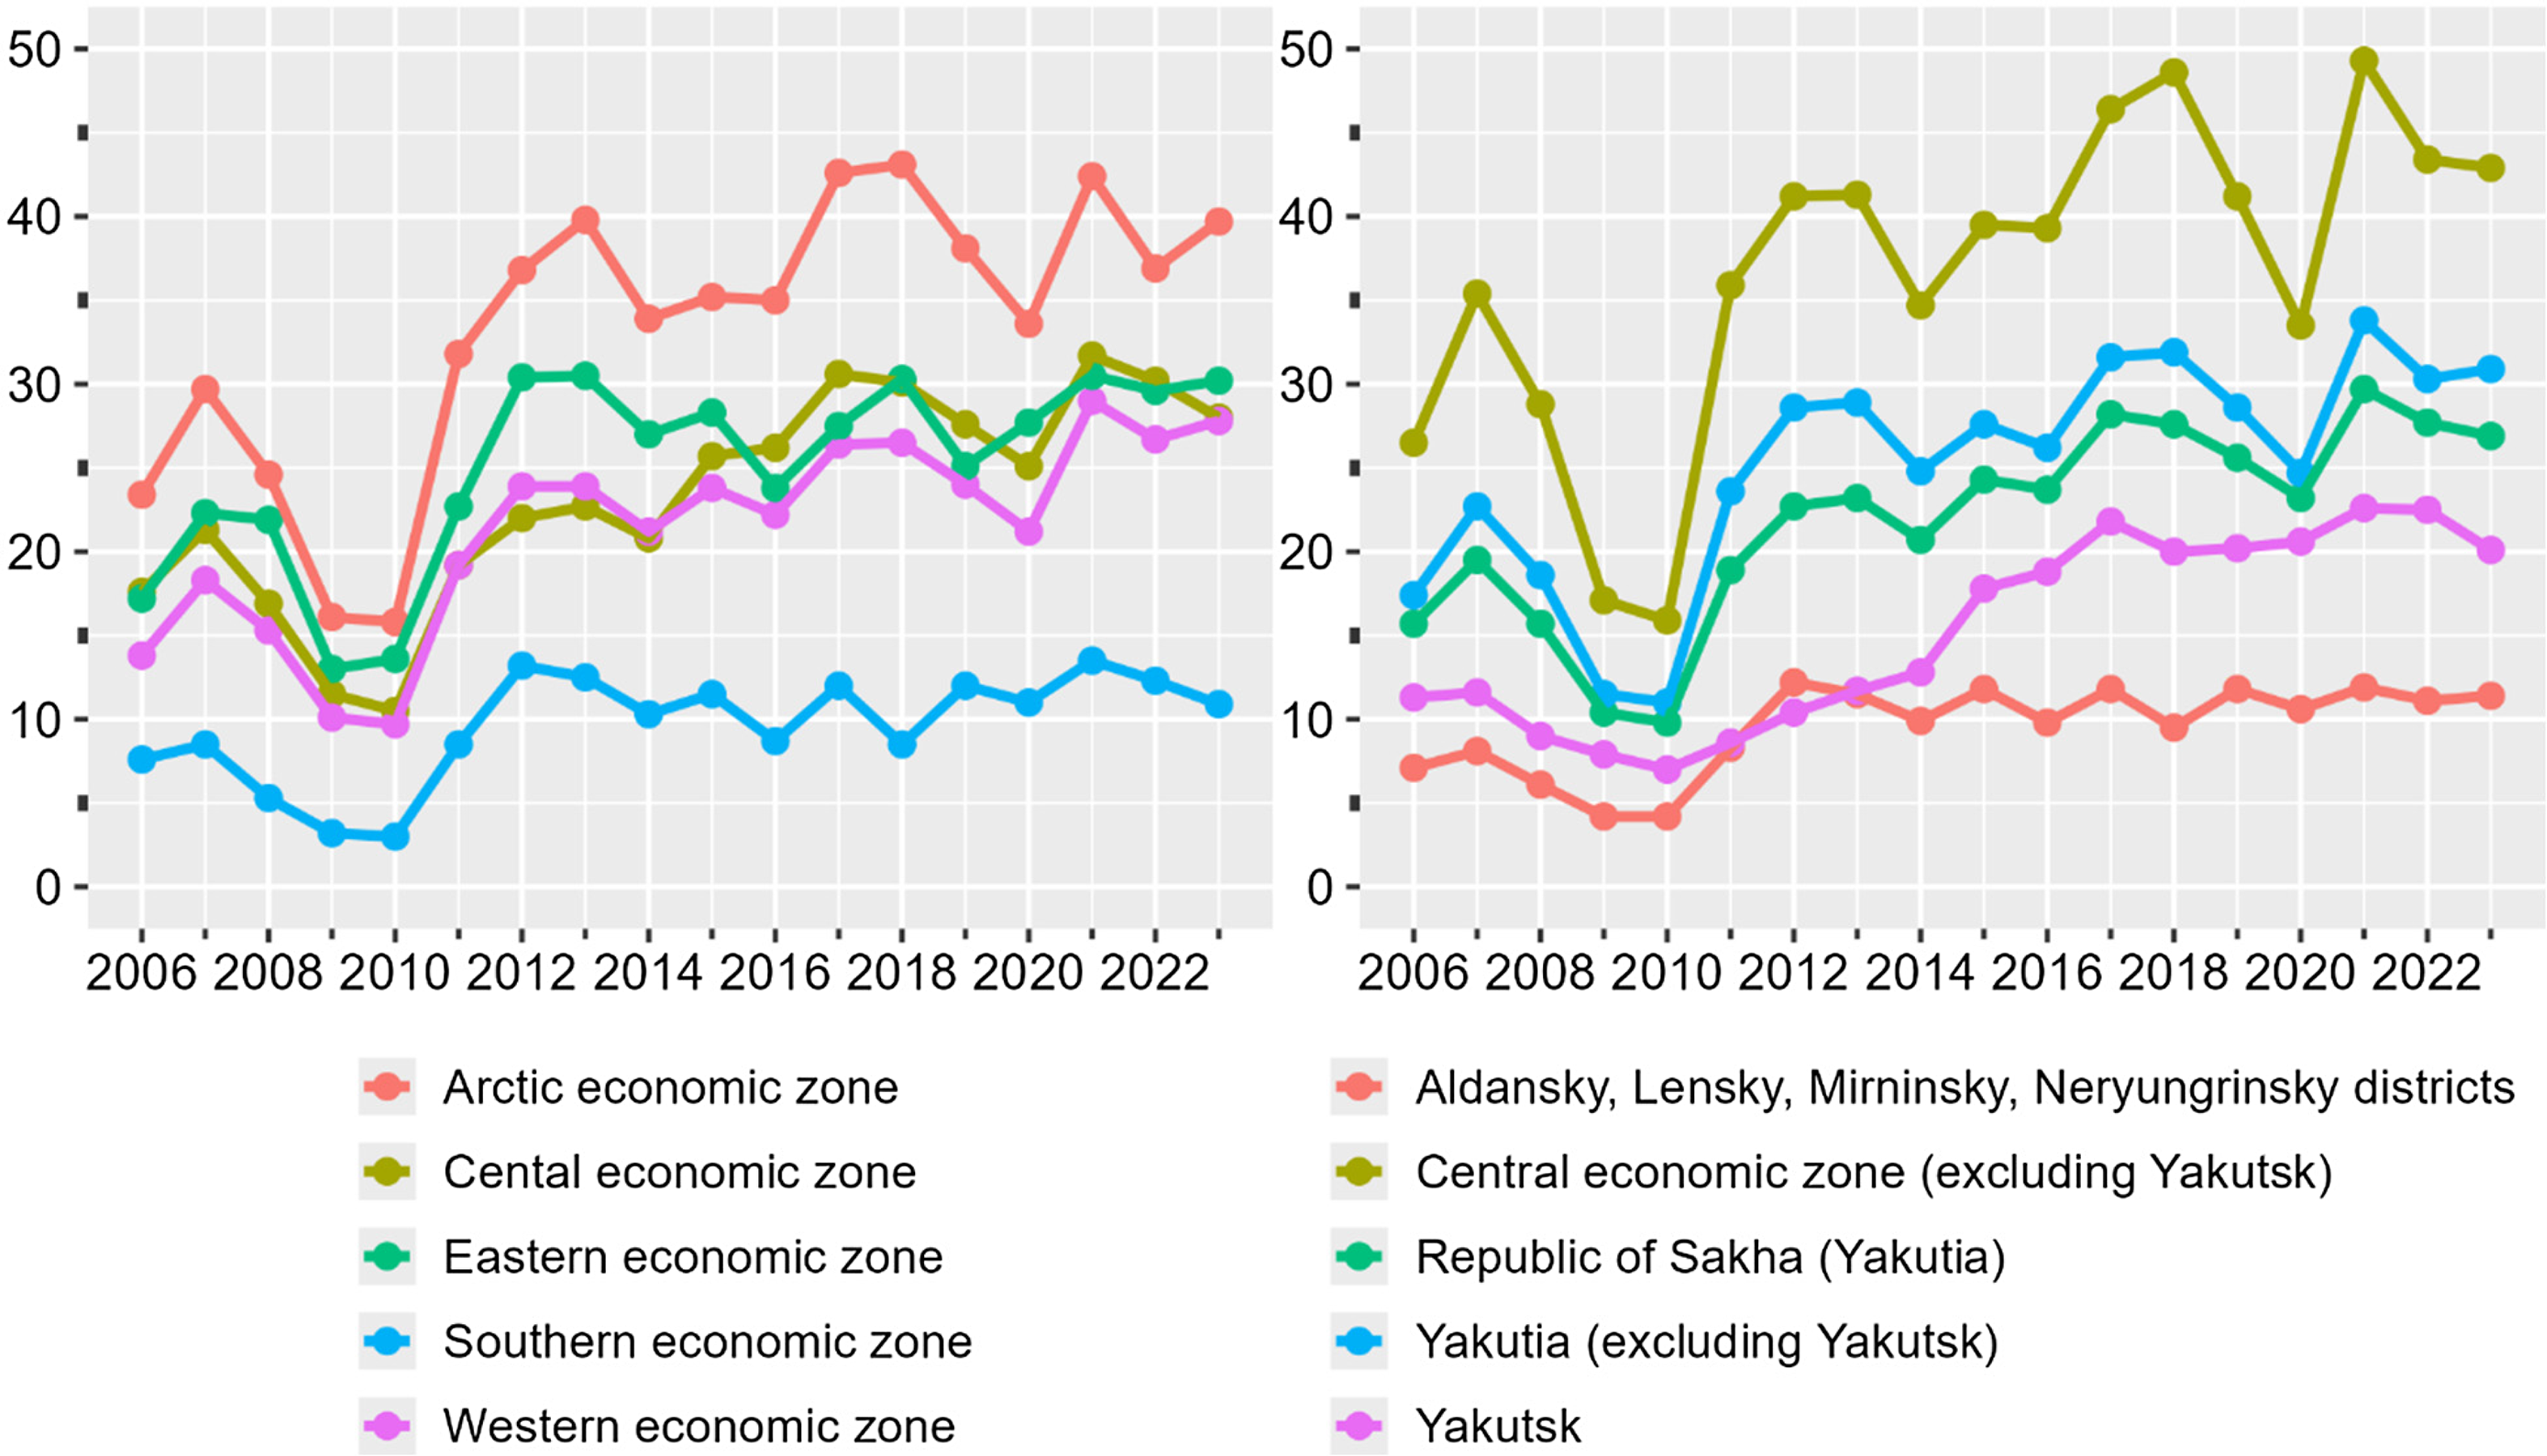
The absolute numbers can be used for identifying patterns in population movement. However, their shortcoming is that main disparities are due to the population size of the municipalities. Therefore, I use Eqs. (1–6) to compare the districts. The most basic of these are the crude rates of in-migration (CIRI) and out-migration (CORI), introduced by Eqs. (1) and (2), which describe a population’s “risk” of migration.
Figure 4 shows, in line with the general trend for the country, an increase in the intensity of arrivals in the second part of the period. There are several reasons to explain these trends. Wage dynamics had a strong impact on internal migration. Thus, the decline in the crude rates of in-migration (CIRI) during 2009–2010 can primarily be attributed to the global financial crisis. Due to a decline in wages, the number of individuals citing “work-related” reasons for migration decreased. The crisis also affected the number of arrivals with secondary education. While the decline was noticeable throughout all the Republic, it was particularly prominent in the capital (decrease of more than two times in 2009 and of more than five times in 2010) where the cost of living and studying became unaffordable for many.
Crude rates of in-migration from 2006 to 2023.
After the end of the financial crisis, in-migration generally increased, and this was not only due to the changes in the methodology of migrant registration. In my view, the growth after 2010 is compensatory for the period 2011–2013, primarily for educational and long-term labour migration. The decline in the number of students was largely responsible for both the 2014 and post-2017 reductions in migrant registrations. In both cases, Yakutsk had a decisive influence. Nevertheless, in the second case it is impossible to say exactly what the reasons were, as the share of those who did not specify a reason for their arrival has begun to account for between a quarter and a third of all arrivals since 2016, and the share of a reason such as “return after a temporary absence” increased significantly during the same timeframe.
Due to COVID-19, the number of movements decreased by 8.6% in 2020 compared to the previous year, which was followed by a substantial compensatory increase in 2021. The municipal districts exhibited different patterns during the 2020–2021 period. However, in subsequent years, the upward trend in the intensity of arrivals persisted.
Churapchinsky, Namsky, and Ust-Yansky were the uluses with the highest CIRI before and after 2011. Only the city of Yakutsk and Zhigansky ulus could qualify for this group before 2011. During the period 2020–2023, the highest rates were observed in Momsky and Vilyuysky uluses. Among the districts with the lowest CIRI, Aldansky and Lensky stood out. Before 2011, Oymyakonsky and Verkhoyansky districts joined this grouping, but were replaced by Mirninsky and Neryungrinsky districts in 2011–2023.
Yakutia is a resource-based region. It is important to note that the trends mentioned above are determined by the overall economic conditions of an ulus, rather than by the implementation of large resource projects that required shift workers. For example, Lensky and Neryungrinsky uluses have not experienced a significant increase in internal migrants following the coming onstream of the Chayanda oil and gas condensate field and the Elga coal field. Significant external migration flows are also directed to Mirninsky and Aldansky districts for diamond and other resources mining.
Since 2014, the highest intensity of arrivals has been in the Central zone with lower than average values in Yakutsk. Comparable values were observed in the Arctic zone. Initially, the Central zone stood out from the general background due to high values in Yakutsk. However, the contribution of Yakutsk has become less pronounced against the background of the overall increase in the CIRI since 2014. As a result, uluses near Yakutsk have begun to show the highest values. The Central zone maintained its leadership at the expense of other districts. Conversely, in the Southern zone, there was a slight decline in the already low values at the expense of Neryungrinsky district. The Eastern and Western zones held an intermediate position with moderate growth of CIRI and below the average values of the index, but the latter was characterised by significant heterogeneity.
Yakutsk is the largest municipality and accounted for 40%–50% of all arrivals, although its share has been decreasing since 2011. Six main municipal units (Aldansky, Lensky, Mirninsky, Neryungrinsky, and Nyurbinsky districts in addition to Yakutsk) had a share of 50%–60% of all arrivals, with a marked downward trend after 2011 as well.
There was a greater increase in the intensity of out-migration (Fig. 5), with generally similar dynamics relative to in-migration. In addition to the “study-related” and “work-related” reasons as the most important ones determining the peaks of the dynamics, “personal, family reasons” have been added. After a rather flat dynamic before, its contribution was noticeable between 2015 and 2017. As previously noted, there was a decrease in job opportunities and disposable income in 2009–2010, resulting in reduced departures for employment purposes. For the same reasons, fewer people left after completing their education. The increase in migration during 2012–2013 can be attributed to a greater number of graduates leaving their place of study. Since 2016, it is difficult to analyse the reasons for departures. This is due to the emergence of reasons such as “return after a temporary absence” and a significant increase in the number of individuals who do not specify a reason for leaving. It is noteworthy that both in-migration and out-migration declined in 2014. It seems probable that the reduction in remuneration and the deterioration in key macroeconomic indicators had a negative impact on long-term internal migration.
Crude rates of out-migration from 2006 to 2023.
The increase in the crude rates of out-migration (CORI) in 2020 compared to CIRI was much lower and was observed in only seven uluses (compared to half of the uluses in the case of in-migration), three of which are located in the Arctic zone, with one in each of the other zones. This indicates that the general trends remained unchanged. Further support for the persistence of the previously established trends is that a peak in out-migration in 2021 was short-lived.
The homogeneous group comprising Aldansky, Lensky, Mirninsky, and Neryungrinsky districts, and Yakutsk demonstrated the lowest CORI values both before and after 2011. Contrastingly, the group of uluses with the highest CORI values was less homogeneous. It consistently included the districts of Ust-Yansky, Churapchinsky (since 2011), Tattinsky (before 2011), Ust-Aldansky (before 2011), Namsky (from 2011–2019), Anabarsky (since 2020), and Verkhnevilyuysky (since 2020.
Throughout the period considered, the Arctic zone had the highest departure intensities. Although the Central zone had higher CORI values, they were significantly lower when the regional capital was included. In this case, the Central zone was close to the heterogeneous Western zone, although the disparities between them have increased since 2014, probably due to the lagged growth of outflows in Yakutsk as arrivals increased. The Southern zone stood out for its very low CORI values and flat dynamics where both municipal districts were ranked second to fourth, behind only the economically developed municipalities of the Western zone. The CORI values in the Eastern zone were closest to Yakutia’s average. The COVID-19 pandemic had a strong impact on CORI, with a notable decline observed in the Arctic and Central zones. In contrast, the dynamics in the Southern zone remained unaltered. In the Eastern zone, the number of departures increased. In accordance with the prevailing pattern, CORI have continued to rise since 2020.
Yakutsk’s share in internal outflows was 17%–22% in the early years of the period under study. It increased to 25%–30% as return migration has become stable since 2015. Before 2011, 32%–36% of departures took place in the six main municipalities of Yakutia. After 2015, their share increased to 37%–43%. Due to restrictions on movement, which prevented people from settling in more developed municipalities, it was particularly high in 2020 (46%).
In short, the intensity of movements in both directions has increased across almost all municipal districts, irrespective of the level of economic development and the ethnic composition of the population. The impact of external shocks on migration rates was notable in certain years, while the overall trends remained consistent over the period considered. In districts with a higher degree of economic development, internal migration constituted a smaller share of total migration and exhibited lower levels of intensity. The intensity of migration was markedly higher in less-developed areas, both within the Central zone and at the periphery. The decision to migrate was therefore primarily influenced by economic factors rather than by the geographic location or ethnic composition of a district. Nevertheless, the most advanced districts in the Western and Southern zones, with the exception of Nyurbinsky and Yakutsk, were predominantly characterised by external migration. Consequently, the CIRI and CORI values observed in these areas were below 15‰.
Results of internal migration in the Republic of Sakha (Yakutia)
The crude rates of net migration (CNMRI) were negative in practically all municipalities because the number of departures within the framework of internal migration significantly exceeded the number of arrivals (see Fig. 6). Throughout the entire period under study, the opposite was observed only in Neryungrinsky municipal district (except for 2022–2023) and in Yakutsk. CNMRI in the Arctic uluses have been increasing since 2013. However, a decrease of the population due to internal migration of up to 10–20‰ was observed in some years (e.g. in Srednekolymsky and Zhigansky uluses in 2019). Values slightly above the Republic’s average were noted in the economically developed Western zone, whereas they were much lower in the less-developed Eastern zone. The Southern zone had positive values, only because of Neryungrinsky district. The same can be said about the Central zone. Excluding Yakutsk, CNMRI there had been the lowest until 2013, and in subsequent years the values remained below the Republic’s average. The decrease in the values in the Central zone was caused by the increase in the number of departures from Yakutsk.
Crude rates of net migration from 2006 to 2023.

The global economic crisis has had a significant impact on internal migration and population decline. In 2009–2010, migration outflows decreased and the CNMRI approached zero for both donor and recipient districts. The same is true regarding the COVID-19 pandemic. The population decline resulting from internal migration was the lowest in 2020. However, the CNMRI dynamics in 2020–2023 demonstrated considerable variability, which hinders a comprehensive evaluation of the impact of internal migration on population dynamics during this period.
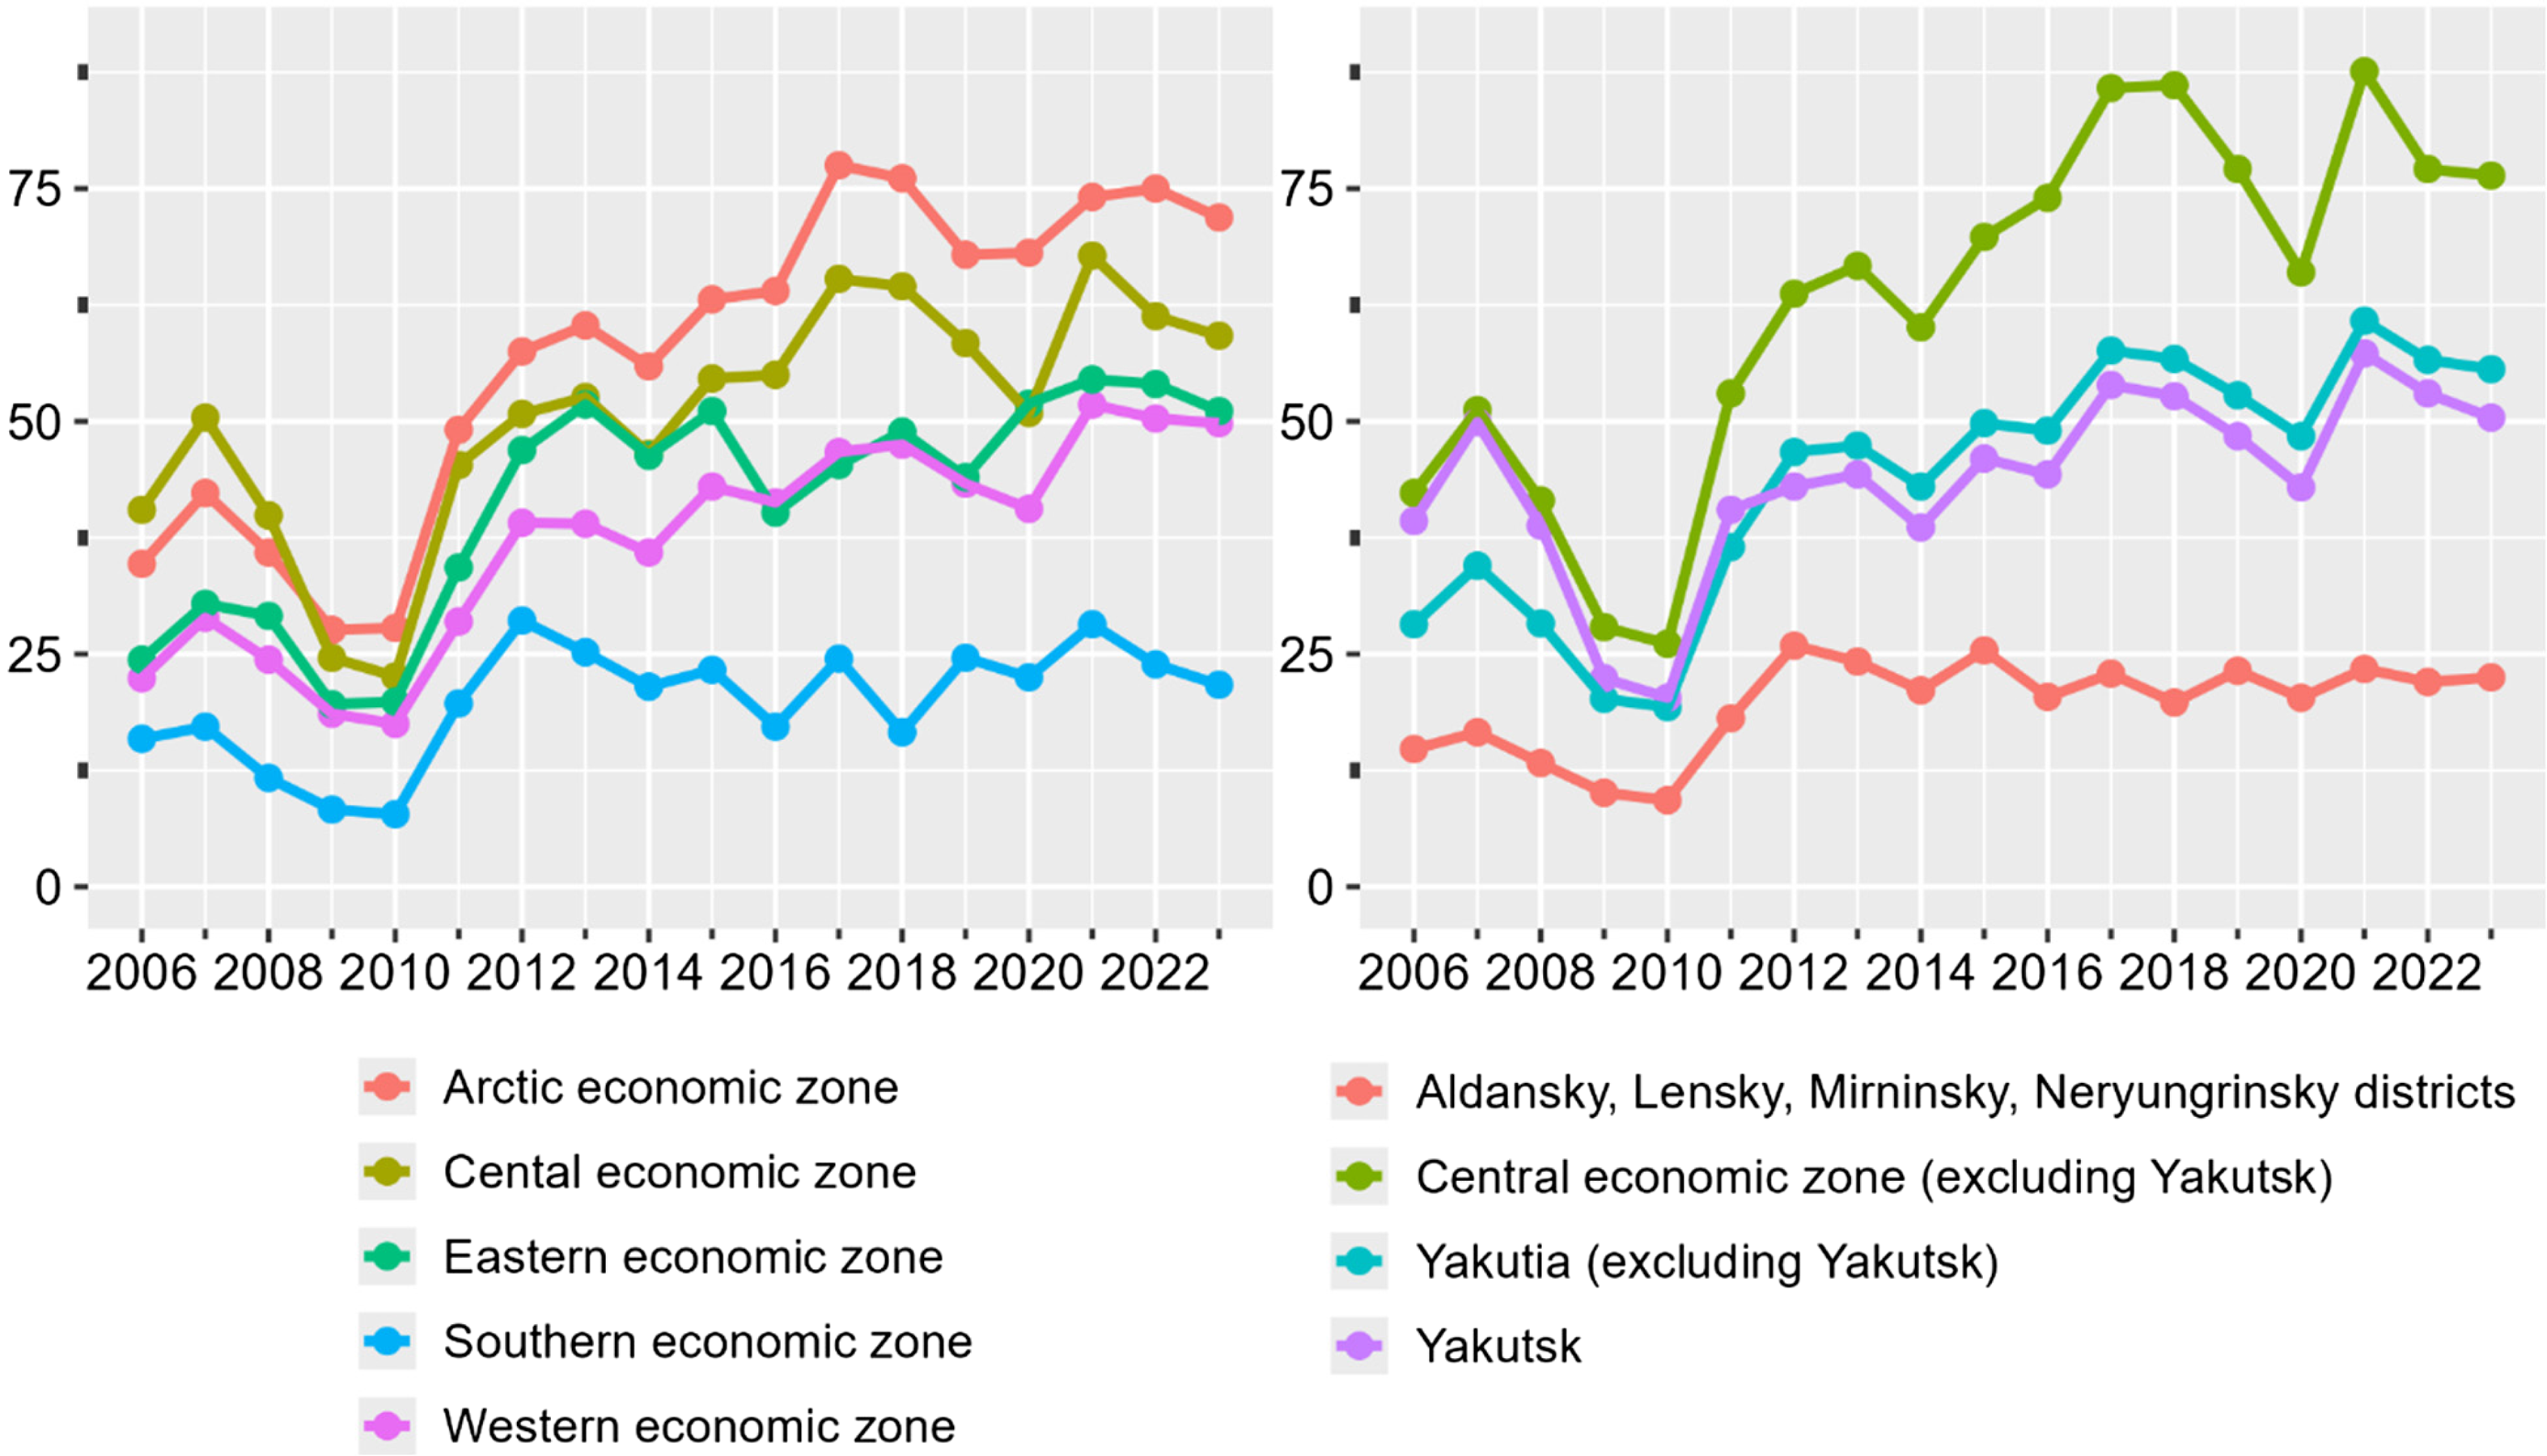
The dynamics of the crude rates of gross migration (CGMRI) are in line with the dynamics of CIRI and CORI that form their basis. Consequently, high values of CGMRI were observed in the Arctic zone after 2011 (see Fig. 7). Shortly before the COVID-19 pandemic, every 9th–12th resident migrated (e.g. in Ust-Yansky district). That means an intensive migration turnover. In the economically developed Western zone, the CGMRI were generally below the Republic average. This was due to the influence of Mirninsky and especially Lensky districts. The Southern zone experienced a decrease against the background of already low CGMRI values. As expected, it stood out due to the dynamics of CGMRI in Neryungrinsky district. The Central zone had average values, but only at the expense of Yakutsk. With the exception of Yakutsk, the values there have been the highest since 2011. Moreover, the maximum value for the whole period (137.5‰) was recorded there, in Churapchinsky ulus. The COVID-19 pandemic had a strong impact on CGMRI, but it was weaker than the impact of the 2008–2009 financial crisis. In 2020, CGMRI increased in the Arctic and Western zones as a consequence of increased in-migration. It is also notable that the values for CGMRI in 2021 were maximised in all zones (with the exception of the Southern zone) by both in-migration and out-migration. This indicates an active two-way population movement.
Crude rates of gross migration from 2006 to 2023.
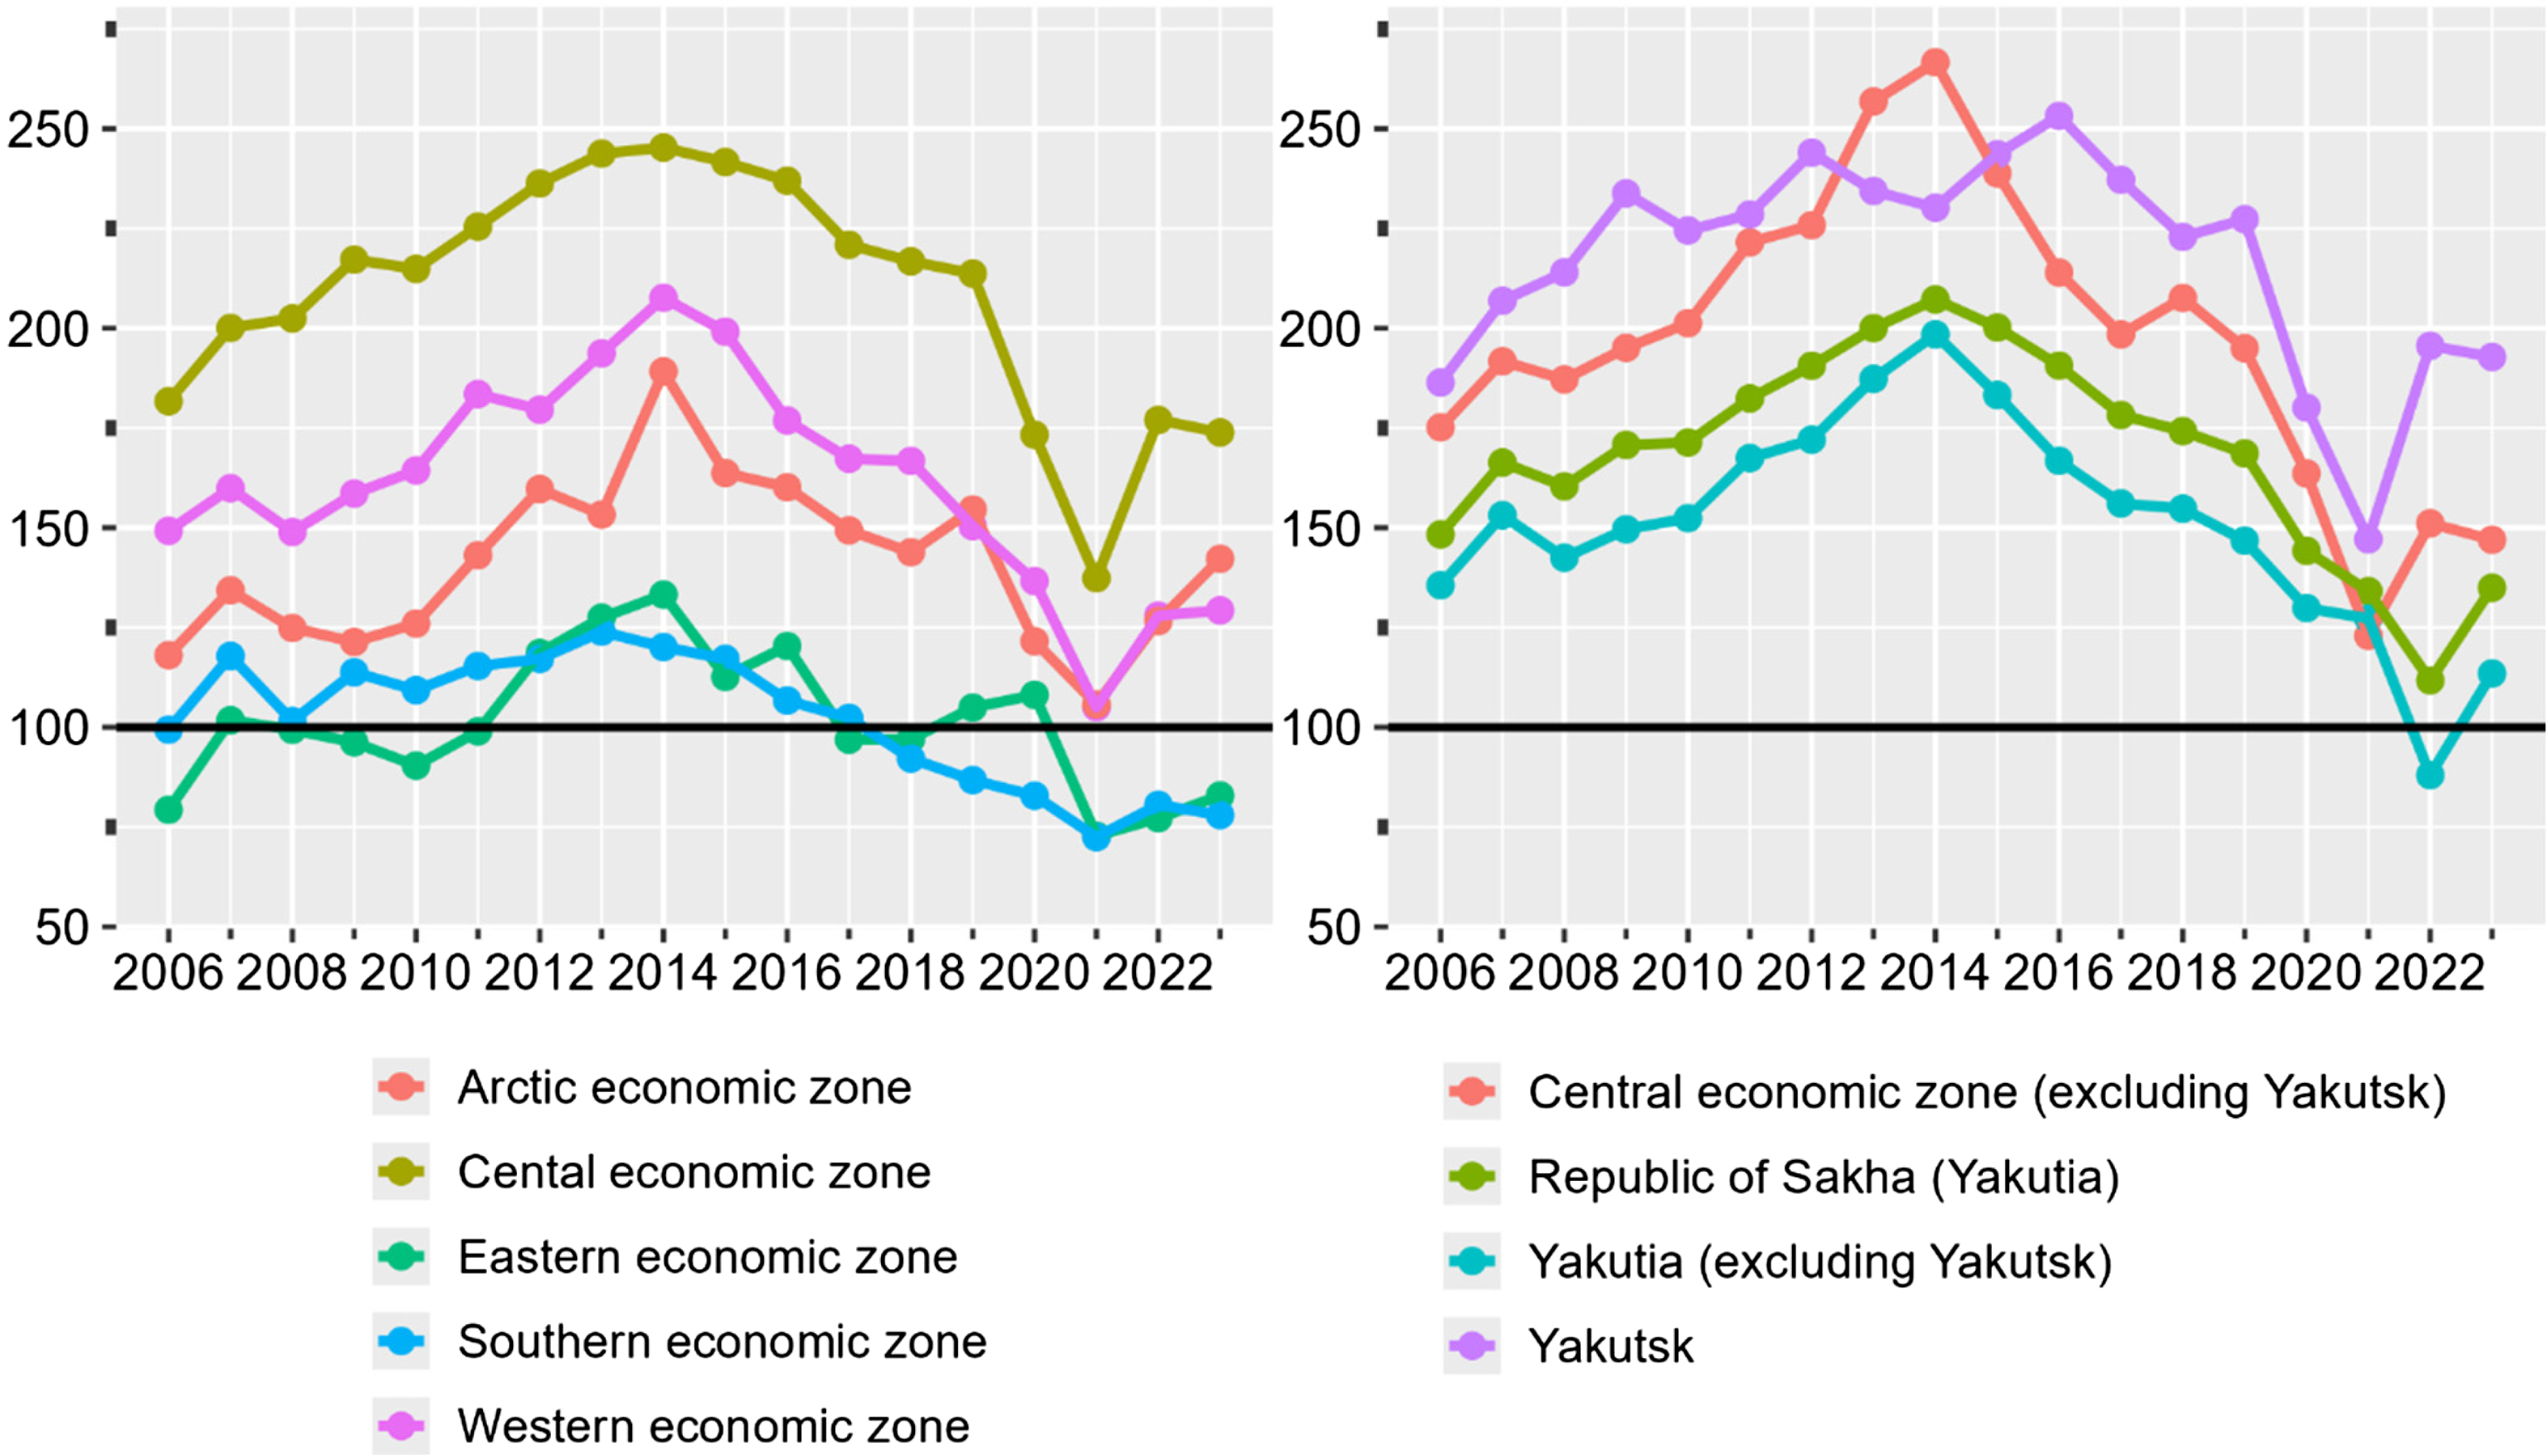
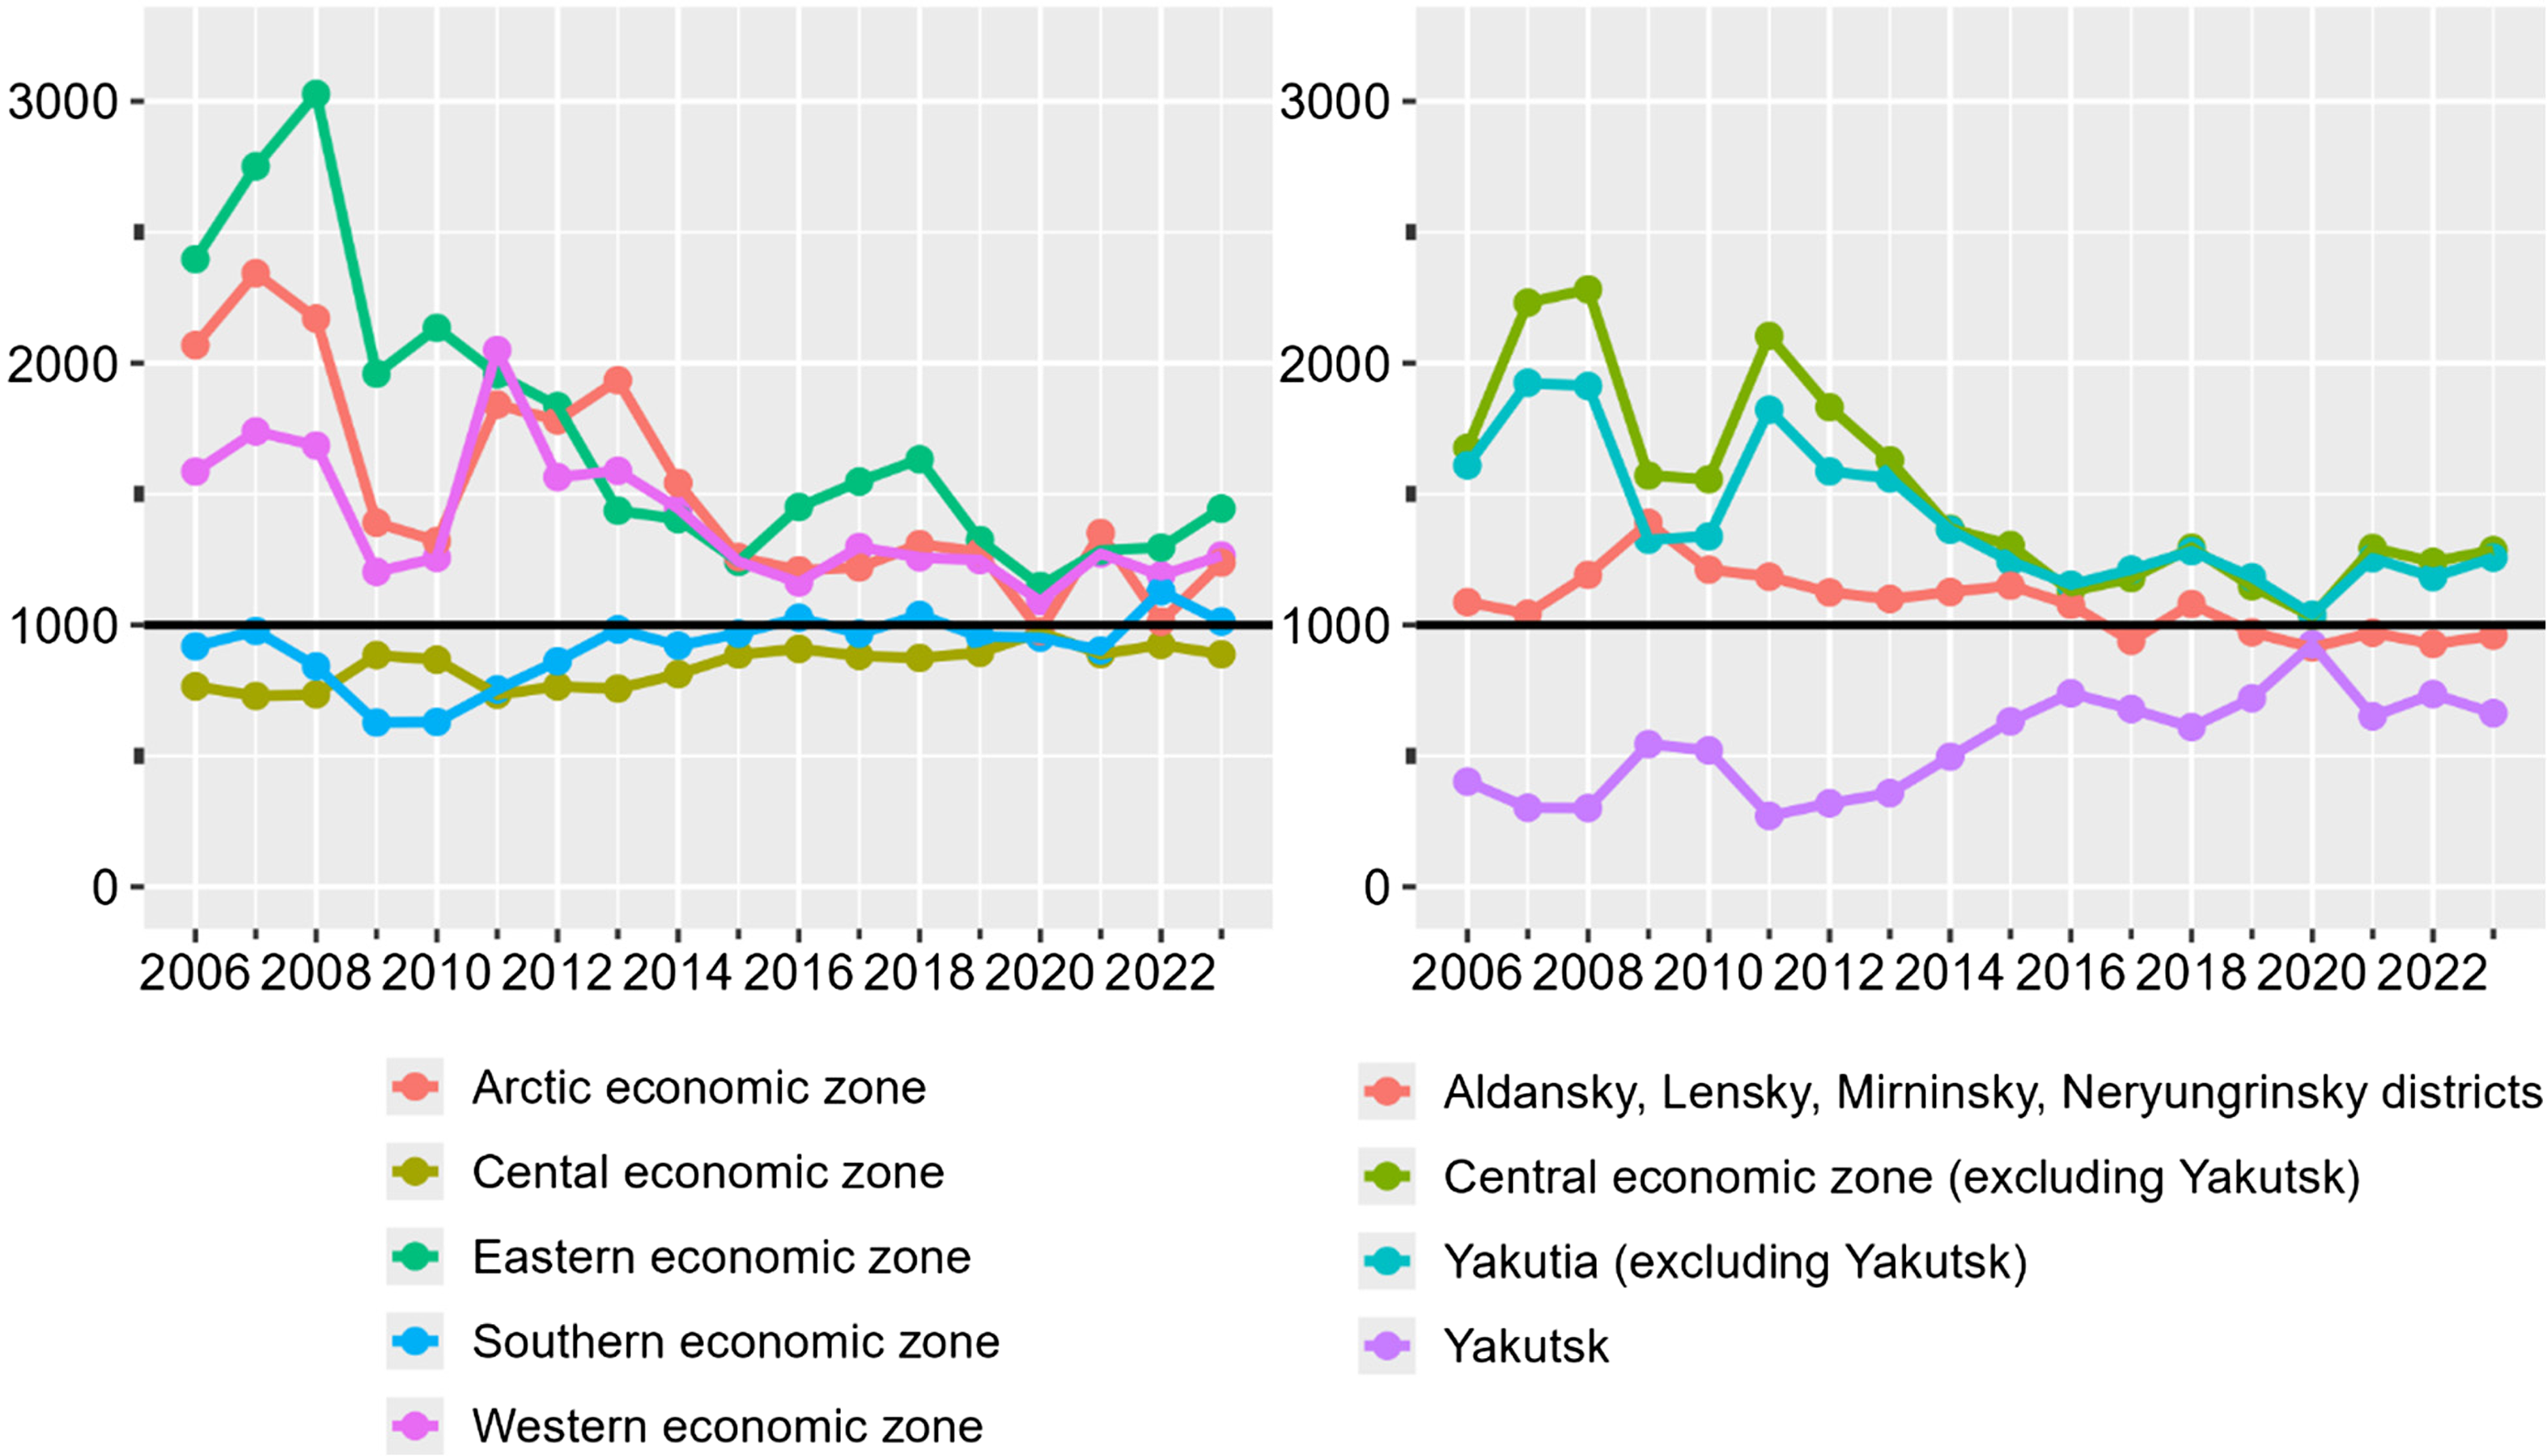
As in the case of the crude rates of net migration, the Central and Southern zones were clearly different from the other zones (see Fig. 8). They had the lowest migration succession ratios (MSRI), and in the Central zone, MSRI were less than 1,000 for the entire period under consideration. This was because of the regional capital with a positive migration balance. MSRI in Yakutsk were initially between 300 and 400, rising to between 600 and 700 with increasing return migration from 2014 onwards. Considering the Central zone (excluding Yakutsk), there was a strong outflow compared with the Arctic zone, where, until 2011, MSRI could exceed 3,000–3,500 in some years in many uluses (three or more departures for each arrival). All of them, except for Olenyoksky district, continued to be population donors even by 2019. During the pandemic, it was joined by Eveno-Bytantaysky and Momsky uluses. The worst situation was in the Eastern zone. For example, in Oymyakonsky ulus the average MSRI values were about 6,300 until 2011, and in the following years, they were among the highest. Despite the presence of two leaders with very low values of MSRI in the Western zone (Lensky and Mirninsky districts), MSRI there were at the Republic average, implying the high degree of heterogeneity. The four most economically developed districts warrant particular attention. The figure shows that they had small population losses caused by internal migration.
Migration succession ratios from 2006 to 2023.
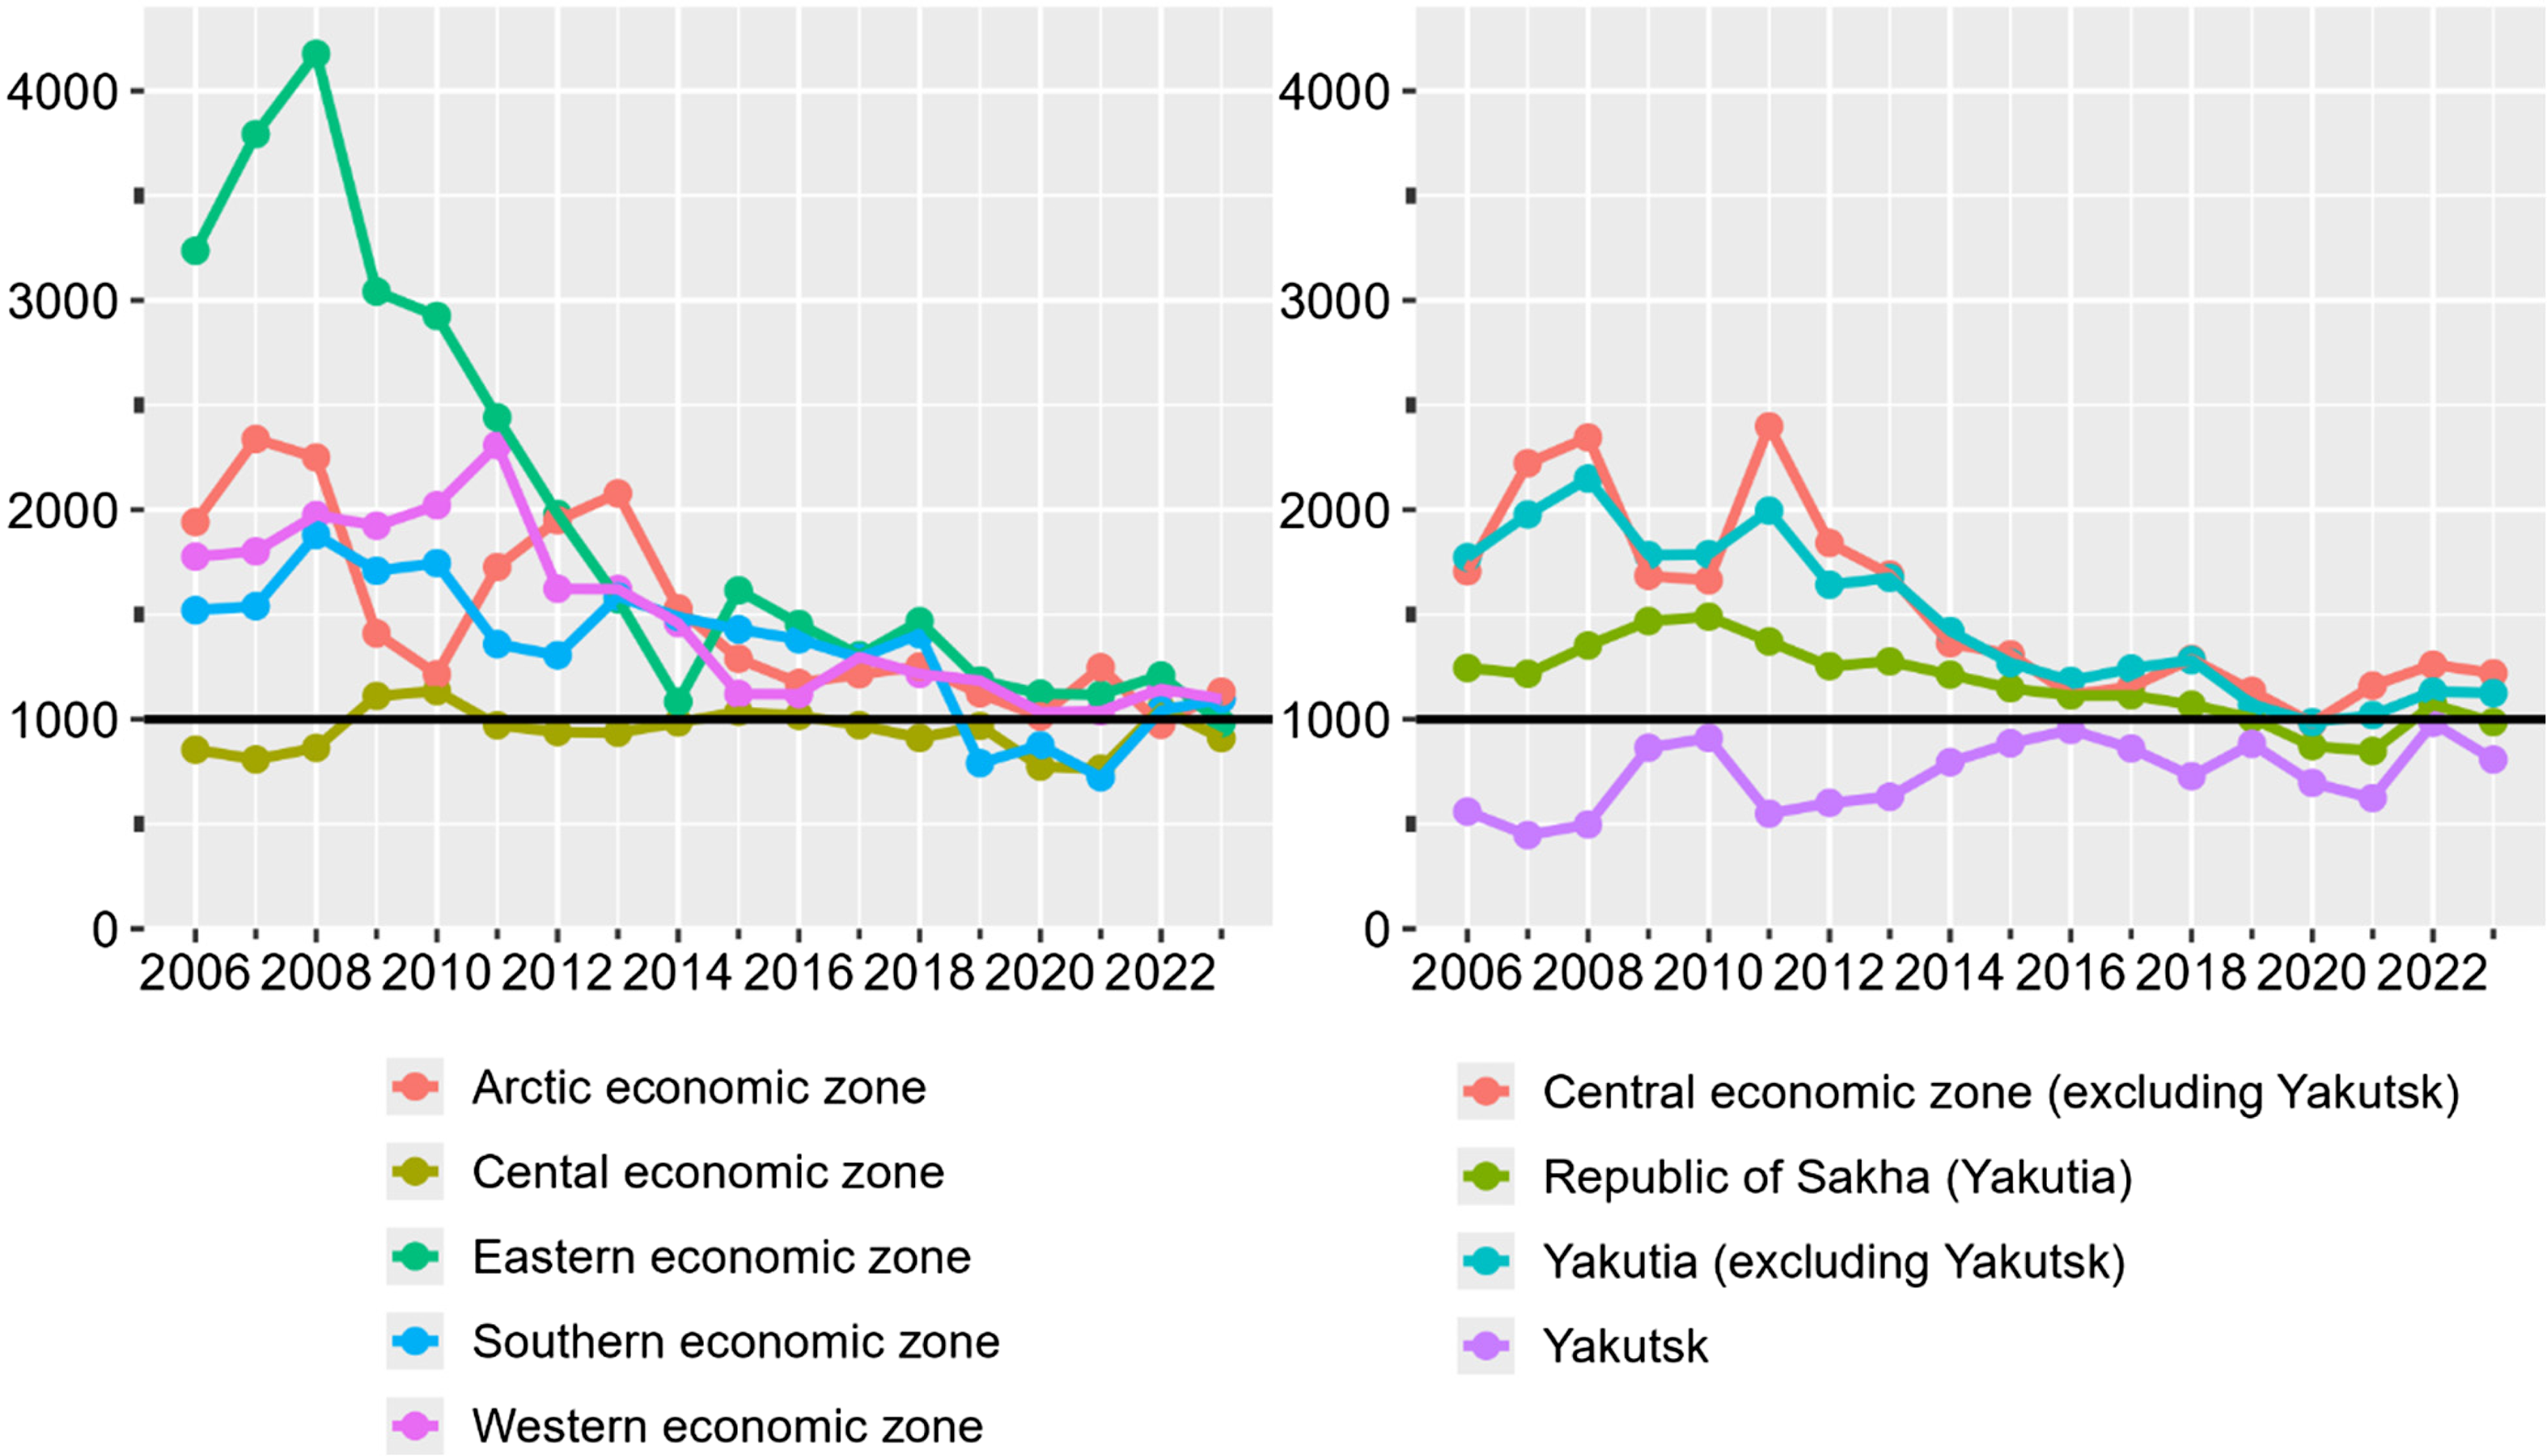
Except in the Southern economic zone, migration was an effective tool of population redistribution inside Yakutia (see Fig. 9): Migration effectiveness ratios (MERI) in many uluses could be as low as –30/–40 in some years even by 2019. Migration flows were balanced only in the developed municipal districts. At the expense of Yakutsk, MERI in the Central zone were positive and were the highest for most of the period. In general, over the entire period, the population increased there by about 9 people for every 100 people participating in migration (the average values of MERI were +9). Excluding Yakutsk, the Central zone’s results were often compared to those of the Arctic zone, where in the first half of the period considered the values were of –40, –50, and lower in some uluses. In the uluses around the regional capital, there were very intensive migration and significant outflows to the local centre of attraction. The Eastern zone stood out from the general background, as the contribution of internal migration to population loss there was most pronounced. The leader was Oymyakonsky ulus, where MERI exceeded –60 until 2011.
Migration effectiveness ratios from 2006 to 2023.
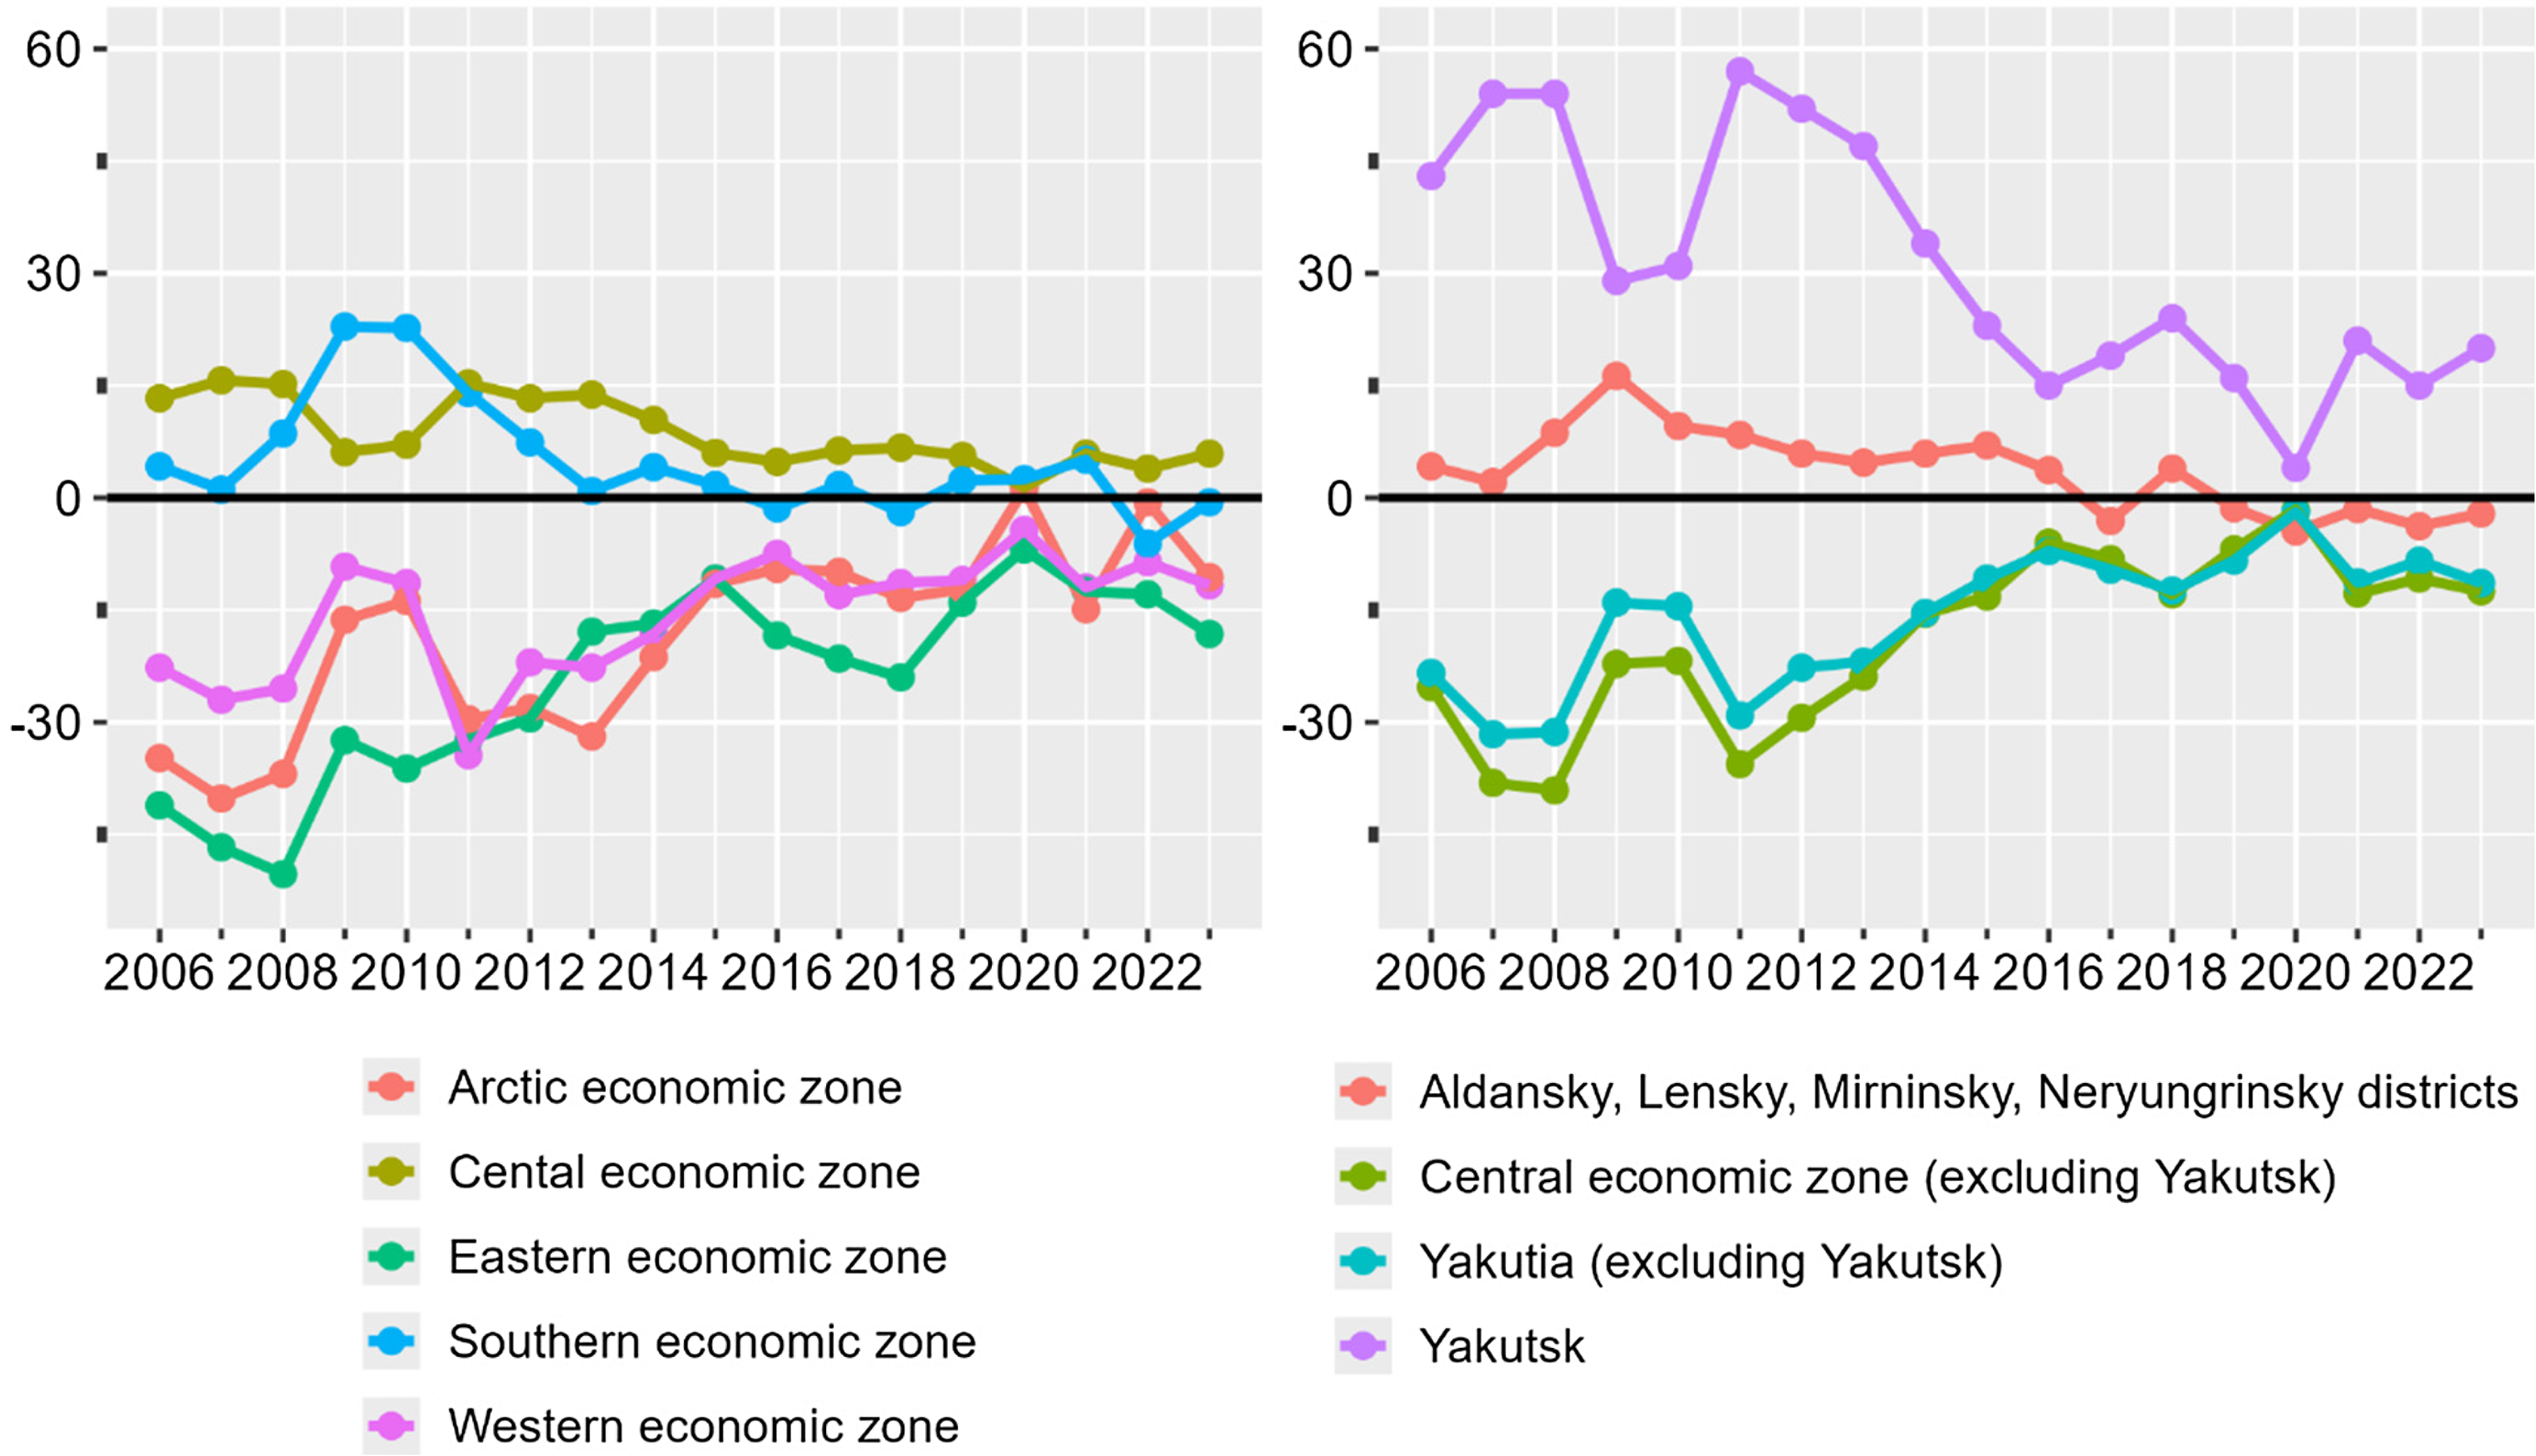
MERI were strongly affected by the COVID-19 pandemic. It is particularly noteworthy that from 2021 onwards the Eastern zone, the Central zone (excluding Yakutsk) and the Republic (excluding Yakutsk) have experienced an increase in the imbalance of migration flows due to out-migration. Conversely, an increase in the imbalance has been observed in the most developed municipal units, but it was slower and at the expense of migration inflows. This indicates that the pandemic had a transient effect and that previous patterns persisted.
In short, migration intensity has increased in both directions over the period considered. As a result, all indices have converged since 2016, thus requiring the use of Markov chain-based models for more detailed outcomes. Yakutia has also become increasingly homogeneous since 2016, as indicated by a reduction in the coefficient of variation for all indices. Until 2016, migration was an effective tool for population redistribution. Subsequently, migration flows became more balanced. Nevertheless, the redistribution of the population has mainly been in favour of the economically developed municipalities. It is also noteworthy that the uluses experienced a decline in population due to internal migration. Even Neryungrinsky district has experienced migration losses since 2019. The other economically developed districts had worse dynamics: Mirninsky district has faced a stable population decline due to out-migration since 2019; in Lensky district, since 2013’ and the population of Aldansky district has been declining throughout the study period. However, the losses in all districts were small. The only exception is Yakutsk, which had positive net dynamics throughout the period. Finally, an important finding is the stability of the trends. The effect of the COVID-19 pandemic was short-lived, as was the impact of the 2008–2009 global financial crisis, although the latter had a more pronounced effect.
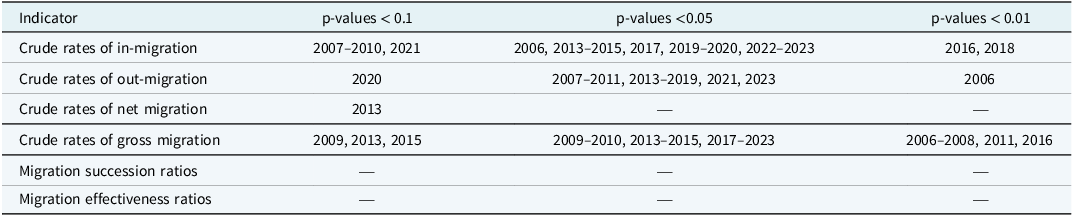
The results of the van der Waerden test demonstrated significant disparities between the municipal districts for CIRI, CORI and CGMRI (see Table 1). There were no statistically significant disparities (p-values > 0.1) for CNMRI, MSRI, and MERI. While the significance level decreased, the outcomes remained essentially unchanged, if the Southern (very low migration intensity) and Eastern (very high migration intensity) zones, which contain only five uluses in total, are excluded. One can assume that the ratios that do not consider population size showed more homogeneous results compared to the rates that include the number of inhabitants. In other words, there was more homogeneity in the balance of migration inflows and outflows and considerable heterogeneity in the impact of migration on the population size. This could be due to more dissimilar CIRI and CORI values than the ratios for the in-migration and out-migration flows. These calculations also still included the Western zone, which contains economically developed districts. The main disparities were concentrated between the Southern zone (taking a broader approach, Lensky and Mirninsky districts of the Western zone should be added) and the Arctic zone and the uluses neighbouring Yakutsk. Disparities between the most economically developed municipal units and less-developed districts can therefore be identified.
Years with statistically significant disparities between the uluses according to the van der Waerden test for migration rates and ratios p-values < 0.01
Ethnic patterns of internal migration in Yakutia
The migratory behaviours of the SIMs were somewhat different, and this applied to most of the cases studied. The intensity of their migration was lower in Kobyaysky ulus (Central zone). The observed differences were statistically significant (p-values < 0.01) for CIRI, CORI, and CNMRI. No other indices exhibited disparities even at the 0.1 significance level because of substantial inter-annual fluctuations.
The situation in the SIMs’ residence in the Eastern zone uluses was less favourable than in these uluses overall. Significant disparities were observed for MSRI and MERI, with p-values approaching 0.01. Additionally, a high level of significance was observed for CNMRI and CGMRI in Ust-Maysky ulus. These disparities were less statistically significant in Tomponsky ulus. The uluses demonstrated divergent trends in both CIRI and CORI; however, in the former ulus, both rates exhibited higher values in places occupied by the SIMs.
The case of the prosperous Neryungrinsky district (Southern zone) is worthy of further investigation. The situation in the Evenki village of Iyengra was considerably more problematic than that observed in the district as a whole because of the extremely low standard of living in the settlement. The disparities in migration patterns were most pronounced for the entire sample (p-values < 0.01) across all indices except CGMRI. The lack of significant disparities for the latter was purely coincidental: Higher CORI and lower CIRI in Iyengra combined to produce CGMRI close to the district average.
The only exception was Nizhnekolymsky ulus, where p-values for all indices were > 0.1. The level of economic development may thus be a more important factor in migration than ethnicity for the remote and poor northern ulus.
To summarise, the ethnic factor exerted a certain influence on migration, but the economic factor was of greater importance. SIMs do not have a higher propensity to migrate; rather, it is insufficient socio-economic development that explains the unfavourable migration situation in the settlements inhabited by the SIMs.
Discussion
The paper examined trends in internal migration in the economic zones of the Republic of Sakha (Yakutia) from 2006 to 2023. The key finding is that the intensity of internal migration in the Republic has generally increased over time and migration flows have become more balanced. The increase of education and return migration in the context of increased long-term migration were the most likely explanations for such trends, but a change in the methodology for registering migrants had an impact too. This could be a positive result of society’s transformation, indicating increased mobility of the population, especially regarding labour resources. Nevertheless, increased migration intensity should be perceived as a negative consequence of the development of Yakutia, highlighting people’s dissatisfaction with living conditions in less-developed municipal districts.
Migration losses were observed in most of the uluses, with only Yakutsk benefiting from internal migration over considered period. Over the past 5 years, even the most economically developed districts have lost population due to out-migration.
As has been noted in the literature (Sukneva & Laruelle, Reference Sukneva and Laruelle2019), the regional capital had an enormous influence on migration in Yakutia. Although the influence of Yakutsk was noticeable for the whole Republic, my work showed how strong it was, first of all, in the Central zone because there has been a huge migration turnover in the surrounding districts. In the case of Yakutsk, the thesis of the developing and strengthening of the centre at the expense of the peripheries (Friedmann, Reference Friedmann and Hansen1972; Richardson, Reference Richardson1973; Todd, Reference Todd1974) is evident. As it is the most developed municipality, Yakutsk is the main centre of attraction in the region. This is consistent with the theory (Buch et al., Reference Buch, Hamann, Niebuhr and Rossen2014; Glaeser & Shapiro, Reference Glaeser and Shapiro2003). In the medium term, no other municipality or second-tier town will be able to compete with Yakutsk, and the growth of its population due to internal migration will continue. The key factor of Yakutsk’s success is the development of amenities as well as high level of economic development of the city. This is in line with world practice (Guimarães, Nunes, Barreira & Panagopoulos, Reference Guimarães, Nunes, Barreira and Panagopoulos2016).
The second important finding is that external shocks (e.g. the global financial crisis of 2008–2009 and the COVID-19 pandemic) had a significant but short-term impact on the dynamics of internal migration. After the events, the indices values returned to their previous levels.
It is not possible to give a clear answer to the main question of the study: Whether the internal migration in Yakutia depends on the level of economic development of a municipal district. On the one hand, only Yakutsk has shown a stable growth of the population due to internal migration. The rest have experienced a population decline. On the other hand, the economically developed districts have shown quite favourable dynamics, though with population losses, while other uluses have lagged far behind. In any case, the economic zones differed in the intensity of migration, sometimes greatly.
Contradictory results were also obtained from the analysis of migration indices based on the van der Waerden test. Crude rates of in-migration, out-migration, and gross migration differed statistically and significantly between the groups of municipalities depending on whether three or five groups of districts were used, but crude rates of net migration, migration succession and effectiveness ratios did not. A number of explanations can be given for this. The more homogenous agricultural Arctic zone, that had a highly mobile population, strongly differed from the economically developed Western and Southern zones. It is likely that the availability of employment opportunities hampered population mobility. The fact that crude rates of in-migration and out-migration did not exceed 10–15‰ in the most industrialised districts, and were often as low as 5–7‰, supports this assumption. There was also a marked difference between the Central zone and both the Southern zone and the more economically developed areas of the Western zone. This is due to the influence of Yakutsk, which is a strong centre of attraction for the population for its diverse employment and leisure options.
Generally, the obtained results are in line with the findings of previous studies. The study corroborated a high level of migration intensity (Sukneva & Tarasova-Sivtseva, Reference Sukneva, Tarasova-Sivtseva, Popova and Sukneva2018), its increase after 2011 (Sukneva & Tarasova-Sivtseva, Reference Sukneva, Tarasova-Sivtseva, Popova and Sukneva2018), and geographic disparities throughout Yakutia (Sukneva, Reference Sukneva2017; Sukneva & Trubina, Reference Sukneva and Trubina2009, Reference Sukneva and Trubina2011). Furthermore, the data used in this study are quite recent, thereby allowing us to perceive the noted patterns as stable over time.
The paper has a number of shortcomings. I did not take into account the disparities between urban and rural areas, genders, and age groups, although these may potentially exist. The study focused only on internal long-term migrants, yet valuable insights can be gained by analysing external migration dynamics. Finally, I used solely statistical methods, however, a more comprehensive understanding can be achieved by considering a broader context.
The merit of this work lies in its detailed consideration of internal migration using a diverse range of indices, a rarity in Russian Arctic studies. First of all, it concerns such important indices as migration succession and effectiveness ratios.
Conclusion
This paper is the study that analyses the indices of the intensity of migration on the territory of the entire Republic of Sakha (Yakutia) over quite a long period of time. Unlike most previous works, this paper focused on quantitative analysis. This made it possible to reveal migration trends as well as clearly show the impact of the global economic crisis of 2008–2009 and the COVID-19 pandemic. Although I used the different methods (statistical approach to the study of migration), my results complement and generally confirmed previous findings.
The results obtained will be of interest primarily to academics studying the Arctic (both Russian and international) and the Russian Far North. Carrying out similar work in other regions of the North would allow to identify in more detail the similarities and discrepancies of internal migration in these regions during the post-Soviet period. My findings are also of interest to researchers who study internal development and demography, particularly if economic zones with distinct levels of development are distinguishable in a region.
In the context of unfavourable demographic dynamics and general socio-economic instability in recent years, the issue of migration in the Arctic, on which the economic well-being of Russia largely depends, is one of the key issues for the future of the country. While all Arctic regions are experiencing a loss of population, the Republic of Sakha (Yakutia) distinguishes itself with natural population growth. Yakutia has great economic potential and is an old-established region, where the population holds a strong attachment to its homelands. Therefore, concentration of the population in the regional capital to the detriment of other municipalities is a significant challenge that authorities must prioritise to solve. I hope that my findings will contribute to the creation of migration policies that will balance migration flows, taking account of the local specifics, and to a more equitable socio-economic development throughout the Republic. After all, an economically stable and advanced Yakutia represents not only successful management but is also a reason for its inhabitants to want to live there.
Competing interests
The author declares none.


 Open access