


Introduction
The coronavirus SARS-CoV-2 (severe acute respiratory syndrome coronavirus 2) is responsible for the COVID-19 epidemic that broke out in Wuhan (China) in December 2019 [1]. Although being identified in the early stages of the epidemic as being close to two other coronaviruses (SARS and MERS) [Reference Ksiazek2], its epidemiological risks in terms of propagation and lethality were not known. Investigations reported by the Chinese Centre for Disease Control and Prevention (China CDC) demonstrated that a new coronavirus was at the origin of this epidemic [Reference Zhu3]. The retrospective analysis of the earlier transmission in Wuhan revealed that human-to-human transmission had occurred since the middle of December, and possibly earlier, through close contacts [Reference Li4]. After a very rapid dissemination in the Hubei province, the disease has spread to all the other provinces in China. Currently, the epidemic seems to be getting under control thanks to strict control measures [Reference Anderson5]. During its early spread in China, the virus also reached several countries in the world, in particular Japan where early measures enabled to control its spread relatively well [Reference Kuniya6] although restarts are now observed. Subsequently, by the end of February, several important new clusters broke out in South Korea, Iran and Italy. Beginning of March most of Europe was affected, to be followed by the United States. The epidemic is currently affecting the whole world [7].
Various techniques have been developed to model the epidemics of infectious diseases. Most of these are based on compartment models which separate the populations in main classes. The model enables to represent the interactions between these classes based on pre-established mathematical rules. The simplest formulation comes from the early work by Kermack and McKendrick in the 1920s [Reference Kermack and McKendrick8] and involves three classes: the first one for the people sensitive to the disease who are prone to contracting the disease, a second one for the infectious people who have contracted the disease and can infect susceptible people and a third one for the people outside this cycle because either they became immunised after recovering, or they left the study area, or they have died.
Although some specific model formulations can be usefully fostered, all the mechanisms cannot be always known and therefore the complete formulation of the equations governing an epidemic will generally be unknown. This is especially true when coping with a new disease outbreak. Three main problems will be met in a modelling perspective of such a situation: (1) What are the relevant variables for a given epidemic? (2) What are the governing equations coupling these variables? (3) What are the parameter values of these equations? Also, in between these questions, two other very practical questions: (4) What observations do we have to build and constrain a model? And, as a corollary, (5) How to reformulate the governing equations based on the available observations? (see Suppl. Mat. 1 for a more detailed contextualisation).
Two main data sets were considered for the present study. The official data from the National Health Commission of the People's Republic of China [9] were used to study the original outbreak at China's scale (from 21 January to 10 April 2020). The data from the Johns Hudson University [10] were used to monitor the outbreaks at the province's scale in China and at the country's scale for other countries. Their description and pre-processing are given with further details in Suppl. Mat. 3 (Fig. S1). The time series from three original variables were considered: (1) the daily cumulated number C Σ (t) of confirmed cases, (2) the daily number s(t) of severe cases currently under intensive care and (3) the daily cumulated number D Σ (t) of deaths; from which the derivatives (required for the modelling approach are used in the present study) were deduced, corresponding to the daily number of new cases C 1 (t), the daily additional severe cases s 1 (t) and daily number of new deaths D 1 (t) (see Eq. 1).
Based on the chaos theory [Reference Letellier11], the global modelling technique [Reference Gouesbet and Letellier12–Reference Mangiarotti15] offers an interesting alternative with respect to other approaches. It is well adapted to the modelling and study of unstable dynamical behaviours: it enables to detect and extract the deterministic component underlying the dynamical behaviour; and, as a consequence, it can be a powerful approach to analyse dynamics which are highly sensitive to the earlier conditions and to detect chaos (see Suppl. Mat. 2). Another interesting aspect of this technique comes from the potential it offers to work even if important variables are missing, which is generally the case in epidemiology. Finally, it has proven to be a powerful tool to detect couplings between observed variables, and even, when all the dynamical variables are observed, to retrieve the original algebraic formulation of the governing equations in a compact and potentially interpretable form [Reference Mangiarotti and Huc16].
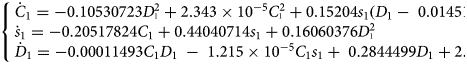
A great number of works have been based on chaos theory to study epidemiological behaviours [Reference May17–Reference Cazagrandi19] but a global modelling approach per se has rarely been applied to biological systems. The first replicable application was in ecology [Reference Maquet, Letellier and Aguirre20]. In epidemiology, it enabled to obtain an interpretable model for the epidemic of Bombay bubonic plague (1896–1911) by extracting the couplings between the human epidemic and the epizootics of two species of rats. Although obtained from observational time series without strong a priori model structure, it was found possible in the latter case to give an interpretation to all the model's terms [Reference Mangiarotti21]. A model was also obtained for the West Africa epidemic of Ebola Virus Disease (2013–2016) coupling the two observed variables made available with a regular sampling: the cumulated numbers of infected cases and deaths [Reference Mangiarotti, Peyre and Huc22]. In the present study, this modelling approach is used to model the current COVID-19 epidemic in Asia (China, Japan, South Korea) and Italy and then to produce scenarios for 16 countries (several of these ones included) where the disease was introduced later and spread locally. Two general equation forms are considered in the present study: (1) the multivariate form

based on three observed variables. The aim of this structure is to retrieve the couplings between C 1 the number of daily new cases, s 1 the number of daily additional severe cases (positive or negative) and D 1 the number of daily deaths and (2) the canonical form

based on a single observed variable – here C Σ the cumulative number of new cases since the beginning of the epidemic – and its successive derivatives C 1 and C 2. The aim of this second structure is to analyse and compare the dynamical behaviours. This latter formulation was also applied to the cumulative number of deaths D Σ with its derivatives D 1 and D 2.
Considering the set of variables (C 1, s 1, D 1), a model of chaotic behaviour was obtained on 5 February for the 21 January to 4 February 2020 period [23]. Its time evolution is shown in Figure 1. This model M1
Observed and modelled time series.
Observed (thick lines) and modelled (light lines) with M1 (Eq. 3) time series for China (black, grey and brown) and Italy (red, orange and purple) due to COVID-19 from 21 January (DoY 21) to 2 April 2020 (DoY 92). The part of the observations used to identify the model is in plain lines. Three variables are presented: the daily number of confirmed new cases C 1 (a), and of additional severe cases variations s 1 (b) and the daily deaths D 1 (c). Note that a correction factor has been applied to the number C 1 of confirmed new cases in Italy to make the comparison with China consistent (see Suppl. Mat. 2). Dashed brown lines correspond to simulations of a possible restart in China.

comprises 11terms. It emphasises the existence of strong but nonlinear couplings between the three observed variables. Unfortunately, this model is difficult to interpret, mainly because two of the observed variables – the daily numbers of new cases and additional severe cases – can present overlaps, the latter being potentially included in the former one. As a consequence, the present model can only be a reformulation of the original processes as well as a rough reduction.
The numerical integration of the model shows a transient of approximately 15 days that corresponds to the period used to identify the model (Fig. 1). Three simulations were performed starting from slightly different initial conditions. These trajectories alternatively come closer and move away one to another but do not converge to a single temporal evolution, which illustrates the high sensitivity to the initial conditions. During the identification period (Day of Year (DoY) 20−25), the trajectories show a good consistency between the model (grey lines) and the observed data (plain black line). The agreement deteriorates after this period (dashed black line). The data show that the observed number of new cases C 1(t) starts to decrease on DoY 37 after a peak of ~5000 cases per day has been reached, whereas the simulations continue rising until reaching a steady regime of much larger magnitude (>7000 cases per day). This discrepancy is explained as a result of the lockdown. Indeed, the lockdowns were set on in China from DoY 23 to 29 (Table 1). Considering the incubation period of 3–5 days, the model was thus obtained while the effect of the confinement was still partial, and while the disease was still under progress for contaminated people although contamination had been slowed down. The large oscillations observed in s 1(t) (Fig. 1b) are reproduced by the model although they appear slower in the simulations. Finally, although underestimated by the model, the agreement with the data is obviously better for the daily deaths (Fig. 1c). Death is the result of the successive stages of the disease in which duration can highly vary from one patient to another. This generates a delay following the peak of new cases. The number of deaths will thus depend on the number of simultaneous cases s but also on the health system capacity, in particular on the number of ventilators available in a country. Exceeding the capacity can have a direct effect on the dynamical behaviour by generating a plateau rather than a peak for the number of severe cases and smoothing more or less the number of daily deaths depending on the degree of saturation.
Control measures and epidemic situation

a Numbers normalised by the Hubei's population size within parentheses, by the China's population size otherwise.
Note: Control measures by country, and corresponding dates and epidemic situation in terms of cases and deaths (corrections for country inter-comparisons have been applied, see Suppl. Mat. Data 2). Values in bold were used to estimate the epidemiologic levels at which the control measures have been applied.
The representation in the phase space shows that, after the transient, the model trajectory reaches a steady regime characterised by a chaotic attractor (Fig. 2). A more detailed analysis of the model (see Suppl. Mat. 4 and Fig. S2) proves that the dynamic of model M1 is very close to a phase non-coherent regime, that is, a much less predictable behaviour.
Original and modelled phase portraits.
Three projections (C 1, s 1) in (a), (C 1, D 1) in (b) and (s 1, D 1) in (c) of the phase space as reconstructed from the model's trajectory (colour trajectories). The three colours correspond to different initial conditions (colour circles), each taken from the original data set, on 21 January 7:00 (red), 19:00 (orange) and 22 January 7:00 (purple) 2020. After a 15-day transient, the trajectories converge to a chaotic attractor. Trajectories reconstructed from the observational data are also presented: for all China (in black) and for Italy (in red). The part of the observations used to identify the model is in plain line.

Four other models M2 to M5 were obtained (see Figs S3–S6) using a slightly different time window. Interestingly, small parameter changes of model M2 give rise to a restart after a decreasing period (Fig. S4). This illustrates the possibility to withstand the peaks of the outbreak by controlling the proper parameters. It also reveals the capacity of the approach to obtain governing equations enabling a certain diversity of behaviours. Note that all these models (M1−M5) could be obtained only for periods at the transition between the exponential propagation of the disease and the beginning of the decrease. Yet, while chaotic models can give rise to unpredictable trajectories, they rely on steady dynamics: their governing equations are invariant. Although lockdowns were applied in China during the period ranging from DoY 23−29, due to the incubation time the results of these measures started to become effective around 6 February 2020. It is why these chaotic models could be obtained only on a brief time window, revealing the tipping point from uncontrolled (and unbounded) behaviour to a controlled situation, by the early beginning of February (around DoY 37). And it is also why, soon after (around DoY 41), it became possible to obtain a canonical model (general equations form corresponding to Eq. 2) for the set of variables (C Σ, C 1, C 2) converging to fixed points (see model K1 in Suppl. Mat. S5, Fig. S7–S8).
At present, despite some restarts, the epidemic seems to be getting under control in China. Since the immunisation remains largely insufficient to modify significantly the dynamic (see Table S2), the obtained models can be used to simulate a restart. Three simulations starting from DoY-72 7pm and DoY-73 7am and 7pm were run (see Fig. 1 in dashed brown lines) showing that a quick restart must be expected if the control measures were to be released at this time.
Using the Italian data as new initial conditions, the model M1 (light coloured lines) was run again to compare it with the evolution observed in Italy (dashed red line) revealing a good agreement during the transient. This agreement may be surprising considering the difference in population size between the two countries (no population normalisation was applied here). The behaviour observed in China relies, for more than 83.5%, on the Hubei province whose population size is quite similar to that of Italy. Comparing with the evolution of the epidemic in Italy, this simulation is backing up the fact that the strict control measures applied by the Chinese authorities played an important role in the control of the epidemic. Very strict measures were taken in Hubei (total quarantine of Wuhan and of a part of Hubei province) while the number of daily new cases was around 140 per 10 M population in Hubei. Similar measures were taken in Italy (on 8 March 2020) and more recently in Spain (14 March 2020) but comparatively much later, when the number of cases reached around 3023 per 10 M population in Italy and 2202 in Spain. Details about the types and dates of control measures taken in the countries considered in the study are provided in Table 1. In France, the control measures enforcing confinement of all the French population based on voluntary basis but under government control were taken much later than in China but slightly earlier than in Italy and Spain in terms of number of cases (~1483).
Using the model M1, the cumulated counts C Σ (t) and D Σ (t) could be calculated by the numerical summation of the model's variables from which the model's fatality rate was estimated (see Suppl. Mat. 6 and Fig. S9). This rate progressively converges to 1.4% which is poorly consistent with the observations whose values range from 4% to 5% (Table S2). Canonical models K1 and K2 directly obtained for the cumulated counts (C Σ (t) and D Σ(t), respectively) and K3 for their coupling were found much more efficient to reproduce the fatality rate, in particular the canonical model K3 (5.0%) (see Fig. S8). Considering the ability of the virus to propagate easily and silently in both Asia and Europe, and now everywhere in the world and at all society levels, a tremendous number of people will surely be infected by the SARS-Cov-2 in the weeks and months to come, requiring specific measures to slowdown the propagation of the disease. Though, it may probably be extremely difficult to control the disease completely and resurgences must be expected [Reference Ferguson24] as also suggested here by several simulations Figure 1 and Figure S3.
To analyse the recent outbreaks and compare them to more advanced ones, the global modelling technique was used in its canonical form (Eq. 2) to obtain polynomial models for eight of the mostly affected provinces in China (the Hubei, Zhejiang, Henan, Anhui, Hunan, Jianxi, Guangdong and Heilongjiang) as well as for Japan and South Korea and more recently for Italy. To make the comparison between different sizes of population possible, before modelling, the time series were normalised for a population size of 50 million inhabitants. Examples of both the original and model phase portraits are shown in Figure S10 (see also Suppl. Mat. 7). The original and modelled phase portraits of these models are very consistent. These models were obtained at the end of the outbreak for the Chinese provinces and while the epidemic curve had started to decrease in Japan and South Korea; it is why all these models converge to fixed points: their regimes relate to dynamics that are not – or no longer – chaotic. These were used to perform scenarios for the outbreaks in progress in Europe, in the United States and even more so. On 22 February 2020, several models of canonical form could be also obtained for Italy (see Suppl. Mat. 8) providing another scenario potentially more representative of the European situation.
These models were then used to perform scenarios for 16 countries as follows. For each country an ensemble of initial states (C Σ, C 1, C 2)0 was estimated from the observational data normalised for a 50 million population (the initial states were estimated four to eight days before the end of the time series). These initial conditions were then used to perform an ensemble of five simulations for each model. Models incompatible with the present initial conditions were automatically rejected (diverging models). The non-rejected simulations are then plotted for comparison with the data observed during the days remaining after the initial conditions. The models the closest to the observations are identified as the most reliable scenarios.
Simulations are provided in Figure 3 for 16 countries (the epidemic curves are also provided in Fig. S11), classified from the most severe to the smoothest situation at the time of the analysis. These show that many countries have now very largely exceeded the Hubei scenario, in particular Italy for which a model could be obtained much later than the other models providing us with another – much worse – scenario. The Italian scenario was even overtaken by Spain and Belgium, and the United Kingdom is now on this scenario. France, the Netherlands and Sweden remain under it, although relatively close to it, Switzerland is significantly lower. The United States appear presently relatively far from the Italian scenario. However, they are still at the beginning of the outbreak in the United States and the growth of infected cases has been particularly quick to overtake the Hubei scenario. Important evolutions still have to be expected there. Among the other countries, Iran and Denmark are significantly over the Hubei scenario whereas Germany, Austria and Norway remain under but close to it. Japan has recently shown a clear restart and is now overtaking the South Korean scenario. Finally, although South Korea could not stop the propagation of the disease, it was able to maintain it at a relatively low level (see the epidemic curves Fig. S11), overtaking its own scenario very slowly.
Empirical scenarios simulations (variable C Σ).
Empirical scenarios (in colour) of the number of cumulative cases per 10 million population, applied to 16 countries based on the models obtained for seven Chinese provinces, South Korea, Japan and Italy. Observations are in black plain lines. For each model, an ensemble of five simulations was run starting from the observational initial conditions (black circle) from 2 April (DoY 93) to 6 April (DoY 97). The population size is taken into account but age, geographical distribution and society organisation are not. Correction factors were applied to each country to account for the inter-countries discrepancies between the cases and the number of deaths (see Suppl. Mat. 2). Four main scenarios have been kept: the Jiangxi (in yellow), the South Korea (in orange), the Hubei (in grey) and the Italian scenarios (in red). The other scenarios were rejected automatically.

As already noticed with Japan and as expected for the United States, the present scenarios can evolve. Based on the bulletins [23] published online from 9 February to 2 April 2020, the progressions of these analyses are presented in Figure 4. For most European countries, the scenarios have quickly evolved from Heilongjiang to Hubei scenario types and worse ones, highlighting that the outbreaks were not under control in Europe and that strong measures were required to slow down the disease.
Closest scenarios.
Closest scenarios as a function of time for eight countries: South Korea (K), Italy (I), Iran (Ir), Spain (E), France (F), Germany (G), Japan (J), United Kingdom (UK) and the United States of America (US). The results show that the situations can evolve very quickly for the countries who did not take stringent measures to wipe out the epidemic.

Discussion
The analyses of the control measures taken by the countries considered in the study show a distinct relationship between the epidemic level at which the measures were taken (in terms of the number of cumulative cases $C_\Sigma ^{{\rm control}}$ and deaths $D_\Sigma ^{{\rm control}}$
 , see Table 1 and Fig. S12) and how severe the impact was in the countries (as ordered in Fig. 3). It is still too early to identify the best-case scenario but obviously the earlier the reaction the most likely countries remain on the path of a less dramatic scenario.
Some behaviours require specific comments. In Iran, despite its classification as a moderate scenario, levels $C_\Sigma ^{{\rm control}}$ and $D_\Sigma ^{{\rm control}}$
 at which control measures were applied are found far much larger than all the other countries. These inconsistencies are difficult to explain since information about the outbreak is scarce and poorly transparent for this country; these high levels probably result from a high under-estimation of the cases of infection and deaths. Despite early control measures taken in Belgium, the spread of the epidemic has significantly overtaken the Italian scenario in terms of cases. This may very likely result from a poor respect of the control measures by part of the population. Finally, the large dispersion of the control measures in the United States mostly reveals the geographic differences in tackling the outbreak with, in particular, late measures in New York where the epidemic started relatively early, and early measures taken in California, where the epidemic began comparatively later. Since, the epidemic is at present still at its beginning, the situation will very likely evolve towards more severe scenarios in the days to come.
A more in-depth analysis of these results is required to better understand the impact of the type of enforcement (state control vs. volunteering basis) on the disease evolution outcome, including sociological analysis of the socio-cultural factors influencing control measure implementation between countries (Fig. S13). At this stage, it seems that measures based exclusively on volunteering basis have been efficient to contain the epidemic mostly in South Korea but insufficient to avoid restarts in Japan, and completely ineffective in the Netherlands and the United Kingdom. It shows also that controls established early at state level cannot be sufficient if the measures are not respected by most of the population.
During the last two weeks, in Europe, the most relevant scenarios have quickly evolved, starting from relatively light situations and evolving to more and more severe scenarios later confirmed step by step (see Fig. 4). Following this path, Italy has largely exceeded the situation met in the Hubei province, leading to another, much more severe scenario. Spain as well as Belgium have also reached and then exceeded the Italian scenario. They are closely followed by France and the Netherlands. The United Kingdom has also already reached it, and may possibly overtake it in the days to come.
One important question that arises from the present results is the scale of applicability. Because the model here obtained at China's scale is mostly based on a contribution at smaller scale (the Hubei, and more especially Wuhan), it was found to be relatively well applicable to Italy (even without population renormalisation, see Fig. 1). The daily deaths toll simulated by the model being even largely exceeded – and more and more – by the Italian observations, it shows that this model is characteristic of an even smaller – intra-province – scale. Indeed, most of the cases and deaths of the Hubei province actually come from the Wuhan district (on 16 March 2020, 73.7% and 79.7%, respectively [Reference Ferguson24]). As the epidemic could be circumscribed geographically by stringent – and generalised – measures in Wuhan, the model obtained for China finally appears more representative of the extremely smaller urban/suburban scale (~11 million inhabitants), a scale comparable to regions such as Lombardy in Italy (~10 M), or cities such as New York City (~5.80 M) and Los Angeles (~10.M) in the United States. Of course, the model cannot exclusively rely on a geographic scale, but also on the conditions in which it was obtained with early and stringent control. Such a severe scenario did happen at a suburb scale under stringent control. Without such a control, the scenarios can get much worse, even at this scale. Therefore, stringent measures similar to those implemented in China but exclusively focused on specific targets may not prevent the development of Hubei scenario types elsewhere. Without control, several scenarios of this type can happen at intra-province scale.
The scenarios here obtained are empirical scenarios. They compare the present epidemic situation to the situations met elsewhere without accounting explicitly for the measures taken to counteract the propagation of the disease. In this sense, the forecasts provided by these scenarios can only be valid provided dynamically equivalent measures are taken (since different measures may have similar effects on the epidemiologic curve by affecting the reproduction number by the same factor). What was observed in practice for the 16 countries of this study is a quick evolution of all the European scenarios from relatively light (Heilongjiang to Zhejiang) to moderate (South Korea scenario) and then to relatively severe (Hubei) situations and even much harder (the Italian scenario). We have thus reached a situation in Europe with multiple severe Hubei type scenarios at country scale and potentially much beyond in most of the cases. Since the dynamic observed in China is mainly representative of the suburban scale as explained before, several countries did experience multiple severe Wuhan scenarios inside its borders (such as in Italy, Spain or France). The evolution during the last weeks has shown that the United States is following the same evolution from light-to-severe scenarios.
The models obtained for Italy enabled to forecast coming decreasing stages of the epidemic in this country (Fig. S14). It is estimated that a situation with less than 100 new cases per day could be reached by May (see Table S5). Nonetheless, to drop down below this threshold will very likely be quite challenging. Indeed, even in South Korea, where measures have been quicker and more effective, a threshold lower than 50 new cases per day could be reached only very recently. Reaching this stage, specific measures will then be required before getting out from confinement to avoid new clusters restarts.
Nevertheless, the European path may not be the worst possible scenario. The comparison of various outbreaks at a suburban scale (1–10 million inhabitants) can be extremely different from one location to another revealing that, under softer confinement, the situations observed in Italy, Spain or France would have been even worse. Indeed, the evolution observed at four cities of the New York State (New York City, Nassau, Suffolk and Westchester) where the lockdown was late and relatively light, is clearly much worse than what is observed elsewhere, for example in three other cities on the West Coast (King, Santa Clara and Los Angeles), or in four regions of North of Italy (Lombardy, Veneto, Emilia-Romagna and Piedmont), in Daegu metropolitan city in South Korea and in Wuhan (see Fig. S15). These behaviours clearly illustrate that, at such a scale, a late confinement may lead in the United States to scenarios worse than what was observed in Europe.
The present analyses show that the global modelling approach, possibly in conjunction with other approaches, could be useful for decision makers to monitor the efficiency of control measures and to foresee the extent of the outbreak at various scales. In particular, it could be used to adapt more classical modelling approaches when needed to ensure mitigation and, hopefully, eradication of the disease [Reference Anderson5, Reference Ferguson24] (important methodological differences between the present study and more classical modelling approaches are sketched in Suppl. Mat. 9). This work could be used also to inform decision makers in countries in other parts of the world, especially in the low- and middle-income countries, such as in Africa [Reference Gilbert25] and South-East Asia, where numbers of COVID-19 cases are still relatively low and where rapid enforcement of control measures should be applied to prevent a catastrophic evolution of the disease.
Supplementary material
The supplementary material for this article can be found at https://doi.org/10.1017/S0950268820000990
Acknowledgements
S.M. would like to thank the ATOMOSYD website http://www.atomosyd.net for stimulating interactions.
Author contributions
S.M., M.P. and F.R. designed research; S.M., Y.Z. and M.P. performed research; S.M. and M.H. developed the tools; S.M. and M.P. analysed data and S.M., M.P., Y.Z., F.R. and Y.K. wrote and edited the paper.
Financial support
This work was supported by the French programmes Les Enveloppes Fluides et l'Environnement (CNRS-INSU), Défi Infinity (CNRS) and Programme National de Télédétection Spatiale (CNRS-INSU).
Conflict of interest
Authors declare no competing interests.


 Open access