


Introduction
Many policymakers in Western democracies seek to draw a clear line between asylum and labour migration. This reflects governments' focus on the strategic control of migration through the classification of immigrants into different legal categories based on different reasons for admission. In public debates, asylum and labour migration are often pitted against each other. There are numerous indications that policymakers strategically view these two dimensions in combination. The British immigration policies under New Labour (1997–2010) illustrate this duality: When confronted with public backlash against rising levels of immigration, Labour turned towards increasingly restrictive asylum policies while opening the British labour market to migrant workers (Consterdine Reference Consterdine2018: 135). More recently, similar developments have occurred in Eastern Europe where several of the European Union (EU) governments that have been most vocal in their opposition against receiving refugees have proactively liberalised entry conditions for migrant workers from outside the EU (Klaus Reference Klaus, Goździak, Main and Suter2020). These examples resonate with both the public discourse and scholarly work that suggest that Western democracies have become increasingly selective in immigrant admission while prioritising economic‐oriented intakes (e.g., de Haas et al. Reference de Haas, Natter and Vezzoli2018). At the same time, the public discourse often describes refugees as being more deserving of admission than those who primarily migrate for economic reasons (Crawley & Skleparis Reference Crawley and Skleparis2018).
Despite popular narratives and scholarly interest, we lack a clear theoretical understanding and empirical evidence of how countries combine various admission channels in the design of their immigration policies. In this article, we address this research gap by providing the first comprehensive theoretical account and analysis of how countries combine policies on asylum and labour migration. Two of the most prominent reasons for countries to accept immigration are the humanitarian motivation to admit refugees who seek protection and the economic motivation to admit migrant workers who fill labour shortages (cf. Boräng Reference Boräng2018: 6ff, Helbling et al. Reference Helbling, Bjerre, Römer and Zobel2017).Footnote 1 We analyse the combination of these two admission channels using the novel concept of the ‘immigration policy mix’. While previous research has almost exclusively focused on the absolute restrictiveness of immigration policy (Helbling & Kalkum Reference Helbling and Kalkum2018, de Haas et al. Reference de Haas, Natter and Vezzoli2018), we propose examining the relative weight countries place on different admission motivations as an additional policy dimension. The policy mix allows us to assess whether countries are more permissive to asylum migration relative to labour migration. We seek to answer the following questions: How does the immigration policy mix vary across countries and over time? Which factors shape countries’ relative openness to asylum and labour migration?
The existing literature treats immigration policy as either uniform, neglecting its multi‐dimensional character, or only seeks to explain specific subfields, such as asylum or labour migration policies. Unlike previous scholars, we do not seek to identify ‘grand’ immigration regime types. Instead, we analyse the relative openness that countries assign to different admission channels. We follow scholars who posit that different underlying logics of policy‐making drive subfields of immigration policy (Boräng Reference Boräng2018; Givens & Luedtke Reference Givens and Luedtke2005; Lutz Reference Lutz2019). However, we also go beyond this literature by arguing that the empirical complexity of immigration policies can only be understood as a combination of its subfields. Despite acknowledgment in the literature that immigration policies are a ‘mixed bag’ (de Haas et al. Reference de Haas, Natter and Vezzoli2015: 4; Akkerman Reference Akkerman2015), empirical research has not yet systematically studied the policy mix that countries opt for in terms of the combination of subfields. Moreover, the degree to which established theories of immigration policy help us explain the relative openness of countries to refugees and migrant workers remains an open question. We aim to fill this gap with an analysis of the immigration policy mix in liberal democracies and by testing three different explanations for its variation: policy convergence, the influence of partisanship and the role of welfare institutions.
This article contributes to the literature in several ways. While the policy mix concept has helped to advance research in other policy fields, such as macro‐economic or environmental policy, to our knowledge it has not yet been applied to the migration field. We introduce the immigration policy mix as a novel way to describe and compare countries’ patterns of immigrant admission. Furthermore, we expand theories of immigration policy to explain countries’ immigration policy mixes. Finally, we test our theoretical expectations with a quantitative‐comparative analysis of immigration policies in OECD countries since 1980. The findings demonstrate that the immigration policy mix is a separate characteristic of immigration regulations that goes beyond general restrictiveness and that provides important insights into the complexity of immigration regulations in liberal democracies.
The immigration policy mix
In order to understand immigration policies, we require systematic and comprehensive ways to describe them in a way that allows for their comparison across space and time. Previous attempts to do so have either differentiated subfields of immigration policy (e.g., Beine et al. Reference Beine, Boucher, Burgoon, Crock, Gest, Hiscox, McGovern, Rapoport, Schaper and Thielemann2016; de Haas et al. Reference de Haas, Natter and Vezzoli2015; Helbling et al. Reference Helbling, Bjerre, Römer and Zobel2017) or have aimed to identify specific types of immigration regimes – primarily in the field of citizenship and immigrant integration – in order to group countries into different models (e.g., Boucher & Gest Reference Boucher and Gest2018; Koopmans Reference Koopmans2013). These approaches have limitations, however. The focus on subfields tends to lose sight of the overall characteristics of immigration policies. Regime types tend to neglect the competing drivers of policy‐making and to make unrealistic assumptions about the cohesiveness of policies across various subfields (Finotelli & Michalowski Reference Finotelli and Michalowski2012; Freeman Reference Freeman2006). Regime types assume static models based on a well‐integrated, consistent and path‐dependent policy framework. However, previous research has shown that migration policies are often ‘mixed bags’ (de Haas et al. Reference de Haas, Natter and Vezzoli2015: 4) and characterised by inconsistencies and ‘deliberate malintegration’ (Boswell & Geddes Reference Boswell and Geddes2011: 47–48; Ford et al. Reference Ford, Jennings and Somerville2015). Instead, we should therefore expect ‘differences in degree’ rather than ‘differences in kind’ in the design of immigration policies. Moreover, attempts to identify immigration regime types tend to be historically contingent and often focus on migration demographics rather than on actual policies (e.g., the common distinction between classic ‘settler states’ and old and new countries of immigration; see Cornelius & Tsuda Reference Cornelius, Tsuda, Cornelius, Tsuda, Martin and Hollifield2004). For these reasons, regime types have severe limitations that hamper the analysis of the empirical complexity of immigration regulations.
Nevertheless, scholars need valid concepts to describe immigration policies and render them comparable across countries and over time. We therefore propose viewing the ‘immigration policy mix’ as an alternative to regime types and as a complement to studies on general policy restrictiveness. A policy mix seeks to describe a policy field by acknowledging that policies may be the result of a diverse set of rationales rather than of a single uniform model (Rogge et al. Reference Rogge, Kern and Howlett2017). We can generally understand a policy mix to be a combination of different dimensions in a certain policy field. It is a flexible concept that avoids the problematic assumptions of regime types. The policy mix concept has gained prominence in other fields. In the study of macro‐economic policy, it advanced the development of integrated analyses of fiscal and monetary policies and of how their concurrence explains inflation (e.g., Bianchi & Ilut Reference Bianchi and Ilut2017); the concept thus contributed to one of the main theoretical developments in post‐Keynesian macro‐economics (Hein Reference Hein2017). In the study of environmental policy, the concept is used to investigate optimal portfolio design, for example, in climate change mitigation (Howlett & del Rio Reference Howlett and del Rio2015). To our knowledge, there are no such applications of the policy mix concept to immigration policies.
We argue that the policy mix concept is fruitful for studying immigration policy‐making and its determinants. It ties in with the presumptions of the ‘liberal paradox’, that is, the idea that liberal democracies need to balance competing demands resulting from capitalism, representative democracy and constitutionalism when designing migration policies (Boswell & Geddes Reference Boswell and Geddes2011: 47–48, Ford et al. Reference Ford, Jennings and Somerville2015; Hampshire Reference Hampshire2013). The need to be both open and closed to immigration suggests that immigration policies are neither only liberal nor only restrictive but incrementally adjusted and often contradictory. A policy mix approach is appropriate for an analysis of the empirical complexity resulting from the ‘liberal paradox’. The frequency of migration policy reforms has increased with the rising politicisation of migration (de Haas et al. Reference de Haas, Natter and Vezzoli2018), as has the regulatory complexity of immigration policies (Beine et al. Reference Beine, Boucher, Burgoon, Crock, Gest, Hiscox, McGovern, Rapoport, Schaper and Thielemann2016). Conceptualising immigration policies as a policy mix helps us to dissect this complexity, while simultaneously structuring and simplifying it in order to compare national immigration policy trajectories across countries and over time. Moreover, it seems plausible that different admission channels jointly shape immigration outcomes. The concept of a policy mix, therefore, not only offers a new perspective on the design of immigration policies but can also enhance our understanding of how these policies shape immigration outcomes.
We understand immigration policy as all laws, regulations and orders regarding the entry and stay of immigrants based on different legal channels (cf. Helbling et al. Reference Helbling, Bjerre, Römer and Zobel2017). Accordingly, we define the immigration policy mix as the combination of different admission channels that interact to influence the direction, volume, composition and timing of migration. We follow the common approach of describing immigrant admission in terms of its restrictiveness (or openness).Footnote 2 The different weight that policies place on different admission channels constitutes a separate characteristic of immigration policies, one that goes beyond their general position on the restrictiveness‐openness continuum. The immigration policy mix allows us to assess differences in the openness of admission channels and to describe which admission motivation countries prioritise.
In this paper, we specifically focus on the mix of asylum and labour migration policies. By measuring the relative openness of asylum and labour migration policies, the immigration policy mix captures the degree of a country's asylum‐favourability (i.e., it has a policy mix that is more liberal towards asylum than labour migration) or labour‐favourability (i.e., it has a policy mix that is more liberal towards labour than asylum migration). We believe that this specific combination is particularly relevant for advancing our understanding of immigration policies for the following reasons.
First, liberal democracies typically structure their immigration policies through a number of admission channels that depend on their different motivations for selectively accepting immigration (Helbling et al. Reference Helbling, Bjerre, Römer and Zobel2017). All immigrant‐receiving countries in the Western world have separate legal channels for asylum and labour migration, fulfilling the analytical requirement of cross‐national equivalence. Refugees and migrant workers jointly contribute to a substantial part of the overall number of immigrants admitted by countries.Footnote 3 Existing datasets on immigration policy distinguish subfields based on different target groups (de Haas et al. Reference de Haas, Natter and Vezzoli2015; Helbling et al. Reference Helbling, Bjerre, Römer and Zobel2017). Differentiating regulations requires assessing immigration policies as a policy mix to capture their multi‐dimensionality. Particular policy choices may result from mixed motives. Labour migration policies can take humanitarian considerations into account (Ruhs Reference Ruhs2019), and asylum policies increasingly incorporate economic or meritocratic elements (Laubenthal Reference Laubenthal2019). Nevertheless, admission channels are designed and legitimised based on the particular reasons for accepting immigration. We opt to conceptualise the immigration policy mix based on the combination of admission channels because it reflects the common structure of immigration regulations.
Second, the distinction between humanitarian and economic admission is politically salient: In public debates, asylum and labour migration are often pitted against each other. This bifurcation often implies differentiating ‘deserving’ from ‘undeserving’ immigrants (Crawley & Skleparis Reference Crawley and Skleparis2018). Moreover, many scholars focus on the selectivity of immigration policies and emphasise that countries increasingly use economic criteria for immigrant admission (e.g., de Haas et al. Reference de Haas, Natter and Vezzoli2018; Ellermann 2020). There are also ample indications that the policy mix between asylum and labour migration plays an important role in policy‐making, where governments strategically combine the two subfields (see Introduction).
Third, asylum and labour migration arguably present the two migration categories that are most contrary to each other in terms of their admission logics.Footnote 4 While admitting refugees is an international legal obligation for liberal democracies, it is a country's sovereign right to exercise state discretion on whether or not to accept labour migration. Recruiting migrant workers is in the economic self‐interest of the receiving state, whereas the admission of refugees is grounded in humanitarian reasoning and the idea of moral responsibility of the state (cf. Boräng Reference Boräng2015, Reference Boräng2018; Ruhs Reference Ruhs2013). In the case of the admission of migrant workers, the criteria are skill‐based and meritocratic (the contribution that migrants provide to the country of destination). In the case of refugees, admission is based on an individual's need for protection. Other admission reasons tend to fall between humanitarian and economic motivations. For instance, family migration, the largest residual category, can be related to either asylum or labour migration depending on the citizenship or residence title of the respective ‘principal’ person entitled to family reunification. The motivation for admitting the family of migrants is therefore likely to be mixed. For this reason, our analysis of the immigration policy mix focuses on economic and humanitarian admission as countries' two core motivations for accepting immigrants.
Converging, partisan or path dependent
To understand the immigration policy mix, we need to investigate the drivers of the relative openness of liberal democracies to asylum and labour migration. We discuss three approaches that build upon existing theories of immigration policies (cf. Consterdine & Hampshire 2020). The convergence hypothesis expects that there is an increasing similarity in the immigration policy mix across countries. The partisan hypothesis expects that the immigration policy mix follows political dynamics, and the institutionalist hypothesis suggests the presence of path dependence.
The convergence hypothesis
A prominent hypothesis in the immigration politics literature is that countries’ immigration policies have become increasingly similar over time because of internal and external constraints (Hollifield et al. Reference Hollifield, Martin and Orrenius2014; Meyers Reference Meyers2002). Recent studies find empirical evidence for this claim (de Haas et al. Reference de Haas, Natter and Vezzoli2018; Helbling & Kalkum Reference Helbling and Kalkum2018; but see Consterdine & Hampshire 2020, on the contrary). Convergence can take place on different levels such as policy goals, policy outputs or policy outcomes. We follow the concept of the immigration policy mix and assess convergence in terms of policy outputs. In brief, due to convergence pressures, governments have increasingly limited room to manoeuvre in the combination of their admission channels and as a result, the immigration policy mix becomes more similar across countries.
In the context of asylum and labour migration, we identify four different mechanisms of policy convergence over the past few decades. First, convergence of the immigration policy mix may be the result of geopolitics and historical events. During the Cold War, the Western world established relatively liberal asylum regulations because this fitted their ideological demarcation from the Eastern Bloc (Zolberg Reference Zolberg2012). At the same time, most Western receiving countries increasingly depended on migrant labour. However, the end of the Cold War eliminated the ideological justification for liberal asylum policies. Increasing refugee arrivals in the 1990s fuelled the domestic politicisation of immigration and, together with the electoral success of radical‐right parties, increased pressure on governments to enact more restrictive policies (Mudde Reference Mudde2013). These changes led countries to converge on viewing refugees as a burden to be minimised, despite continuing to recruit migrant workers. We assume that the stronger anti‐immigration parties are, the higher the pressure on governments to prioritise ‘desired’ labour migration over ‘undesired’ asylum migration.Footnote 5 Second, another prominent convergence mechanism is policy emulation; countries imitate others and learn from their experiences (cf. Meyers Reference Meyers2002). Western countries share the intention of minimising the spontaneous arrival of asylum seekers and have therefore followed each other's example to establish ‘remote control’ policies (e.g., FitzGerald Reference FitzGerald2020). At the same time, these countries face common challenges that result from demographic ageing and domestic labour shortages; hence, policymakers tend to copy other countries’ policies (Finotelli & Kolb Reference Finotelli and Kolb2017). A third convergence mechanism could be the interdependence of countries’ immigration policy mixes. Countries that liberalise labour migration become more attractive for migrant workers when compared to their competitors, resulting in a competition for the ‘best and brightest’ (Czaika Reference Czaika2018). Simultaneously, a ‘race to the bottom’ may occur in the asylum policy realm as countries compete to be as unattractive as possible for potential asylum seekers (Betts Reference Betts2009: 177). As a result, we may expect convergence towards ‘managed migration’, which aims to attract desired immigrants and to deter undesired ones. Fourth, global or regional migration regimes may constitute a convergence pressure. The role of international regimes as drivers of convergence is negligible in the field of labour migration given that there is no global labour migration regime akin to the refugee regime (Betts Reference Betts and Betts2011), and the regulation of labour migration from outside the EU remains a core competence of individual EU member states (Hampshire Reference Hampshire2016). In the field of asylum, however, both global and regional regimes create convergence pressures. Globally, the international refugee regime establishes the norm of ‘non‐refoulement’, which outlaws the forced return of individuals who fear persecution in their country of origin. Regionally, further convergence pressure is to be expected from political integration in Europe, where asylum governance is one of the most developed elements of EU migration policy (Hampshire Reference Hampshire2016). While Europeanisation has brought more restrictive immigration control policies that make territorial access for asylum seekers more difficult (e.g., Lavenex Reference Lavenex2006), we expect that the harmonisation of European asylum standards leads to higher legal standards because of the EU's regulatory capacity as well as the bargaining successes of strong member states (e.g., Zaun Reference Zaun2016). EU membership should therefore be associated with a higher asylum‐favourability.
In sum, the immigration policy mix experiences substantial convergence pressure. Economic globalisation, political internationalisation and domestic politicisation have significantly increased since 1980, and these processes have jointly limited governments' policy space to combine asylum and labour migration in their preferred way. The convergence pressures on the immigration policy mix stem from the shared challenges of the liberal paradox, that is, the conflicting imperatives of market needs, popular demands and institutional obligations. For this reason, we expect that the immigration policy mixes of liberal democracies have become more similar over the period of study.
Hypothesis H1: The immigration policy mixes of Western democracies have converged over time.
The partisanship hypothesis
Another theoretical approach considers that immigration policies follow political dynamics and are determined by partisan preferences. Migration touches on core questions of societal (re‐) distribution of material and symbolic resources and is therefore likely to evoke partisan conflict (Schain Reference Schain2008). Empirical studies show that political parties compete on the issue of immigration and take different policy positions (Akkerman Reference Akkerman2015; Lehmann & Zobel Reference Lehmann and Zobel2018; Dancygier & Margalit Reference Dancygier and Margalit2020). Mainstream parties often appear internally divided on immigration due to conflicting ideological facets (e.g., Natter et al. Reference Natter, Czaika and de Haas2020). In the following, we discuss how these ideological tensions shape governments' preferences on the immigration policy mix.
Central parts of the political left's ideological profile are the concepts of solidarity and universalism. Given that solidarity is also a key norm that drives the admission of refugees (Boräng Reference Boräng2015), we expect that left parties tend to support liberal asylum policies. This fits with Helbling's (Reference Helbling2014: 34) finding on the framing strategies of political parties, which show that ‘the further to the left a party can be placed, the more important moral‐universal […] arguments become’. However, left‐wing parties traditionally represent the interests of the domestic working class and therefore support labour market protectionism, that is, protecting native workers from neoliberal reforms of labour market regulations and against the alleged competition from migrant workers. Together with trade unions, left‐wing parties tend to prefer a restrictive labour migration policy out of fear that additional labour supply might diminish local workers' bargaining power and thus undermine labour standards (Freeman Reference Freeman2006). According to this ideology of international solidarity and labour market protectionism, we expect left‐wing parties, and therefore left‐wing governments, to be more open towards asylum than labour migration.
Hypothesis H2a: The more left‐wing a government, the higher the asylum‐favourability of its immigration policy mix.
In contrast, the ideology of the political right is rooted in support for economic liberalism that favours open markets. Right‐wing parties represent the interests of employers and their demands for migrant workers as a flexible and cheap labour force (Hampshire Reference Hampshire2013: 24). Moreover, right‐wing ideology is also based on values such as conformity, tradition and social conservatism (Thomsen & Rafiqi Reference Thomsen and Rafiqi2019). These values are more prone towards ethnocentrism, the attachment to national identity and the view of immigration as a cultural threat. Consequently, right‐wing parties are less committed to international solidarity than left‐wing parties and their ideological facets of cultural conservatism and nativism tend to provoke a critical view of refugees. We therefore expect that right‐wing parties and governments tend to prefer migrant workers to refugees because of their ideology of economic liberalism and cultural conservatism.
Hypothesis H2b: The more right‐wing a government, the higher the labour‐favourability of its immigration policy mix.
The institutionalist hypothesis
A third approach on immigration policy comes from political economy. It posits that the structure of labour markets and welfare institutions shapes whether a country promotes immigration and what type of immigration it promotes (Afonso & Devitt Reference Afonso and Devitt2016; Ruhs Reference Ruhs2013). The underlying logic is that the existing institutional settings limit the leeway for radical change, thus resulting in path‐dependent policies.
Immigration may strengthen the economic foundation of Western welfare states by compensating for demographic imbalances; however, they may also pose a fiscal threat if migrants are entitled to welfare and turn out to be net receivers (Lutz Reference Lutz, Careja, Emmenegger and Giger2020). How welfare states respond to migration might therefore be shaped by the different welfare state regimes that vary in their labour market structure as well as their degree of decommodification and social solidarity (Esping‐Andersen Reference Esping‐Andersen1990). What does this mean for the immigration policy mix? Institutionalist explanations exist for asylum migration (Boräng Reference Boräng2015) and labour migration (Menz Reference Menz, Menz and Caviedes2010; Ruhs Reference Ruhs2018). Additionally, governments often contrast ‘useful’ labour migration with ‘burdensome’ asylum migration (Menz Reference Menz, Parsons and Smeeding2006: 393). It is therefore plausible that countries’ immigration policy mixes are embedded in politico‐economic institutions. We elaborate on how a country's political economy might shape its immigration policy mix depending on if it adopts an economic or a solidarity rationale.
Many receiving countries worry that immigrants may become a fiscal burden. More generous welfare states are more likely to extend welfare rights to immigrants and are therefore more exposed to migration‐related fiscal risks (Menz Reference Menz, Parsons and Smeeding2006; Römer Reference Römer2017). In addition, welfare generosity is typically coupled with highly regulated labour markets that render it more difficult to integrate labour market outsiders (Ruhs Reference Ruhs2013: 114). This is relevant for immigrant admission because the labour market integration of refugees tends to be more challenging than that of migrant workers (e.g., Chin & Cortes Reference Chin, Cortes, Chiswick and Miller2015). Since universal welfare states face larger risks from non‐economic immigration, we expect them to prefer migrant workers to refugees. In contrast, minimalist welfare states with liberal labour markets are less exposed to fiscal risks from immigration and have a greater need for and a greater integration capacity for migrant workers. Their pressure to prioritise economic‐oriented admission is therefore lower. We expect these institutional settings to influence countries’ immigration policy mixes, and we expect that higher welfare generosity is associated with higher labour‐favourability.
Hypothesis H3a: The more generous the welfare state, the higher the labour‐favourability of the immigration policy mix (economic rationale).
An alternative institutionalist perspective focuses on how welfare state institutions shape social norms. Institutions shape perceptions about what is fair in society, and who deserves assistance (e.g., Laenen et al. Reference Laenen, Rossetti and van Oorschot2019). Generous welfare states have internalised norms of universal solidarity and draw their legitimacy from their inclusiveness. For this reason, welfare generosity should be associated with more openness towards immigration, regardless of its (perceived or actual) economic usefulness (Boräng Reference Boräng2015). We may therefore expect a spillover effect from welfare generosity to solidarity with immigrants, and refugees in particular, in the role of an especially disadvantaged group. A stronger solidarity‐rationale should increase the preference of refugees over migrant workers because of the higher moral deservingness attributed to the former (Crawley & Skleparis Reference Crawley and Skleparis2018). In contrast, conservative and liberal welfare states are based on norms of reciprocity and individual responsibility rather than solidarity or universalism (Taylor‐Gooby et al. Reference Taylor‐Gooby, Hvinden, Mau, Leruth, Schoyen and Gyory2019). These norms are more compatible with the admission of migrant workers for economic motivations than with the humanitarian admission of refugees. The conservative and liberal institutional logic leans towards more economically oriented admission. For these reasons, we expect that generous welfare states tend toward higher asylum‐favourability.
Hypothesis H3b: The more generous the welfare state, the higher the asylum‐favourability of the immigration policy mix (solidarity rationale).
Data and method
To test our hypotheses, we conduct a comparative analysis of immigration policies in Western democracies. We use the immigration policy mix, defined as a country's relative openness towards asylum and labour migration, as the main dependent variable. To measure this variable, we rely on the Immigration Policies in Comparison (IMPIC) dataset compiled by Helbling et al. (Reference Helbling, Bjerre, Römer and Zobel2017). The IMPIC dataset is the most comprehensive dataset on immigration policies, and it encompasses the policies of 33 OECD countries from 1980 to 2010.Footnote 6 For each policy field, the IMPIC index captures the restrictiveness of entry conditions and the eligibility criteria that define how difficult it is to establish legal residence in a country. Moreover, the dataset includes information on the rights and the security of the status granted by a respective entry permit, which stipulate the duration of immigrants' stay in the territory and the extent to which they are granted certain rights, such as access to the labour market. We extract two variables on immigration regulation restrictiveness from the dataset, one for asylum and one for labour migration that incorporate these aspects (for details on the operationalisation, see the Online Appendix). We then calculate the immigration policy mix, our main dependent variable, as the difference between the two subfields (asylum‐ labour). The resulting variable ranges were from −1 to +1. Negative values represent asylum‐favourability, and positive values represent labour‐favourability. The further away the value from zero, the larger the restrictiveness gap between asylum and labour. The measurement of a policy mix with different policy dimensions requires a certain isomorphism between the measurement aspects and the numerical properties of the different policy indices. The IMPIC dataset addresses this challenge by identifying the theoretical minimum and maximum of sub‐indices instead of defining the range by empirical distribution. Furthermore, the existence of a specific legal provision is fixed at the value of 0.5. These features mitigate the potential incommensurability of different policy sub‐indices. The IMPIC dataset therefore allows for a meaningful comparison of policy restrictiveness across the different target groups of refugees and migrant workers.
Additionally, we measure the immigration policy mix as the policy preference of political parties to test the assumption underlying the partisanship hypotheses. We measure migration policy positions using a dataset by Dancygier and Margalit (Reference Dancygier and Margalit2020) that spans from the early 1960s to 2013 and includes 12 West European countries.Footnote 7 The authors code positional statements in the party manifestos of three party groups (centre‐left, centre‐right, anti‐immigrant parties).Footnote 8 They code each statement as positive, negative or neutral. Positive positions represent statements that favour more immigration or refer to the positive impact of immigration (negative statements refer to the opposite). For our analysis, we select the category ‘jobs’ that measures labour‐market related statements such as job availability, labour shortages and the recruitment of migrant workers as the labour migration position of a party. We measure a party's position on asylum using the ‘asylum/refugees’ item, which is based on statements related to the admission of refugees and the asylum process. The two items capture the net sentiment on a scale from –1 to +1. Negative values represent overall negative views, and positive values represent overall positive views. Subtracting the labour sentiment from the asylum sentiment yields a measurement for the preferred immigration policy mix.
A set of independent variables serves to test our hypotheses regarding the determinants of the immigration policy mix. We operationalise convergence pressure, government ideology and welfare institutions as independent variables (see Table A1 in the Online Appendix for the detailed operationalisation). First, we measure convergence pressure using two variables. We include a dummy for EU membership as a main external source of convergence pressure. As a main internal source of convergence pressure, we include the strength of anti‐immigration mobilisation, which we measure by the vote share of radical‐right populist parties.Footnote 9 Second, we operationalise the political ideology of a government using two variables, the seat share of left‐wing and right‐wing parties among all governing parties. These measures are based on the Comparative Political Data Set by Armingeon et al. (2017, 2018). Third, we measure welfare institutions using an aggregated index of welfare generosity by Scruggs et al. (Reference Scruggs, Jahn and Kuitto2014), which covers unemployment, sickness and retirement. Alternatively, we use a set of four welfare state regime dummies (social democratic, conservative, liberal and Southern European).Footnote 10 Finally, we include two important control factors: the unemployment rate, which accounts for the business cycle that affects labour demand, and net migration relative to population size, which we use as a proxy of general issue importance.
We conduct the empirical analysis in three steps. First, we provide a descriptive analysis of the immigration policy mix based on a comparison across space and time. We estimate the evolution over time using locally estimated scatterplot smoothing (LOESS). These analyses reveal the overall pattern of the immigration policy mix and the degree of variation across different dimensions.
In a second step, we test our three theoretical hypotheses by assessing whether the policy mix pattern was consistent with our empirical expectations. We assess the convergence hypothesis by measuring the sigma(σ)‐convergence (declining dispersion between countries over time) and beta(β)‐convergence (laggard countries catching up). We measure the sigma‐convergence by examining how the cross‐country variation (standard deviation) changed over time. It has been argued that this variance‐approach may underestimate the magnitude of convergence due to processes of conditional convergence (Plümper & Schneider Reference Plümper and Schneider2009). Therefore, we estimated the beta‐convergence by regressing the policy change over time on the initial starting point and by separate estimates for OECD and EU countries. We then investigate the role of partisanship by analysing and comparing the party manifesto data of centre‐left, centre‐right and radical‐right parties on their political preferences toward the immigration policy mix. This analysis allows us to test the underlying assumption of the partisanship hypothesis that political ideology is associated with distinct preferences on the immigration policy mix. Moreover, the positions of political parties also reveal whether the political discourse has shifted towards higher labour‐favourability as popular narratives suggest.
In a third step, we run panel regression models to assess the explanatory power of convergence pressures, government ideology and welfare institutions on countries’ immigration policy mixes. To account for the time‐serial cross‐sectional nature of the data, we include country‐fixed effects and panel‐corrected standard errors. We employ different model specifications to ensure valid estimates. We use two main models, one on the within‐country variation and one on the between‐country variation. Within models are more likely to detect the effects of political dynamics and convergence pressure because their variation is expected to primarily vary over time rather than across countries.Footnote 11 In contrast, between‐models are more apt at detecting the influence of path dependence because institutions primarily vary between countries and are largely time invariant. Because trends and the convergence of migration policies are mostly discussed in the European integration literature and EU countries share the same institutional context, models are estimated based on two country samples, OECD countries and EU countries. Finally, we conduct a series of robustness tests using resampling, alternative measurements and additional controls to assess the effect stability.
Results
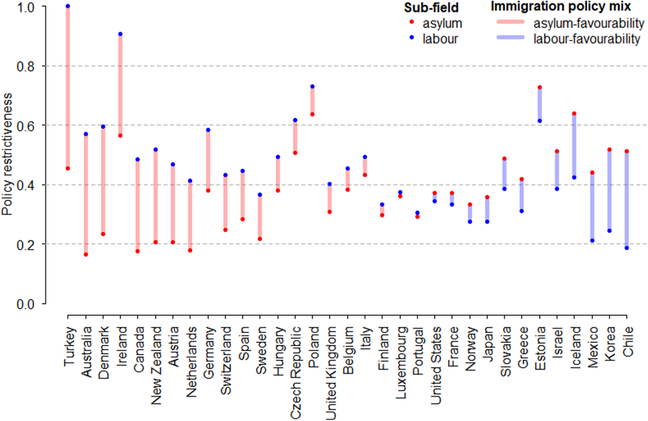
We first present descriptive evidence on the immigration policy mix as the relative openness of policies towards asylum and labour migration. Figure 1 demonstrates the average policy restrictiveness on asylum and labour migration across countries based on country‐means for the 1980 to 2010 time period. Among these countries, 21 have more restrictive policies on labour than on asylum migration, and 12 countries have more restrictive asylum than labour migration policies. The first descriptive analysis reveals that there is not only substantial variation within the two policy subfields but also that the resulting immigration policy mix shows large cross‐country variation.Footnote 12 Moreover, we only find a weak and statistically insignificant association between countries’ absolute policy restrictiveness and countries’ relative restrictiveness (policy mix). This suggests that the immigration policy mix constitutes a separate policy characteristic (see also Figure A4 in the Online Appendix).
Immigration policy mix across countries. [Colour figure can be viewed at wileyonlinelibrary.com]
Note: The plot displays the average immigration policy mix of countries over the 1980 to 2010 period located at the absolute level of policy restrictiveness and ordered by size.

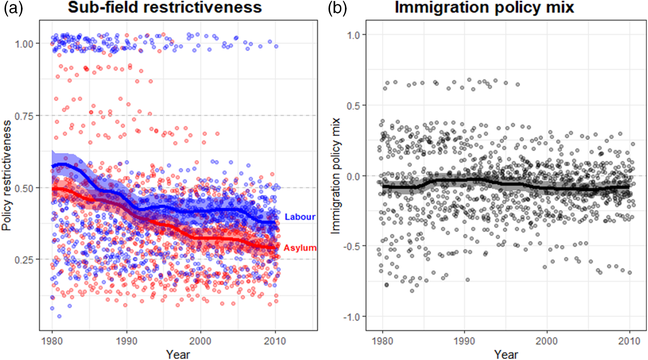
We then estimated the average trends in policy restrictiveness on asylum and labour migration over time (see Figure 2a). Immigration regulations have become more liberal on average for both refugees and migrant workers. Over the period from 1980 to 2010, policies have become slightly more liberal on asylum than on labour migration. In Figure 2b, we estimate that the average policy mix moved very slightly towards lower asylum‐favourability in the second half of the 1980s and early 1990s and has moved back to higher asylum‐favourability since then.Footnote 13 The average immigration policy mix has been relatively stable over time and shows no signs of moving towards more economically motivated admission.Footnote 14 There is also a large variation and no clear direction of change in country‐specific changes of the policy mix over time. This finding can be interpreted as evidence against the institutional stickiness expected from the path‐dependence approach.
Immigration policy mix over time. [Colour figure can be viewed at wileyonlinelibrary.com]
Note: LOESS estimates across 33 OECD countries (smoothing span = 0.2, 90% confidence interval). Jittered and semi‐transparent observations to reduce over‐plotting.

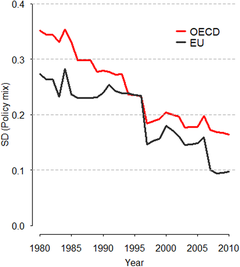
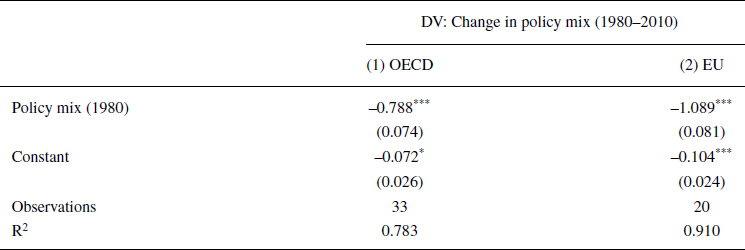
We then tested the convergence hypothesis by measuring the variance in the immigration policy mix over time (see Figure 3). There is a clear pattern of continuous convergence, which primarily took place from 1980 to 1995 and then slowed down. We see that convergence is higher among EU countries than among OECD countries. To corroborate this evidence of convergence, we also estimate the beta‐convergence using regression models (see Table 1). These models provide equally strong support for convergence and reveal that convergence in EU countries is substantially stronger than in OECD countries. This finding suggests some degree of club convergence that results from Europeanisation.Footnote 15 Overall, convergence more than halves the average restrictiveness gap between asylum and labour over the 30‐year period (see also Figure A5 in the Online Appendix).Footnote 16 Countries are converging towards a liberal admission model with similar levels of openness towards asylum and labour migration. These results confirm Hypothesis H1, which posits that there has been a convergence of the immigration policy mix in Western democracies over time.
Policy mix σ‐convergence. [Colour figure can be viewed at wileyonlinelibrary.com]
Note: Temporal evolution of the variation (standard deviation) in countries’ immigration policy mix, across
OECD (N=33) and EU countries (N=20).

Estimation of policy mix β‐convergence

Note: Regression estimates for (β‐)convergence (standard errors in parentheses). Level of statistical significance:
* < 0.05;
** <0.01;
*** <0.001.
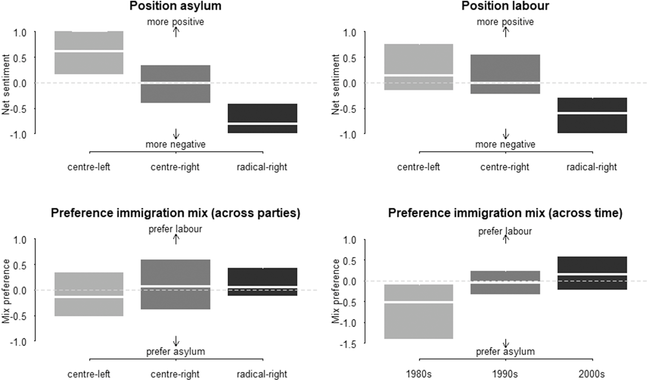
Next, we looked at the policy preferences of political parties on asylum and labour migration. We asked the question: Does party ideology determine the preference regarding the immigration policy mix? We assessed this question based on the policy positions that political parties stated in their electoral manifestos. The boxplots in Figure 4 compare the distribution of policy positions on asylum and labour migration between centre‐left, centre‐right and radical‐right parties. As expected, radical‐right parties have a large negative sentiment score on both asylum and labour immigration in their party manifestos. Centre‐left parties are strongly positive on asylum and mildly positive on labour migration. Centre‐right parties are on average slightly positive on both asylum and labour migration. The pattern suggests that there is a partisan divide between left‐wing and right‐wing parties that primarily focuses on asylum and far less on labour migration. We then calculate the preference of the three party groups on the immigration policy mix. Again, we find a partisan pattern that shows that left‐wing parties on average express more positive sentiments on asylum than on labour whereas right‐wing parties are slightly more negative on average towards asylum than labour migration. This pattern provides limited evidence for the underlying assumption of Hypothesis H2 that the preference on the immigration policy mix varies by partisan orientation. Overall, political parties differ more on whether to admit immigrants than on the specific mix of immigrants.
Party preferences on the immigration policy mix.
Note: These are simplified boxplots on the immigration preferences of political parties in 12 West European countries. The gray areas represent the inter‐quartile range, where 50% of all observations are located, and the white line in between represents the median value. Data: Dancygier and Margalit (2020).

Immigration politics has evolved substantially over the last few decades and has gained salience and contributed to the restructuring of political conflict structures. We therefore also tracked how party preferences evolved between 1980 and 2013 (see Figure 4). We observe a strong shift in party preferences from preferring asylum to preferring labour migration. This shift occurred for all three party groups. Centre‐left parties experienced the largest shift while anti‐immigrant parties experienced the weakest shift (see Figure A2 in the Online Appendix). The largest shift in preferences for the immigration policy mix took place between the 1980s and the 1990s. The evolution of party sentiments on asylum and labour separately reveals that the shifts occurred during different time periods. Sympathy for refugees dissipated after the 1980s, while in the 2000s parties became more willing to admit migrant workers. This pattern suggests that the preference change in the immigration policy mix is the result of the decrease in Western democracies' sympathies for refugees after the Cold War and their move towards increasing their acceptance of labour migration after 2000. It is worth noting that these results from 12 West European democracies cannot necessarily be generalised to all OECD countries. Nevertheless, the consistent trend provides strong evidence that the political preferences on the immigration policy mix have shifted significantly over time.
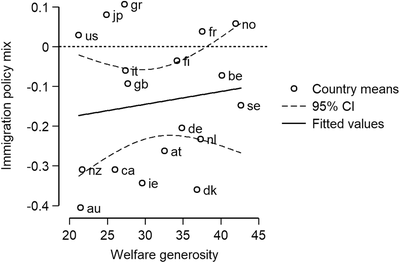
We also assessed the role of welfare institutions on countries’ immigration policy mixes. Figure 5 shows the distribution of countries’ policy mixes by their level of welfare generosity. There is no clear association between levels of welfare generosity and the immigration policy mix. The cross‐country correlation is neither substantively nor statistically significant (Pearson's r = 0.14, p = 0.59). In other words, the descriptive analysis does not support the institutionalist hypothesis.
Immigration policy mix by welfare generosity.
Note: Scatter plot of immigration policy mix and welfare generosity (country averages 1980–2010). We excluded countries with incomplete time series.

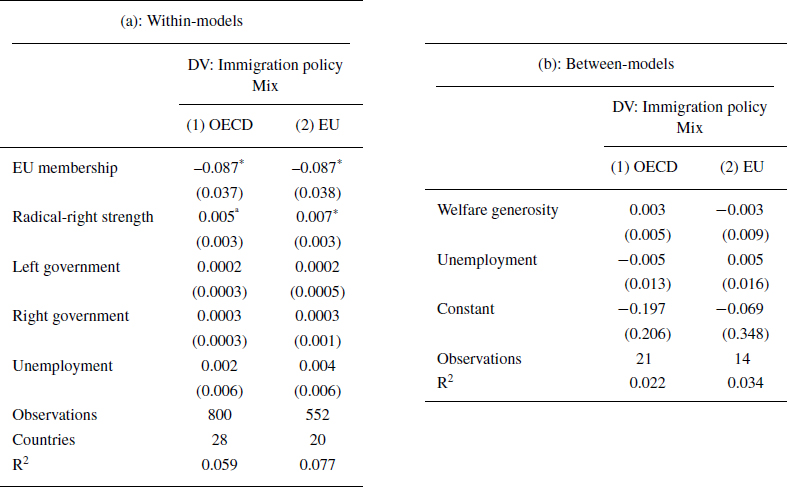
To assess the influence of convergence pressures, government ideology and welfare institutions on the immigration policy mix, we estimated panel regression models for the within‐country variation (Table 2a) and the between‐country variation (Table 2b). EU membership significantly increases the asylum‐favourability in the within model. This suggests that joining the EU tilted countries’ policy mixes towards asylum‐favourability. An increase in the vote share of radical‐right parties leads to higher labour‐favourability; the size and statistical significance is more pronounced for the sub‐sample of EU countries. Both sources of convergence pressures exert the expected effect on countries’ immigration policy mixes and thereby confirm the underlying assumption of the convergence hypothesis (H1). Regarding hypotheses H2a and H2b on the influence of government ideology, the (within‐)models do not find any substantial effect of right‐wing or left‐wing parties’ participation in government. Moreover, in line with the descriptive results, we do not find a significant effect of welfare generosity on the immigration policy mix (between‐models). This finding does not provide evidence for hypotheses H3a nor H3b in terms of institutionalist path dependence. The results are largely similar for both country samples of OECD and EU countries.
Determinants of the immigration policy mix

Note B: Output of linear regressions (between‐models) for the time period from 1980 to 2010. Separate models for OECD and EU countries. Level of significance:
a< 0.1; *< 0.05; **< 0.01.
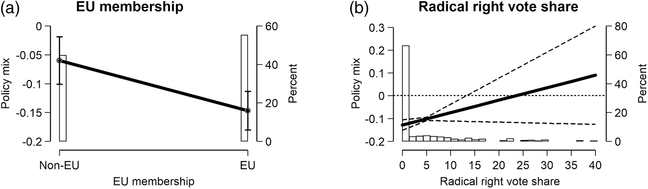
To better grasp the substantive interpretation of these effects, we show the marginal effect plots in Figure 6. Joining the EU more than doubles the asylum‐favourability of a country to a predicted 0.15 points. A change in the vote share of radical‐right parties from zero votes to their conversion into major parties transforms a substantial asylum‐favourability of 0.13 points into a policy mix that favours labour migration over asylum. The larger confidence interval at the higher end of the distribution is the result of the few observations with a high vote share. These predictions show that the effects are of a meaningful size, and that convergence pressures alter the pattern of countries’ immigration policy mixes.
Marginal effects of immigration policy mix determinants.
Note: Marginal effects from model (1) in Table 2a for the impact of the EU membership and radical‐right vote share on the immigration policy mix (95 percent confidence intervals displayed). The histograms display the distribution of the observations (in percent of overall observations).

Overall, the model estimates do not empirically support the idea of path‐dependent ‘national models’ when it comes to the asylum‐labour mix. Neither is the policy mix shaped by government ideology. However, substantial effects are found for external and internal convergence pressures, with Europeanisation leading to more asylum‐favourability and successful anti‐immigration parties leading to more labour‐favourability. This corroborates the evidence in favour of the convergence hypothesis.
We assess the stability of the estimated effects presented in Table 2 with a series of robustness tests using alternative measurements and additional controls (see Tables A2 and A3 in the Online Appendix for the model output). We estimate the within models using an additional time‐trend variable to test whether an association with time drives the effects. Additionally, we estimate models using an index for welfare generosity and net migration as additional controls that reduce the sample size due to missing data. Finally, we replace the vote share of radical‐right parties by their seat share. The coefficients of our independent variables remain substantially the same in these alternative models. The effect of EU membership is robust and only loses its statistical significance in the model without the new EU member states in Eastern Europe. The effect of the strength of the radical‐right is largely similar across the different models and hovers around the level of statistical significance. Second, we test the robustness of the between models. We replace the welfare generosity index with dummies for different welfare regimes. This model also fails to identify a significant difference between institutional contexts. The estimates do not change meaningfully when we include the independent variables from the within models. We conclude that the moderate effects of convergence pressures, as well as the non‐effects of government ideology and path dependence from welfare state regimes, are overall robust.
Conclusion
Liberal democracies face competing political pressures when it comes to immigration policies. The resulting policies are often a complex and incoherent mix of regulations. In this article, we disentangle this complexity and provide the first comprehensive theoretical account and analysis of the immigration policy mix. What explains a country's relative openness to asylum and labour migration? We argue that the concept of the policy mix is more apt for examining the empirical complexity of immigration policies than uniform regime types and that it offers an important complement to studies that focus on the general restrictiveness of immigration policies.
Our empirical analysis demonstrates that OECD countries have largely different immigration policy mixes in place and that these are subject to substantial variation over time. We find a clear convergence trend towards a narrowing of the restrictiveness gap between asylum and labour and towards more liberal admission policies overall. Evidence of both external and internal convergence pressures that shape the immigration policy mix supports this finding. The results do not provide evidence for either path dependence or effects of partisan preferences. Countries do not significantly differ in their immigration policy mix according to their level of welfare generosity and right‐wing and left‐wing governments do not enact significantly different policy mixes.
Nevertheless, our analysis shows that there are partisan differences when it comes to a preferred immigration policy mix. Left‐wing parties tend towards asylum‐favourability and right‐wing parties towards labour‐favourability. However, these partisan differences are minor and do not significantly affect the immigration policy mix. In contrast, the results show that while political parties favoured asylum during the Cold War in the 1980s, they have increasingly favoured labour migration since the 1990s. Although one might expect this to primarily apply to right‐wing parties, we find that, to a similar extent, this is also the case for left‐wing parties. While political preferences have shifted over time, the average immigration policy mix has largely remained stable. While increasing sympathies for migrant workers correspond to more liberal policies on labour migration, asylum policies have become more liberal despite lower sympathies for refugees in the political discourse. In consequence, parties’ policy positions and their resulting policies follow different dynamics. In sum, the immigration policy mix is neither path dependent and following an institutional logic nor shaped by political dynamics of partisan politics. Instead, it can largely be explained by structural constraints that lead to cross‐country convergence.
These findings challenge the common expectation that liberal democracies have become increasingly selective by prioritising economically oriented admissions. Instead, the findings strongly support the idea of the liberal paradox, which suggests that immigration regulations are shaped by competing policy imperatives that are inherent in liberal democracies. The changes in political preferences from 1980 to 2013 reveal a shift towards labour‐favourability, independent of political ideology. This change suggests that the economic imperative of domestic labour shortages and the political imperative of domestic opposition against immigration have affected all political parties. Consequently, we do not find any partisan effects on the immigration policy mix. Moreover, the strong convergence of immigration policy mixes supports the idea that policymakers have increasingly limited room to manoeuvre due to competing pressures. While governments have translated their increasing labour‐favourability into more liberal policies on labour migration, they have not translated their decreasing asylum‐favourability into more restrictive policies on asylum migration. This disconnect suggests that liberal constraints have prevented a restrictive turn in asylum policies. The immigration policy mix is therefore primarily shaped by convergence pressures from the liberal paradox.
All in all, these results demonstrate that the concept of a ‘policy mix’ is more useful than regime types for the study of immigration policies. A ‘policy mix’ concept allows researchers to assess immigration regulations that are not characterised by uniform models explained by historical institutionalism but by a combination of incremental changes within a constrained policy environment. The relative openness of different admission channels constitutes an important characteristic of immigration policies. We recommend that future studies deepen this analysis and use the policy mix concept to expand our current understanding of how countries regulate migration and how different policy subfields jointly shape immigration outcomes.
Acknowledgements
The article has benefited substantially from generous feedback by Tobias Eule, Marc Helbling, Luzia Helfer, Elif Naz Kayran, Lea Portmann and Ulrich Sieberer. We also thank the colloquium participants at the University of Geneva. The two anonymous referees helped with their valuable comments to improve the article.
Open access funding enabled and organized by Projekt DEAL.
Supporting Information
Additional supporting information may be found online in the Supporting Information section at the end of the article:
TABLE A1 Data and operationalisation
TABLE A2 Alternative model specifications (within models)
TABLE A3 Alternative model specifications (between models)
FIGURE A1 Change in the immigration policy mix (1980‐2010)
FIGURE A2 Party sentiments on asylum and labour migration over time
FIGURE A3 Line plot of the immigration policy mix by country over time
FIGURE A4 Scatterplot showing the relative and absolute immigration policy openness
FIGURE A5 Density plot of the immigration policy mix
Policy dataset
Position dataset
Replication code Figures 5, 6, A4 (Stata)
Replication code (R)


 Open access