With the rapid development of urban industrialization, lead contamination has become a significant environmental concern. During the mining and processing of galena, the production and recycling of lead-acid batteries and the smelting and alloy manufacturing of lead, this heavy metal frequently enters aquatic systems through wastewater discharge, including through cleaning and cooling processes. As a result, large volumes of lead-containing wastewater are generated. Lead pollution not only threatens aquatic ecosystems, soil and the broader environment, but also poses severe health risks to humans, affecting the nervous, renal, hematopoietic and reproductive systems (Kumar et al., Reference Kumar, Kumar, Chaturvedi, Shabnam and Subrahmanyam2020; Niu et al., Reference Niu, Bian, Long, Wang, Cao and Luo2021). Therefore, developing effective strategies for the treatment of lead-containing wastewater is of high importance.
Various approaches have been developed for heavy-metal removal, including membrane separation (Abu-Zeid et al., Reference Abu-Zeid, Zhang, Dong, Zhang, Chen and Hou2015; Tan et al., Reference Tan, Ang and Chew2019), electrochemical precipitation (Zhao et al., Reference Zhao, Yu and Chen2016), ion exchange (Hosseini et al., Reference Hosseini, Alibakhshi, Jashni, Parvizian, Shen and Taheri2020), composting and adsorption (Ang & Chew, Reference Ang and Chew2019; Zhu et al., Reference Zhu, Pan, Sun, Liu, Qiu and Ding2021). Among these, adsorption is considered one of the most effective techniques due to its operational simplicity, environmental compatibility, potential for metal recovery and broad applicability (Abedi & Mojiri, Reference Abedi and Mojiri2019; Barakan & Aghazadeh, Reference Barakan and Aghazadeh2021). While activated carbon (Moura et al., Reference Moura, Rios and Galvão2018), resins (Kyzas et al., Reference Kyzas, Kostoglou, Vassiliou and Lazaridis2011; Lou et al., Reference Lou, Fu, Yu, Yuan, Zhao and Wang2022) and alumina (Shin et al., Reference Shin, Choi, Nguyen-Phan, Chung and Kim2008; Pourghahramani & Akhgar, Reference Pourghahramani and Akhgar2015) have been widely studied as adsorbents (Du et al., Reference Du, Zhou, Lin and Bu2022), their high cost, energy-intensive preparation and risk of secondary pollution limit their industrial use (Liu & Yang, Reference Liu and Yang2022). Consequently, natural clay minerals have received increasing attention as cost-effective and environmentally sustainable alternatives (Xu et al., Reference Xu, Qu, Yang, Qu, Shan, Yuan and Sun2022b).
Attapulgite (ATP) is a hydrated magnesium–aluminosilicate clay mineral with a unique one-dimensional fibrous morphology (Xu et al., Reference Xu, Zhang, Wang and Wang2011; Li et al., Reference Li, Ni, Yao and Chen2012; Wang et al., Reference Wang, Zhao, Zhang, Myshkin and Zhang2022b), high thermal stability and resistance to salt and alkalis (Bao et al., Reference Bao, Haiying, Xiangning, Junya, Yao and Shaojiang2020; Muslim et al., Reference Muslim, Al-Nasri, Albayati and Salih2023; Zheng et al., Reference Zheng, Guo, Xu and Zhang2024). Its crystal size ranges from the microscale to the nanoscale, with an average fibrous crystal diameter of 40–50 nm (Wu et al., Reference Wu, Zhu, Zhang, Chen and Frost2011; Li et al., Reference Li, Zhu, Gao, Liu, Wang and Xie2025). Owing to its large surface area, structural stability and low cost, it has been recognized as a promising candidate for heavy-metal removal (Shi & Li, Reference Shi and Li2020; Wang et al., Reference Wang, Zhu, Li, Liu, Fang and Bai2023; Yang et al., Reference Yang, Liu, Ji, Xing and Jiang2023). However, natural ATP often contains carbonate cements that block its pores and reduce the availability of adsorption sites, resulting in poor performance in practical applications (Ma et al., Reference Ma, Ren, Tao, Han, Liao and Zhou2024; Mohamed et al., Reference Mohamed, Ren, Tao and Mala2024). To overcome this limitation, modification is typically required (Ma et al., Reference Ma, Liu and Zhu2012; Guo et al., Reference Guo, He, Sun, Liang, Chen and Liu2019). Previous studies have explored acid (Lai et al., Reference Lai, Li, Liu and Lv2004), salt (Firmin et al., Reference Firmin, Wang and Liang2025) and organic modifications (Deng et al., Reference Deng, Gao, Liu, Hu, Wei and Sun2013), which can indeed improve adsorption efficiency, but these methods suffer from drawbacks such as causing structural damage, producing chemical residues or requiring complex procedures that hinder their scalability.
Thermal treatment (Zhang et al., Reference Zhang, Xiaofeng, Zhaoying, Shaofeng, Liang and Wang2020; Malata & Tkaczewska, Reference Malata and Tkaczewska2023), in contrast, is a simple, low-cost and environmentally benign method that has shown potential for enhancing the adsorption properties of ATP by removing structural impurities and increasing surface reactivity. Chen et al. (Reference Chen, Zhao, Zhong and Jin2011) reported that heat treatment significantly enhances the adsorption properties of ATP. Nevertheless, the relationship between the thermal modification conditions, structural evolution and adsorption mechanism has not been systematically clarified. This knowledge gap has limited the rational design of ATP-based adsorbents for practical wastewater treatment applications.
In this study, natural ATP was thermally modified at various temperatures to optimize its adsorption performance for lead ions. The effects of heat treatment on its structure, surface chemistry and adsorption behaviour were comprehensively investigated, with a particular focus on the mechanism of interaction between the adsorbent and lead species. This work not only provides new insights into how thermal modification influences the adsorption process but also demonstrates a practical and scalable strategy for transforming an abundant natural clay into an efficient material for heavy-metal wastewater treatment.
Materials and methods
Materials and calcination modification of ATP
The ATP used in this study was supplied by a mining company based in Xuyu, Jiangsu Province, China. To prepare the material, a sodium hexametaphosphate solution was added to ATP at a liquid:solid ratio of 10:1. The mixture underwent ultrasonic treatment for 30 min, followed by continuous stirring for 2 h to form a slurry. The slurry was then allowed to settle, and the upper white suspension was collected. Sodium hexametaphosphate acts as an effective dispersing agent, promoting the separation of ATP particles by reducing interparticle attraction and preventing aggregation. This process facilitates the formation of a stable and homogeneous suspension, which enables sedimentation-based selection of finer particles with higher purity and greater surface area for subsequent modification and adsorption experiments. This pretreatment method is commonly used to enhance clay dispersion and improve performance in subsequent applications. This purification process is widely used in low-cost industrial pretreatment with the aim of enhancing particle dispersion and reducing large-sized impurities without affecting the cost-efficiency of ATP. After purification, the upper-layer ATP was filtered, and the resulting solid was dried in an oven at 105°C for 48 h. The dried sample was then ground manually and mechanically to achieve a particle size of less than 45 µm. The primary chemical composition of the prepared ATP is presented in Table 1, with SiO2, Al2O3, CaO and MgO contents of 57.47%, 20.28%, 1.21% and 12.13%, respectively. Lead nitrate (Pb (NO3)2) was obtained from Macklin Chemical Reagents Co., Ltd. The purified ATP was subsequently calcined in a muffle furnace at 300℃, 400℃, 500℃ and 600℃ for 2 h. After cooling to room temperature, the calcined samples were labelled as CATP-n (n = 1, 2, 3 or 4).
Table 1. The main chemical composition of ATP.

Experiments regarding adsorption performance
The amount of Pb(II) adsorbed by the adsorbent for Pb2+ heavy-metal ions was determined. Typically, 0.50 g of CATP-n was added to 100 mL of Pb2+ solution with an initial concentration of 200 mg L–1. The mixture was stirred using an oscillator and at specific time intervals the clarified solution was filtered through a needle filter. The residual Pb2⁺ concentration in the supernatant was then analysed using an inductively coupled plasma emission spectrometer (ICP-OES). All adsorption experiments were repeated three times, and the data shown represent mean values. The amount of Pb(II) adsorbed by CATP-n was calculated using Equation 1 (Zhu et al., Reference Zhu, Shang, Jing, Liu, Liu and El-Toni2016; Shen et al., Reference Shen, Qi, Hong, Wang, Han and Chen2025):
 \begin{equation}{Q_t} = \frac{{\left( {{C_0} - {C_t}} \right) \cdot V}}{m}\end{equation}
where Qt represents the amount of Pb(II) adsorbed at time t, C 0 and Ct (mg L–1) denote the initial and time-dependent Pb2+ concentrations, respectively, V (L) is the solution volume and m (g) is the mass of the adsorbent.
To evaluate the adsorption kinetics, CATP-2 was added to the Pb2+ solution, and the pH was adjusted accordingly. The sample was then placed in an oscillator at room temperature (25℃) and agitated for 24 h. The pH of the solution was adjusted to 5. The pH adjustment was carried out to prevent Pb2+ precipitation and to optimize the adsorption process, as pH affects both the speciation of metal ions in solution and the surface charge of the adsorbent, thereby influencing the adsorption efficiency. The amount of Pb(II) adsorbed of CATP-2 was calculated using Equation 1. Additionally, to investigate the adsorption kinetics of Pb2+ onto CATP, CATP-2 was tested at various adsorption times. The experimental data were fitted to pseudo-first-order and pseudo-second-order kinetic models using Equations 2 & 3 (Gu et al., Reference Gu, Sun, Han, Cui and Wang2018; Ren et al., Reference Ren, Zhao, Fu, Zhou, Wang and Fu2025):
 \begin{equation}{Q_t} = {Q_{\text{e}}}\left[ {1 - {\text{exp}}\left( { - {{\text{K}}_1}t} \right)} \right]\end{equation}
 \begin{equation}{Q_t} = \frac{{Q_{\text{e}}^2{{\text{K}}_2}t}}{{1 + {{\text{K}}_2}{Q_{\text{e}}}t}}\end{equation}
where Q e (mg g–1) represents the equilibrium amount of Pb(II) adsorbed and K1 and K2 (min–1) are the rate constants for the pseudo-first-order and pseudo-second-order kinetic models, respectively.
The in-particle diffusion model and liquid film diffusion model were further used to analyse the Pb2+ adsorption process as per Equations 4 & 5 (Zarghami et al., Reference Zarghami, Akbari, Latifi and Amani2016):
 \begin{equation}{Q_t} = {{\text{K}}_{{\text{dif}}}}{t^{1/2}} + {\text{C}}\end{equation}
 \begin{equation}\ln \left( {1 - \frac{{{Q_t}}}{{{Q_{\text{e}}}}}} \right) = - {{\text{K}}_{\text{F}}}t + {\text{A}}\end{equation}
where Kdif (mg g–1 min–1/2) and KF (min–1) are the rate constants of the in-particle diffusion and liquid film diffusion model, respectively, C is the boundary layer thickness constant and A is the diffusion constant of the liquid film.
To further analyse adsorption behaviour, the adsorption isotherm of Pb2+ was studied using the Langmuir and Freundlich models, which are commonly applied to describe monolayer adsorption, multilayer ion adsorption and adsorbate–adsorbent interactions. The corresponding equations are given in Equations 6 & 7 (Li et al., Reference Li, Guo, Wang, Deng, Lei, Yu and Liu2024; Bao et al., Reference Bao, Wang, Li, Li, Sun and Wang2025):
 \begin{equation}\frac{{{C_{\text{e}}}}}{{{Q_{\text{e}}}}} = \frac{{{C_{\text{e}}}}}{{{Q_{\text{m}}}}} + \frac{1}{{{{\text{K}}_{\text{L}}}{Q_{\text{m}}}}}\end{equation}
 \begin{equation}\log {Q_{\text{e}}} = \frac{1}{n}\log {C_{\text{e}}} + \log {{\text{K}}_{\text{F}}}\end{equation}
where C e (mg L–1) is the equilibrium Pb2+ concentration, Q m (mg g–1) is the maximum amount of Pb(II) adsorbed, n is the adsorption intensity and KL and KF (L mg–1) are the Langmuir and Freundlich adsorption constants, respectively.
Thermodynamic analyses were conducted to assess the spontaneity and feasibility of Pb2+ adsorption onto CATP-2. The relevant thermodynamic equations are presented in Equations 8–10 (Sun et al., Reference Sun, Li, Huang, Luo, Tao and Yu2023; Liu et al., Reference Liu, Zhang, Liu, Zheng, Liu and Zhong2025):
 \begin{equation}\ln {{\text{K}}^0} = \frac{{\Delta {{\text{S}}^0}}}{{\text{R}}} - \frac{{\Delta {{\text{H}}^0}}}{R}\left( {\frac{1}{T}} \right)\end{equation}
 \begin{equation}\Delta {G^0} = \Delta {H^0} - T\Delta {S^0}\end{equation}
 \begin{equation}\ln {{\text{K}}_2} = \ln {\text{A}} - \frac{{{E_{\text{a}}}}}{{RT}}\end{equation}
where K0 is the dimensionless thermodynamic equilibrium constant obtained from the transformation of KL (L mg–1), ΔS 0 (L mg–1) represents the entropy change, ΔH 0 (kJ mol−1) is the enthalpy change and ΔG 0 (kJ mol−1) is the Gibbs free energy change, K2 is the reaction rate constant, T is the absolute temperature and Ea is the activation energy.
Measurement and analysis
The phase composition of the samples was examined using X-ray diffraction (XRD). Prior to analysis, the samples were ground to a particle size of ≤45 μm and scanned over a range of 5°–90°2θ at a scanning speed of 5° s–1 (Yue et al., Reference Yue, Chen, Bai, Wang, Yang and Wen2025). The chemical bonds and functional groups of ATP before and after Pb2+ adsorption were characterized using Fourier-transform infrared (FTIR) spectroscopy (Yang et al., Reference Yang, Zhang, Lu, Tang, Yang and Shi2025). The spectral range was set between 400 and 4000 cm–1. To investigate changes in surface valence states before and after Pb2+ adsorption, X-ray photoelectron spectroscopy (XPS) was conducted. The energy scanning range was 0–5000 eV, allowing for detailed analysis of surface chemical states and elemental composition.
Results and discussion
Adsorption performance evaluation
Effects of calcination temperature
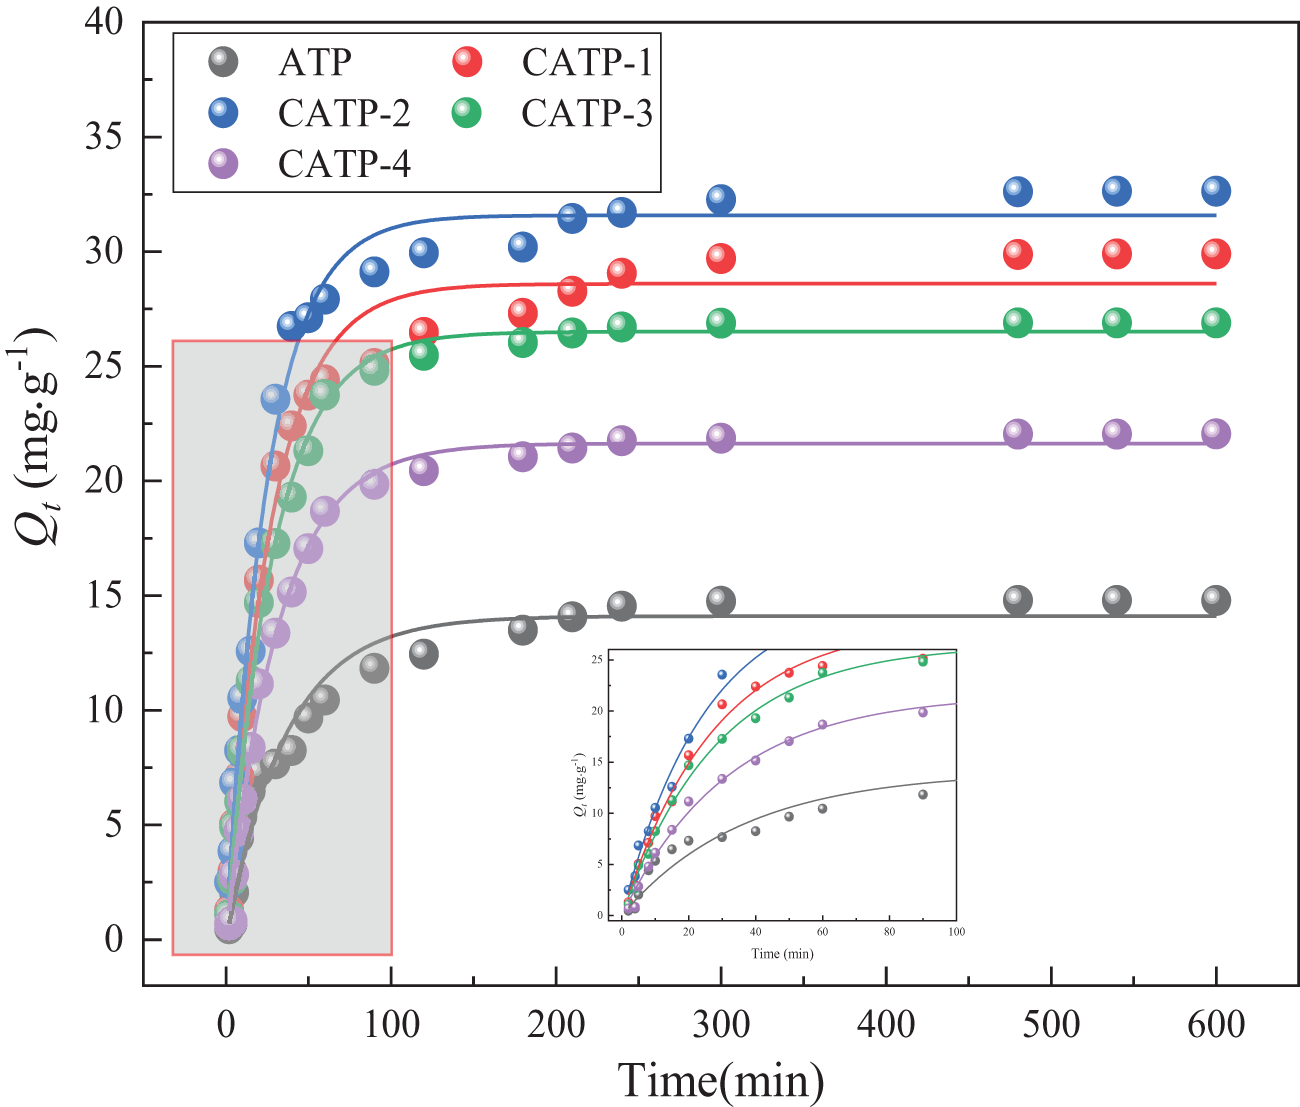
Figure 1 illustrates the amount of Pb(II) adsorbed by heat-treated ATP (CATP) at different adsorption time. The initial pH of all adsorption experiments related to calcination temperature and contact time was adjusted to 5.0 to maintain consistent experimental conditions. The amount of Pb(II) adsorbed by all samples increased over time and eventually reached equilibrium. In the initial stage, adsorption occurred rapidly due to the abundance of available adsorption sites and the high diffusion rate. However, as the process progressed, the adsorption ratio gradually decreased until saturation was achieved. The amount of Pb(II) adsorbed by untreated ATP was 14.79 mg g–1. With increasing calcination temperature, the adsorption performance initially improved but subsequently declined. The greatest amount of Pb(II) adsorbed (32.63 mg g–1) was observed at a calcination temperature of 400°C. Beyond this temperature, structural damage to the pore network of ATP led to a reduction in adsorption efficiency. Based on these results, CATP-2 exhibited the optimal adsorption performance in this study. As adsorption time progresses, the adsorption amounts of ATP and CATP-2 gradually increase, eventually reaching equilibrium. The maximum amount of Pb(II) adsorbed by untreated ATP was 14.79 mg g–1, whereas the maximum amount of Pb(II) adsorbed by CATP-2 was 32.63 mg g–1. Notably, the amount of Pb(II) adsorbed by CATP-2 after heat treatment is 2.21 times that of ATP. In addition to calcination temperature, contact time significantly influenced Pb(II) adsorption behaviour, as illustrated in Fig. 1. For all samples, the amount of Pb(II) adsorbed increased rapidly during the initial 200 min, followed by a plateau phase, indicating equilibrium had been achieved. The optimal contact time was determined to be ∼200 min, beyond which no substantial increase in adsorption was observed. This suggests that the active adsorption sites became saturated within this period.

Figure 1. The amount of Pb(II) adsorbed by CATP-n (n = 1, 2, 3, 4) at various adsorption times (adsorption conditions: C 0 = 200 mg L–1, T = 30℃).
Effects of adsorption conditions
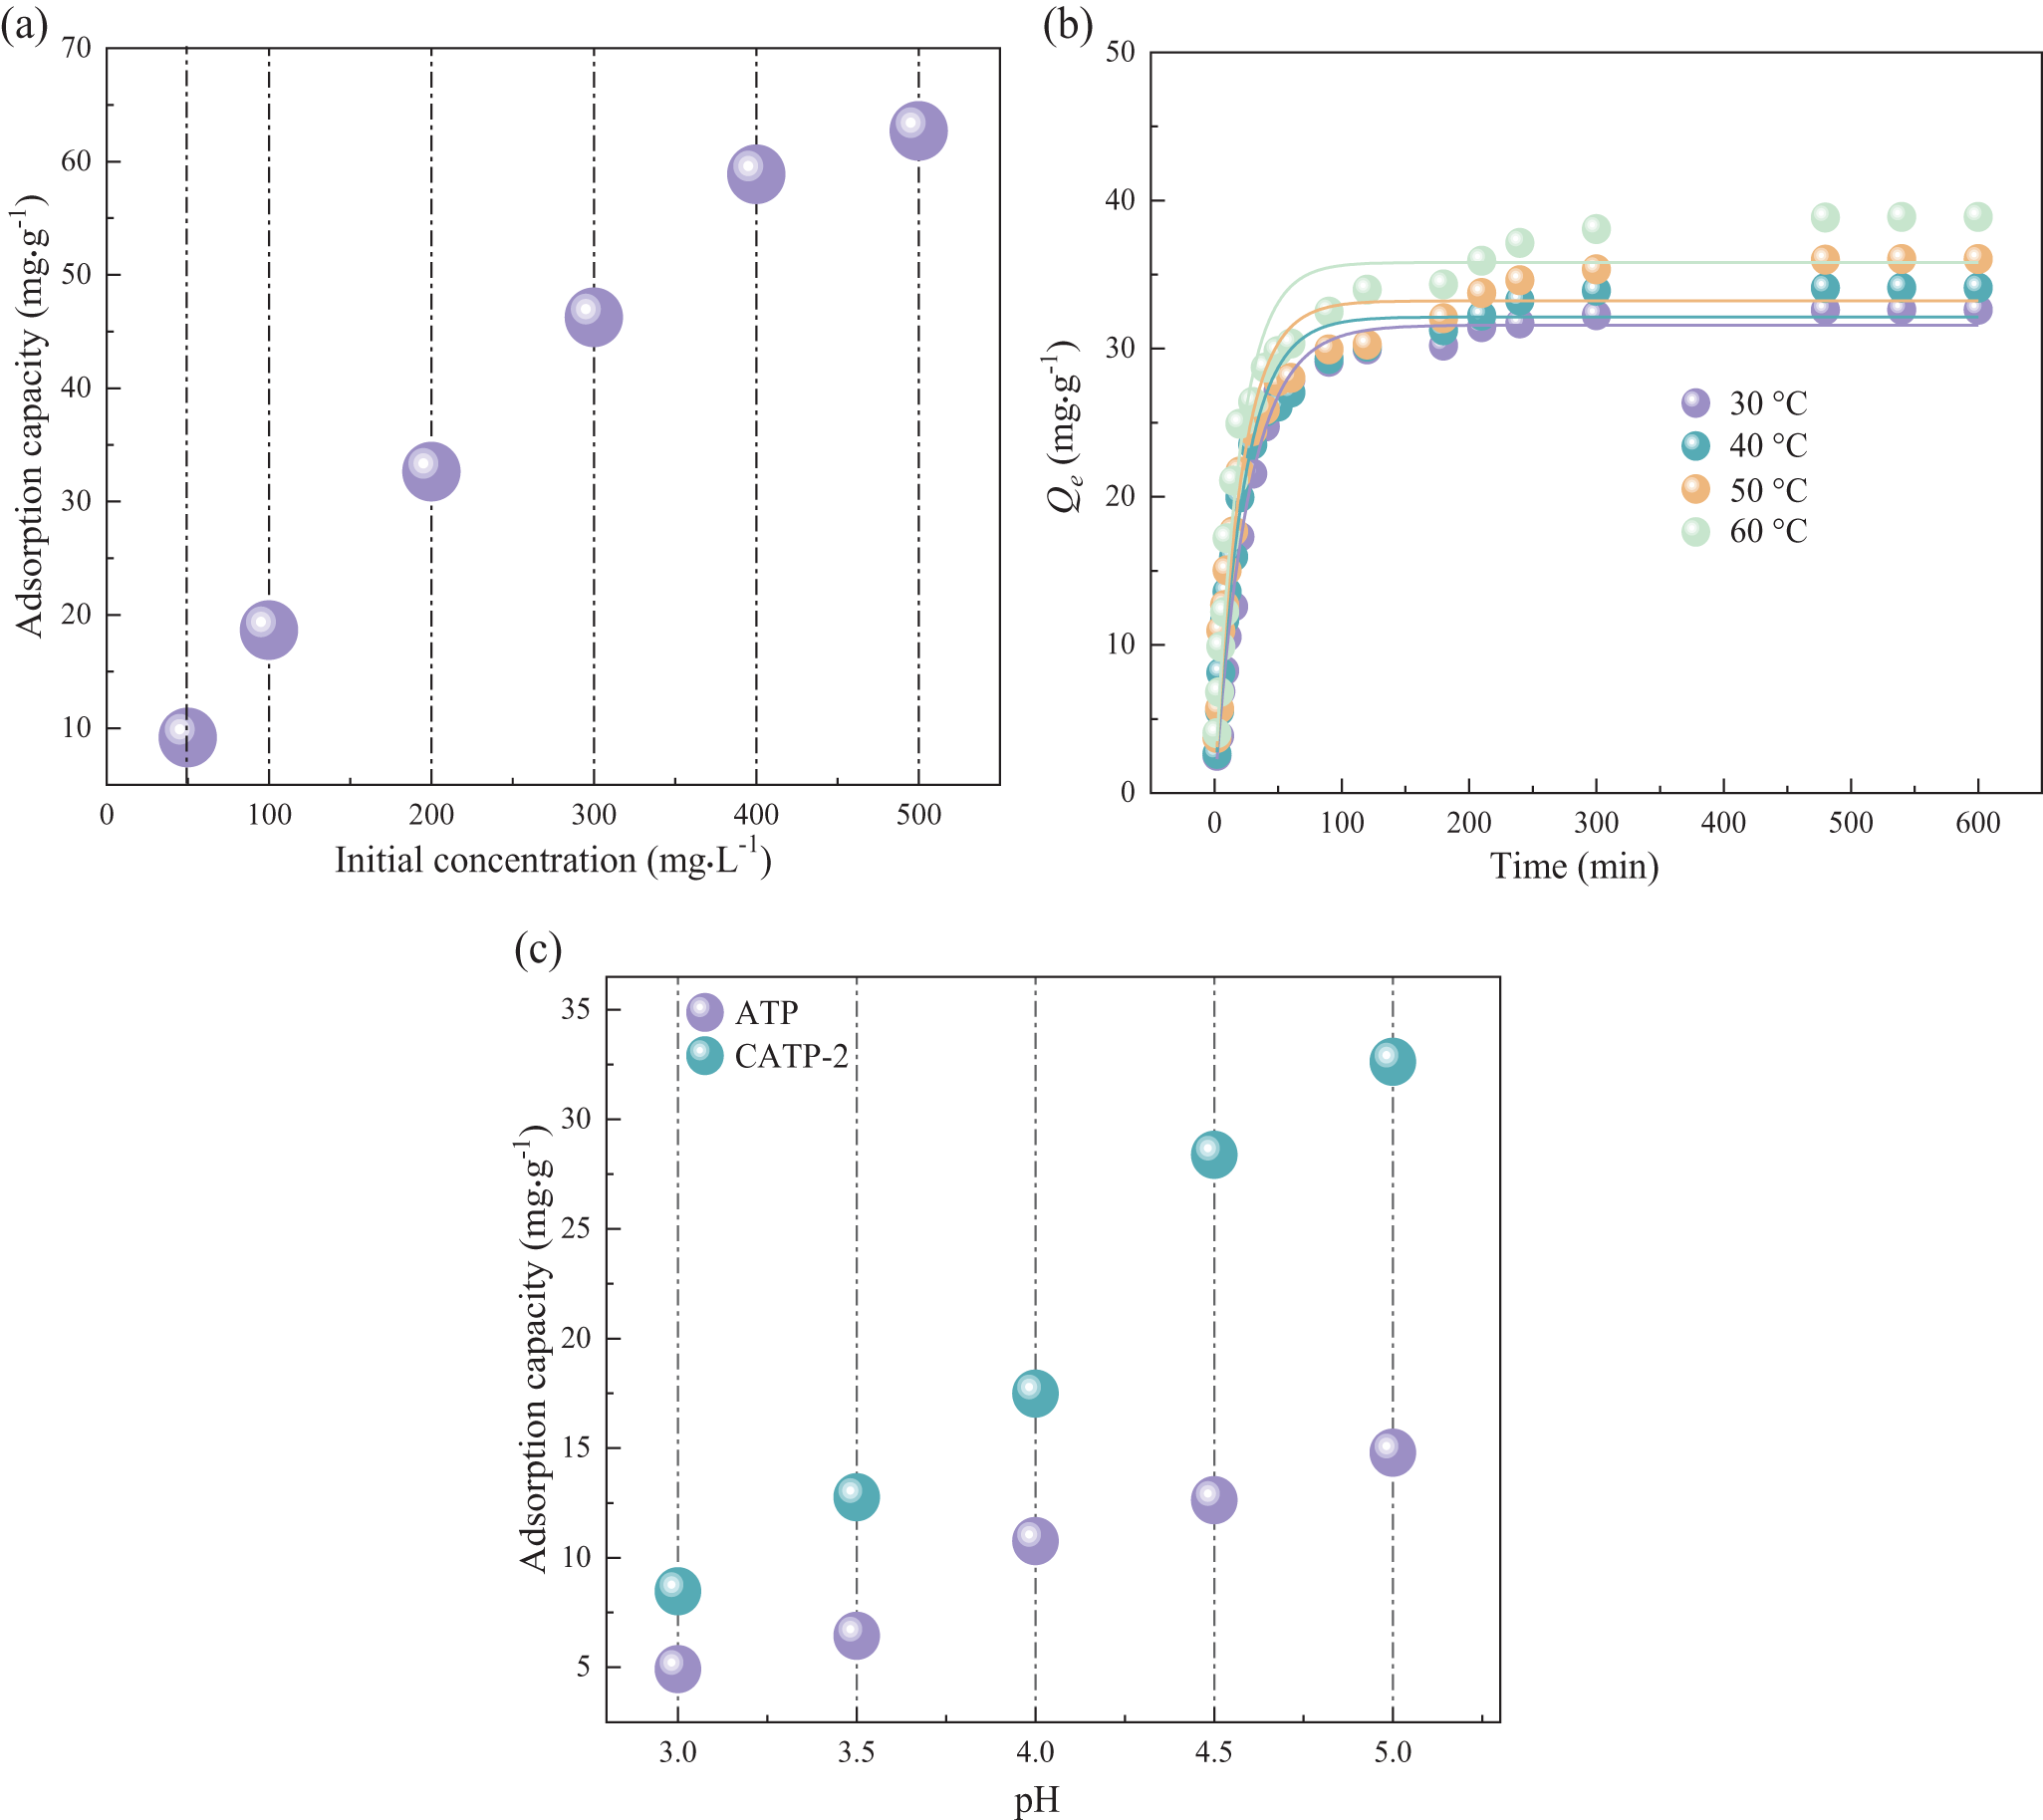
The adsorption properties of the materials vary significantly under different external conditions. In this study, the effects of various species on the control variables were examined. Figure 2a illustrates the adsorption capacity of CATP-2 at varying initial Pb2+ concentrations ranging from 50 to 500mg L–1. The adsorption capacity increases with increasing concentration, as more Pb2+ ions are available for interaction with active adsorption sites. Beyond 400 mg L–1, the increase in adsorption capacity becomes less pronounced, indicating the potential approach to saturation. Although data beyond 500 mg L–1 were not included in this study due to solubility and precipitation constraints, future studies will explore higher concentration ranges to confirm the plateau behaviour more definitively. Figure 2b shows the adsorption capacity of CATP-2 at various temperatures. Within the experimental range, the adsorption capacity increases with temperature, which may be attributed to the acceleration of diffusion within the adsorbent material at higher temperatures, suggesting that the adsorption process is endothermic. Figure 2c demonstrates the effects of varying pH levels on the adsorption capacity. The pH value of the solution significantly influences the adsorption of lead ions. Both the speciation of lead ions in solution and the surface charge of the adsorbent are affected by pH. It is well known that Pb(II) ions tend to form insoluble hydroxide species such as Pb(OH)2 when the solution pH exceeds 6.0, which may interfere with the interpretation of adsorption data. Therefore, in this study, the pH range was limited to 3–5 in order to ensure the accuracy of adsorption measurements and to eliminate the influence of precipitation. At lower pH values, the adsorption of lead ions is minimal, but the adsorption increases with increasing pH. In strongly acidic conditions, the adsorption ratio of ATP to Pb2+ both before and after heat treatment is very low, primarily because the hydration energy of H⁺ is lower than that of Pb2+. The adsorption capacity of CATP-2 increased significantly from pH 2 to 5, after which it stabilized. This behaviour can be attributed to the variation in surface charge of the adsorbent and the speciation of Pb2+ in solution. At lower pH values, a high proton concentration competes with Pb2+ for active sites, whereas at higher pH values, electrostatic attraction between negatively charged adsorbent surfaces and positively charged Pb2+ improves adsorption efficiency. Although a detailed comparison with commercial adsorbents is beyond the scope of this study, the observed adsorption capacity of CATP-2 suggests its promising performance in water treatment applications.

Figure 2. Influence of various adsorption conditions: (a) initial Pb2+ concentration; (b) temperature; and (c) pH.
Adsorption kinetics
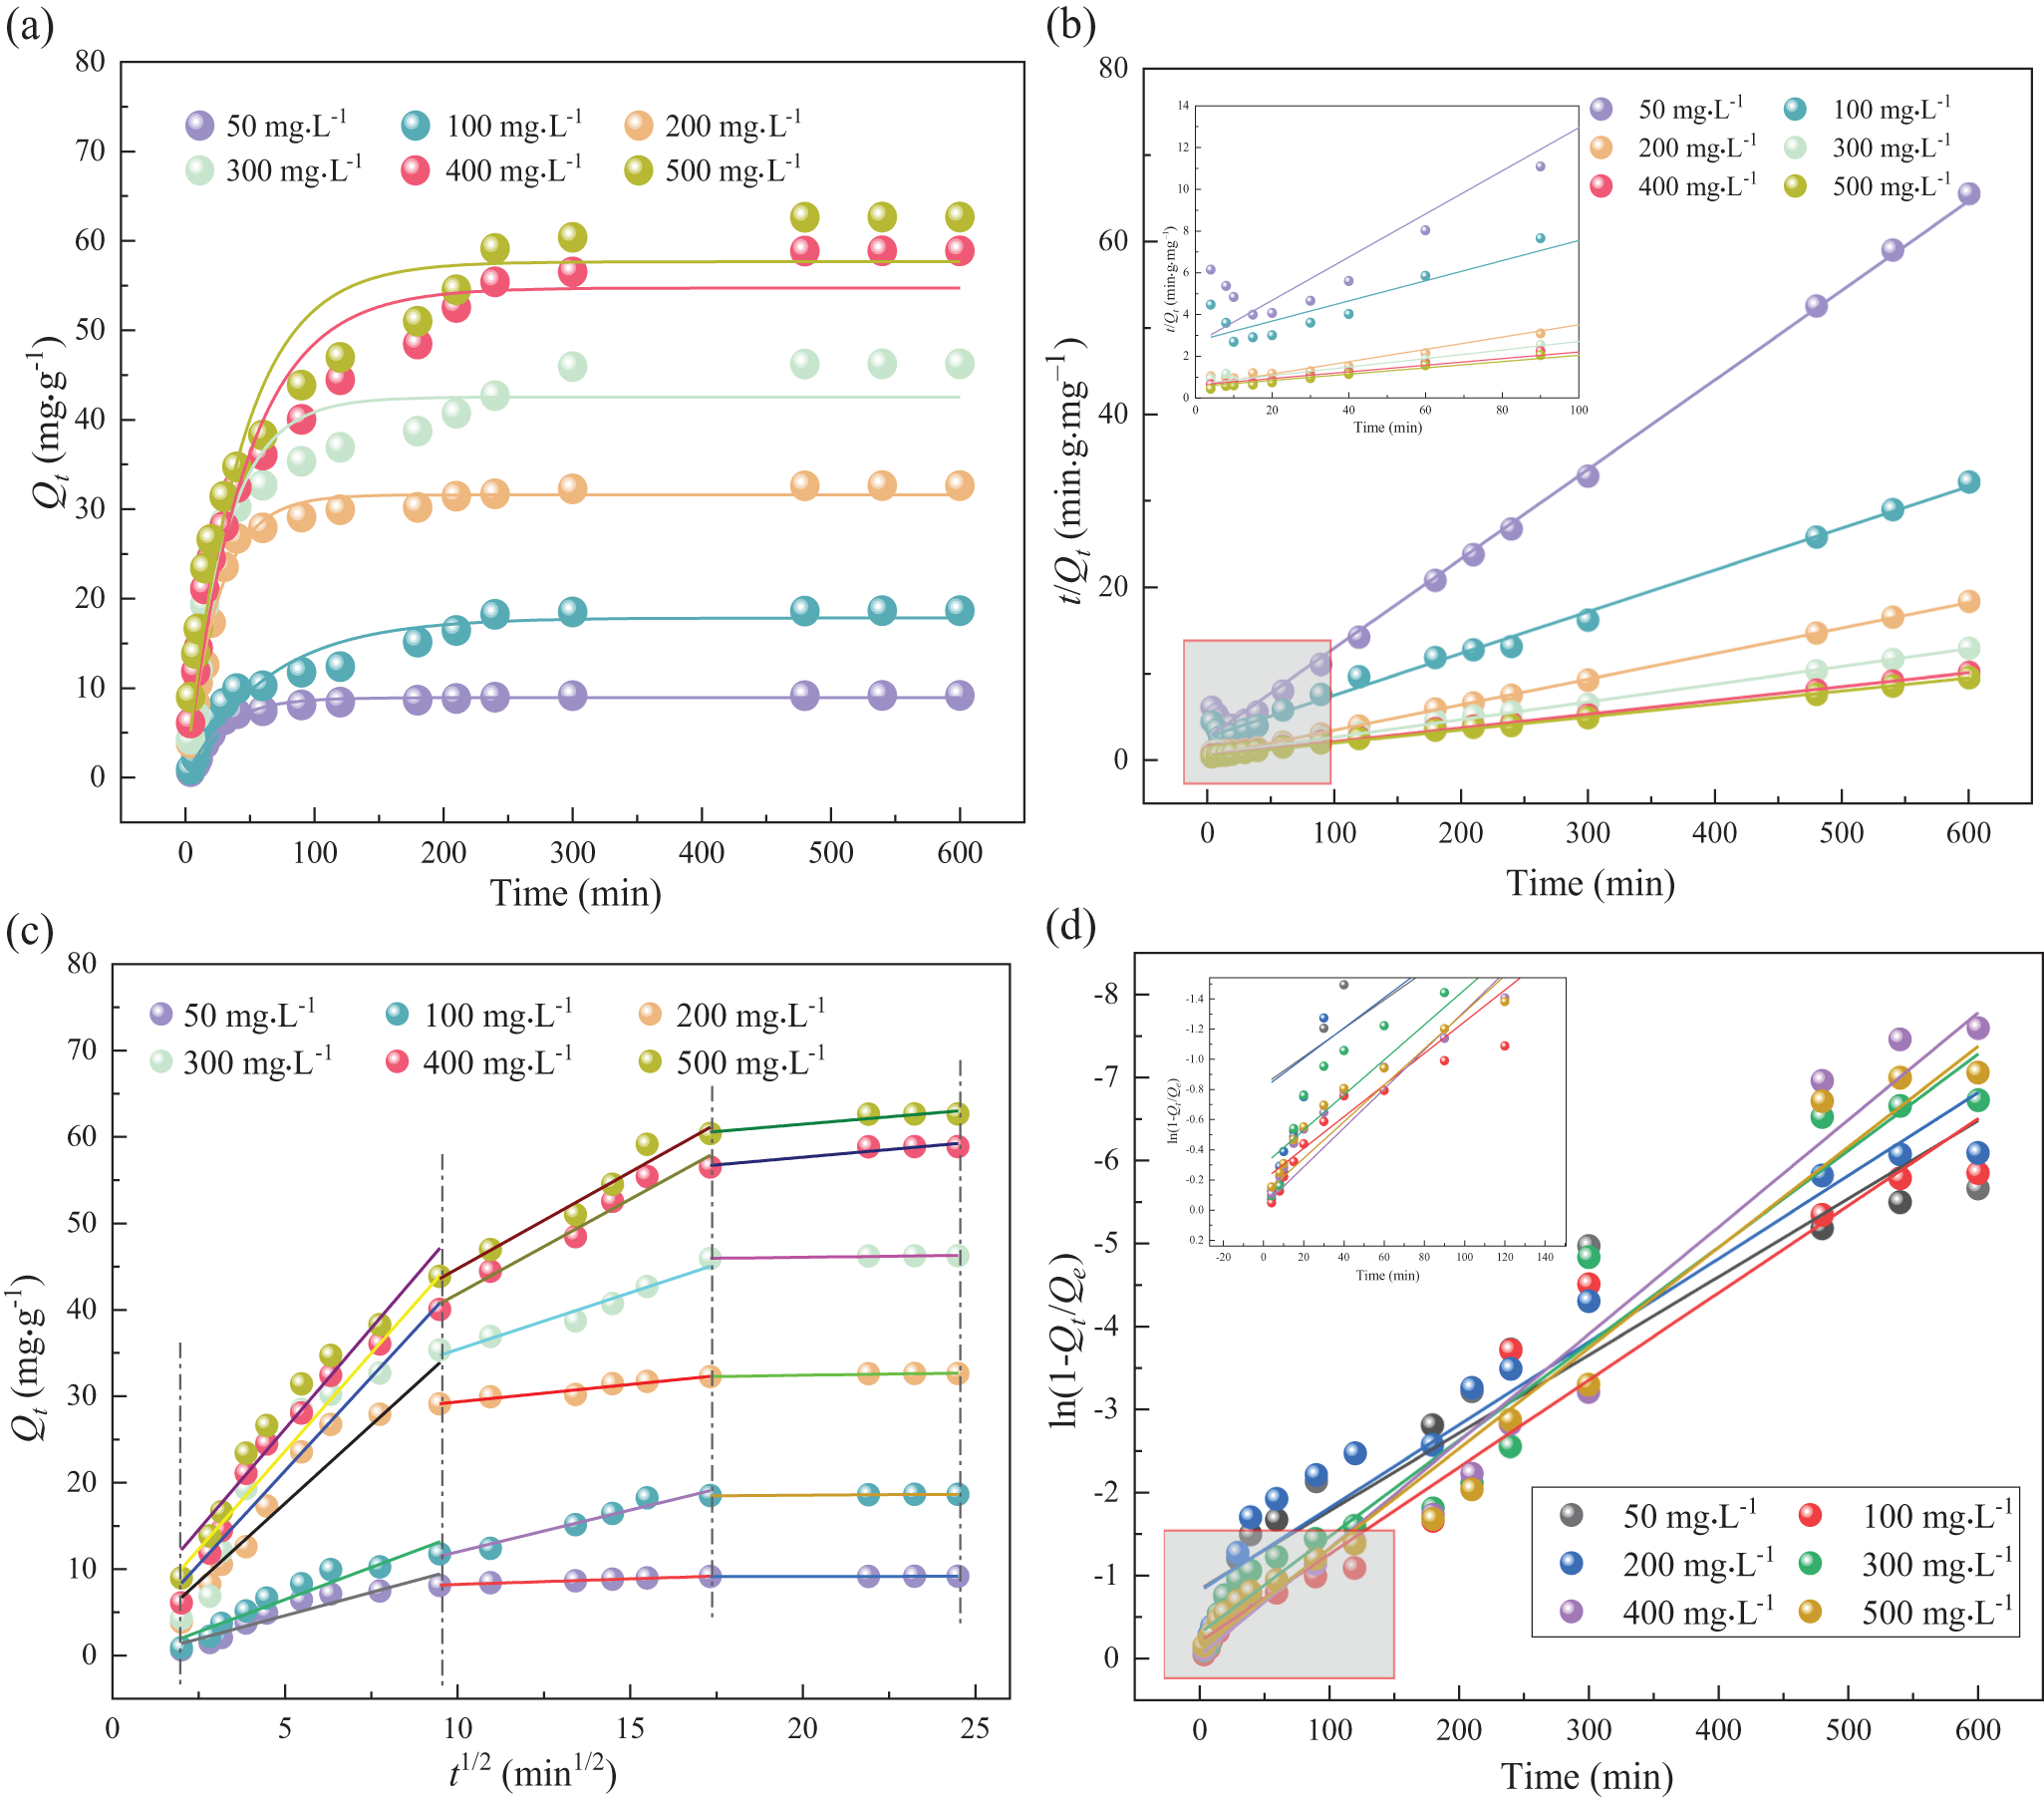
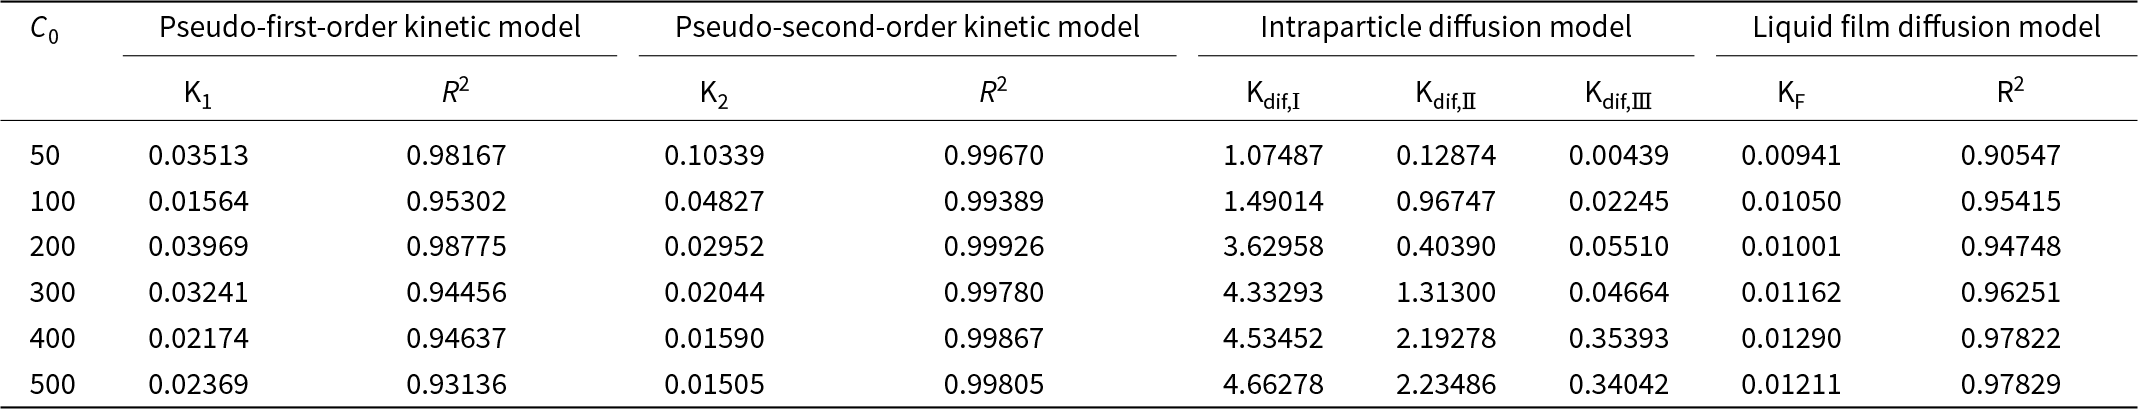
Studies on adsorption kinetics provide valuable insights into adsorption ratios, the effectiveness of adsorbents and underlying mass transfer mechanisms (Wang & Guo, Reference Wang and Guo2020). Based on extensive research, the interactions between adsorbents and adsorbates are generally classified into pseudo-first-order or pseudo-second-order kinetic models (Sen Gupta & Bhattacharyya, Reference Sen Gupta and Bhattacharyya2011). The changes in the amount of Pb(II) adsorbed by CATP-2 over time at initial Pb2+ concentrations (C 0) of 50, 100, 200, 300, 400 and 500 mg L–1 were fitted using both pseudo-first-order and pseudo-second-order kinetics, as shown in Fig. 3a,b. The corresponding kinetic fitting parameters are provided in Table 2. At varying Pb2+ concentrations, the R 2 values of the regression curves obtained using the pseudo-second-order kinetic model were 0.9967, 0.9938, 0.9993, 0.9978, 0.9987 and 0.9981, respectively. These values are higher than those obtained using the pseudo-first-order kinetic model, indicating that Pb2⁺ adsorption is primarily governed by chemisorption (Chang et al., Reference Chang, Chao, Pang, Li, Lu and He2018). The fitting results of the particle internal diffusion and liquid film diffusion models are shown in Fig. 4. The fitting result of the liquid film diffusion model is better, indicating that the transport of Pb2+ from the aqueous solution through the liquid film to the adsorbent surface is the main control step, which affects the adsorption rate. Moreover, the fitting results of the diffusion model do not pass through the origin, suggesting that the step controlling the adsorption rate is not merely the liquid film diffusion. The adsorption rate is also affected by surface diffusion. The adsorption process is quite complex, and a single internal diffusion process is not the only control step for the adsorption rate.

Figure 3. Kinetic curves of CATP-2 under various initial lead concentrations (C 0 = 50, 100, 200, 300, 400 and 500 mg L–1): (a) pseudo-first order kinetic mo (b) pseudo-second-order kinetic mo (c) intraparticle diffusion mo and (d) liquid film diffusion model.

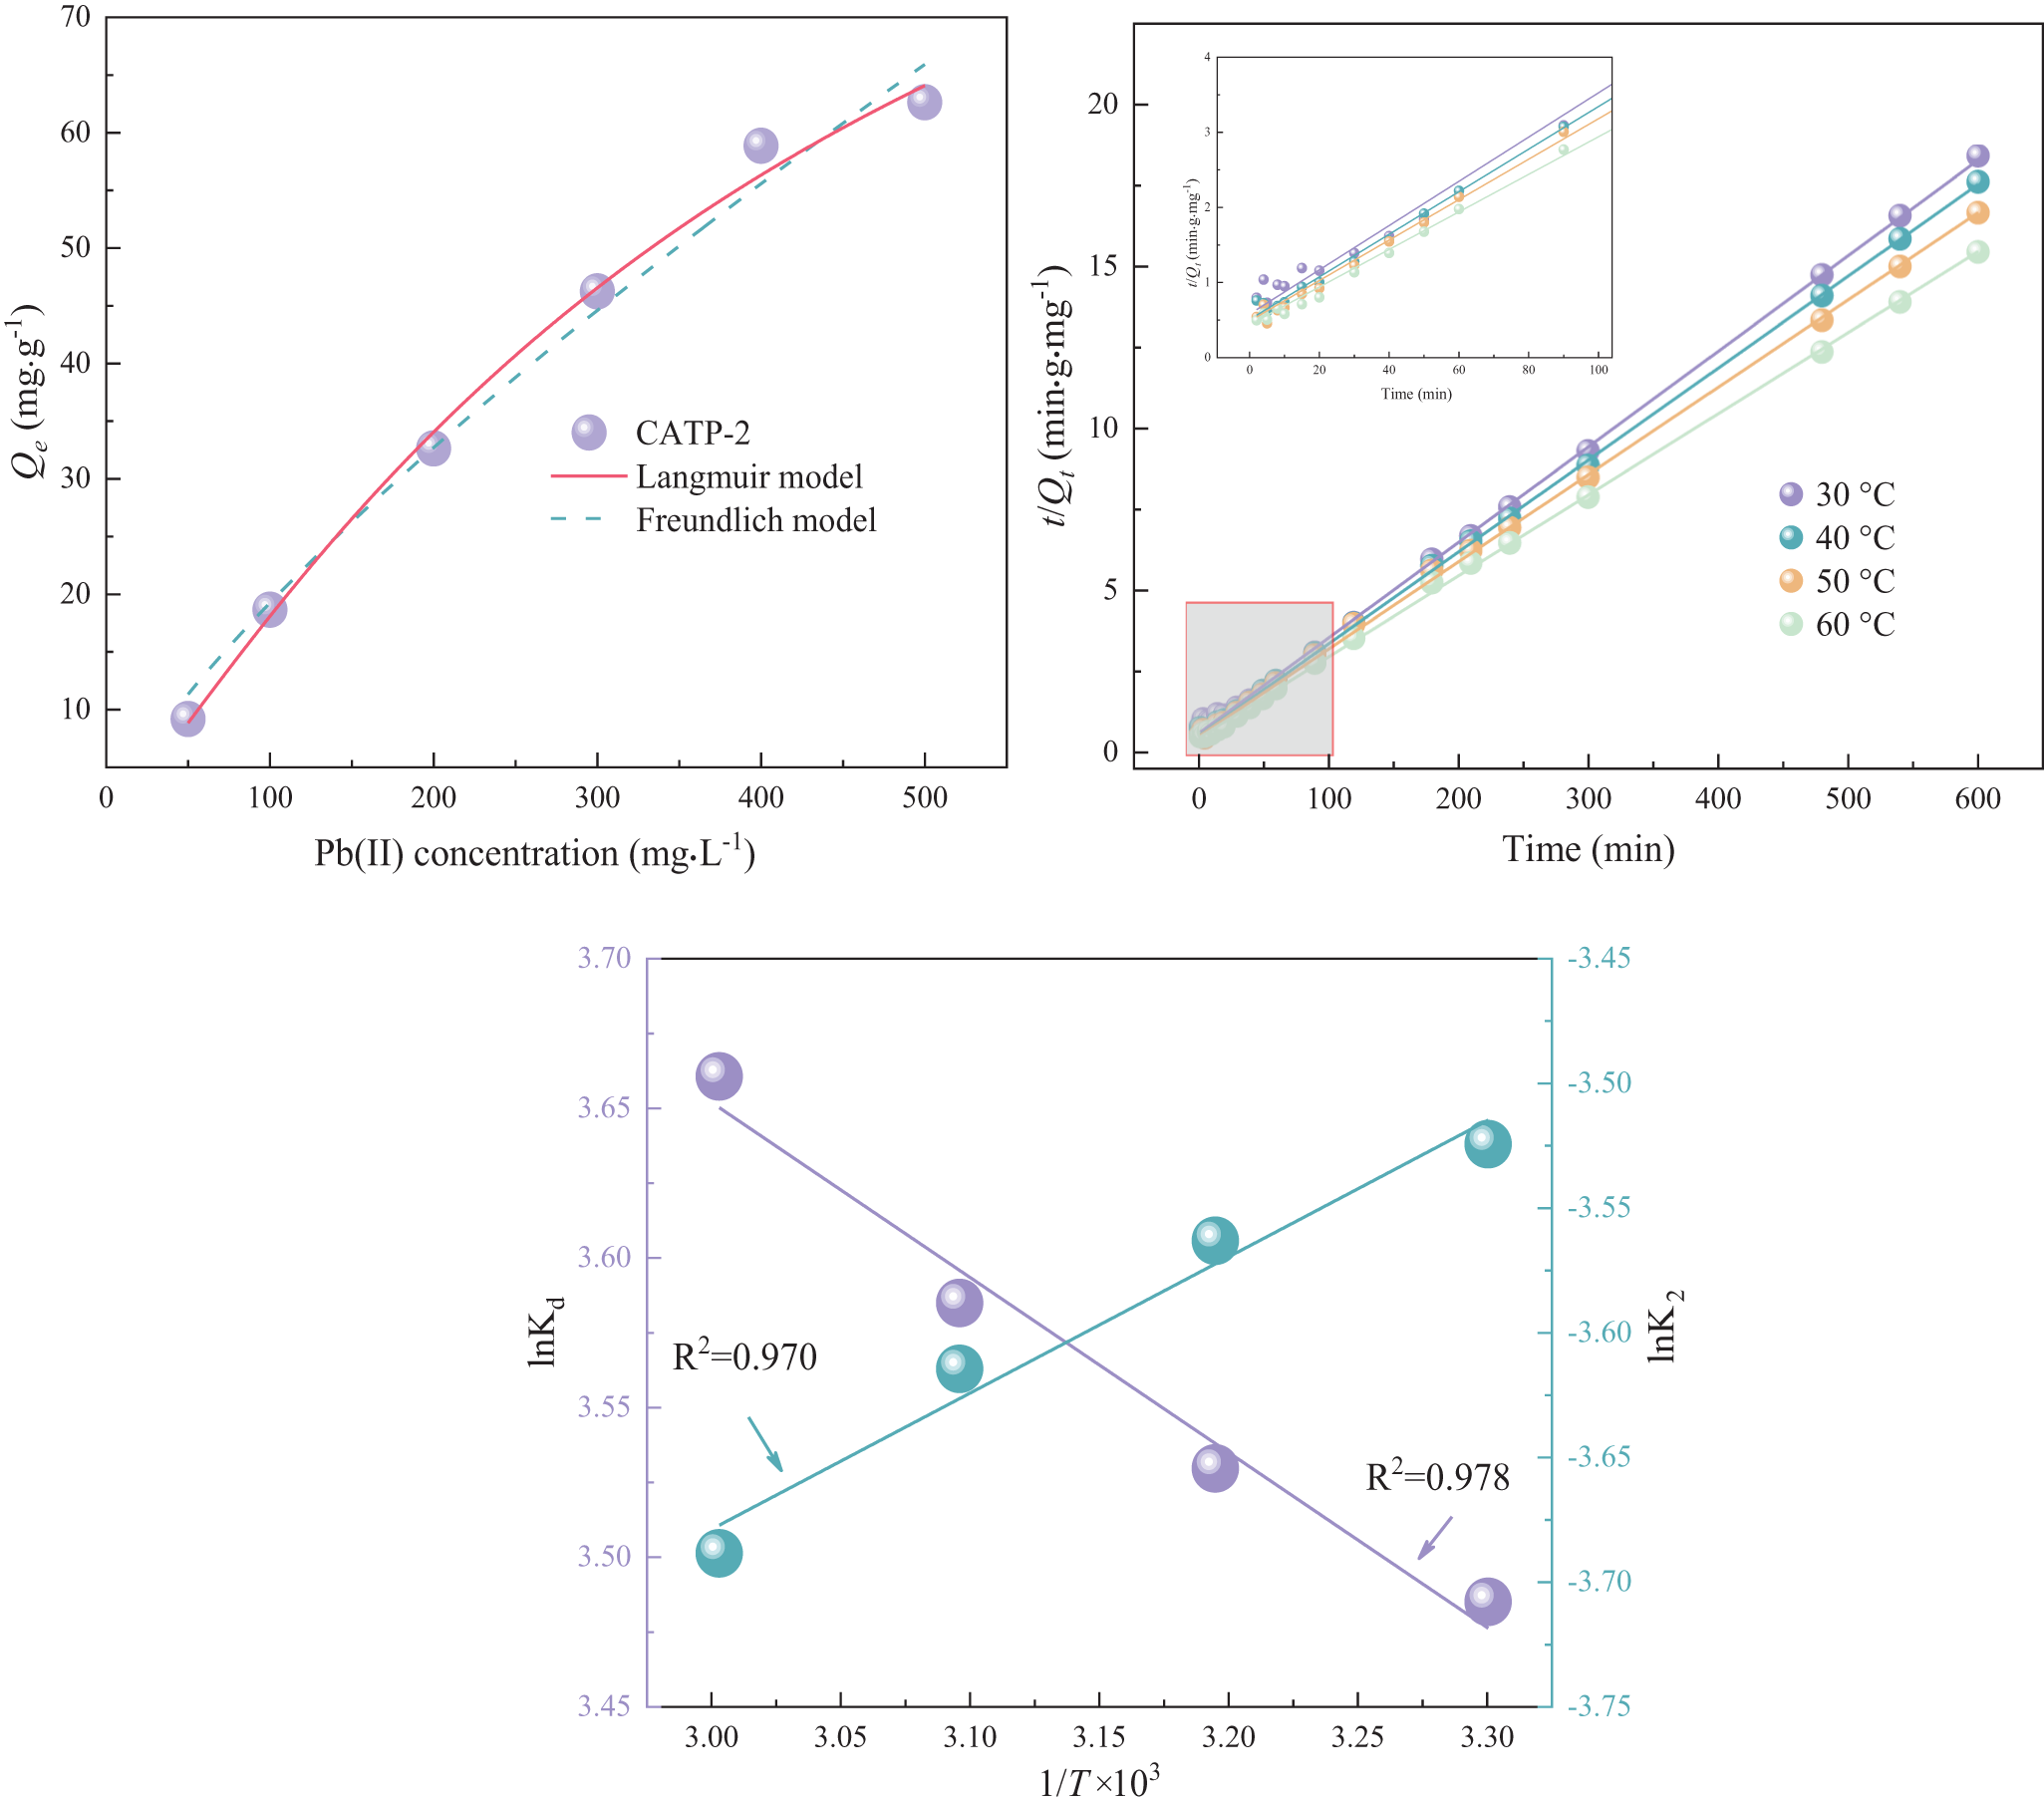
Figure 4. The fitting curves of (a) adsorption isotherms, (b) thermodynamics and (c) the thermodynamic parameters of lnK0 and 1/T at different temperatures of Pb2+ adsorption.
Table 2. The kinetic parameters of CATP-2.

Adsorption isotherms and thermodynamic analysis
To study the interaction between the adsorbent and adsorbate and to analyse the amount of Pb(II) adsorbed by the material, Langmuir and Freundlich adsorption isotherms were used to fit the experimental adsorption data under various initial concentrations, as shown in Fig. 4. The corresponding adsorption isotherm parameters obtained from the Langmuir and Freundlich models are summarized in Table 3. The Langmuir model (R 2 = 0.995) is more suitable for describing the adsorption behaviour of CATP-2 compared to the Freundlich model (R 2 = 0.987; Liu et al., Reference Liu, Wu, Qin and Yang2022). The Langmuir model aligns more closely with the measured values and demonstrates higher fitting reliability. According to the Langmuir model, molecules adsorb onto a homogeneous solid surface without interacting with one another, reaching equilibrium in a monolayer (Liu et al., Reference Liu, Lv, Meng, Yu and Wang2013). The adsorption process of CATP-2 is more consistent with monolayer adsorption. The maximum amount of Pb(II) adsorbed as predicted by the Langmuir model is 120.149 mg g–1, which slightly exceeds the highest experimental value obtained. This deviation is attributed to the idealized assumptions of the Langmuir model, such as surface homogeneity and monolayer coverage under full equilibrium. In practice, factors such as mass transfer resistance, partial site accessibility and surface heterogeneity may lead to lower observed adsorption capacities. Nevertheless, the strong agreement between the experimental data and the fitted curve validates the applicability of the Langmuir model to describe the Pb(II) adsorption behaviour of CATP-2.
Table 3. The adsorption isotherm parameters of CATP-2.

To examine the effects of reaction temperature on the adsorption process, the thermodynamic equation was fitted to the experimental data. These experiments were conducted at temperatures of 30℃, 40℃, 50℃ and 60℃. Thermodynamic parameters, including Gibbs free energy (ΔG 0), enthalpy change (ΔH 0) and entropy change (ΔS 0), were used to analyse this effect. The fitting curves for the thermodynamic parameters (lnK0 vs 1/T) at various temperatures are shown in Fig. 4, with the corresponding values for ΔH 0, ΔS 0 and ΔG 0 listed in Table 4. The enthalpy change (ΔH 0) indicates whether the adsorption process is endothermic or exothermic, whereas the Gibbs free energy (ΔG 0) determines whether the process is spontaneous or non-spontaneous. The entropy change (ΔS 0) reflects the increase in disorder during the adsorption process (Malefane et al., Reference Malefane, Feleni, Mafa and Kuvarega2020). The ΔH 0 of CATP-2’s adsorption of Pb2+ is 4.87 kJ mol–1, suggesting that the process is endothermic and that increasing the temperature enhances adsorption (Ren et al., Reference Ren, Wang, Li, Wang, Wang and Gao2022). The positive ΔS 0 value of 44.95 J mol–1 K–1 indicates an increase in the disorder and irregularity at the solid–liquid interface following adsorption. The ΔG 0 values at these temperatures are –8.75, –9.20, –9.65 and –10.10 kJ mol–1, respectively. These values decrease with increasing adsorption temperature, indicating that the ion exchange in CATP-2 is a spontaneous process (Dash et al., Reference Dash, Dash and Rath2020).
Table 4. The thermodynamic parameters of the sample.

The maximum Pb2+ adsorption capacity of CATP-2 (120.149 mg g–1) is higher than those reported for natural bentonite (45–80 mg g–1; Sarı & Tuzen, Reference Sarı and Tuzen2009) and ATP composites (109.9 mg g–1; Jin et al., Reference Jin, Yu, Li, Qi, Yang, Zhao and Hu2011) and comparable to some chemically modified clays (110–130 mg g–1; Uddin, Reference Uddin2017). Furthermore, the thermodynamic parameters (ΔH 0 = 4.87 kJ mol–1, ΔS 0 = 44.95 J mol–1 K–1) indicate an endothermic and spontaneous process, which are consistent with the trends observed for heavy-metal adsorption on natural clays, but with greater spontaneity than unmodified adsorbents (Babel & Kurniawan, Reference Babel and Kurniawan2003; Ayawei et al., Reference Ayawei, Ebelegi and Wankasi2017). These results confirm that CATP-2 not only exhibits a competitive adsorption capacity but also provides thermodynamic advantages, thereby underscoring its utility.
Characterization of materials
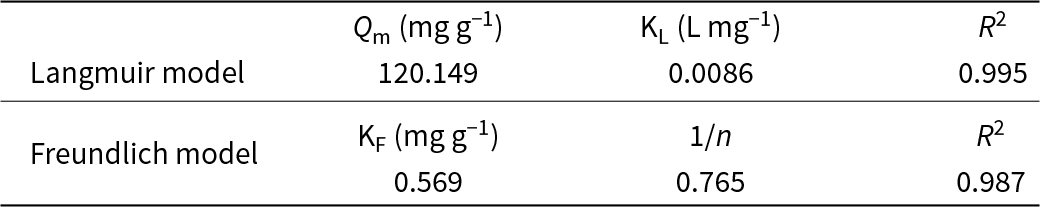
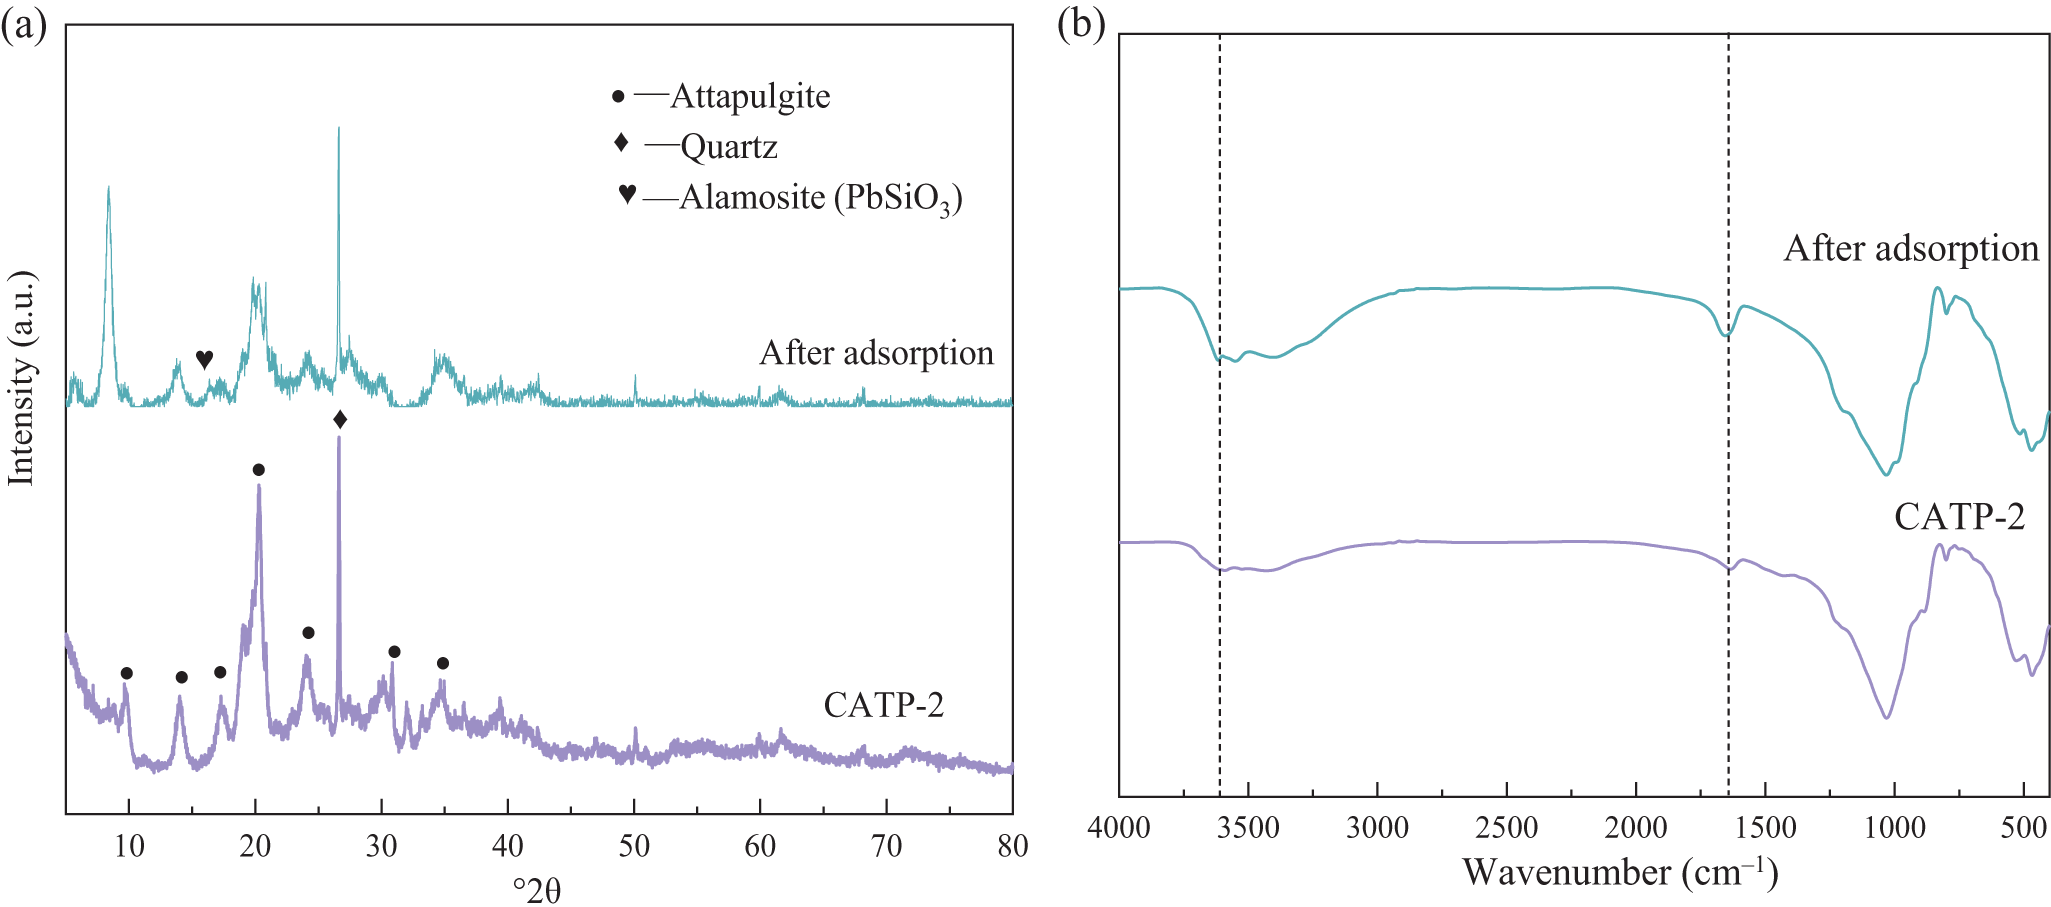
Figure 5a shows the XRD traces of ATP and its calcined samples CATP-1, CATP-2, CATP-3 and CATP-4. The characteristic diffraction peaks of ATP are observed at 8.52°2θ and 13.95°2θ, which are retained after calcination, indicating that the crystal structure and rod-like nanocrystalline morphology of ATP are well-preserved. The majority of characteristic peaks of ATP are retained after calcination at 400°C, the intensity of the (110) peak is significantly reduced, suggesting partial structural rearrangement or loss of ordering in that crystallographic plane. Nevertheless, the persistence of the other main peaks indicates that the overall framework and nanorod structure are largely preserved, supporting the material’s structural stability under moderate thermal treatment. A notable increase in the intensity at 27.18°2θ suggests the presence of residual quartz impurities. However, with increasing calcination temperature, the peaks of feldspar and calcite (initially present as associated minerals in raw ATP) are significantly weakened or disappear, implying their decomposition or structural transformation during thermal treatment. These changes reduce the inert mineral content and expose more active sites. The XRD traces of CATP-2 (Fig. 5a) show that while the majority of the characteristic peaks of ATP are retained after calcination at 400°C; the intensity of the (110) peak is significantly reduced, suggesting partial structural rearrangement or loss of ordering in that crystallographic plane. Nevertheless, the persistence of the other main peaks indicates that the overall framework and nanorod structure are largely preserved, supporting the material’s structural stability under moderate thermal treatment.

Figure 5. Mineral changes in calcination-modified CATP: (a) XRD traces and (b) FTIR spectra.
The changes in the FTIR spectra of ATP before and after calcination are shown in Fig. 5b. The FTIR spectra show a broad peak at 3441 cm–1 attributed to –OH stretching vibrations, as well as peaks at 1031 and 468 cm–1 corresponding to Si–O stretching and bending vibrations. These bands remained after Pb2+ adsorption, indicating that the fundamental framework of the ATP structure was preserved. Additional peaks near 1630 cm–1 may be due to –OH bending of adsorbed water. The absorption peak at 1646 cm–1 corresponds to the O–H stretching vibrations of adsorbed and interlayer water in ATP. Compared to untreated ATP, the calcined ATP exhibits a noticeable shift and decrease in intensity at this peak, indicating reductions in interlayer and adsorbed water. This dehydration exposes the pore structure of ATP, increasing its absorption of Pb(II). A stretching vibration absorption band near 3547 cm–1 corresponds to the hydroxyl stretching vibration of structural water in ATP. While this peak weakens after calcination, it does not disappear, suggesting that some structural water remains. Additionally, the vibration peak at 1027 cm–1, attributed to the asymmetric Si–O–Si stretching vibration, remains largely unchanged before and after calcination. When combined with the XRD results, these findings confirm that ATP retains its crystalline structure and rod-like nanocrystalline morphology after calcination.
Possible processes of Pb2+ adsorption by CATP-2
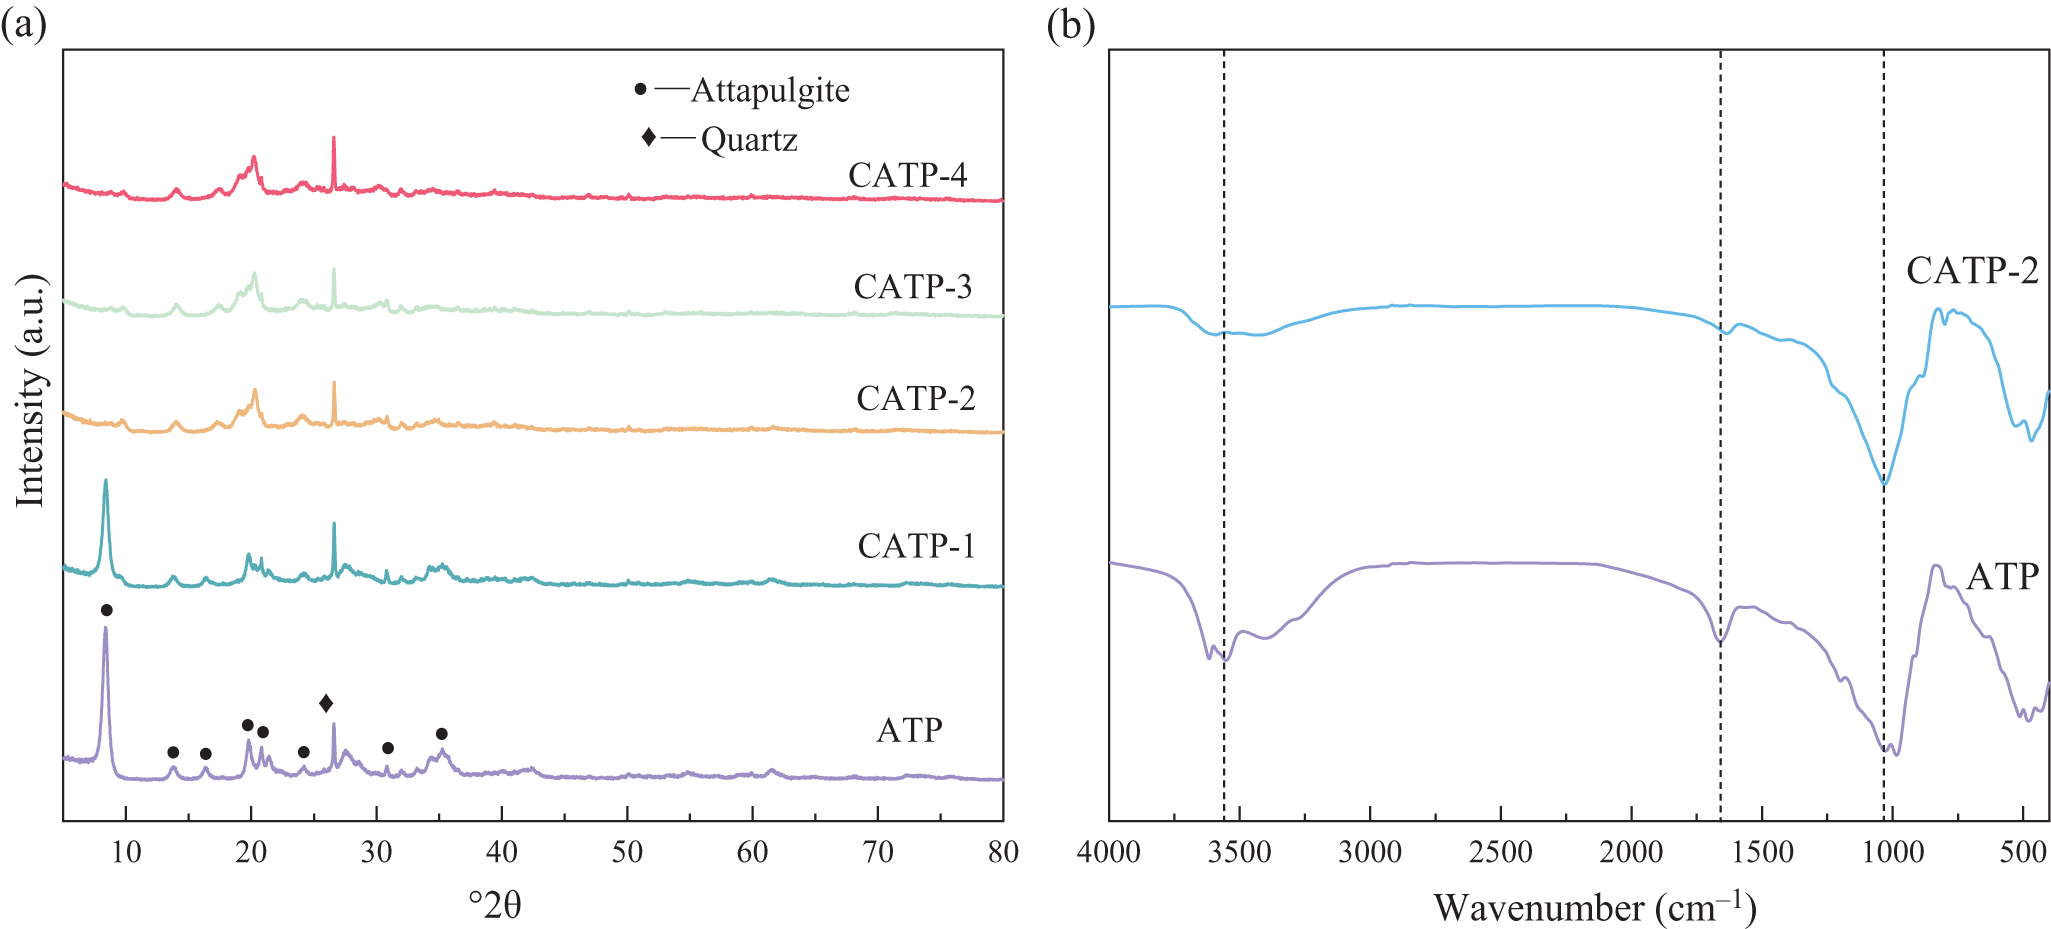
The surface characteristics of ATP minerals before and after calcination and Pb2+ adsorption are shown in Fig. 6a–f. The pristine ATP exhibits well-defined edges and a relatively intact morphology (Fig. 6a,b). Due to the presence of cementitious components that partially fill its pores and block its channels, ATP aggregates into rod-like particles of various sizes, forming a dense and compact structure that limits available adsorption sites and leads to poor performance (Xu et al., Reference Xu, Feng, Li, Yang and Wu2022a). After calcination, the resulting CATP-2 maintains the overall rod-like morphology of ATP, but its structure becomes more porous and less compact (Fig. 6c,d). This enhanced porosity facilitates increased Pb2+ adsorption by providing more accessible active sites. Following adsorption, although the porosity of CATP-2 slightly decreases, the rod-like morphology is retained and the surface remains relatively porous (Fig. 6e,f). It is important to clarify that morphological retention alone does not guarantee the preservation of the crystalline structure. To rigorously assess the structural integrity of CATP-2, XRD analysis was conducted before and after Pb2+ adsorption. The XRD traces show no new diffraction peaks and no significant shifts or broadenings of existing peaks, indicating that the crystalline phase and structure of CATP-2 are well-preserved during the adsorption process. This confirms that Pb2+ uptake does not induce structural degradation or phase transformation. Furthermore, EDS mapping (Fig. 6f) confirms the successful adsorption of Pb2+ onto CATP-2, with a uniform elemental distribution across the material.

Figure 6. SEM images of the prepared samples: (a) ATP; (b) enlarged view of the point in (a); (c) CATP-2; (d) enlarged view of the point in (c); (e) after adsorption of CATP-2; and (f) enlarged view of the point in (e). The elements are colour-coded as follows: silicon (Si) is shown in green, aluminium (Al) in red, magnesium (Mg) in yellow, oxygen (O) in cyan and lead (Pb) in purple.
The XRD traces of ATP before and after Pb2+ adsorption are shown in Fig. 7a. Both ATP and quartz phases remain present before and after adsorption, but the diffraction peak intensity of ATP decreases, suggesting that Pb2+ interacts with ATP during the adsorption process. Additionally, after Pb2+ adsorption, a new characteristic peak corresponding to alamosite (PbSiO3) appears, further confirming the reaction between ATP and Pb2+. The possible formation mechanism of PbSiO3 is attributed to the chemical interaction between Pb2+ and surface silanol groups (Si–OH) or silicate frameworks on ATP. During adsorption, the high local concentration of Pb2+ near the adsorbent surface and the exposure of reactive Si–O– groups, especially after calcination, may promote the precipitation of Pb–Si compounds. In particular, under the slightly acidic conditions used (pH = 5.0), Pb2+ is more likely to participate in localized solid-state reactions with silicate structures, resulting in the formation of PbSiO3 microcrystals during the drying or aging stage. This is further supported by the emergence of corresponding diffraction peaks in the XRD traces. The FTIR spectra of CATP-2 before and after Pb2+ adsorption are shown in Fig. 7b. Prior to adsorption, CATP-2 exhibits an –OH stretching vibration absorption band at 3600 cm–1, attributed to surface-coordinated water and zeolitic water, as well as a bending vibration absorption peak of –OH from adsorbed and interlayer water near 1646 cm–1 (Xu & Chen, Reference Xu and Chen2024). After Pb2+ adsorption, the –OH vibration peak shifts, indicating that hydroxyl groups on the ATP surface and water molecules within its structure interact with Pb2+ during the adsorption process.

Figure 7. The mineralogical characterization of CATP-2 before and after Pb2+ adsorption: (a) XRD traces and (b) FTIR spectra.
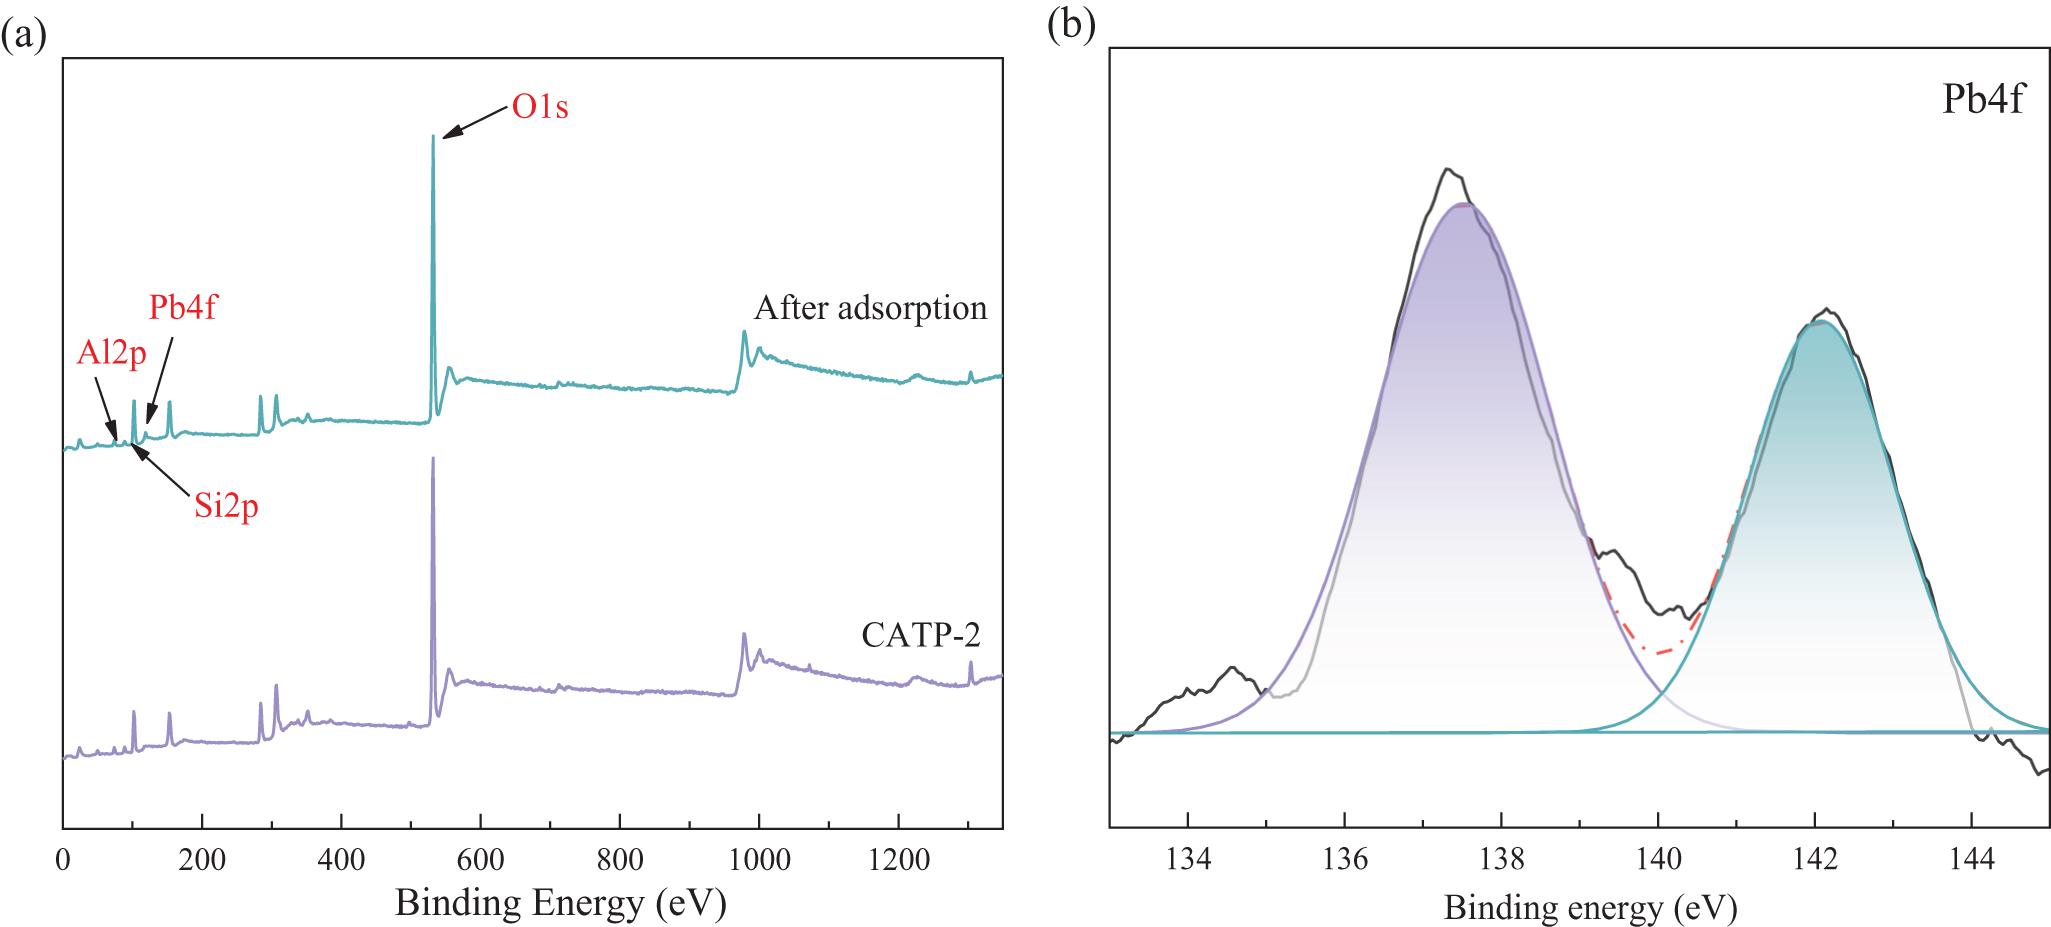
To further investigate the mechanism of action of CATP-2, XPS analysis was conducted before and after Pb2+ adsorption. When chemical interactions occur between adsorbents and adsorbates, the chemical state (or binding energy) of atoms shifts, leading to subtle changes in the corresponding XPS spectra (Zhang et al., Reference Zhang, Zhou, Yao and Zhou2016; Wang et al., Reference Wang, Wang, Wang and Wang2022a). Figure 8 presents the full-scan XPS spectrum of CATP-2 after Pb2+ adsorption, along with high-resolution spectra of Si2p, O1s and Pb4f. The characteristic peak at 139 eV corresponds to Pb4f, confirming the adsorption of Pb2+ onto ATP. The binding energies at 142.8 and 137.2 eV correspond to Pb4f5/2 and Pb4f7/2, respectively, which may be associated with Pb3(OH)2(CO3)2 and PbO (Swiatkowski et al., Reference Swiatkowski, Pakula, Biniak and Walczyk2004). Additionally, after Pb2+ adsorption, a shift towards lower binding energies is observed in the Si2p and O1s spectra, indicating an interaction between Pb2+ and surface Si–OH groups. This finding aligns with the XRD results, which confirm the formation of PbSiO3 through the interaction of Pb2+ with Si and O atoms, altering their bonding structure.

Figure 8. The XPS analysis of (a) the survey scan and (b) Pb4f for CATP-2 after adsorption.
Calculation of surface adsorption energy
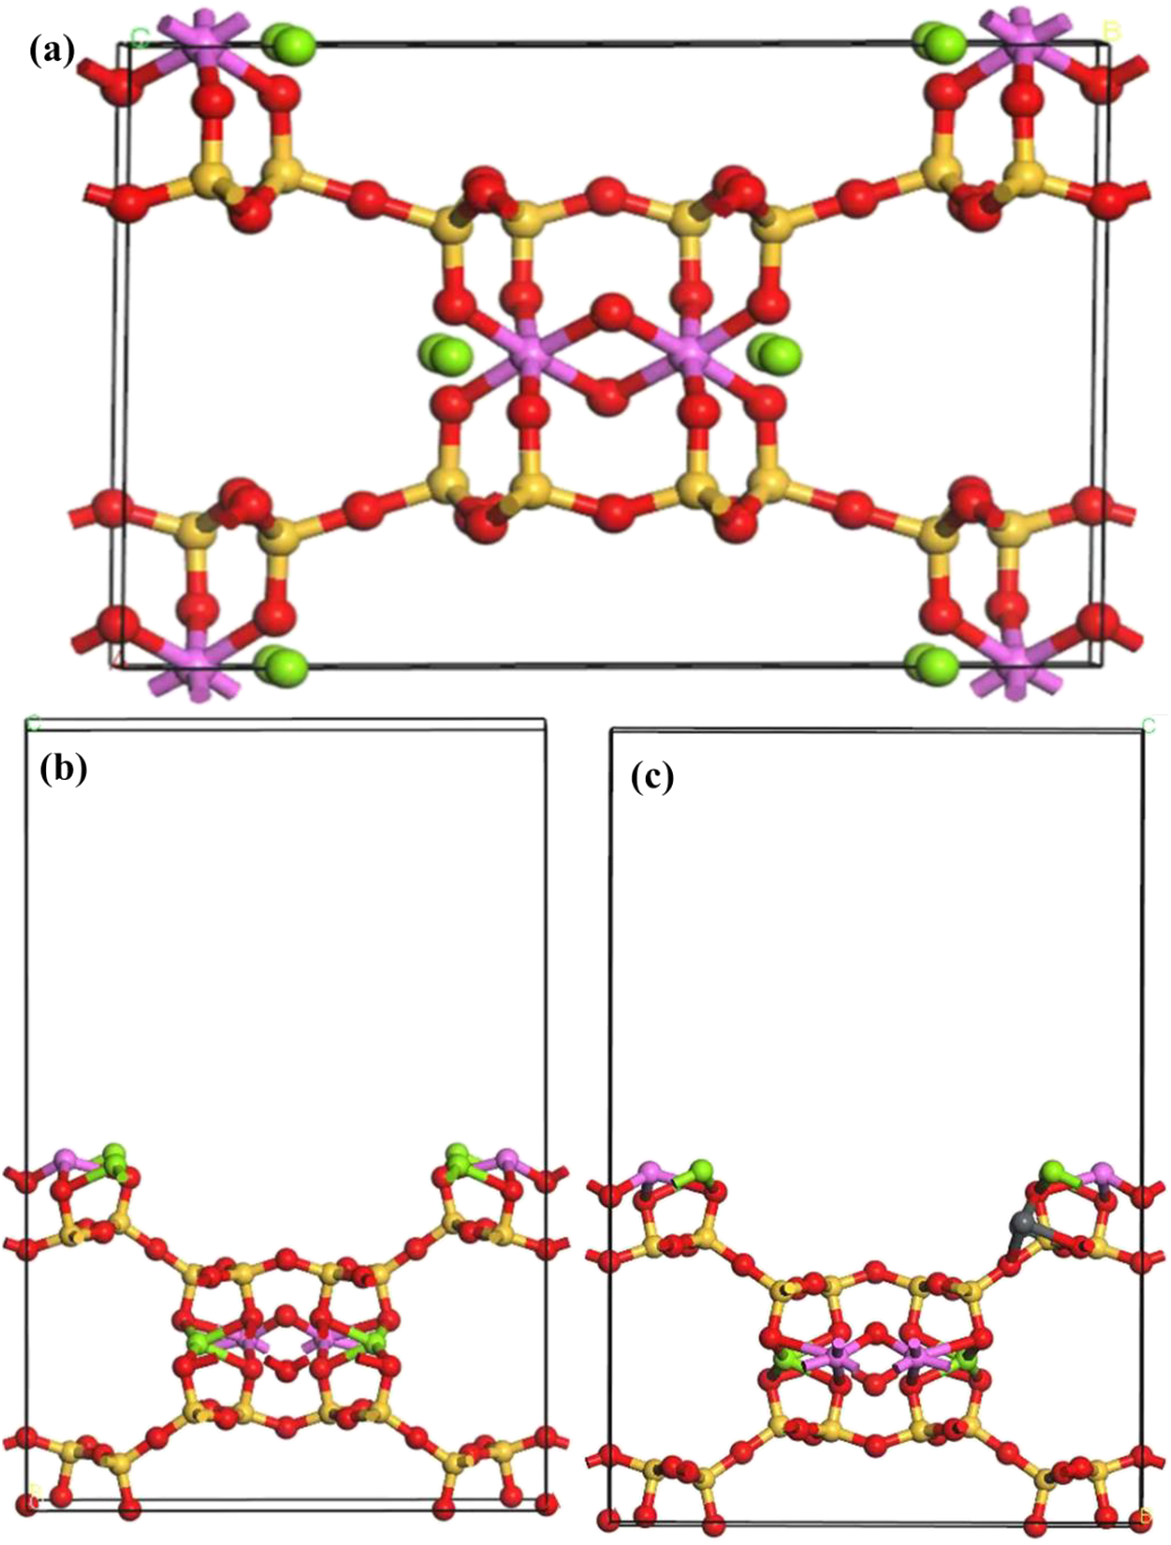
The purpose of this simulation is to provide preliminary theoretical support for the Pb2+ adsorption mechanism on ATP’s surface. Therefore, only the essential parameters are presented in this study. In this study, the total energy of the ATP crystal system was calculated using the Materials Studio simulation platform. The crystallographic parameters were adopted from the structure reported by Jeffrey E. Post (more details in Shenjin et al., Reference Shenjin, Xiaoxi, Chenyang, Wenjihao, Yaochi and Xinzhuang2025), with lattice constants of a = 13.179 Å, b = 17.852 Å and c = 5.2316 Å. A periodic unit cell was constructed based on these parameters to accurately represent the experimental crystal structure, thereby providing a robust foundation for subsequent adsorption simulations. To investigate the adsorption behaviour of Pb2+ ions, the (200) crystal plane (Xu et al, Reference Xu, Liu, Wang, Tang and Zhang2021) – featuring prominently exposed surface sites – was selected for cleavage and model development (Fig. 9). A supercell was constructed by expanding the unit cell, effectively increasing the number of surface atoms and minimizing artifacts from periodic boundary conditions. Additionally, a 15 Å vacuum layer was introduced along the direction perpendicular to the cleaved surface (typically the z-axis) to eliminate spurious interactions between periodic images. The adsorption energy of Pb2+ on the ATP surface was calculated using Equation 11 (Luo & Chen, Reference Luo and Chen2022), yielding a value of –441.652 kJ mol–1. This highly negative value indicates that the adsorption process is thermodynamically favourable and results in a substantial reduction in system energy, thereby enhancing structural stability. Further structural optimization revealed that Pb2+ forms strong electrostatic interactions (and potentially coordination bonds) with surface oxygen atoms. These interactions stabilize Pb2+ on the surface, underscoring the high adsorption affinity of ATP. In particular, CATP demonstrates significant promise for practical applications in the removal of heavy-metal ions from contaminated environments.
 \begin{equation}{E_{{\text{ads}}}} = {E_{{\text{sub}}/{\text{metal}}}} - {E_{{\text{sub}}}} - {E_{{\text{metal}}}}\end{equation}
Figure 9. (a) The cell structure of ATP. (b) The (200)crystal plane of ATP. (c) The adsorption of Pb2+. Red = O; yellow = Si; pink = Al; green = Mg.
where E ads is the adsorption energy, representing the energy change when the adsorbate binds to the substrate, E sub is the total energy of the clean substrate without the adsorbate and E metal is the total energy of the isolated adsorbate (metal atom or molecule).
Conclusion
This study demonstrates that thermal modification is an effective strategy for enhancing the adsorption performance of natural ATP for lead removal. Moderate calcination at 400°C produced a material with improved surface reactivity and accessible adsorption sites, resulting in significantly greater uptake of lead compared with untreated clay. These findings provide direct evidence that thermal activation can optimize the balance between structural preservation and functional group exposure, which has not been systematically clarified in previous studies. By establishing this relationship, the present work extends the understanding of how structural evolution governs adsorption efficiency in ATP and highlights its potential as a low-cost and sustainable material for wastewater treatment. Future research should focus on evaluating the material in real wastewater systems to further validate its practical applicability.
Acknowledgements
The authors would like to thank all of the technicians who rendered their expertise during the investigation.
Author contributions statement
XG: Conceptualization, methodology, investigation, formal analysis, writing – original draft.
Data availability
Data are available on request from the author.
Financial support
This research did not receive any specific grant from funding agencies in the public, commercial or not-for-profit sectors.
Competing interests
The author declares none.