


Introduction
As many developed countries face aging populations, public debate has drawn more attention to the potential consequences of demographic change. These include increased pressure on health-care systems (Caley and Sidhu, Reference Caley and Sidhu2011), adverse effects on the labor market due to skills shortages (Börsch-Supan, Reference Börsch-Supan2003), and challenges for pension systems (OECD, 2021). The latter is particularly relevant for countries that rely on a pay-as-you-go system, where contributions from today’s working generation are used to finance the pensions of today’s retirees. Given the direct and indirect impact that demographic change will have on key policy areas in the coming years and decades, it is important that the public has a good understanding of the underlying demographic dynamics. This will make it more likely that voters will recognize the need for reforms and give them democratic legitimacy at the ballot box. As the baby boomers begin to move out of the labor market and into retirement, this is an urgent issue.
This paper examines how well informed people are about the extent of demographic change and identifies factors that contribute to more accurate estimates or beliefs.Footnote 1 It also examines whether providing respondents with information about demographic change helps them to update their beliefs so that they become more accurate.
Our analysis consists of three steps: First, we conduct a descriptive analysis to gain insight into the distribution of respondents’ prior beliefs about the aging of the German population, which we capture by the old-age dependency ratio.Footnote 2 Prior beliefs are elicited separately for the old-age dependency ratios in 2020 and 2050. In order to capture not only beliefs about the level of the ratios but also their change, we calculate the difference between the prior beliefs for 2020 and 2050. This difference reflects the demographic change that respondents expect to occur over time. Second, we use multinomial probit models to identify the factors that make respondents more likely to underestimate, correctly estimate or overestimate the ratios and their change. Finally, we analyze belief updating, that is whether and to what extent respondents change their beliefs about demographic change once we provide them with information about the old-age dependency ratios. To do this, we compare the prior and posterior beliefs for both 2020 and 2050.
In the descriptive analysis, we find that respondents tend to overestimate the old-age dependency ratios for both 2020 and 2050. However, beliefs about the expected demographic change, that is the difference between the two ratios, are generally more accurate.
The results of our multinomial probit models suggest that a better understanding of the functioning of the German statutory pension insurance is related to more accurate beliefs about the old-age dependency ratios for 2020 and 2050 and demographic change, that is the difference between the two ratios. Furthermore, the findings point to heterogeneities related to the age of respondents who have informed themselves about their retirement needs. Older respondents who have informed themselves about their needs are more likely to underestimate (and less likely to overestimate) the old-age dependency ratios for both 2020 and 2050 and the magnitude of demographic change. These effects are not observed for younger respondents who have informed themselves about their needs. We can only speculate about the reasons for this: Older respondents close to retirement may be less concerned about demographic change because they have already (at least partially) prepared for their old age. As a result, they may be more likely to underestimate the extent of projected population aging. Alternatively, they may try to convince themselves of a more positive outlook, especially if they have not yet sufficiently prepared for their old age or would not have the opportunity to react to a more adverse demographic development. The exact mechanisms, however, require further research.
In the final step of our analysis, we examine belief updating, that is whether respondents who have received the information about the old-age dependency ratios are able to remember it. Our results show that respondents update their beliefs in a significant way, with posterior beliefs closely matching the projected old-age dependency ratios for both 2020 and 2050. This holds for the full sample as well as for subgroups based on age, gender, and the extent of understanding the German statutory pension insurance. Our analysis suggests that differences in the strength of belief updating are determined by the strength of biases in prior beliefs.
This paper is related to several strands of literature. The first strand is the economics literature on surveys and information provision experiments. In recent years, economists have increasingly used surveys to elicit beliefs about socioeconomic statistics and to study policy preferences. Typical applications include beliefs about inequality and preferences for redistribution (Cruces et al., Reference Cruces, Perez-Truglia and Tetaz2013; Kuziemko et al., Reference Kuziemko, Norton, Saez and Stantcheva2015; Alesina et al., Reference Alesina, Stantcheva and Teso2018; Hoy and Mager, Reference Hoy and Mager2021; Casarico et al., Reference Casarico, Schuetz and Uebelmesser2024) and beliefs about immigration statistics and attitudes toward migration (Grigorieff et al., Reference Grigorieff, Roth and Ubfal2020; Haaland and Roth, Reference Haaland and Roth2020; Alesina et al., Reference Alesina, Miano and Stantcheva2023; Dylong and Uebelmesser, Reference Dylong and Uebelmesser2024). All these studies have in common that they elicit respondents’ beliefs and then provide one or several pieces of information to the treatment group(s) in order to study the effect of the treatment on the outcome of interest for the treated group compared to the control group. Some studies also examine whether respondents in the treatment group(s) were able to process and retain the information provided. Analyzing belief updating behavior helps to understand the underlying mechanisms of a potential treatment effect (Haaland et al., Reference Haaland, Roth and Wohlfart2023).Footnote 3 To the best of our knowledge, however, there are no experimental studies in the economics literature that elicit beliefs about demographic change and examine belief updating in response to information provision.Footnote 4
The second strand of literature is related to (laypeople’s) expectations about the economy. Laypeople’s expectations are most commonly studied in the context of inflation (see, e.g., Armantier et al., Reference Armantier, Nelson, Topa, van der Klaauw and Zafar2016; D’Acunto et al., Reference D’Acunto, Malmendier, Ospina and Weber2021; Coibion et al., Reference Coibion, Gorodnichenko, Knotek and Schoenle2023), but have also become the focus in other economic applications. For example, Roth and Wohlfart (Reference Roth and Wohlfart2020) study how people’s expectations about economic growth influence what they think about their own financial situation as well as their behavioral reactions to changes in these expectations while Bjuggren and Elert (Reference Bjuggren and Elert2019) investigate gender differences in expectations about economic development. We add to this literature with our study of beliefs about demographic change, which can be related to people’s expected development of population aging.
Finally, the third strand is the economics literature on pensions. It presents a possible application of (corrected) beliefs about demographic change to the analysis of individuals’ acceptance of reforms and their pension provision behavior.Footnote 5 Overall, pension reforms face low acceptance and thus may come at a cost to politicians in terms of a reduced probability of reelection. However, higher levels of economic and financial literacy may reduce the electoral costs of pension reforms as shown by Fornero and Lo Prete (Reference Fornero and Lo Prete2019) for a sample of 21 advanced countries, including Germany and Italy. This finding is in line with Boeri and Tabellini (Reference Boeri and Tabellini2012) who show for Italy that more informed individuals are more likely to accept pension reforms. However, Gouveia (Reference Gouveia2017) for Portugal and Kangas et al. (Reference Kangas, Airio, Koskenvuo, Kuivalainen and Tenhunen2022) for Finland find mixed results. More closely related to this paper, Schuetz et al. (Reference Schuetz, Uebelmesser, Baginski and Aprea2023) show that providing information about demographic change and, more broadly, increasing the salience of this issue, increases the awareness that pension reforms are necessary. Similarly, Naumann (Reference Naumann2017) examines how information about demographic change and its consequences for the financing of the statutory pension insurance affects preferences for pension reforms. Our paper aims to study how well informed individuals are about demographic change, which factors determine the accuracy of their beliefs and whether beliefs are updated when information is provided. Our paper thus differs from the aforementioned literature in that it focuses exclusively on beliefs about demographic change and their determinants. While this literature, and in particular Schuetz et al. (Reference Schuetz, Uebelmesser, Baginski and Aprea2023), is mainly concerned with the effect of information on pension reform preferences given prior beliefs, our goal is to shed light on these beliefs and how individual characteristics are related to them. It does not analyze to which extent these beliefs affect reform preferences. Thus, we aim to provide a more detailed understanding of the extent to which people are aware of demographic change. This can be seen as a precursor to the analysis of how these beliefs affect reform preferences.
Beliefs about demographic change and the information provided about it may also affect pension provision behavior. While the data used does not allow us to analyze whether individuals with more correct beliefs about demographic change save differently from individuals with less correct beliefs, the existing literature provides evidence on the effect of information on pension provision behavior. For example, it has been shown that sending annual letters that inform people about their expected pension payments from the statutory pension insurance increases private pension saving (Dolls et al., Reference Dolls, Doerrenberg, Peichl and Stichnoth2018). In addition, Bucher-Koenen and Lusardi (Reference Bucher-Koenen and Lusardi2011) show that knowledge of basic financial concepts has a positive effect on retirement planning. Being better informed about demographic change may contribute to being better informed about one’s own individual pension situation and may also influence the pension provision behavior.
This paper is structured as follows: The next section introduces the dataset and explains how we measure beliefs about demographic change. The first step of our analysis is presented in the ‘Descriptives of prior beliefs’ section, which contains a brief descriptive analysis of the distributions of beliefs. The ‘Empirical strategy’ section explains our empirical strategy, and the ‘Beliefs of demographic change’ section presents step two of our analysis, the multinomial probit model, and step three, the belief updating. Finally, the ‘Conclusion’ section concludes.
Data and experimental design
Our analysis is based on a unique dataset collected by a professional survey company in late 2020 and early 2021. The data collection was carried out by computer-assisted telephone interviews using a multistage random sampling procedure with a dual-frame approach, i.e. contacting both landlines and mobiles and relying on randomized digital dialing. For landlines, the next birthday method was used, i.e. the person in the household with the next birthday was to be interviewed. This approach was chosen to ensure a high-quality sample.
About 1000 respondents answered questions on sociodemographic characteristics, their under- standing of the German statutory pension insurance, their attitudes toward pension issues, their view of pension reforms, their own pension saving behavior, and their beliefs about demographic change. The structure of the survey and an overview of all variables included in our analysis can be found in Appendix A, Table A1. Due to missing responses in some of the variables, our final sample size reduces to 882 observations. The questionnaire was distributed to individuals in Germany who were at least 18 years old, not employed as civil servants and not retired. Our sample is representative of East and West Germany in terms of age, gender, and state of residence according to the German Microcensus.Footnote 6 In terms of education, our sample is more educated than the average population; in addition, the share of West German respondents with a migrant background is lower in our sample than in the population in West Germany.
To further underline the quality of our data, we compare our sample with the sample of the German Socio-Economic Panel (Socio-Economic Panel (SOEP), 2023) for some sociodemographic variables in Table C1. Overall, the average age, the share of women, and the share of married participants are very similar. This is also the case for the income variable, if one takes into account the missings (17%) and recalculates the shares accordingly.Footnote 7 In terms of education our sample is slightly more educated, as mentioned above. We asked about risk aversion in matters related to money and finance, while the SOEP asks about general risk aversion. A comparison of the two variables shows that our sample is slightly more risk averse, which could be due to the focus on money and finance. Finally, respondents in both samples seem to be equally (un)concerned about their own pension. Overall, we find that our sample compares well with the high-quality data of the SOEP.
We elicit beliefs about demographic change by asking all survey respondents about their estimates of the ratios of old-age to working-age people for the years 2020 and 2050. We introduce the topic by telling respondents that old-age provision in Germany is based on the idea that the working generation finances the pensions of the retired generation. We also stress that this is why it is important to look at the ratio of people of retirement age (65 years and above) to people of working age (between 20 and 64 years). As respondents may find it difficult to estimate the old-age dependency ratio, we provide them with an anchor by telling them that in 1990 there were 24 people of retirement age for every 100 people of working age. We then ask them for their estimates of the number of people of retirement age per 100 people of working age in 2020 and 2050, respectively.Footnote 8
Part of the respondents, the information group, is given information about the two ratios, while the other part, the control group, is not. (For more details on the experimental groups and the random assignment, see Appendix E.) Toward the end of the survey, we ask the information group about their posterior beliefs. Throughout our analysis, we use data from both groups, except for the analysis of belief updating, which we can only do for the information group for which we have prior and posterior beliefs. With this setting, we are able to provide a detailed analysis of prior beliefs, their determinants and the updating of the beliefs.
Descriptives of prior beliefs
In each step of our analysis, we evaluate the prior beliefs for the years 2020 and 2050 individually and examine the change in the prior beliefs between 2020 and 2050 by subtracting the prior belief for 2020 from the prior belief for 2050 (see equation 1). This difference gives us an indication of respondents’ estimate of demographic change.
 \begin{equation}diff_{i} = prior{50_i} - prior{20_i}\end{equation}
The first step is a descriptive analysis of the prior beliefs for 2020 and 2050 and the difference between the two as described in equation 1, to analyze the distribution of the beliefs. To deal with extreme outliers, we trim beliefs above 200 for both years. This affects in total 58 observations.
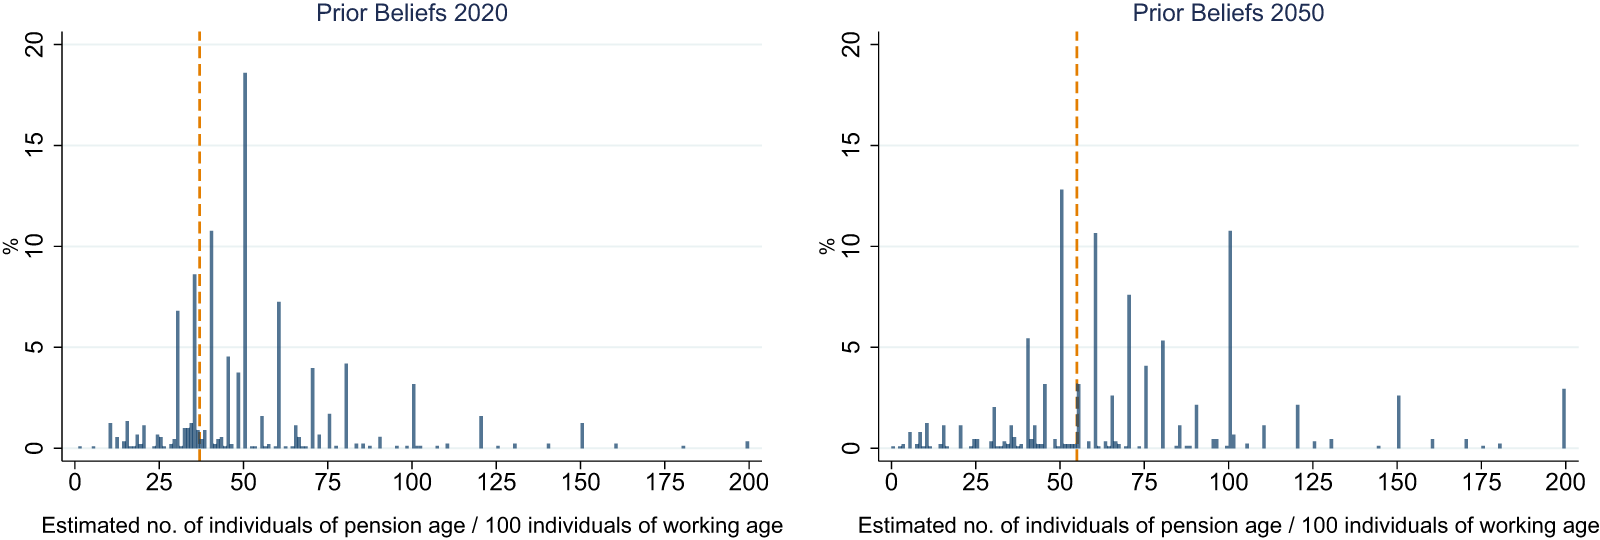
Figure 1 illustrates the distribution of prior beliefs for 2020 and 2050, respectively.Footnote 9 The orange dashed line represents the projected value of 37 for 2020 and the projected value of 55 for 2050. The projections come from the Federal Statistical Office (Destatis, 2017) and assume an almost constant birth rate, a moderately increasing life expectancy, and take into account the increase in migration due to the 2015 refugee crisis. The assumptions may turn out not to be fully in line with the actual demographic developments, especially for 2050. Therefore, the projections of the old-age dependency ratio for 2050 should not be confused with the values that will be realized by then. Despite the uncertainty involved, for the sake of clarity we will refer to the projected values as if they were certain. To compensate for this likely inaccuracy, we allow for a margin of error around the projected values when assessing the accuracy of respondents’ beliefs. (For more details, see the ‘Empirical strategy’ section following equation (2).) The distribution of beliefs for 2020 is relatively concentrated between 30 and 60. In contrast, the distribution for 2050 is much more spread out, suggesting that respondents are less certain about their estimates for this later year. A plausible explanation for this difference in dispersion is that respondents rely on the anchor value for their beliefs about the old-age dependency ratio in 2020. However, as the anchor only provides information on the old-age dependency ratio in 1990, respondents may find it more difficult to predict the development up to 2050.
Distributions of prior beliefs.
Notes: The figures (based on Schuetz et al. (Reference Schuetz, Uebelmesser, Baginski and Aprea2023), Figure 2) show the distribution of prior beliefs of the old-age dependency ratios for 2020 and 2050, respectively.

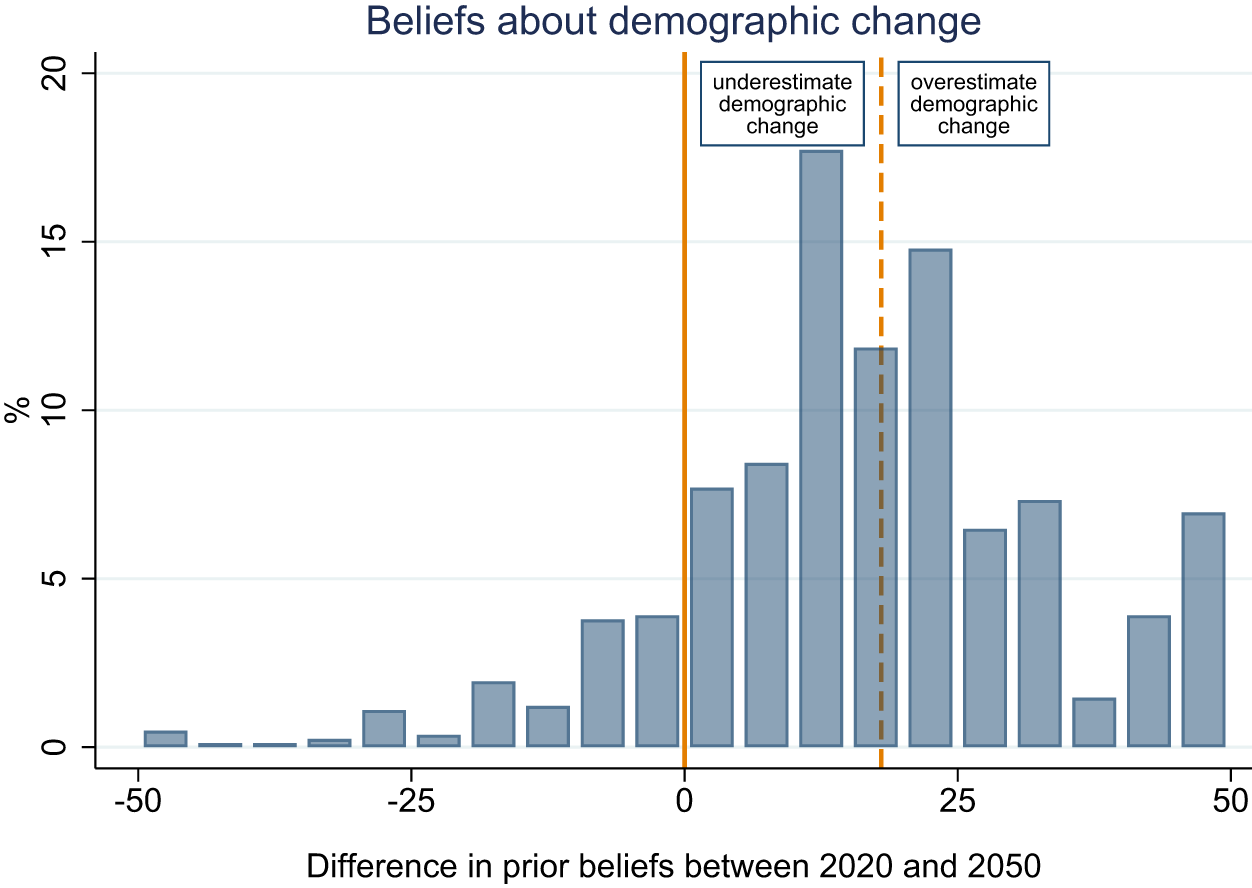
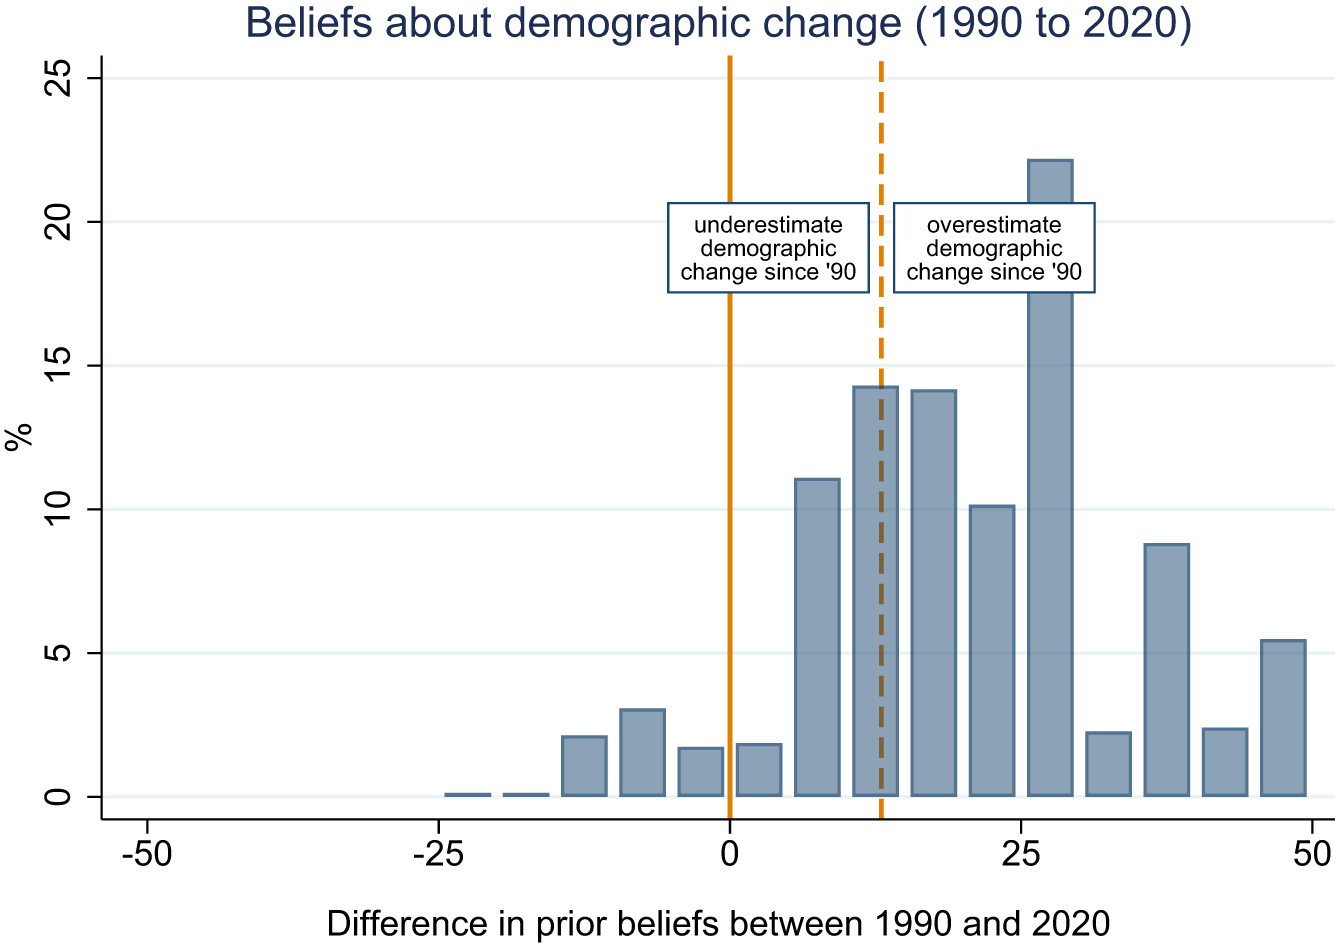
Figure 2 shows the estimated magnitude of demographic change, diffi, between 2020 and 2050 (see equation 1). The projected increase in the number of people of retirement age per 100 people of working age between 2020 and 2050 is 18 (= 55−37). A negative value for diffi indicates that a respondent expects demographic change to become less severe over time, that is that there will be fewer people of retirement age per 100 people of working age in 2050 than in 2020. Any value of diffi above 0 and below 18 indicates that a respondent expects demographic change to become more severe, but underestimates its magnitude. Similarly, respondents with diffi > 18 expect demographic change to become more severe, but overestimate its magnitude. Importantly, if respondents overestimate both ratios, they may still have an accurate belief about the magnitude of demographic change, which is exactly what we are able to capture with equation 1. In essence, the bias can cancel out if it is of similar magnitude and same direction for both ratios.
Distribution of beliefs about demographic change.
Notes: The figure shows the distribution of the estimated difference in the old-age dependency ratio between 2020 and 2050. We only show observations where the estimated change is greater than −50 and less than 50. However, only 64 observations fall outside the range shown.

About 14 percent of respondents have biased beliefs about the direction of demographic change. For reasons mentioned above, we can only work with a projection of the old-age dependency ratios in 2020 and 2050. Although the realized ratios may differ from the projected values, it is almost certain that the old-age dependency ratio in Germany will be higher in 2050 than in 2020.Footnote 10 Of those who correctly estimated the direction, most had biased beliefs about the magnitude: 54% underestimated demographic change, while 45 percent overestimated it and only 1 percent of respondents had correct estimates. In Figure 2, the two groups of underestimators and overestimators are separated by the dotted line. Later on in the analysis, we will allow for some tolerance in defining the correct estimate of demographic change.
Overall, the majority of respondents overestimate the old-age dependency ratios for 2020 and 2050. Looking at the estimated magnitude of demographic change, that is the difference between the two estimated ratios, a more balanced picture emerges. There is a small percentage of respondents who do not expect any further aging, while the rest is relatively evenly divided between those who underestimate and those who overestimate the extent of aging.
In Figure C.1 in Appendix C, we show the difference between the old-age dependency ratios for 1990 (the anchor) and 2020. This allows us to study whether respondents use linear extrapolation when giving us their estimates for the ratios of 2020 and 2050. In this case we would expect the two differences – that between the ratios for 2020 and 1990 and that between the ratios for 2050 and 2020 – to be similar. However, if we compare the mean and the median, we find a mean of 28 (median 25) between 2020 and 1990 and a mean of 18 (median 16) between 2050 and 2020; only for 11 respondents do we find the same difference (a comparison of Figures 2 and C.1 serves as an illustration). We therefore conclude that linear extrapolation is very unlikely.
In the following analysis, we specifically distinguish between the prior beliefs of the ratios considered separately and the difference. This gives us a detailed insight into who has accurate beliefs about the (projected) ratios and who has biased beliefs but still seems to have a good understanding of the projected demographic change.
Empirical strategy
As presented in the previous section, our first step consists of a descriptive analysis of individual prior beliefs for 2020 and 2050 and the difference between the two. In the second step, we use an exploratory approach to identify factors that contribute to more accurate estimates of the old-age dependency ratios and the magnitude of demographic change.
Our primary estimation strategy is based on multinomial probit models. We categorize respondents into underestimators, correct estimators, and overestimators based on their beliefs. We then use the belief categories as outcome variables. Our outcome categories are not ordered in a linear sense; we could also describe them as ‘bad’, ‘good’, and ‘another type of bad’, respectively. Accordingly, the parallel regression assumption of ordered probit models is violated. For this reason, we use multinomial probit models instead of ordered probit models. Running a Brant test on our data confirms this and indicates that a multinomial probit model is the better choice for our (non-linearly) ordered outcomes. This model allows us to estimate the potential impact of our explanatory variables on the probability of a respondent being an underestimator, a correct estimator, or an overestimator, based on the following equation:
 \begin{align}
P(belief{\text{ }}category|{{\mathbf{X}}_i},{\text{ }}unde{r_i},{\mathbf{infor}}{{\mathbf{m}}_i},{\text{ }}prio{r_i}) & = {\text{ }}{\beta _0} + {\beta _1}{{\mathbf{X}}_i} + {\beta _2}unde{r_i} + {\beta _3}{\mathbf{infor}}{{\mathbf{m}}_i}\nonumber \\ \qquad\qquad & + {\beta _4}prio{r_i} + {\varepsilon _i}{\text{ }}
\end{align}
\begin{align}
P(belief{\text{ }}category|{{\mathbf{X}}_i},{\text{ }}unde{r_i},{\mathbf{infor}}{{\mathbf{m}}_i},{\text{ }}prio{r_i}) & = {\text{ }}{\beta _0} + {\beta _1}{{\mathbf{X}}_i} + {\beta _2}unde{r_i} + {\beta _3}{\mathbf{infor}}{{\mathbf{m}}_i}\nonumber \\ \qquad\qquad & + {\beta _4}prio{r_i} + {\varepsilon _i}{\text{ }}
\end{align}where belief category is our outcome and can be categorized as ‘underestimator’, ‘correct estimator’, and ‘overestimator’ for each individual prior belief and the difference between them. The intervals we use to classify the respondents are as follows: For 2020, where the correct value is 37, a prior belief below 33 is considered an underestimate, a prior belief between 33 and 41 is considered a correct estimate and a prior belief above 41 is considered an overestimate. This range is determined on the basis of the information provision experiment, where respondents received feedback that their estimate was correct if it fell within the interval between 33 and 41. The intervals for underestimators and overestimators are chosen in relation to this interval.Footnote 11 For 2050, where the correct value is 55, the thresholds are below 51, between 51 and 59, and above 59 following a similar reasoning as for the 2020 ratio.
The vector of control variables, Xi, includes sociodemographic variables such as age, gender, education, living in East/West Germany, having a migration background, being employed, and being married, as explained in Appendix A. We include these variables because demographic change affects individuals from different generations and with different individual economic and social situations in different ways. This may, in turn, affect beliefs about the old-age dependency ratios and the extent of demographic change.
For the socioeconomic controls, our main focus is on age and gender. There may be differences between older and younger respondents. In fact, we argue that older respondents are better at estimating the old-age dependency ratios for two reasons. As they are mostly from the baby-boom generation, they are aware that their age cohort is large compared to those before and after them. Consequently, they should have a good idea of what it means for the dependency ratio when they and their peers move from below to above the age of 65. In addition, many older people have already given some thought to this issue because they are approaching retirement and the old-age dependency ratio is important for assessing the stability of the statutory pension scheme.
There may also be differences between men and women in their beliefs about demographic change due to persistent inequalities in (unpaid) work. Those who are mainly responsible for raising the next generation may have different beliefs about demographic change and be exposed to different sources of information than their partners who are in (full-time) paid employment. In particular, we expect men to be more likely to correctly estimate the old-age dependency ratios, as they are more active in the labor market and more confronted with the consequences of their colleagues’ retirement.
The variable, underi, measures respondents’ understanding of the statutory pension insurance based on 11 single-choice questions.Footnote 12 We calculate the total number of correct answers per respondent to construct our understanding index. By including both educational attainment and the understanding variable, despite the expected correlation between the two, we can accurately estimate the role of knowledge acquired outside formal education. We expect that a better understanding of the statutory pension insurance makes the issue of demographic change more salient, which has a positive effect on the ability to correctly estimate the old-age dependency ratios and the magnitude of demographic change that cannot be explained by education.
The vector informi captures the extent to which respondents have informed themselves about the income they will need in retirement, an interaction of the same variable with an indicator for being 60 or older, and a binary variable for whether respondents have informed themselves about the income they will receive in retirement. It seems reasonable that those respondents who are better informed will have more accurate beliefs about demographic change than those who are not. We also hypothesize that the effect of being informed varies by age.
Finally, the variable priori stands for the respective other prior belief. When explaining the prior belief about the ratio of 2020, we control for the prior belief about the ratio of 2050 to account for any other unobserved characteristics that systematically affect beliefs about the old-age dependency ratios. Conversely, we control for the prior belief of 2020 when the prior belief of 2050 is our outcome. In the model, which deals with the difference of prior beliefs, we control for the prior belief of 2020 because our descriptive analysis suggested that respondents were able to make a more informed choice of this prior belief compared to the prior belief of 2050. Due to potential endogeneity issues, we only include the respective other prior belief as a robustness check. εi is the error term.
In the third step, we analyze belief updating, that is whether the information treatment led respondents to update their beliefs about the old-age dependency ratios. We only use data from the information group for which we have both prior and posterior beliefs. We compare the prior beliefs for 2020 and 2050 with the posterior beliefs for 2020 and 2050, respectively. Again, we consider subgroups of underestimators, correct estimators, and overestimators based on respondents’ prior beliefs. We also differentiate by gender, age, and understanding of the German statutory pension insurance. We use t-tests to determine whether respondents’ prior and posterior beliefs differ significantly from the true (projected) values.
Descriptive statistics for all (control) variables are presented in Table 1 separately for underesti- mators, correct estimators, and overestimators for the ratio of 2020 (see Tables C2 and C3 in Appendix C for the same statistics for the ratio of 2050 and the difference between the ratios). A description of all variables can be found in Appendix A.
Summary statistics by prior beliefs 2020

Notes: This table presents descriptive statistics of our explanatory variables separately for underestimators, correct estimators, and overestimators of the old-age dependency ratio in 2020. For the income and education variables, (R) indicates the reference group in our regressions.
* p < 0.10, **p < 0.05, ***p < 0.01 indicate significant differences between the respective mean and the mean of the same variable for correct estimators.
Our analysis focuses on the role of gender and age, the understanding of the German statutory pension insurance, which we capture through our understanding index, and whether respondents have informed themselves about their own retirement needs and expected retirement income. We include our understanding index in the analysis as there may be a positive correlation between understanding the statutory pension insurance and understanding demographic change. Finally, we focus on whether respondents have informed themselves about their retirement needs and the income they will receive. With these variables, we hope to capture differences in how informed and possibly concerned respondents are about their individual pension situation, which again may be related to respondents’ beliefs about demographic change.
As can be seen in Table 1, both the share of females and the average understanding index are significantly different for underestimators and overestimators of the 2020 ratio compared to the correct estimators of this ratio. We also find a significant difference between overestimators and correct estimators when considering those who have informed themselves about the pension they will receive. These observations provide evidence that these variables are indeed relevant to our analysis of explaining prior beliefs. In Tables C2 and C3, i.e. for the ratio of 2050 and the difference between the ratios, we do not observe any systematic differences in the means for our variables of interest. However, as this is just a comparison of means, we expect the regression analysis to shed more light on possible correlations.
Beliefs of demographic change
Prior beliefs 2020
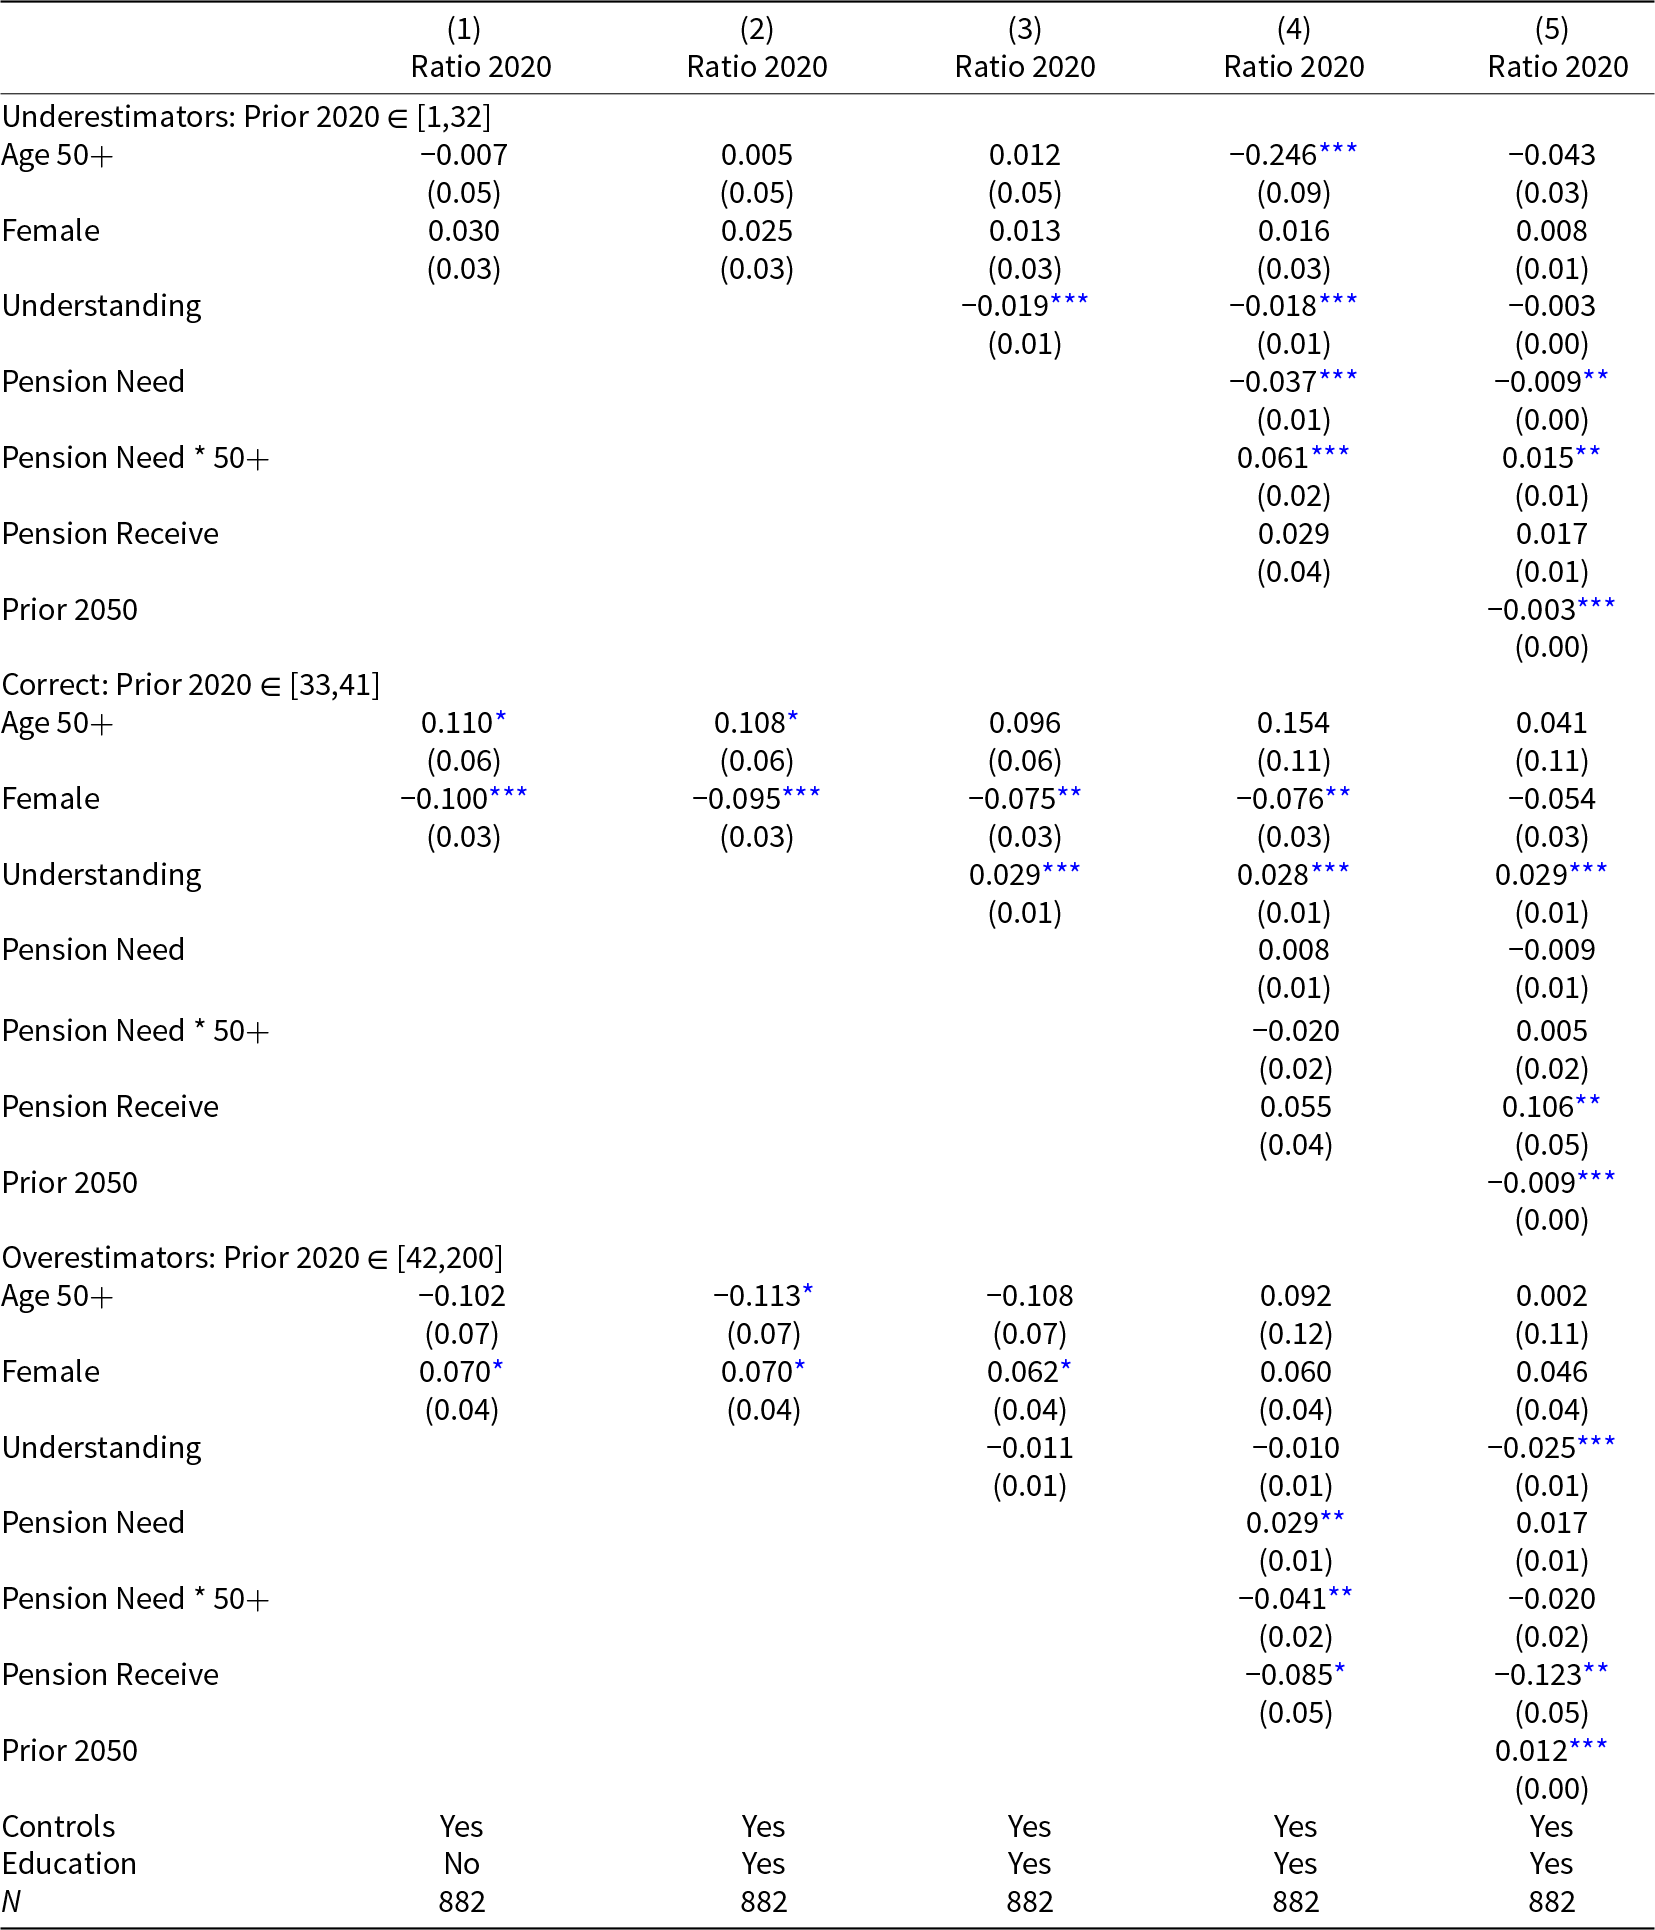
The marginal effects of our multinomial probit regression analysis for the prior beliefs of 2020 are shown in Table 2. The table is divided into three panels corresponding to underestimators, correct estimators, and overestimators. The range of prior beliefs for each category is given in square brackets.
Prior beliefs 2020

Notes: This table presents the marginal effects at means from our multinomial probit estimation. The outcome variable is the prior belief for 2020. Control variables include age, income, employment status, migration background, being married, living in East Germany. From column (2) onward, the regressions include having inherited/expecting to inherit ≥€100,000. Education captures various degrees. Detailed variable descriptions can be found in Appendix A. We employ weights to account for oversampling of respondents in East Germany. Robust standard errors in parentheses;
* p < 0.10, **p < 0.05, ***p < 0.01.
In Table 2, we observe that being female is associated with a significantly lower probability of correctly estimating the ratio for 2020 and a marginally significantly higher probability of overestimating it. This is in line with our hypothesis. Specifically, in the first four columns, being female is associated with a decrease in the probability of correctly estimating the ratio for 2020 by 7.5–10.1 percent and an increase in the probability of overestimating the ratio by 6.3–7.1 percent. In column (5), we add the prior belief for 2050 as a robustness check. The prior beliefs for 2020 and 2050 are highly correlated so it is not surprising that adding the prior belief for 2050 has a significant impact on all marginal effects in the model. We argue that adding the prior belief for 2050 allows us to capture unobservable characteristics that affect both prior beliefs. These unobservables could include, e.g., general optimism or pessimism about the future, as well as personality traits. Nevertheless, it is important to keep in mind that the prior beliefs for 2050 are highly endogenous. Therefore, we consider this specification only as a robustness check. In this case, being female loses its significance in the robustness check.
For the understanding index, we find a significantly positive correlation with correctly estimating the ratio for 2020, which is robust across all specifications in terms of sign, magnitude, and significance. This is also in line with our hypothesis. A one-unit increase in the index, that is one additional question answered correctly, is associated with a 2.8–2.9 percent increase in the probability of a correct estimate. Since this effect persists in the robustness check, we identify the understanding variable as a robust key factor in explaining prior beliefs for 2020. Respondents with a good understanding of the statutory pension insurance are likely to be able to process information about demographic change more efficiently and estimate the old-age dependency ratio more accurately, especially given the anchor value provided for 1990. Further evidence can be found in the panels for under- and overestimators. Understanding the statutory pension insurance is negatively related to both underestimating and overestimating the ratio for 2020. However, these effects are somewhat less robust.
In addition, we find that having informed oneself about one’s own retirement needs (Pension Need)Footnote 13 is correlated differently with estimates of the 2020-ratio for younger and older respondents. For those who are at least 60 years old,Footnote 14 it is associated with a decrease in the likelihood of overestimating the ratio for 2020 and an increase in the likelihood of underestimating it, compared to younger respondents who have informed themselves about their retirement needs (as shown by the interaction terms). Having done some research on retirement needs is thus associated with an increase in the probability of underestimating for older respondents. We can only speculate about the reasons. It is possible that older respondents who are aware of their future financial situation in retirement are those who have already actively taken measures to ensure a sufficient income. As a result, they may be less concerned and less informed about demographic change. Alternatively, they may try to convince themselves of a more positive outlook, especially if they have not yet sufficiently prepared for their old age or would not have the opportunity to react to a more adverse demographic development. For younger respondents, the future retirement income is much more uncertain so even those who have informed themselves about their retirement needs still need to keep up to date with information about the magnitude of demographic change. This seems to make it less likely for them to underestimate the ratio for 2020. The exact mechanisms, however, require further research.Footnote 15
Given that different generations are affected by demographic change to very different degrees, it seems plausible that beliefs about demographic change may vary systematically across generations. For this reason, we also conduct our analysis of prior beliefs separately for ‘young’ (<50 years) and ‘old’ (≥50 years) subsamples.Footnote 16 Table 3 shows the results of the subsample analysis.Footnote 17
Prior beliefs 2020 (by age)

Notes: This table presents the marginal effects at means from our multinomial probit estimation. The outcome variable is the prior belief for 2020. The first two columns show results for participants under 50 years old and the last two columns show results for participants 50 years or older. For information on control variables, see Table 2. We employ weights to account for oversampling of respondents in East Germany. Robust standard errors in parentheses;
* p < 0.10, **p < 0.05, ***p < 0.01.
We find that young women (relative to young men) are significantly more likely to underestimate the ratio for 2020, while older women (relative to older men) are significantly more likely to overestimate it. These results may indicate that the positive but smaller and less significant effect of being female that we found for the full sample (see Table 2, panel of overestimators) may be driven by the group of older respondents. A similar effect may be at play with respect to the understanding index. The index is only significant in the subsample of the old, with the same sign as in the full sample. Understanding the statutory pension insurance thus seems to be unrelated to knowledge of the old-age dependency ratio for younger respondents, while it is positively related to correctly estimating the ratio for older respondents, and negatively related to both underestimating and overestimating the ratio.
The subsample analysis confirms one of our previous findings: Older respondents who have informed themselves about their pension needs are more likely to underestimate the ratio in 2020, compared to their counterparts who are uninformed. In addition, we now observe that young respondents who have informed themselves about their pension needs are less likely to underestimate the ratio and more likely to overestimate it, compared to their uninformed peers. This is a new insight and may suggest that young respondents who have informed themselves about their pension needs are overwhelmed with information leading to an overestimation of the severity of demographic change. Given that this younger generation has permanent access to information and will be the most affected by demographic change, it is possible that these individuals may receive an overload of anxiety-driven information regarding demographic change, resulting in more pessimistic views when compared to those who remain uninformed. There is a vast amount of literature across disciplines suggesting that decision-making performance decreases once the information load becomes too large (Roetzel, Reference Roetzel2018). However, additional research is necessary to validate the mechanisms underlying our findings.
Difference between prior beliefs 2020 and 2050
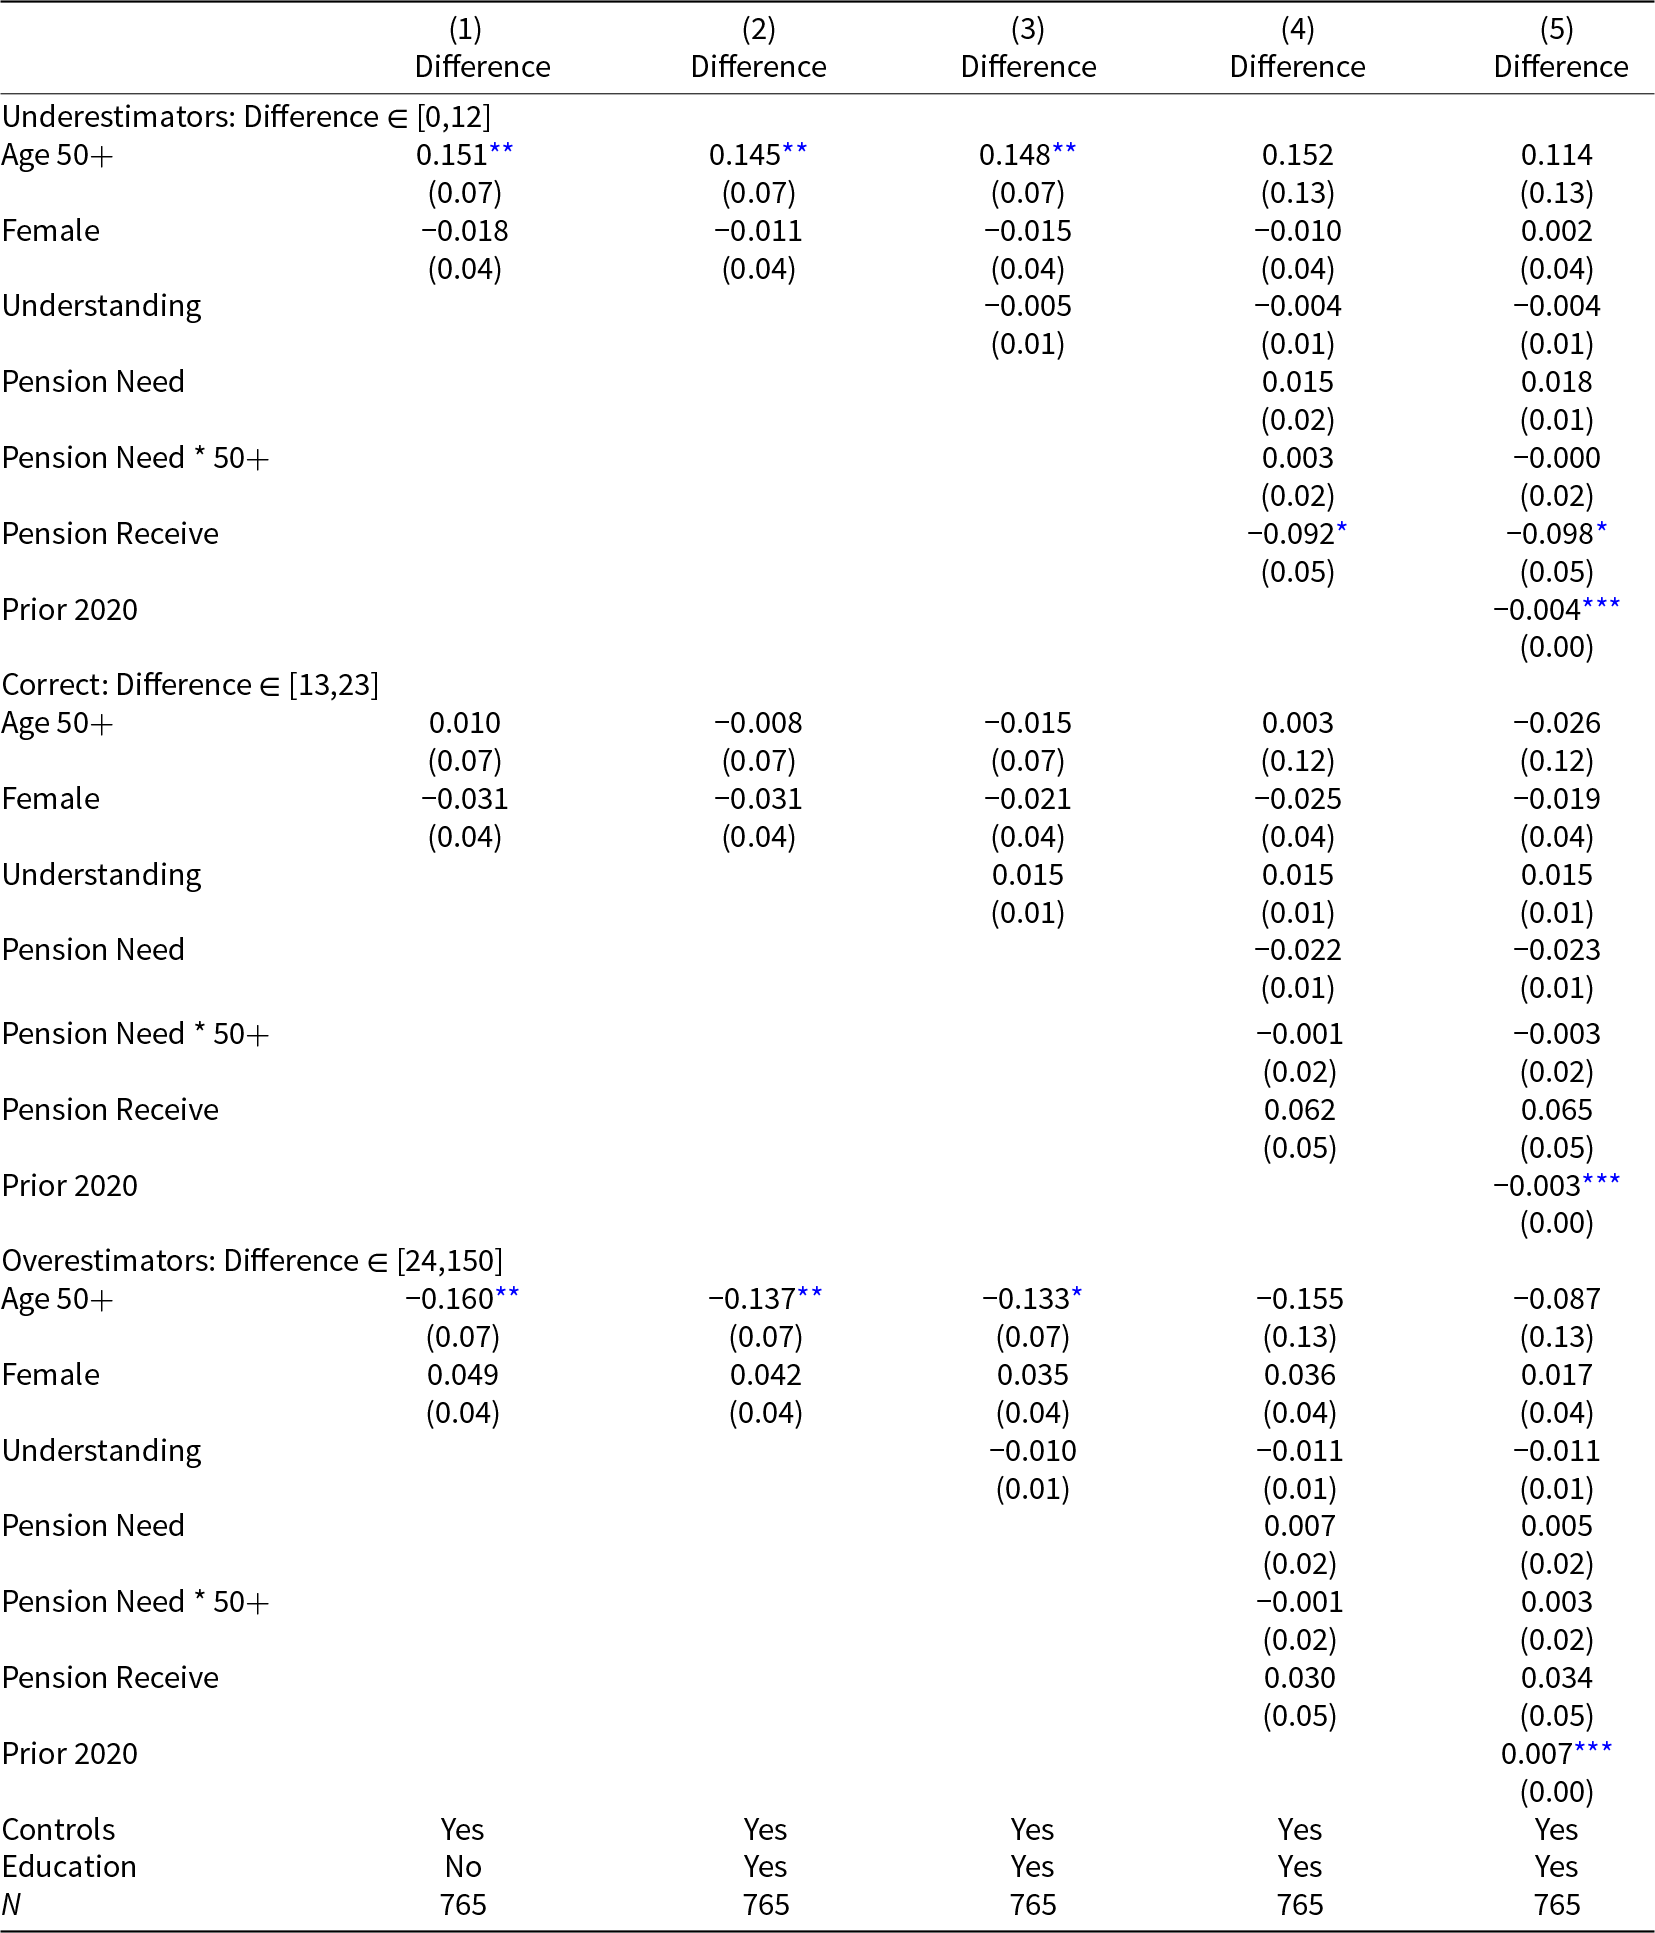
The explanation of individual prior beliefs for 2020 already provides some interesting insights. We also shed some light on individual prior beliefs for 2050 in Appendix B. In this section, we now apply the same methodology of a multinomial probit model to the difference in prior beliefs, which reflects the changes in the old-age dependency ratio that respondents expect to occur over time. To do this, we exclude those respondents who expect the old-age dependency ratio to fall over time, that is those with a negative value for diffi (see equation 1). This leaves us with a sample of 765 respondents, relatively evenly spread across the three groups. About 34 percent of respondents underestimate the difference, 36 percent overestimate it and 30 percent estimate it correctly, based on the ranges given in square brackets in Table 4.
Difference between prior beliefs

Notes: This table presents the marginal effects at means from our probit estimation. The outcome variable is the difference between the old-age dependency ratios, where respondents with a negative estimate for the difference have been excluded. For information on control variables, see Table 2. We employ weights to account for oversampling of respondents in East Germany. Robust standard errors in parentheses;
* p < 0.10, **p < 0.05, ***p < 0.01.
By focusing on the difference in beliefs about the old-age dependency ratios between 2020 and 2050, this analysis captures respondents’ expectations of change over time and ensures that variations in beliefs about the magnitude of change are appropriately accounted for in our analysis.
In contrast to the results for the prior beliefs for the 2020 ratio, understanding the German statutory pension insurance is no longer significantly correlated with the probability of correctly estimating the magnitude of demographic change. Similar to before, we observe different age effects for those who have informed themselves about their retirement needs. For respondents aged 60 and over, there is a significant decrease in the probability of correctly estimating the difference between the ratios. Conversely, they are significantly more likely to underestimate the difference. The effects are quite large. A one-unit increase in having informed oneself about the retirements needs is associated with a 6.4 percent lower probability of correctly estimating the difference between the ratios and a 9.3 percent higher probability of underestimating the difference. Both effects remain robust in terms of size and significance when controlling for prior beliefs for 2020.Footnote 18 This reinforces the evidence we have found above.
Motivated by these heterogeneities with respect to age, we run subsample regressions, again separating ‘young’ (<50 years) and ‘old’ (≥50 years) respondents. The results are shown in Table 5. We observe that young women are more likely than young men to underestimate the difference between the ratios, that is the magnitude of demographic change. We also find that older women are significantly less likely to underestimate the difference than older men and more likely to overestimate it. The marginal effects of young and older women are about the same magnitude and appear to cancel each other out in the full sample, where we observe no significant marginal effect of the female variable. Again, we find some evidence that understanding is not related to correctly estimating the difference for young respondents, while there appears to be a positive relationship for older respondents – although at a lower significance than in the models for the 2020 ratio.
Difference between prior beliefs (by age)

Notes: This table presents the marginal effects at means from our multinomial probit estimation. The outcome variable is the difference between the old-age dependency ratios, where respondents with a negative estimate for the difference have been excluded. The first two columns show results for participants under 50 years old and the last two columns show results for participants 50 years or older. For information on control variables, see Table 2. We employ weights to account for oversampling of respondents in East Germany. Robust standard errors in parentheses;
* p < 0.10, **p < 0.05, ***p < 0.01.
Belief updating
In the previous section, we analyzed which variables influence the formation of prior beliefs. We now focus on belief updating, that is whether and to what extent respondents update their beliefs about the old-age dependency ratios after receiving information about the true (projected) values of these ratios. We only use data from the information group since only respondents in that group – and not in the control group – received the information about the two old-age dependency ratios and were asked about their posterior beliefs. Respondents in the information group answered questions on pension policy preferences and sociodemographic characteristics between the information treatment and the elicitation of posterior beliefs so that we can analyze whether they were able to retain the information from the treatment throughout the survey. Our number of observations is reduced to about one-third.
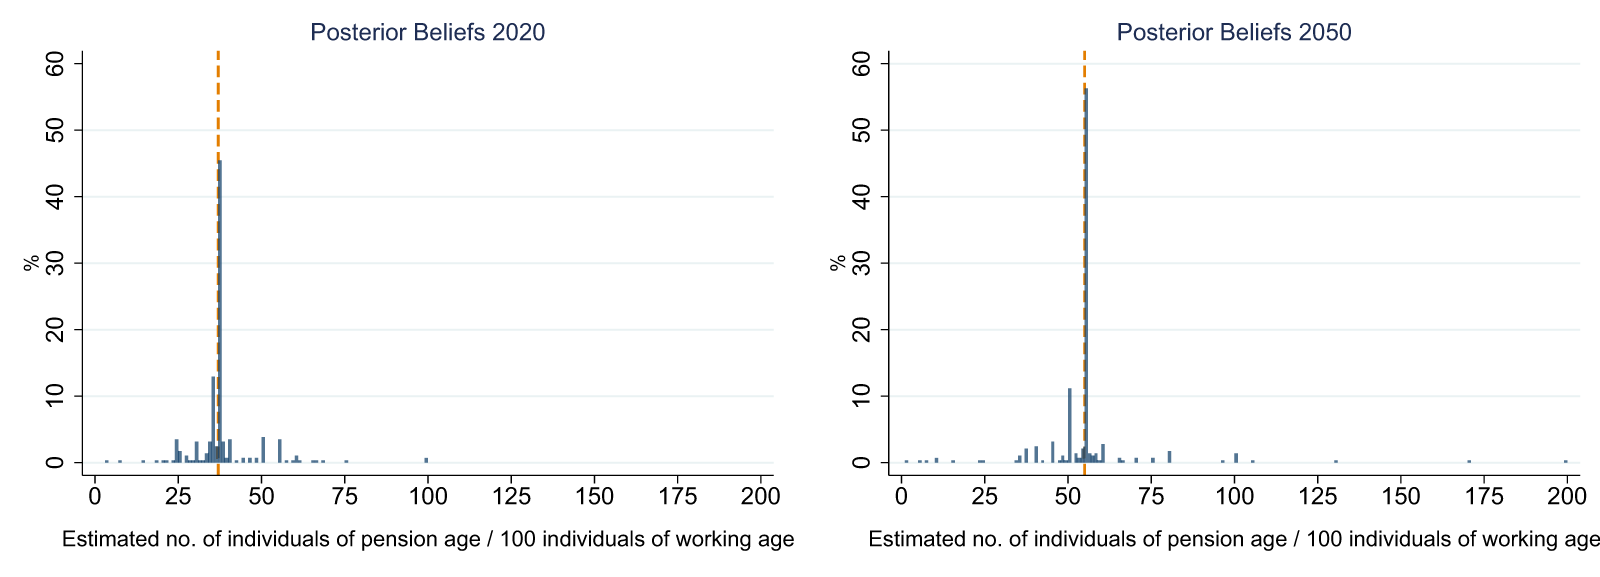
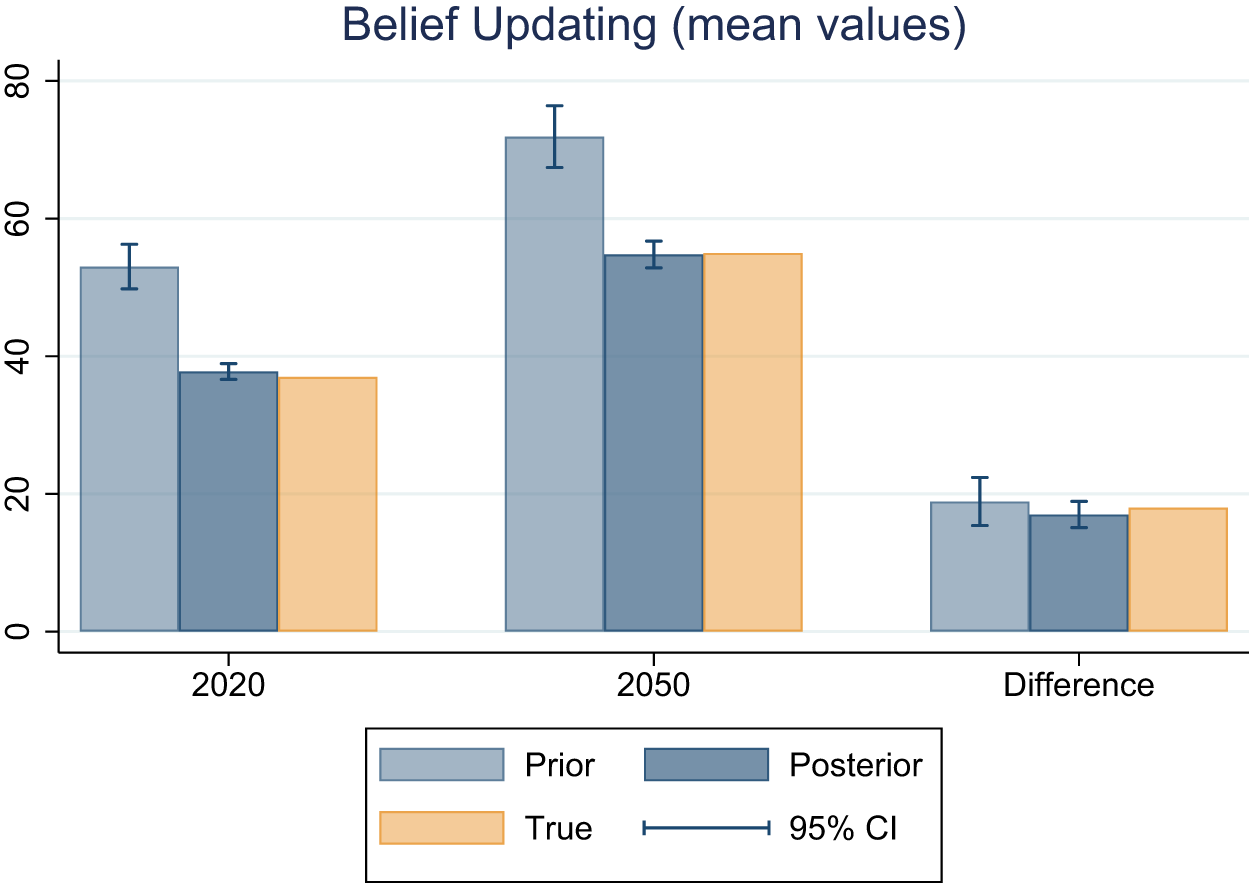
Figure 3 shows the distribution of posterior beliefs for the old-age dependency ratios in 2020 and 2050. As in Figure 1, the orange dashed line indicates the correct (projected) values. We find that the vast majority of participants were able to retain the information from the treatment throughout the survey. Only a small percentage of respondents reported posterior beliefs that were not (close to) the true (projected) values. Figure 4 then compares the means of the prior and posterior beliefs for 2020, 2050, and the difference between the two. It also includes the true (projected) values for reference. We can see that, as indicated above, respondents on average overestimate the prior beliefs for both 2020 and 2050. Since the degree of overestimation is similar for both ratios, the average prior difference is close to the true (projected) value. As already suggested in Figure 3, the average posterior beliefs are very close to the true (projected) values for both ratios and the difference. This finding is in line with other studies using information provision experiments (see Haaland et al., Reference Haaland, Roth and Wohlfart2023, for an overview), which also provide evidence for belief updating in the short run. The finding of belief updating can be seen as a measure of trust in the information provided and implies that information provision can help to correct biases.
Distributions of posterior beliefs. Notes: The figures (based on Schuetz et al. (Reference Schuetz, Uebelmesser, Baginski and Aprea2023), Figure 2) show the distribution of posterior beliefs of the old-age dependency ratios for 2020 and 2050, respectively, for the treatment group.

Belief updating. Notes: This figure presents the means for the prior and posterior beliefs as well as the true (projected) values for the old-age dependency ratios in 2020, 2050 and the difference between the two. Since only the treatment group was asked about posterior beliefs, all of these means are based on the treatment group only.

It should be noted, however, that our design does not allow us to distinguish explicitly between simple recall of the information and actual updating of respondents’ beliefs. One concern may be whether individuals actually believe in the expected future dependency ratio. However, we argue that the information effects found in Schuetz et al. (Reference Schuetz, Uebelmesser, Baginski and Aprea2023), which use the same data, point to belief updating, as it seems unlikely that respondents’ policy preferences would otherwise change. Put differently, if respondents did not believe the information we provided, they would not change their reform preferences in response to the information intervention.
To identify patterns in belief updating, we consider descriptive statistics and test for statistically significant differences based on prior beliefs (Tables 6 and 7) as well as based on gender, age, and understanding of the statutory pension insurance (Table 8).
Summary statistics for prior and posterior beliefs 2020

Notes: This table presents descriptive statistics of posterior beliefs for 2020 separately by underestimators, correct estimators and overestimators of the old-age dependency ratio in 2020.
* p < 0.10, **p < 0.05, and ***p < 0.01 indicate significant differences between the mean of the respective prior or posterior and 37, which is the true old-age dependency ratio in 2020.
Summary statistics for prior and posterior beliefs 2050

Notes: This table presents descriptive statistics of posterior beliefs for 2050 separately by underestimators, correct estimators and overestimators of the old-age dependency ratio in 2050.
* p < 0.10, **p < 0.05, and ***p < 0.01 indicate significant differences between the mean of the respective prior or posterior and 55, which is the projected old-age dependency ratio in 2050.
Belief updating

Notes: This table shows the means of prior beliefs, posterior beliefs, and belief updating by gender, age, and understanding of the pension system. For understanding, the sample was split based on the median of the understanding index (=8).
* p < 0.10, **p < 0.05, ***p < 0.01 indicate significant differences between the respective mean and 37 for Panel A and 55 for Panel B, which are the true (projected) old-age dependency ratios. Not shown in the table: Prior beliefs between men and women and between older and younger respondents differ significantly at the 5% level for both 2020 and 2050. For understanding, the difference between <median and ≥median is significant at the 10% level only for 2020.
Tables 6 and 7 provide more detailed statistics when respondents are differentiated by their prior beliefs. It can be seen that while the prior beliefs of the underestimators and overestimators differ significantly and substantially from the true (projected) ratios of 37 and 55 for 2020 and 2050, respectively, the posterior beliefs for both ratios are much closer to the true ratios. For example, the group of overestimators reduced their estimated ratio by an average of 27 units for 2020 and 35 units for 2050.Footnote 19 But for those who overestimated the 2020 ratio and those who underestimated the 2050 ratio, the posterior beliefs are still significantly different from the true (projected) values.
Table 8 provides a similar overview of prior and posterior beliefs and updating, but now considers subgroups based on some of our main explanatory variables, namely gender (male/female), age (<50/≥50) and the understanding of the statutory pension insurance (<median/≥median). Panel A shows the average prior and posterior beliefs and the difference between the two for 2020, while Panel B shows the same statistics for 2050. We test for significant differences between each subgroup’s mean and the respective true (projected) value, as indicated by the stars. While the prior beliefs of all subgroups were significantly different from the true (projected) values, we find no significant difference for the posterior beliefs. This suggests updating across all considered groups.
Despite (mostly) significant differences between subgroups in prior beliefs,Footnote 20 all groups – on average – updated their beliefs very close to the true (projected) ratios of 37 for 2020 and 55 for 2050. These results suggest that respondents in all subgroups were able to retain the information from the treatment. In addition, since all subgroups updated, our results indicate that the absolute magnitude of belief updating is determined by the magnitude of bias in prior beliefs. Those who held more biased prior beliefs (i.e. women, younger respondents, and those with below-median understanding), showed stronger belief updating.
Conclusion
We employ a three-step procedure to analyze beliefs about demographic change and identify factors that can explain the distribution of beliefs and belief updating. Our descriptive analysis shows that respondents tend to overestimate the old-age dependency ratios for both 2020 and 2050, i.e. the number of people of retirement age per 100 people of working age. However, when these ratios are combined to capture the magnitude of demographic change, beliefs are closer to the true (projected) value. That indicates that respondents have a more accurate idea of the magnitude of the projected change between 2020 and 2050. This finding is important for policymakers. When the change in the old-age dependency ratio is considered, it shows that people in Germany are aware of demographic change and its magnitude. This is an important prerequisite for understanding the challenges for social policy and, more broadly, for economic policy, and should make people more open to reforms that address these challenges. The observation that people tend to overestimate individual old-age dependency ratios points to a heightened sense of urgency.
Using multinomial probit models we analyze the prior beliefs for 2020 and 2050 individually as well as the difference between them, to capture the beliefs about demographic change. We find that understanding the German statutory pension insurance is a key factor in explaining the beliefs. A better understanding is associated with a significantly higher probability of correctly estimating the ratio for 2020 and 2050. Respondents who understand the statutory pension insurance may also find it easier to estimate demographic change, and vice versa. In addition, we control for education to ensure that the effect of understanding the statutory pension insurance is not just due to the respondents’ educational background.
We also find different age effects for respondents who have informed themselves about their retirement needs. Respondents aged 60 and above who have done some research on their retirement needs have a significantly higher probability of underestimating the ratio for 2020 as well as the difference between the ratios. In addition, this group is less likely to overestimate the ratio for 2050. None of these effects are observed for younger respondents. We suggest as a possible explanation that older respondents are less concerned about demographic changes if they have already (at least partially) prepared for their old age. Alternatively, they may try to ignore more adverse demographic developments if they have not yet sufficiently prepared for their old age. The exact mechanisms, however, require further research.
Motivated by these heterogeneities with respect to age, we rerun our analysis for subsamples of younger and older respondents. This analysis reveals that for young respondents, understanding the statutory pension insurance is not significantly related to beliefs about demographic change. However, for older respondents, a better understanding is associated with more correct beliefs about demographic change. Reflecting back on our full sample analysis, the subsample results suggest that the effect of the understanding index is driven by older respondents who are closer to retirement.
In the final step of our analysis, we examine how individuals update their beliefs in response to receiving information. Specifically, we provided one-third of the respondents with information about the true (projected) old-age dependency ratios for 2020 and 2050. Our results suggest that participants were able to make use of the information, as their posterior beliefs about the old-age dependency ratios are much closer to the true values than their initial prior beliefs. Those with more biased prior beliefs (i.e. women, younger respondents, and those with below-median understanding) showed particularly strong belief updating.
As that demographic change affects many policy areas including the labor market and social security systems, the need for reform in general increases as does the need for citizens to support these reforms. Being better informed about demographic change is a prerequisite for understanding the sometimes complex mechanisms that lead, for example, to labor shortages in certain sectors or calls for more subsidies for public health insurance – not to mention the increasingly widespread discussions on how to address the problems of the pension system. Since better informed citizens can be expected to vote more in favor of policies that improve sustainability (see, e.g. Naumann, Reference Naumann2017; Schuetz et al., Reference Schuetz, Uebelmesser, Baginski and Aprea2023), a better understanding of how well citizens are informed about demographic change and how they can benefit from the provision of additional information is of high policy relevance. This paper aims to take a first step in this direction as a basis for further research. In addition, beliefs about demographic change may affect pension provision behavior. For example, respondents who are more aware of demographic change may also save more for their retirement in the private pension pillar. This would imply that those who are better informed are also better prepared to face the consequences of demographic change. Future research should therefore look more closely at the relationship between beliefs about demographic change and pension provision behavior.
Acknowledgements
The authors thank Ann-Marie Sommerfeld for valuable support.
Funding statement
This work was funded by the Federal Ministry of Labor and Social Affairs (FIS.00.00011.19). Jana Schuetz acknowledges funding through The Hamrin Foundation, ref. nr. 2023-09.
Appendix
A Survey Structure and Variable Overview
A.1 Survey Structure
The survey starts with a short introduction (here translated to English):
‘Good day/ Good evening, my name is [Jane Doe]. I’m calling you from the social science survey centre IMK in Erfurt. On behalf of the Universities of Jena and Mannheim we are conducting a survey on the topic of “old-age provision”.’
In the next step, the interviewer asks to speak to the person with the next birthday in the household. This person is then informed, that the survey is about their personal opinion and that their telephone number has been randomly selected.
The following list shows the structure of the survey (parts relevant to this study are in bold). Section A.2 (‘Variable Overview’) details the variables used in this study. Section A.3 (‘Further Details’) provides additional information about the setup of the information provision experiment, including the elicitation of prior beliefs.
1. Screening questions (i.e. questions to ensure that our sample composition is fulfilling our restrictions and quotas)
2. Introductory questions about old-age provision
3. Questions on understanding
4. Questions on attitudes
5. Questions on behavior - Part 1: Retirement planning
6. Information provision experiment Part 1 – Prior beliefs (Control II & Information group) & Information provision
7. Questions on behavior – Part 2: Evaluation of pension policy measures
8. Further questions on old-age provision
9. Questions related to the COVID19 pandemic
10. Information provision experiment Part 2 – Prior beliefs (Control I)
11. Questions about sociodemographic characteristics
12. Information provision experiment Part 3 – Posterior Beliefs
At the end of the survey, respondents are asked whether there is anything else they would like to tell us and whether they agree to be contacted again for a follow-up survey.
A.2 Variable Overview
Descriptive overview of variables

Notes: This table presents detailed descriptions of our variables. The last column indicates at which point in the survey the respective variable was measured. The numbers refer to the survey structure on the previous page.
A.3 Further Details (cf. points 6 & 10 of the structure of the survey)
Wording of belief elicitation questions
Old-age provision in Germany is based on the idea that the working generation finances the pensions of people in retirement. Therefore it is important to look at the ratio of people of retirement age starting from 65 years of age to people of working age between 20 and 64 years of age. In the year 1990, there were 24 people of retirement age for every 100 people of working age.
What do you estimate: in 2020, how many people of retirement age are there for every 100 people of working age?
And what do you estimate: in 2050, how many people of retirement age will be there for every 100 people of working age?
Feedback + Information (Treatment group)
You have estimated xyz for 2020 and abc for 2050 [insert estimates here], the correct answers are 37 for the year 2020 and 55 for the year 2050. There are thus currently about three people of working age for every person of retirement age, and there will be more and more people of retirement age and fewer and fewer people of working age.
Estimation xyz (2020):
• Correct (33−41): So your estimate of xyz for the year 2020 was quite accurate.
• Overestimated (41<): So your estimate of xyz for the year 2020 was too high.
• Underestimated (<33): So your estimate of xyz for the year 2020 was too low.
Estimation abc (2050):
• Correct (51−59): So your estimate of abc for the year 2050 was quite accurate.
• Overestimated (59<): So your estimate of abc for the year 2050 was too high.
• Underestimated (<51): So your estimate of abc for the year 2050 was too low.
B Prior Beliefs 2050
The descriptive analysis has already shown that there is a larger dispersion of prior beliefs about the old-age dependency ratio for 2050 (see Figure 1). Therefore, we expect that there is more randomness in these beliefs and that our regression model will not be able to explain them as well as the ones for 2020.
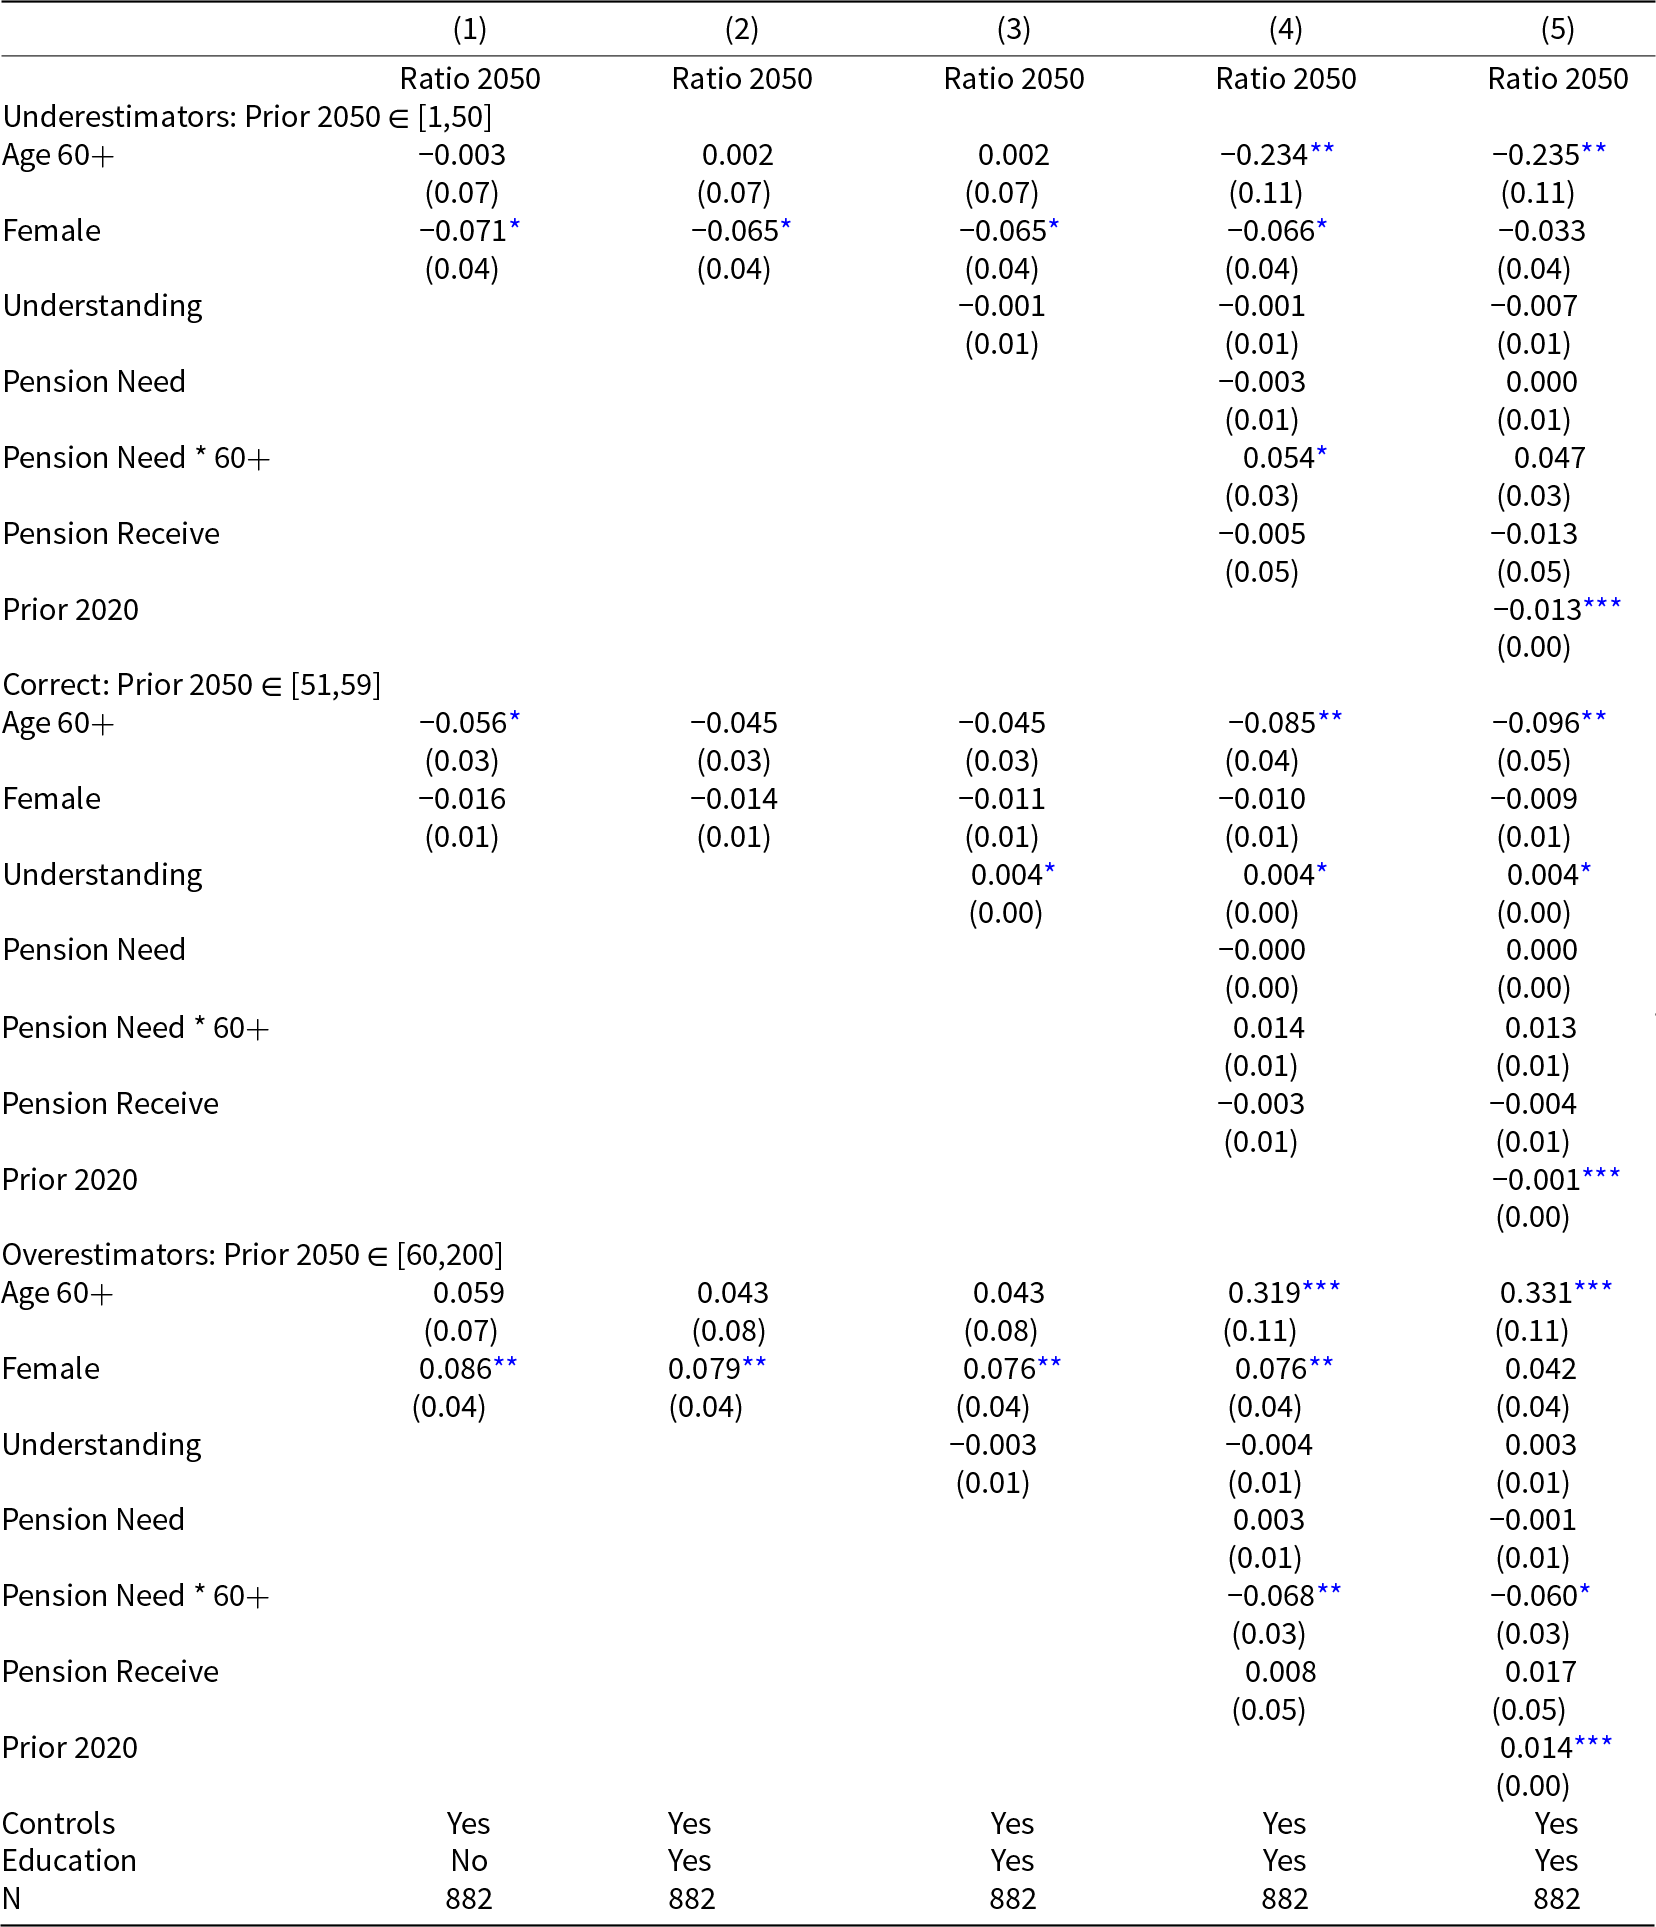
Table B1 is again divided into three panels corresponding to underestimators, correct estimators, and overestimators. The range of prior beliefs for each category is, as before, given in square brackets.Footnote 21 As for the 2020 ratio, we find that a better understanding of the statutory pension insurance is associated with a higher probability to correctly estimate the 2050 ratio, although with an effect size which is less economically relevant than before.
Multinomial probit results – prior beliefs 2050

Notes: This table presents the marginal effects at means from our multinomial probit estimation. The outcome variable is the prior belief for 2050. For information on control variables see Table 2. Robust standard errors in parentheses;
* p < 0.10, **p < 0.05, ***p < 0.01.
Furthermore, the marginal effect of the prior beliefs for 2020 is slightly negative and significant at the 1 percent level for correct estimators. Thus, a higher prior belief for 2020 is associated with a lower probability of correctly estimating the ratio for 2050. This observation is in line with the marginal effects of the prior belief for 2020 in the panels of underestimators and overestimators. A higher prior belief for 2020 is associated with a significantly lower probability of underestimating the ratio for 2050 and a significantly higher probability of (also) overestimating the ratio for 2050.
We also find that being female is associated with a significantly lower (higher) probability of underestimating (overestimating) by 6.5–8.6 percent. Again, being female does not remain significant in the robustness check. Regarding the retirement needs we find similar effects as for the prior beliefs for 2020. The above explanation still seems plausible: the older generation, which has actively gathered information about its retirement needs, is less concerned about and, in general, less affected by demographic change due to its older age, and is, therefore, more likely to underestimate the old-age dependency ratio.
C Descriptive Statistics
Summary statistics compared to SOEP data

Notes: This table compares descriptive statistics of some of our variables with related variables in the data of the German Socio-Economic Panel from wave v38 (Socio-Economic Panel (SOEP), 2023). While we do not use the ‘Risk taking’ and ‘Worried about pension’ variables in our analysis, we still want to show how our participants compare to the SOEP sample in these variables. ‘Risk taking’ measures the general willingness to take risks in the SOEP questionnaire (0: absolutely not willing to take risks – 10: very willing to take risks). Our survey item differs slightly by asking about the willingness to take risks in matters related to money and finance (0: not at all willing to take risks – 10: very willing to take risks). The ‘worried about pension’ variable captures the respondents’ concerns about their own pension in both questionnaires (1: very concerned – 3: not concerned). # In the SOEP column ,“other degree” is the reference category for the education variables. About 10% of the SOEP sample fall into this category. † This question was answered by n=11,179 respondents in the SOEP sample.
Summary statistics by prior beliefs 2050

Notes: This table presents descriptive statistics of our explanatory variables separately for underestimators, correct estimators, and overestimators of the old-age dependency ratio in 2050. For the income and education variables, (R) indicates the reference group in our regressions.
* p < 0.10, **p < 0.05, ***p < 0.01 indicate significant differences between the respective mean and the mean of the same variable for correct estimators.
Summary statistics by difference between priors

Notes: This table presents descriptive statistics of our explanatory variables separately for underestimators, correct estimators, and overestimators of the difference in old-age dependency ratios. For the income and education variables, (R) indicates the reference group in our regressions.
* p < 0.10, **p < 0.05, ***p < 0.01 indicate significant differences between the respective mean and the mean of the same variable for correct estimators.
Distribution of Beliefs about Demographic Change between 1990 and 2020.
Notes: The figure shows the distribution of the estimated difference in the old-age dependency ratio between 1990 (anchor provided to all respondents) and 2020. We only show observations where the estimated change is greater than −50 and less than 50.

D Robustness Checks (50+ interaction)
Prior beliefs 2020 (with 50+ interaction)

Notes: This table presents the marginal effects at means from our multinomial probit estimation with a ‘50+’ interaction term (instead of 60+). The outcome variable is the prior belief for 2020. For information on control variables, see Table 2. We employ weights to account for oversampling of respondents in East Germany. Robust standard errors in parentheses;
* p < 0.10, **p < 0.05, *** p < 0.01.
Difference between prior beliefs (with 50+ interaction)

Notes: This table presents the marginal effects at means from our probit estimation with a ‘50+’ interaction term (instead of 60+). The outcome variable is the difference between the old-age dependency ratios, where respondents with a negative estimate for the difference have been excluded. For information on control variables, see Table 2. We employ weights to account for oversampling of respondents in East Germany. Robust standard errors in parentheses;
* p < 0.10, **p < 0.05, ***p < 0.01.
E Experimental Setup
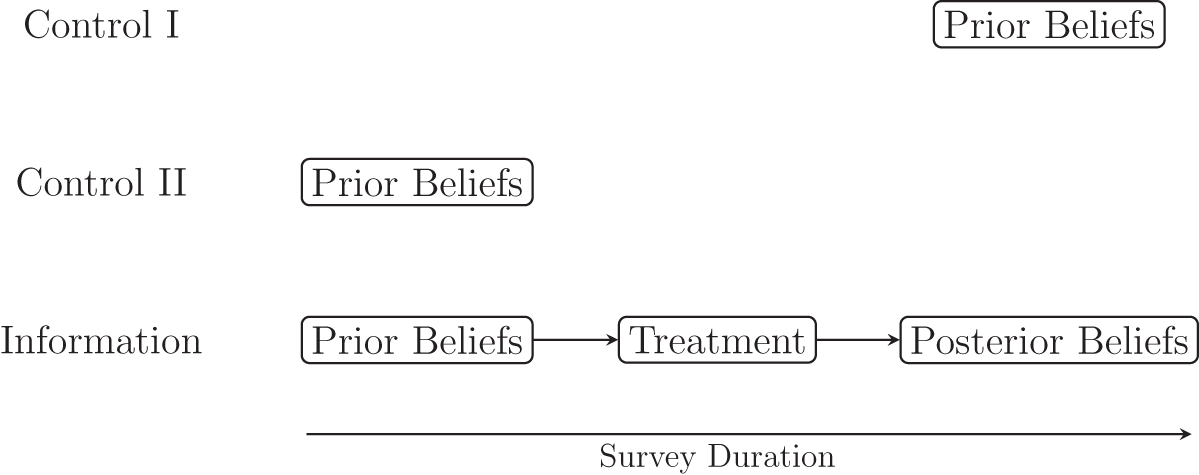
The survey has been designed with two control groups and one treatment group (see Schuetz et al., Reference Schuetz, Uebelmesser, Baginski and Aprea2023, which uses the same dataset as this paper). This setup is illustrated in Figure E.1.
Survey groups.
Notes: This figure shows when in the survey our different groups responded to the questions about their prior beliefs and, where applicable, their posterior beliefs.

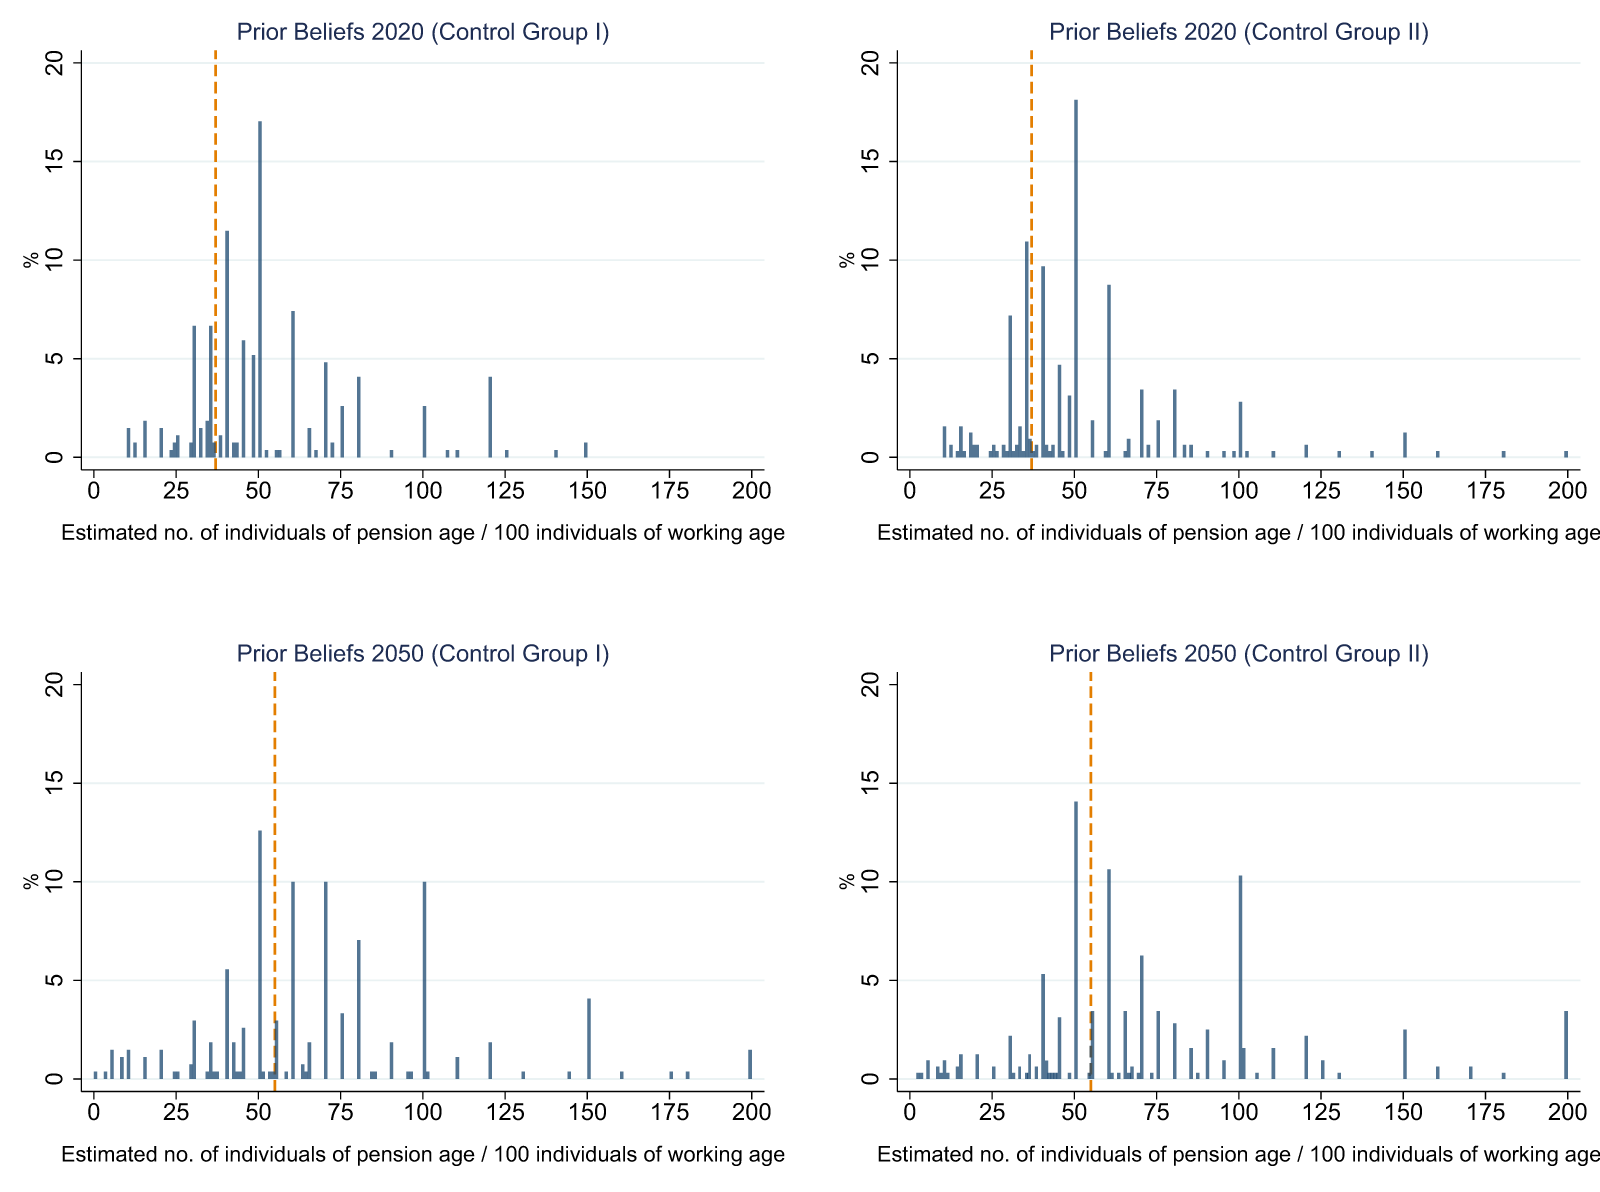
In all three groups, participants were asked about their prior beliefs. The key distinction between the two control groups lies in the timing of this elicitation: One group is asked about their prior beliefs toward the end of the survey, the other at an earlier stage. The information group is also asked about their estimates early. As there is no reason to expect differences in prior beliefs between the two control groups due to the different timing of their elicitation, we pool respondents from these two groups in this paper. Figure E.2 shows that the distribution of prior beliefs is indeed qualitatively similar between the two control groups, a result that we further confirm through t-tests.
This observation also reduces concerns about experimenter demand. While this is less of a concern for respondents of control group II and the treatment group, as their beliefs about demographic change are elicited earlier in the survey, it may be more relevant for respondents in control group I, who are asked about their prior beliefs later in the survey. Therefore, they may have a different perception of what the study is about than those in control group II or the treatment group. If experimenter demand was a concern, this may affect how they answer the questions about their prior beliefs. However, the lack of significant differences in prior beliefs between the experimental groups alleviates this concern.
To simplify the presentation of the experimental design in this paper, we have combined the two control groups into a single control group. This makes the analysis clearer and easier to follow.
Distribution of prior beliefs in both control groups.
Notes: This figure shows the similarity in the distribution of prior beliefs between the two control groups. t-tests confirm that the differences are not significant.


 Open access