


In previous chapters we focused on the social structure and social context of street segments. We defined the street segment as a social unit, conceptualized as a microcommunity with its own unique characteristics that can be examined and modeled. In Chapters 4 and 5, we examined what impacts street-level characteristics such as crime and informal social control. But in examining victimization, we take a somewhat different approach to understanding the importance of social structure and social context at the street-segment level. One reason for this is that we did not set out to do a victimization survey of the streets we studied. Such a survey would have required we collect much larger samples, since victimization is a relatively rare phenomenon at the individual level.Footnote 1 At the same time, the study of victimization has predominately been conducted at the individual level – identifying characteristics of individuals that help explain their likelihood of experiencing victimization problems (Hindelang et al., Reference Hindelang, Gottfredson and Garofalo1978; Kennedy and Forde, Reference Kennedy and Forde1990; Miethe and Meier, Reference Miethe and Meier1990; Reisig and Golladay, Reference Reisig and Golladay2019; Schreck et al., Reference Schreck, Wright and Miller2002; see also Meier and Miethe, Reference Miethe and McDowall1993). A number of scholars have also asked how neighborhoods or communities impact the risk of individual victimization (Lauritsen, Reference Lauritsen2001; Lauritsen and Carbone-Lopez, Reference Lauritsen and Carbone-Lopez2011; Miethe and McDowall, Reference Miethe and McDowall1993; Mustaine and Tewksbury, Reference Mustaine and Tewksbury1998; Rountree et al., Reference Rountree, Land and Miethe1994; Sampson and Wooldredge, Reference Sampson and Wooldredge1987; Turanovic et al., Reference Turanovic, Pratt and Piquero2018). In this chapter, we want to extend this interest in victimization to the influence of the street segment. What characteristics of street segments are related to risks of victimization once we have accounted for individual-level measures?
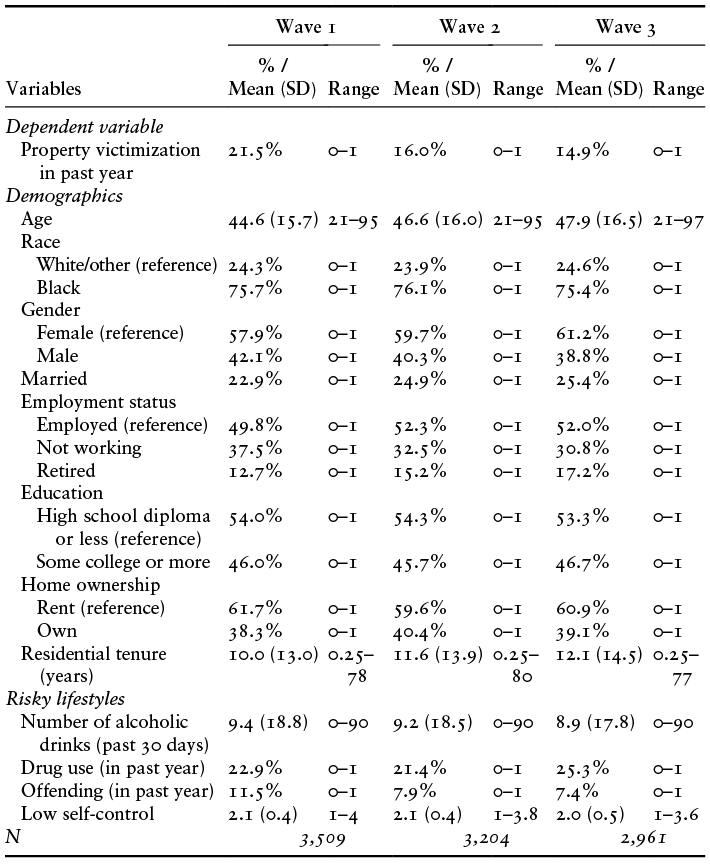
In examining this question, we do not look at violent crime victimization.Footnote 2 In our sample, a resident being a victim of a violent crime occurs in only about 4.5% of the cases in each wave of our survey (see Table A6.1). In turn, roughly 40% of these violent victimizations did not occur on the street segment the resident lives on. This means that about 2.7% of our respondents experienced a violent victimization on their street in the past year. Accordingly, the number of residents in our sample in each wave that have been the victim of a violent crime on their street in the last year ranges between 80 and 100 individuals out of more than 3,000 surveys in each wave. This number of victims per wave constrains our ability to develop stable models, especially given the number of possible covariates at the individual- and street-levels. At the same time, between 14.9 and 21.5% of the households in each wave in our sample have experienced a property crime victimization over the last year (see Table 6.1). This provides a more robust sample for examining the impacts of street-level characteristics on household victimization while accounting for individual-level characteristics of respondents.
We begin the chapter by discussing how social disorganization and routine activity theories have been applied to risks of victimization. We then turn to the characteristics of individuals that have long been seen as key to understanding victimization, and then to our analyses of property crime victimization across the three waves of our data. Our findings strongly support our interest in the impact of informal social control on crime, in this case, at the household-level. But they also reinforce the long-standing interest of criminologists with individual-level characteristics that influence risks of victimization.
6.1 Theories of Victimization and the Role of Place
Social disorganization theory proposed by Shaw and McKay (1942 [Reference Shaw and McKay1969]) was originally developed to explain delinquency among youth in neighborhoods, but in fact, many tests of social disorganization theory use self-reported victimization across age groups from survey data as a main outcome. Theoretical tests have either analyzed individual victimization aggregated to a community-level, often census tracts, to capture victimization or “crime” rates, or by using multilevel modeling approaches to estimate individual victimization nested within communities. For instance, Sampson and Groves’ (Reference Sampson and Groves1989) used aggregate measures of victimization from the British Crime Survey to measure neighborhood crime rates (also see Lowenkamp et al., Reference Lowenkamp, Cullen and Pratt2003; Veysey and Messner, Reference Veysey and Messner1999). Browning et al. (Reference Browning, Feinberg and Dietz2004) also used violent victimization of anyone in a respondents’ household to measure neighborhood violence in their test of collective efficacy and the role of social networks. In a replication study of Sampson et al.’s (Reference Sampson, Raudenbush and Earls1997) collective efficacy theory in Queensland, Australia, Mazerolle et al. (Reference Mazerolle, Wickes and McBroom2010) used self-reported victimization at the individual-level and multilevel models to assess the impact of collective efficacy at the community-level. These studies have generally found that informal social control measured as collective efficacy has strong impacts on victimization at the community level.
While crime and victimization are sometimes used interchangeably, we think it is important to acknowledge that crime and victimization do not necessarily mean the same thing at the street-segment level. For example, there may be no clear victim associated with some crimes that generate calls for service or crime incidents, such as drug sales, so some streets may have higher levels of crime, but not victimization. Additionally, by using official data like crime calls or incidents, we do not know who experienced the victimization as it relates to the street – are they residents or visitors? We know people are victimized in their neighborhood, close to home (Lauritsen, Reference Lauritsen2001), but that may not necessarily be the street where they live, and as we will discuss shortly, lifestyle theories of victimization typically focus on the activities individuals engage in away from home. In this chapter, we focus only on property victimization experienced by residents of our survey, which by definition occurs at residents’ homes.
The predominate way of thinking about victimization among scholars is to focus on the role of the victim and their individual characteristics and lifestyles to explain differential risk for victimization (Hindelang et al., Reference Hindelang, Gottfredson and Garofalo1978; Reisig and Golladay, Reference Reisig and Golladay2019; Schreck et al., Reference Schreck, Stewart and Osgood2008). As routine activity theory has been used to inform opportunity theories for crime events, lifestyle theories, also drawn from routine activity theory, are used to understand victimization of individuals (Cohen and Cantor,Reference Cohen and Cantor1981; Kennedy and Forde, Reference Kennedy and Forde1990; Mustaine and Tewksbury, Reference Mustaine and Tewksbury1998; Sampson and Wooldredge, Reference Sampson and Wooldredge1987; also see Pratt and Turanovic, Reference Turanovic, Reisig and Pratt2015). It is important to note that such theories are generally more concerned with violent crime victimization than property crime victimization but nonetheless have potential implications for understanding property crime victimization on street segments.
Lifestyles influence how individuals spend their time, the places they visit such as going to work or the gym, and the people they come into contact with through their daily activities. Accordingly, one’s lifestyle and routines influence whether one becomes a suitable target in the crime-event triangle. Those who engage in more risky lifestyles, such as being out at night, visiting bars and drinking, using drugs, or participating in criminal behavior, are more likely to be in places where personal victimization is more likely to occur and thus be victims of crime (Berg et al., Reference Berg and Loeber2012; Felson and Burchfield, Reference Felson and Burchfield2004; Lauritsen et al., Reference Lauritsen, Sampson and Laub1991; Lauritsen and Rezey, Reference Lauritsen and Rezey2018; Turanovic and Pratt, Reference Turanovic and Pratt2014). On the other hand, those who stay at home and lead more conventional lifestyles are less likely to be victims of violent crime (Bunch et al., Reference Bunch, Clay-Warner and Lei2015; Hindelang et al., Reference Hindelang, Gottfredson and Garofalo1978). Early tests of lifestyle theory (Hindelang et al., Reference Hindelang, Gottfredson and Garofalo1978) relied on demographic measures as proxies for lifestyles (Hindelang et al., Reference Hindelang, Gottfredson and Garofalo1978). For example, this research has found that age, race, gender, working, being married, or having children impact how, with whom, and where an individual spends their time, subsequently altering their risk of victimization (Arnold et al., Reference Arnold, Keane and Baron2005; Bunch et al., Reference Bunch, Clay-Warner and Lei2015; Felson, Reference Felson1987; Hindelang et al., Reference Hindelang, Gottfredson and Garofalo1978; Kennedy and Forde, Reference Kennedy and Forde1990; Cohen et al., Reference Cohen, Kluegel and Land1981).
For property crime at one’s residence or on one’s street, routines and lifestyles play a role by influencing the amount of time an individual spends at home or away from home, so the risk for victimization may have little to do with the type of activities an individual engages in and more about the environmental context of the place. Certain places, such as crime hot spots, may expose individuals and their property to risky environments that lack capable guardians, have a greater presence of motivated offenders, and targets for victimization that are perceived as more suitable (Berg and Loeber, Reference Berg, Stewart, Schreck and Simons2011; Mustaine and Tewksbury, Reference Mustaine and Tewksbury1998; Osgood et al., Reference Osgood, Wilson, O’Malley, Bachman and Johnston1996). At the same time, residents of these streets may have few desirable goods and spend more time at home and on the street, while on more advantaged streets, residents have more valuable goods and leave homes unattended for work and activities putting their property at risk for victimization. Aside from these individual characteristics, the environmental context is particularly relevant to property crimes such as burglary and vandalism where offenders assess the opportunity structure of the place in their decision-making process (see Bernasco, Reference Bernasco2010; Cohen and Cantor, Reference Cohen and Cantor1981; Rountree et al., Reference Rountree, Land and Miethe1994; Wilcox et al., Reference Wilcox, Madensen and Tillyer2007). The ability to study the influence of street conditions on victimization has been limited due to a lack of data at the micro geographic level.
Beyond individual characteristics and lifestyles, research has examined the impact of structural and social characteristics of communities, building and land use features of places that provide opportunities for crime, and the characteristics and behaviors of individuals on victimization through multilevel modeling (Lauritsen, Reference Lauritsen2001; Miethe and McDowall, Reference Miethe and McDowall1993; Rountree et al., Reference Rountree, Land and Miethe1994; Sampson and Wooldredge, Reference Sampson and Wooldredge1987; Turanovic et al., Reference Turanovic, Pratt and Piquero2018; Vélez, Reference Vélez2001). As a result, there have been numerous attempts to integrate social disorganization and routine activities theories, particularly regarding how characteristics of communities impact the convergence of suitable target with an offender where there is a lack of guardianship (Jones and Pridemore, Reference Jones and Pridemore2019; Shen and Andresen, Reference Shen and Andresen2021; Smith et al., Reference Smith, Frazee and Davison2000). Following social disorganization theory, victimization is more likely to occur in neighborhoods defined by a lack of informal social control and an inability of residents to regulate behavior – often a characteristic of structurally disadvantaged communities (Bursik and Grasmick, Reference Bursik and Grasmick1993; Kornhauser, Reference Kornhauser1978; Shaw and McKay, 1942 [Reference Shaw and McKay1969]).
In this context, neighborhoods or streets characterized by social disorganization and a lack of informal social control can influence the convergence of motivated offenders, suitable targets, and guardianship in various ways (Kennedy and Forde, Reference Kennedy and Forde1990; Sampson and Wooldredge, Reference Sampson and Wooldredge1987; Smith and Jarjoura, Reference Smith and Jarjoura1988). For instance, high levels of informal social control in a community would imply greater capable guardianship, such as those watching out for neighbors’ homes and intervening in issues on the block (Jones and Pridemore, Reference Jones and Pridemore2019; Weisburd et al., Reference Weisburd, Groff and Yang2012). Residential mobility and racial/ethnic heterogeneity can weaken social ties, hindering capable guardianship, as residents are less willing to communicate with neighbors and intervene in problems (Miethe and McDowall, Reference Miethe and McDowall1993; Osborn and Tseloni, Reference Osborn and Tseloni1998; Saegert and Winkle, Reference Saegert and Winkel2004; Yuan and McNeeley, Reference Yuan and McNeeley2016).
Family disruption and unsupervised youth are also characteristics of socially disorganized communities, which can influence the number of motivated offenders in a neighborhood (Smith, Frazee, and Davison, Reference Smith, Frazee and Davison2000). Additionally, economic need and subcultures in disadvantaged communities may support more deviant lifestyles, where involvement in crime can be a way to support oneself or maintain social status, subsequently increasing the risk of victimization in these communities (Berg and Loeber, Reference Berg, Stewart, Schreck and Simons2011; Jennings et al., Reference Jennings, Higgins, Tewksbury, Gover and Piquero2010; Pyrooz et al., Reference Pyrooz, Moule and Decker2014). In previous chapters we noted that residents recognized the role that drug dealing played in providing status and addressing economic needs for some people in the community.
The overlap of theories in these examples is straightforward, but the role of target suitability is more complex, as homes in more socioeconomic advantaged communities may have more desirable goods and be left unattended for long periods of time as residents go to work with predictable hours; thus, for motivated offenders it is more reward with less risk (Cohen and Cantor, Reference Cohen and Cantor1981; Cohen and Felson, Reference Cohen and Felson1979; Justus and Kassouf, Reference Justus and Kassouf2013; Miethe and McDowall, Reference Miethe and McDowall1993). Cohen and Cantor (Reference Cohen and Cantor1981) found a parabolic relationship between income and burglary where the highest and lowest income groups experienced higher rates of burglary victimization. In a more recent study, Bunch et al. (Reference Bunch, Clay-Warner and Lei2015) found a positive relationship between income and personal theft, and a negative relationship between income and violence. At the neighborhood level, Wickes et al. (Reference Wickes, Hipp, Sargeant and Mazerolle2017) found that affluence was positively related to property victimization, but only when guardianship was lower (i.e., people going to work during the day).
We could not identify studies that examined the role of social context of micro geographic places in the victimization of residents. Jones and Pridemore (Reference Jones and Pridemore2019) had several measures at the street-segment level, but again they were collected from official and administrative data. Data from residents have not been available to researchers in the past, and we suspect that many scholars in this area would argue that community context, and not the street segment, is the primary geographic unit for understanding spatial impacts on victimization. But our work so far has emphasized the importance of street-level characteristics, particularly informal social control, and we wanted to see whether such street-level characteristics influence risks of property crime victimization.
6.2 The Samples Used in Our Analyses
Unlike our analyses in Chapters 4 and 5 that examine the impact of wave 1 characteristics on later outcomes in wave 3, the analyses in this chapter are cross-sectional. While we prioritized interviewing the same residents across waves of the study, in the time between wave 1 and wave 3, roughly five years, we found that many individuals had moved or were unavailable for interviews, despite the fact that we returned to their addresses as many as twenty-eight times. In such cases we randomly resampled households which allowed us to maintain a robust sample for describing street segments, but only about 20 percent of the respondents from wave 1 also participated in the study in wave 3. The much-reduced sample of people across waves, and the relatively low base rates of victimization more generally, led to our decision later to analyze the data cross-sectionally for each wave. While this approach allowed us to analyze larger samples, it constrains our ability to assume causality as compared to our analyses in Chapters 4 and 5. At the same time, we conduct a separate analysis for each wave, which allows us to see whether the findings are consistent across waves.
6.3 Modelling Risk of Property Crime Victimization
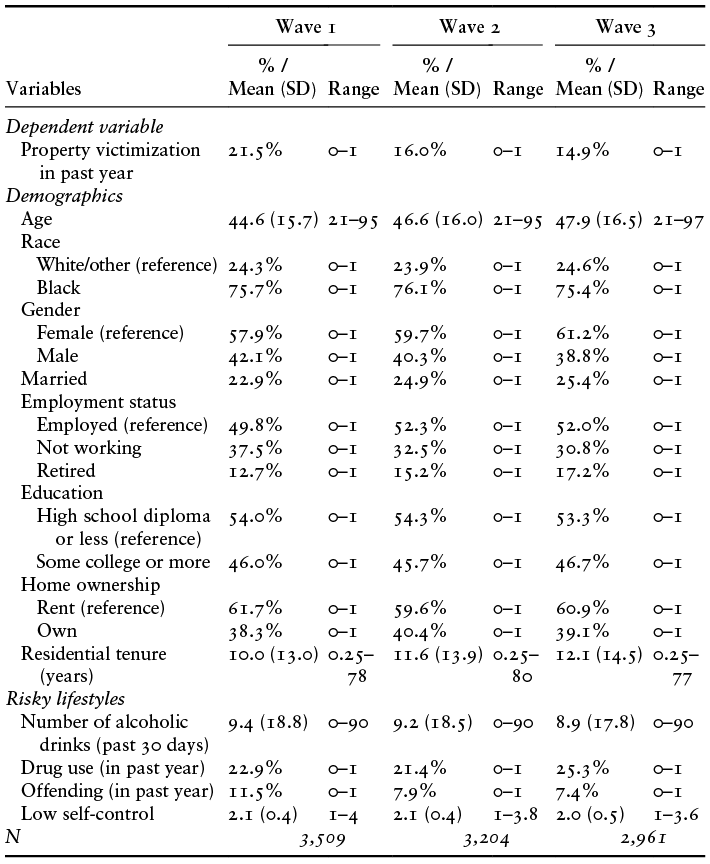
Since we are interested in the role of street-level factors in victimization we examine only property victimization which occurs at dwelling units on the street segment. The survey included two questions about property victimization. The first asked whether anyone had broken into their home in the past year, and the second asked whether anyone had stolen something from their porch, yard, driveway, or somewhere else outside their home in the past year, which we combined for a single binary measure. In the first wave about 22% of the sample experienced property crime victimization at their household, in the second wave 16%, and in the third wave 15% (see Table 6.1).
Using the covariates at the street-level from previous chapters that capture aspects of opportunity as well as social disorganization and collective efficacy (for descriptive statistics of these variables, see Table 4.2), we examine the impact of street characteristics on individual property victimization using multilevel logistic models with three levels that account for the nesting of individuals on street segments and the nesting of street segments within communities.Footnote 3 Additionally, we control for individual characteristics based on existing research on lifestyles and victimization discussed earlier.
We examine common demographics such as age, race, and gender, as well as marital status, work status, and education level. These individual characteristics also serve as proxy variables for more “conventional” lifestyles, such as someone who has a college degree, is working full-time, and married, which can impact routines and the extent to which residences are left unattended. They also can reflect the socioeconomic status of residents. We include whether the resident owns or rents their property as well as their residential tenure on the street to capture the residents’ relationship with their home and the street as distinct measures.Footnote 4 Finally, we include four measures that relate to individual risky lifestyles – drinking behavior, drug use, offending behavior, and low self-control.
To measure drinking behavior, we asked survey respondents how many days they drink alcohol in the average month, followed by a question on how many drinks they have on a typical day when they drink. We then calculated the total number of drinks the individual consumes in the average month.Footnote 5 In terms of drug use, respondents were asked whether they had ever used marijuana, powder cocaine, crack cocaine, heroin, methamphetamine, ecstasy, and illegal use of prescription drugs. If they responded positively to ever using the drug, they were asked if they used the drug in the last twelve months. Combining all types of drugs, we created a binary measure for any drug use in the past twelve months (1 = yes; 0 = no). Offending was also measured using multiple items of self-reported offending in the past twelve months adapted from Huizinga et al.’s (1991) Self-Reported Offending scale.Footnote 6 If the respondent answered positively to doing any of the listed offenses, they were coded as 1 and 0 if not. Lastly, a five-item self-control scale is included in our analyses as prior research has found that those with low levels of self-control are at greater risk of victimization (Bunch et al., Reference Bunch, Clay-Warner and Lei2015; Forde and Kennedy, Reference Forde and Kennedy1997; Schreck et al., Reference Schreck, Wright and Miller2002; Turanovic and Pratt, Reference Turanovic and Pratt2014). The items included things like “I do certain things that are bad for me, just because they are fun,” “pleasure and fun sometimes keep me from getting work done,” and “sometimes I can’t stop myself from doing something, even if I know it is wrong.” Responses were summed and averaged across the five items to create an individual mean score where higher values represent lower levels of self-control (see Table A6.3 for a list of all items and reliability statistics). Table 6.1 provides the means and standard deviations for the individual-level measures we include in our analyses.
Across the three waves of data collection, we see similar sample characteristics. The mean age of our sample in wave 1 was 44.6, 46.6 in wave 2, and 47.9 in wave 3.Footnote 7 The sample is predominately female at around 60% in all three waves. The sample is also predominately black, around 75%, which is higher than the city demographics of 62% in 2015. Roughly 23–25% of the sample is married, and about 50% of the residents are working full-time or part-time. Regarding level of education, around 53–54% of the sample have a high school diploma or less, and 46% have attended some college or higher. The residents in our sample are predominately renters in all three waves, with roughly 60% renting their home and 40% of the respondents owning their homes. On average the length residents have lived on their street is approximately 10–12 years (SD = 13.0–14.5).
In terms of risky behaviors, the average number of drinks per month is about 9 drinks (SD = 17.8–18.8) among our sample. Between 21 and 25% have used drugs in the past year, and in terms of offending in that past year, 11.5% reported offending in wave 1, 7.9% in wave 2, and 7.4% in wave 3. Lastly, the mean score on the low self-control scale was 2.1 (SD = 0.4) in waves 1 and 2, and 2.0 (SD = 0.5) in wave 3.
6.4 Findings
6.4.1 Differences in Property Crime Victimization across the Street Segment Types
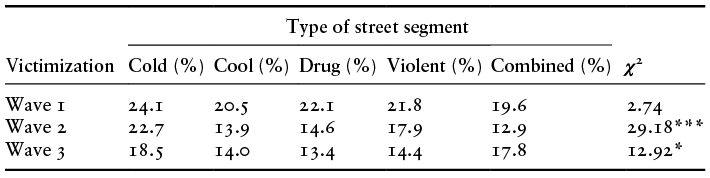
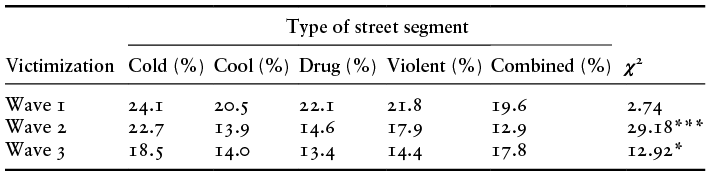
Next, we explore rates of property victimization among the residents in our sample across the five segment types in Table 6.2. Property crime did not differ significantly across the hot spots and non–hot spots in wave 1, though it did in waves 2 and 3. At the same time, the relationships observed vary a good deal across the two waves. For example, the combined drug and violent crime hot spots have the lowest rates of victimization in wave 2, but high levels relatively in wave 3. Overall, across the survey waves, cold spots have the highest rates of victimization, suggesting perhaps, as we noted earlier, target attractiveness – property may be more valuable on cold spot streets because such streets include homes with economically better-off families. It is important to note that we chose hot spots based on violent and drug crime, and accordingly we would not necessarily expect strong relationships between property victimization and our street types. In turn, our main focus in this chapter is on understanding the influence of street segment characteristics on individual household victimization.
Note:
* p < 0.05, ***p < 0.001; Ns are at the individual level and vary between 2,961 and 3,509.
6.4.2 Understanding Property Crime Victimization at the Household Level
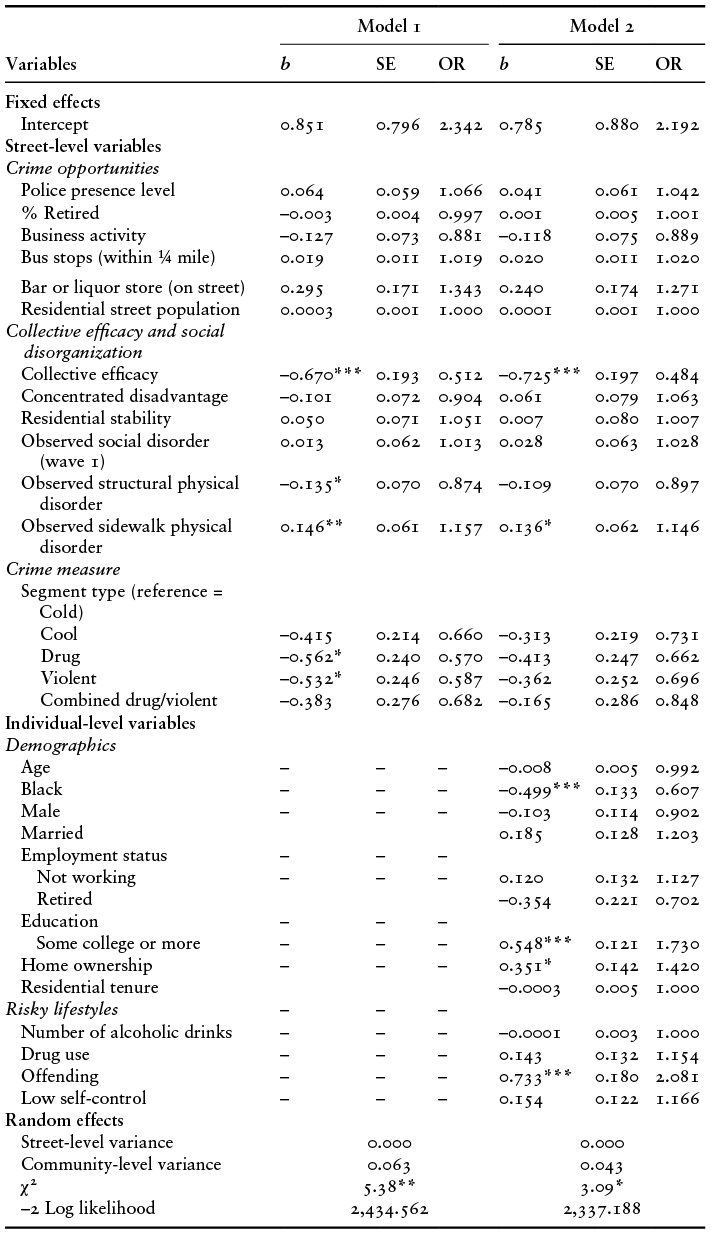
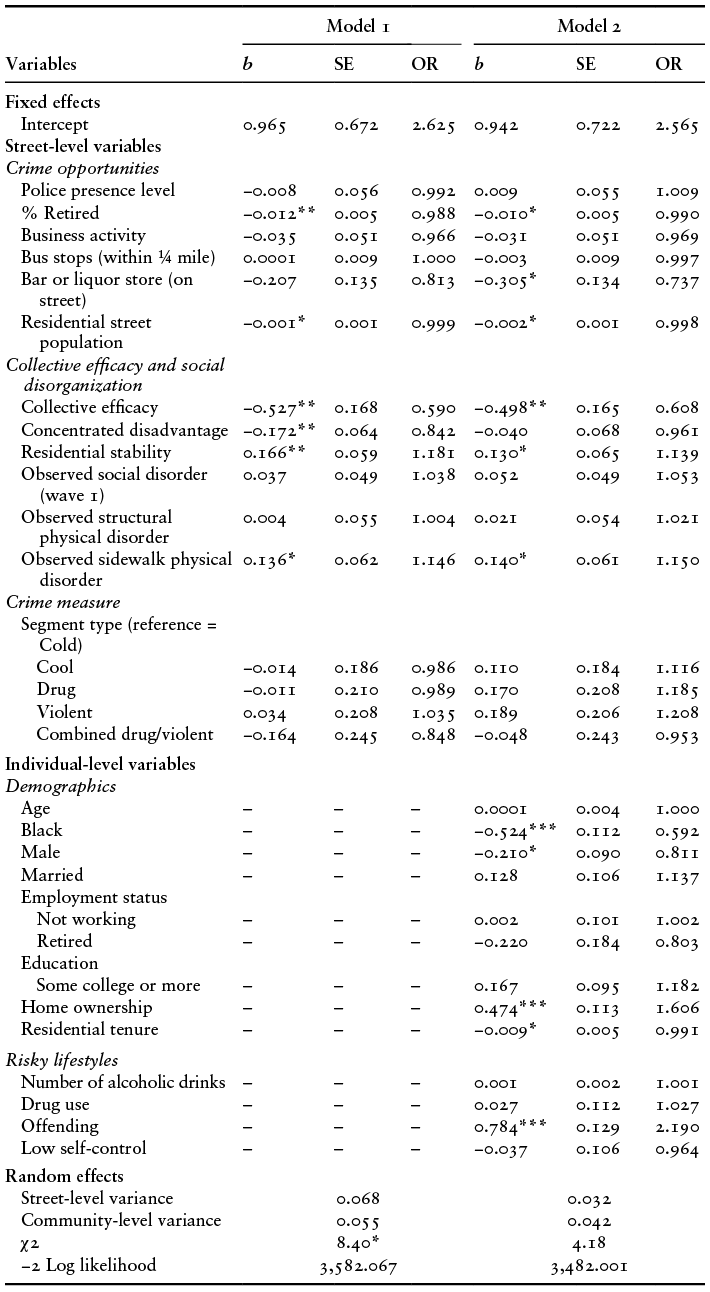
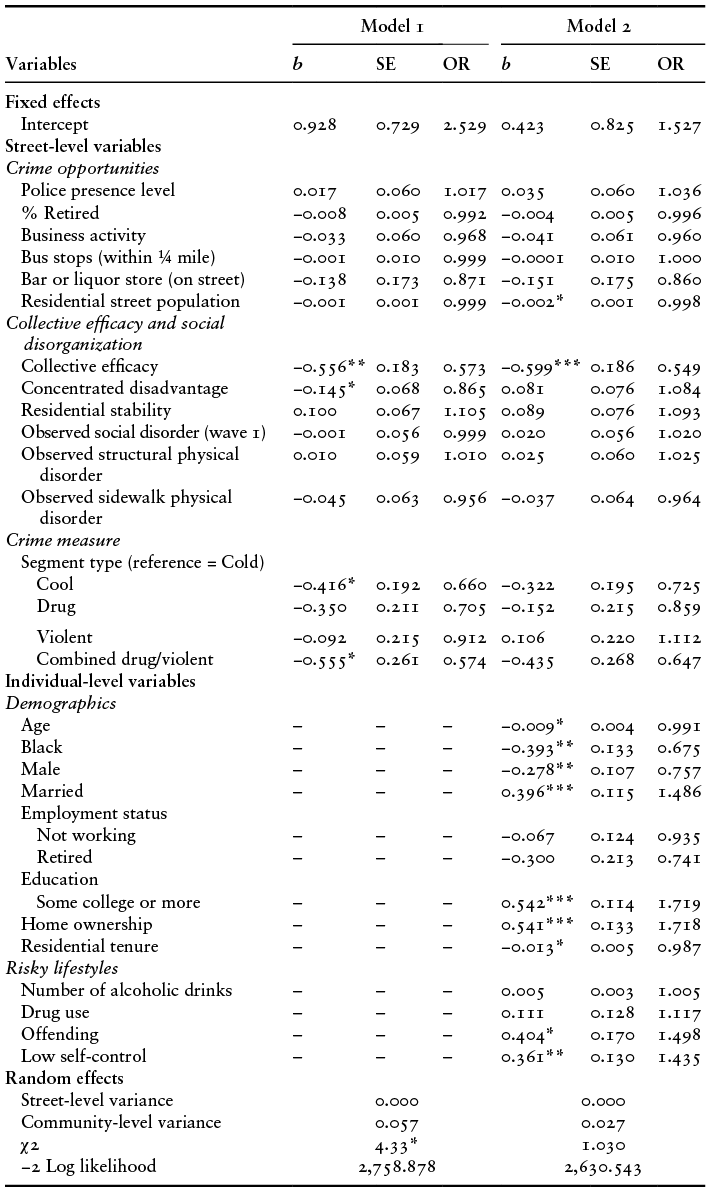
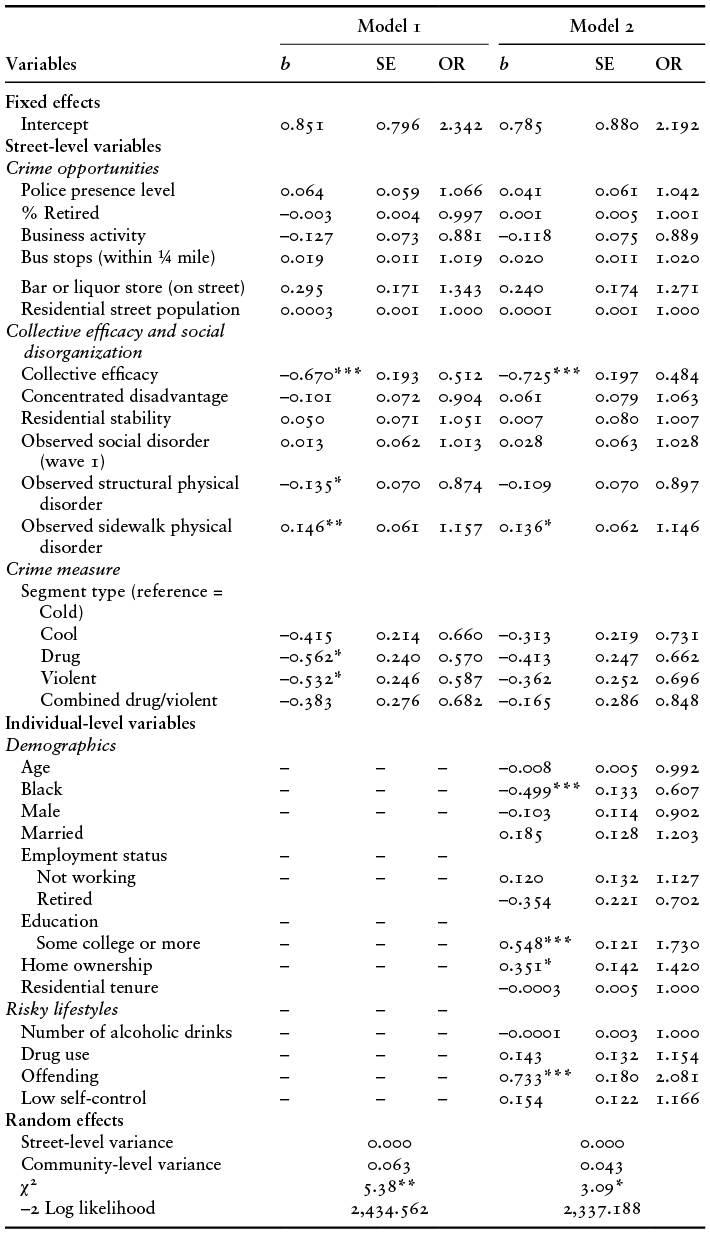
Because we are examining the risk of property crime victimization, measured as whether there had been a property crime victimization at the household, we use multilevel logistic regression models. Tables 6.3–6.5 report the results for waves 1 through 3. We first include only the street-level factors in the models (Model 1), followed by the inclusion of individual-level covariates (Model 2). The coefficients and odds ratios (ORs) are both reported in the tables. Similar to the IRR, the OR provides a more intuitive interpretation of effect size, representing the change in the odds of experiencing property victimization associated with a one-unit change in the independent variable.
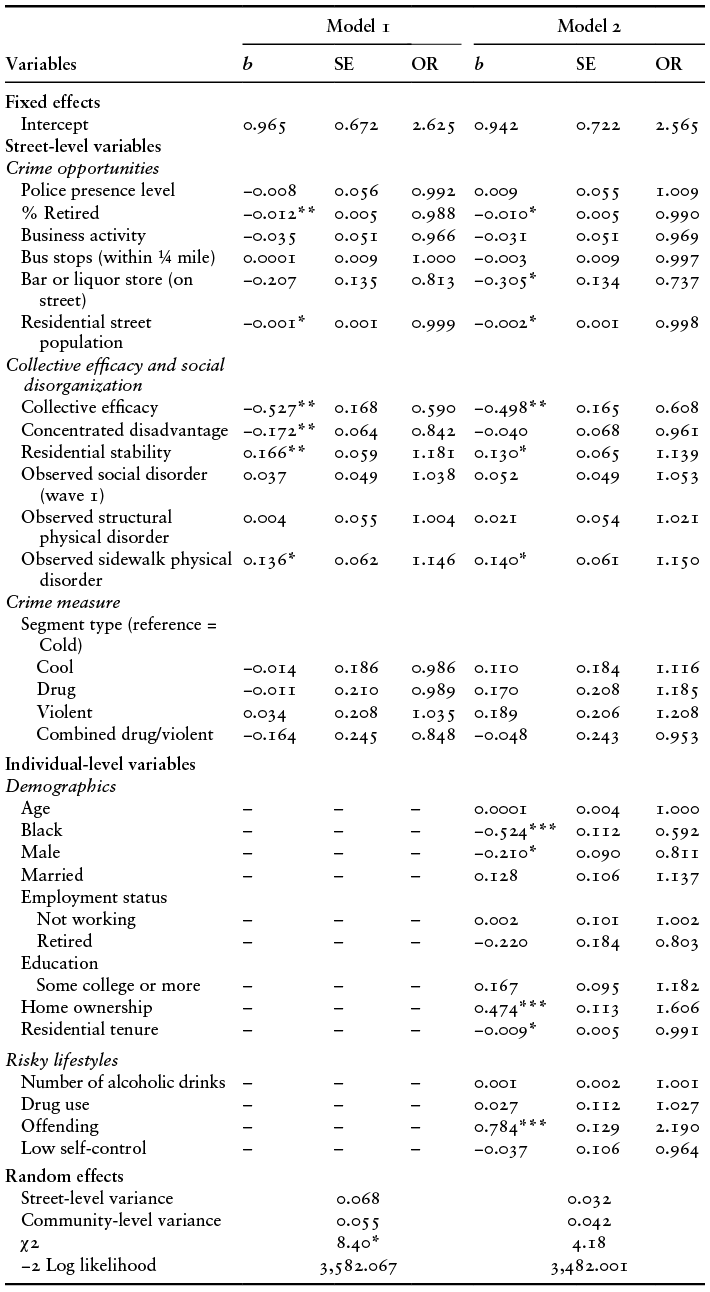
Note: N = 3,509;
* p < 0.05, **p < 0.01, ***p < 0.001; SE = standard error; OR = odds ratio.
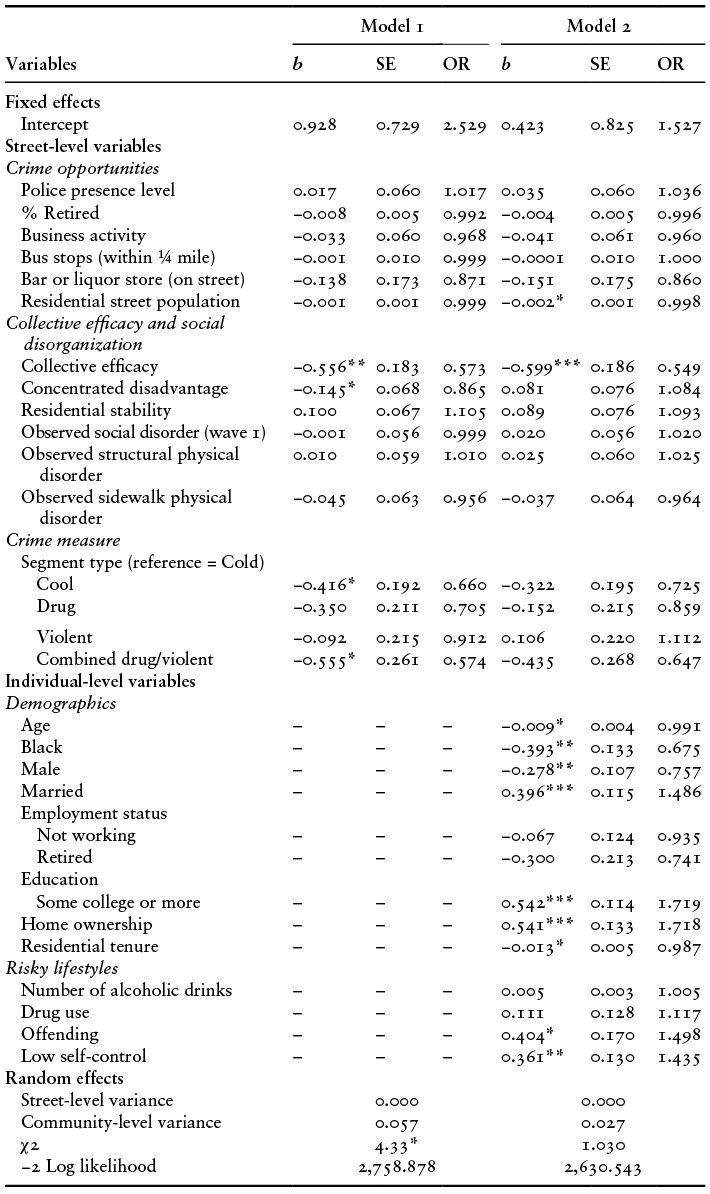
Note: N = 3,204;
* p < 0.05, **p < 0.01, ***p < 0.001; SE = standard error; OR = odds ratio.
Note: N = 2,961;
* p < 0.05, **p < 0.01, ***p < 0.001; SE = standard error; OR = odds ratio.
Supporting our earlier findings on the salience of informal social control for understanding crime hots spots, collective efficacy at the street-segment level consistently has a very strong and highly significant relationship with property victimization across the three waves. Looking at the full models, in wave 1, a one-point increase on the collective efficacy scale (which varies from 2.69 to 4.56) was associated with a statistically significant, 39 percent reduction in the odds of a household experiencing property victimization (p < 0.01). In waves 2 and 3, there are even stronger relationships between informal social control and victimization, with a one-unit increase in collective efficacy decreasing the odds of property being victimized by 45% and 52% in the full models, respectively (p < 0.001).
Regarding other street-level variables reflecting social disorganization, sidewalk physical disorder had significant associations (p < 0.05) with property victimization in waves 1 and 3, with a one-unit increase in observed sidewalk physical disorder (which varies from −1.27 to 2.09) leading to a 15% increase in the odds of property victimization.
In waves 1 and 2, concentrated disadvantage is significant in the models, when individual covariates are not included in the model, with higher disadvantage related to lower risk of property crime.Footnote 8 However, once covariates at the individual level, are taken into account, the results are not statistically significant. Residential stability is positive and significant at wave 1 (p < 0.05), but has a very small and nonsignificant impact in the other waves. Given this, we do not think this finding is consistent enough to draw conclusions about the relationship between residential stability and risk of property victimization.
Opportunity characteristics of the street segments appear to have little consistent impact on individual victimization. None of the characteristics we measure have statistically significant impacts in all three models, and only residential population has significance (p < 0.05) in two of the three models (waves 1 and 2). Higher populations on the street are associated with lower probabilities of property victimization, and we provide some context and reasoning behind this finding later in the chapter. Lastly, percent retired had a significant negative impact on property victimization (p < 0.05), but only in wave 1. This aligns with the perspective that retired individuals spend more time at home providing guardianship (Coupe and Blake, Reference Coupe and Blake2006), and while this relationship was not significant in other waves, it was in the same direction.
In terms of the individual-level covariates, there are some differences across the waves, but the variables that are consistently significant include offending behavior, owning your own home and race. Consistent with the offender/victim overlap literature (Armstrong and Griffin, Reference Armstrong and Griffin2007; Berg et al., Reference Berg and Loeber2012; Jennings et al., Reference Jennings, Piquero and Reingle2012; Lauritsen et al., Reference Lauritsen, Sampson and Laub1991; Sampson and Lauritsen, Reference Sampson and Lauritsen1990; Schreck et al., Reference Schreck, Stewart and Osgood2008), being an offender in the past year has a large effect on property victimization in all of the models. In wave 1, individuals who reported offending in the past year had 2.2 times higher odds of being a victim of a property crime (p < 0.001) on their street. In wave 2, the odds were 1.5 times higher for property victimization for offenders (p < 0.05), and in wave 3 they were 2.1 times higher (p < 0.001).
Home ownership significantly increased the likelihood of property victimization in all three waves (p < 0.05), and an individual having college or higher education also significantly increased the likelihood of victimization in waves 2 and 3 (p < 0.001). As we discuss later, indications of higher socioeconomic status appear overall to increase the risk of victimization. In contrast, length of time someone lived on the street significantly decreased the odds of experiencing property victimization in waves 1 and 2 (p < 0.05). Lastly, on our sample of street segments, Blacks were significantly less likely to experience property victimization, and the impacts are strong and significant across the three waves (p < 0.001). Overall, being black leads to decreases in the probability of being victimized for a property crime of between 32% and 41%. In our discussion later we consider possible explanations for this interesting finding.
Type of street segment does not have a consistent impact on property crime risk at the household level in the full models, and individual comparisons between hot spots and cold spots are not found to be significant once covariates at the household level are taken into account.Footnote 9 As a sensitivity analysis, we estimated similar models replacing segment type with the logged crime calls for service for the year prior to the wave of data collection – 2012 for wave 1, 2014 for wave 2, and 2016 for wave 3. The results for the full models are provided in Tables A6.4–A6.6. Consistent with our main models using segment type, crime calls are not a significant predictor of victimization in any of the waves of data collection. We still think it is important to include the street type measure in our final model to account for our sampling design (Winship and Radbill, Reference Winship and Radbill1994).
6.5 What Have We Learned?
Our data collection allowed us to study an aspect of property crime victimization that has not been assessed before. Because we have individual data on residents of households, as well as data on characteristics of streets, we were able to add new information to our understanding how street context affects risk of property victimization of households. We also were able to take into account variability across communities, estimating models that nest streets within community statistical areas.
Our findings in this chapter reinforce those in prior chapters that show that informal social control at the micro geographic level is an important component of street-level processes and dynamics. We find that informal social control, measured as collective efficacy, is strongly related to risks of property crime victimization. When informal social control is stronger on a street, the risk of any individual household on the street being victimized is greatly diminished. We think this finding is very much within the tradition of social disorganization theory. As was the case with crime, heightened levels of informal social control on a street are preventative in terms of property victimization. The mechanisms here seem direct. The greater the extent to which people are strongly tethered to their neighbors and the stronger their willingness to be involved in intervening in crime or other problems on a street, the less likely it is that any household will be victimized.
Our findings regarding physical disorder follow both Broken Windows and Social Disorganization theory. When there is greater physical disorder on the streets and sidewalks, such as litter and broken glass, the risk of property victimization appears to be greater. This is different than our measure of structural physical disorder, such as boarded-up or vacant buildings, which had little impact on property victimization. In this case we might suspect that offenders perceive properties on streets where residents are not maintaining the area around their home as more suitable targets. Perhaps sidewalk physical disorder signals to potential offenders that people on a street are not careful guardians of their homes, or their neighbors’ homes. Alternatively, structural physical disorder may have little impact on risk of property victimization because such places, like boarded-up homes and vacant lots, are not attractive targets.
We think it instructive that the opportunity measures at the street-segment level have little impact on risk of victimization at the household level. Only residential street population had a significant impact on property victimization in two of three waves, and in this case, it led to reductions in risk of victimization for residents. We suspect that this may reflect aspects of guardianship on streets with larger populations. This may seem contradictory to findings in Chapter 4 showing that larger populations are associated with more crime, but again we want to emphasize that individual victimization and crime on the street are quite different measures.
It could be that overall crime on the street increases as the population increases because the number of suitable targets increases, but the risk of property victimization for any single residence on a street may decline, as there are more dwelling units on a street for offenders to choose from when deciding to offend. Other reasons for this finding may relate to target hardening characteristics such as access control for larger buildings with more occupants (e.g., buzzers for entrance to the building). Apartment buildings, which have more residents (increasing the street population), often created challenges for our field researchers attempting to collect surveys. They had difficulty accessing units in apartment buildings due to locked entrances and requiring a code to enter. This may also translate to limiting opportunities for property victimization. This would not affect crime generally on the street but would have meaningful impacts on the risks of property crime victimization for individual households.
6.5.1 Predictors at the Individual Level
At the individual level, our findings are consistent with prior risky lifestyles research, as well as opportunity theories more generally, despite focusing on property crime. In all three waves, individuals who reported offending in the past year were significantly more likely to be victims of property crime on their street, supporting the victim-offender overlap identified in several studies (Armstrong and Griffin, Reference Armstrong and Griffin2007; Berg et al., Reference Berg and Loeber2012; Jennings et al., Reference Jennings, Piquero and Reingle2012; Lauritsen et al., Reference Lauritsen, Sampson and Laub1991; Sampson and Lauritsen, Reference Sampson and Lauritsen1990; Schreck et al., Reference Schreck, Stewart and Osgood2008). Individuals involved in crime may associate with other individuals involved in criminal behavior, increasing their own exposure to motivated offenders (Turanovic and Pratt, Reference Turanovic and Pratt2014). They may also be viewed as an easier target because they may be less likely to go to the police when victimized, particularly if their own offending may have contributed to the victimization (Siegel, Reference Siegel1985; Sparks, Reference Sparks1982).
Risky behaviors such as drinking and using drugs were not significant predictors for risks of property victimization. We think this is related to the type of crime we examine. Other research suggests that these characteristics are strongly related to violent crime victimization (not risk of property victimization) at the individual level (Reisig and Golladay, Reference Reisig and Golladay2019; Schreck et al., Reference Schreck, Stewart and Osgood2008; Turanovic et al., Reference Turanovic, Reisig and Pratt2015; Zhang et al., Reference Zhang, Welte and Wieczorek2001), community level (Lauritsen, Reference Lauritsen2001; Lauritsen and Carbone-Lopez, Reference Lauritsen and Carbone-Lopez2011; Miethe and McDowall, Reference Miethe and McDowall1993; Mustaine and Tewskbury, Reference Mustaine and Tewksbury1998; Rountree et al., Reference Rountree, Land and Miethe1994; Sampson and Wooldredge, Reference Sampson and Wooldredge1987; Turanovic et al., Reference Turanovic, Pratt and Piquero2018), and also at the street-segment level (Jones and Pridemore, Reference Jones and Pridemore2019; Schnell et al., Reference Schnell, Braga and Piza2017; White et al., Reference White, Weisburd, Wire, Dong and Ready2022).
In the case of individual-level measures that assess economic status, our results are not consistent across models, but overall appear to reflect a higher likelihood of property victimization when residents are of higher socioeconomic status. Opportunity theories grounded in rational choice theory suggest simply that when there is more to gain from a crime, the crime is more likely (Clarke, Reference Clarke1995; Cornish and Clarke, Reference Cornish and Clarke1986; Reference Cornish and Clarke1987; Cohen et al., Reference Cohen, Kluegel and Land1981; Bunch et al., Reference Bunch, Clay-Warner and Lei2015; Garofalo, Reference Garofalo1987). Rountree et al. (Reference Rountree, Land and Miethe1994) found, for example, that target attractiveness, such as higher family income and expensive goods as well as the home being left unoccupied (i.e., less guardianship) increased property victimization. We found similarly that households with respondents that were better educated and owned their home were more likely to be victimized. We do not think that this finding is surprising when considering property crime. Home ownership likely reflects the attractiveness of targets for burglaries (Cohen and Cantor, Reference Cohen and Cantor1981; Cohen and Felson, Reference Cohen and Felson1979; Miethe and McDowall, Reference Miethe and McDowall1993; Rountree et al., Reference Rountree, Land and Miethe1994). On the other hand, the length of time someone has lived on the street, which reduced risk of victimization, may reflect a more extensive knowledge of the street environment to prevent victimization, as well as ability to exercise capable guardianship.
Residents who are Black in our sample were much less likely to be victims of property crime on their street. The role of race in victimization is somewhat mixed and depends on the type and location of victimization examined (Lauritsen, Reference Lauritsen2001; Rountree et al., Reference Rountree, Land and Miethe1994). Following our discussion of socioeconomic status, one explanation for this finding may be that race is related to disadvantage, and that might predict lower property crime rates. However, we are also controlling for economic advantage with employment, education, and home ownership.
Another interpretation may be that Black residents in the sample have stronger ties to their neighbors. Mary Pattillo (Reference Pattillo2021) argues that social scientists have focused too much on disadvantages of Black people leading to reinforcing stereotypes, and have ignored strong evidence of specific advantages of Black communities. When we examine social ties and social networks among Blacks residents as contrasted with Whites in our sample, we find that levels are significantly higher for Blacks residents. For example, for our social ties variable in wave 1, Black residents had a significantly higher score than non-Black residents (p < 0.001). Additionally, 44.8% of Black residents responded that neighbors help each other “often” compared to 39.9% of White residents. Our social network variable, measured by the number of neighbors on the street they considered friends was 5.41 for Black residents compared to 4.62 for non-Black residents, also a significant difference (p < 0.001). This suggests to us that this may be an example of “Black advantage” (Patillo, Reference Pattillo1998, Reference Pattillo2021) that should be taken into account when thinking about victimization in the Black community.
We are not sure how to interpret the findings regarding gender in our study. In two of three waves gender was a significant variable, with households of women respondents more likely to be victimized. The impacts vary greatly across the models from a 9% reduction in property crime victim risk for households with male respondents to a 25% reduction. This may be related to aspects of capable guardianship and suitable targets varying by characteristics of the household and gender of respondent. In wave 1, 23% of female respondents lived alone compared to 13.8% of male respondents. Additionally, over 56% female respondents reported having minors in the home, compared to roughly 38% of male respondents. On the other hand, male residents were more likely to live in households with other adults. Furthermore, 15.3% of female respondents were head-of-household with minors and no other adults living in the home, compared to 1.7% of male respondents. One might infer that the guardianship is weaker among female-headed households with children and viewed as a more suitable target for property victimization. It may also be an issue of females being more likely to notice that the victimization occurred and report affirmatively to victimization in our survey. Still, the fact that gender of the respondent is not a household trait, but rather an individual trait makes it difficult to draw strong inferences from our findings.
6.6 Conclusions
While our ability to draw causal inferences in this chapter is more limited than prior chapters – due to the necessity of cross-sectional analyses, our findings point to the salience of informal social control at the street-segment level in understanding individual household victimization. Social context matters not only for crime but also for the risk of property crime victimization faced by residents. We think the strong and significant relationships of collective efficacy to household property victimization add weight to our efforts to bring social context into our understanding of hot spots of crime.
At the same time, crime opportunities at the street-segment level appear to have much less impact on risk of property crime victimization. Major influences on risk of property crime comes from individual-level variables, as is the case for risk of victimization more generally. However, our models suggest that risk of property victimization in many cases departs from studies of violent crime victimization. For example, higher socioeconomic status increases victimization, reflecting the greater attractiveness of goods likely to be found in higher status households.
Before we turn to our conclusions in Chapter 8 and consider the implications of our work for both theory and policy, in Chapter 7 we turn to two other individual-level outcomes – mental and physical health.

 Open access