Introduction
Bering Glacier extends from the Bagley Icefield to the base of the Chugach range where it joins Steller Glacier along the south-central coast of the Gulf of Alaska. The coalesced Bering and Steller Glaciers constitute the largest known surging glacier system in North America (5200 km2, 190 km long), with a piedmont lobe second only to Malaspina Glacier 150 km to the east (Reference Josberger, Shuchman, Meadows, Savage, Payne, Shuchman and JosbergerJosberger and others, 2010). A history of surging is indicated by multiple events dating back to 1843 when Belcher first reported a broken ice front while describing Bering Glacier during coastal exploration (Reference BelcherBelcher, 1843). In recent decades major surges occurred in 1958–59, 1966–67, a failed event in 1981 (Reference Muller and FleisherMuller and Fleisher, 1995), 1993–95 and most recently a full surge in 2010–12.
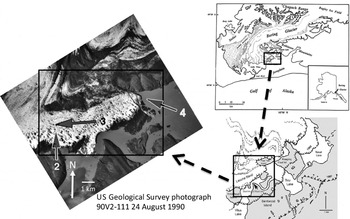
The 1993–95 surge of Bering Glacier was initiated in June 1993 as an ice bulge spread from the trunk glacier onto the piedmont lobe. By January 1994 newly formed, heavily crevassed domes had developed across much of the 350 km2 piedmont lobe. The surge ended in 1995 with three outburst floods, at which time the ice front had advanced onto Weeping Peat, Peat Falls, Arrowhead and Bentwood Islands and into Tsivat and Tsiu Lake basins on the eastern side, and into Lake Vitus along the glacier’s southern terminus (Reference Fleisher, Bailey, Natel, Muller, Cadwell, Russell, Shuchman and JosbergerFleisher and others, 2010). Studies conducted during the surge and the decade of retreat that followed involved rates of advance and subsequent retreat, GPS mapping of annual ice-marginal positions, impact of surge on overridden terrain, changes in ice-contact lake sedimentation during the surge and impact of outburst floods, rates of summer ablation, and ice surface surveys to determine annual rates of downwasting (Fig. 1).

Lacunas appear on the eastern Bering piedmont lobe within an anomalous band of >100 depressions on a segment of ice relatively free of debris confined between folded debris bands near the eastern terminus of the piedmont lobe (Reference Mase, Nierenberg, Fleisher, Bailey and NatelMase and others, 2007). Lacunas are bowl-shaped cavities across which englacial structures are continuous and undisturbed. They are steep-walled and lack the vertical conduit drainage typical of moulins but instead have gently sloping floors through which meltwater drains. Austin Post referred to these features as lacunas in casual conversation with me, but never used the term in his publications.
Although no formal use or definition of the term ‘lacuna’ appears in any geologic literature, the Dictionary of Alaska place names (Reference OrthOrth, 1971) indicates that it was first used with reference to Lacuna Glacier, Alaska, by mountain climbers in the late 1940s. In this context the term makes reference to the common occurrence of surface depressions on all parts of the glacier below the snowline. Additional usage may be found as a taxonomic term in entomology and marine biology, and it frequently appears in non-geologic literature to describe a void or gap.
Several authors make reference to depressions called ‘potholes’ that are similar in appearance to lacunas (Reference SturmSturm, 1987; Clement and Knudsen, 2005), and speculate on their association with glaciers that have surged. However, no discussion of formation is offered, nor are the conditions responsible for their occurrence considered. A review of aerial and satellite imagery reveals potholes on the upper segment of the eastern tributary to Kahiltna Glacier, Alaska, which are lost to ablation down-glacier. In the same region, numerous depressions are common within the heavily debris-laden termini of two tributaries to Eldridge Glacier. Elsewhere, ponded lacuna-like depressions appear to be aligned with englacial foliation, such as below the snowline on Petermann outlet glacier, northwestern Greenland. The same can be observed on some outlet tongues fed by Penny Ice Cap, eastern Baffin, Canada. Similarly, the down-glacier right lateral flank of Nabesna Glacier on the eastern side of the Chugach range, Alaska, contains several linear ponded depressions. Within the same region, the stagnant debris-covered terminus of Martin River Glacier contains ‘sinkholes’ of collapse origin as reported by Reference ClaytonClayton (1964). These resemble potholes and are part of what Clayton refers to as ‘glacier karst’. Southward along the Alaska coast, the stagnant debris-covered margins of Malaspina Glacier have the characteristic glacier karst appearance, including sinkholes. Glacier karst and collapse sinkholes are also common along the broad medial moraine separating the Steller and Bering piedmont lobes. Although glacier karst sinkholes are similar in size and shape to lacunas, lacunas are not the result of collapse.
The purpose of this paper is to explain why, after the Bering Glacier lacuna band was displaced onto the foreland by the 1993–95 surge (Reference Fleisher, Bailey, Natel, Muller, Cadwell, Russell, Shuchman and JosbergerFleisher and others, 2010), an entirely new band began to appear within 5–6 years in a location that coincides with the position of the pre-surge lacuna band. During this interval, downwasting removed 55 m of surge-thickened ice (Reference Fleisher, Bailey, Natel, Miller and TracyFleisher and others, 2005, Reference Fleisher, Bailey, Natel, Muller, Cadwell, Russell, Shuchman and Josberger2010; Reference Mase, Nierenberg, Fleisher, Bailey and NatelMase and others, 2007). Furthermore, the location of the newly formed lacunas coincides with the position of a linear trench that formed on the glacier surface during the surge. Crevasse patterns developed during the surge indicate a subglacial trough lies directly below this surface trench. This links lacuna band formation to the ice within the trough.
Lacuna Band Location and Description
The eastern margin of the Bering piedmont lobe contains multiple debris bands tightly folded and kinked by past surge events (Reference PostPost, 1972). Between folds, and in conspicuous contrast to the glacier surface elsewhere, is a linear band of lacunas (1.5 km wide, 5 km long). The lacunas occupy ice that is entirely free of surface debris, unlike an area of similar depressions within the glacier karst of the massive medial moraine between the Steller and Bering lobes (Fig. 1).
When fully developed the lacuna band consists of ∼150 lacunas, each large enough to be prominent on aerial photographs. Although randomly distributed, groups of 10–15 appear to be aligned northwest–southeast. The entire band encompasses an area of 6–7 km2. Nowhere else on the entire 100 km2 of the active Bering piedmont lobe are lacunas present.
Many lacunas appear circular, although the majority are slightly oblate, with the long axis oriented in the up-glacier direction (northwest–southeast) and parallel to a prominent fracture pattern. Although they vary significantly in size and relief, the lacunas are commonly 40–60m wide, 80–120m long and 35–50m deep. Lacuna walls are steeply inclined (between 20° and 40°), descending from a broad crowning rim to a gently concave floor (Fig. 2). Ephemeral ponds occupy some of the smaller, newly formed lacunas.
Lacuna morphology. Scale implied by people on crown of far wall and ice axe in foreground. Note linear fracture on lacuna floor through which surface melt drains. View to the north across lacuna band. Photograph by author.

Englacial structures are clearly represented three-dimensionally within lacuna walls, including normal foliation, surge-related thrust planes, fractures and sparse debris-filled hydrofractures (Reference Fleisher, Bailey, Natel, Muller, Cadwell, Russell, Shuchman and JosbergerFleisher and others, 2010). Foliation strikes northeast–southwest and dips moderately up-glacier, averaging 41°. Thrust planes, conspicuous due to traces of fine debris within otherwise clean ice, are semi-parallel to foliation and dip 24–41° up-glacier. Fractures that appear to be remnants of a crevasse pattern formed during the surge strike northwest–southeast and also dip steeply (68°) (Fig. 3) A few debris-filled hydrofractures strike to the northeast and southeast and dip between 37° and 47° up-glacier. Some occupy foliation planes. All structures are laterally continuous without interruption throughout the lacuna band, thus precluding collapse as a formative process and distinguishing lacunas from sinkholes of similar appearance within areas of glacier karst (Reference ClaytonClayton, 1964; Reference Gulley and BennGulley and Benn, 2007). Moulins are similar in appearance, but favour solitary occurrence and extend to much greater depths.
Oblique aerial view of lacuna band. Dark streaks passing through the lacunas are the product of fine debris melting out of pre-1993–95 surge thrust planes, which are semi-parallel to foliation. View to the west along trend of lacuna band on the up-glacier side of Arrowhead Island. Lacuna band is ∼1 km wide. Photograph by author.

Surge-Related Deformation Associated with Subglacial Relief
Influence of subglacial terrain
Surface deformation during the 1993–95 surge formed heavily crevassed domes above subglacial highs separated by crevasse-free troughs above areas of subglacial lows (Reference FleisherFleisher and others, 1995, Reference Fleisher, Bailey, Natel, Muller, Cadwell, Russell, Shuchman and Josberger2010; Reference Molina and PostMolina and Post, 1995; Reference Muller and FleisherMuller and Fleisher, 1995). A conspicuous linear depression on the surging glacier surface formed where ice subsided into a subglacial trough that appears to be the continuation of the Tsiu Lake basin beneath the glacier (Fig. 4). Ice-penetrating radar indicates the depth of the trough relative to adjacent subglacial terrain ranges from 89 to 191 m (Reference Trabant and MolinaTrabant and Molina, 1992). The trend of an ice surface depression (Fig. 4) formed above the subglacial trough extends from Tsiu Lake to Vitus Lake.
Linear depression on surging glacier surface. View to the west-northwest depicts the glacier surface sagging into an extension of Tsiu Lake basin (asterisks). Arrow indicates direction of ice advance (north–south across trend of depression), as well as the orientation of schematic cross sections in Figure 6. Peat Falls Island is beneath the heavily crevassed area to the right of the depression. Photograph by author.

Post-surge hydrologic conditions
The closing of an outlet by surging ice caused ice-contact Tsiu and Tsivat Lakes on the eastern ice front (see Fig. 1) to rise by 14 m. This development of a hydrostatic head along the Tsivat Lake ice front adjacent to the lacuna band was followed by the encroachment of turbid water into some lacunas (Reference Crossen, Fleisher and BaileyCrossen and others, 2012), thus indicating free water movement within permeable foliation zones and available interconnected conduits within the ice beneath the lacuna band. Conditions abruptly changed as lacunas drained after a breakout returned ice-contact lakes to pre-surge conditions.
Rates of ablation and downwasting
Debris bands that were conspicuous prior to the surge were completely eradicated as virtually all debris fell into crevasses. Broken ice led to accelerated melting, and by 1997–98 most of the heavily crevassed ice was lost to ablation (Reference Fleisher, Bailey, Natel, Muller, Cadwell, Russell, Shuchman and JosbergerFleisher and others, 2010). Most debris bands reformed within 2 years and all within 3 years (Reference Mase, Nierenberg, Fleisher, Bailey and NatelMase and others, 2007). Reference Herzfeld, McDonald, Stachura, Griffin-Hale, Chen and TrantowHerzfeld and others (2013), using laser altimetry during a more recent surge event, report crevasse depths to be 20–30 m. Therefore, the reappearance of debris bands indicates a maximum annual ablation rate of 15 m.
During the 9 years that followed (1998–2006), glacier surface surveys conducted at four different locations indicate the clean ice surface lowered at an average annual rate of 10 m (Reference Fleisher, Bailey, Natel, Miller and TracyFleisher and others, 2005, Reference Fleisher, Bailey, Natel, Muller, Cadwell, Russell, Shuchman and Josberger2010). By 2000 the glacier surface near the terminus had downwasted 15 m during each of the first 2 post-surge years, plus 10 m during the following 2 years, for a total of 55 m. Consequently, passive ice previously held deep within the trough was exposed at the surface. Photographs taken in 2000 indicate that by this time an entirely new band of lacunas had begun to form.
Glacier surface profiles (Fig. 5) surveyed in two consecutive years (2004 and 2005) illustrate annual changes in surface elevation across a 0.8 km segment of the lacuna band adjacent to Arrowhead Island. Annual downwasting of 10–15m on ice between lacunas and 16–23m within lacunas shown in these profiles confirms differential ablation as the process leading to lacuna formation.
Surface profiles across a segment of lacuna band. Profiles indicate accelerated downwasting of the ice in which lacunas form.

Discussion
Surge deformation leading to stagnation
During the 1993–95 surge, the ice front advanced at a daily rate of 3–7 m in a direction across the trend of the subglacial trough. As noted in the field and proposed in the schematic diagrams of Figure 6, low-angle thrusts stacked horizontally oriented wedges of ice one upon another. This caused the glacier along the eastern sector to thicken by 38–45m (Reference Fleisher, Bailey, Natel, Muller, Cadwell, Russell, Shuchman and JosbergerFleisher and others, 2010) and effectively separated ice deep within the trough from active ice above, thus rendering it passive and effectively stagnant. By 2000–01 most if not all of the thickened ice had been lost to downwasting, and the ice confined deep within the trough was exposed to ablation. The location of the newly formed, post-surge lacuna band coincides exactly with the location and orientation of the trough ice, thus linking this ice to the lacuna band. The properties of this ice, and their influence on the rate of ablation, are fundamental to lacuna development.
Surge-related ice deformation. Schematic cross sections orientated north–south across the trend of a subglacial trough. Cross sections illustrate surge-related ice deformation and the development of detached ice deep within the trough. (a) General pre-surge ice-front retreat at 10–15 m a−1 and downwasting averaging 10 m a−1. Glacier thickness adjusts to subglacial terrain by filling a subglacial trough that is an extension of Tsiu Lake basin. (b) During the surge, ice thickens 50–70m (Reference FleisherFleisher and others, 1995) and advances 7–10 m d–1 (Reference Fleisher, Bailey, Natel, Muller, Cadwell, Russell, Shuchman and JosbergerFleisher and others, 2010) as Peat Falls Island is overridden and the ice front presses 2 km onto the foreland. As illustrated in Figure 4, the glacier surface sags into a subglacial trough. Arrows schematically depict horizontal wedges of active ice thrust across ice within the subglacial trough. (c) As flow returns to pre-surge conditions, Peat Falls Island is exposed by downwasting, as is ice within the subglacial trough. Lacunas form within this ice.

Lacuna affinity for stagnant ice
Lacunas are not found within the actively flowing ice of Bering Glacier. This may be explained by considering how the components of active ice deformation differ from those of stagnant ice. Glen’s flow law for the rate of active ice deformation assumes isotropic conditions, uncompromised by foliation. Thermal properties and shear stress influence the rate of deformation (Reference GlenGlen, 1955; Reference HookeHooke, 2005). Unlike other factors that define the physical properties of glacier ice, density is conventionally assigned a uniform value in calculations of ice flow and intracrystalline deformation. Therefore, it is reasonable to assume that active ice flow maintains a relatively uniform density throughout the glacier (Meier, 1972; Reference HookeHooke, 2005). Should flow cease and the ice become stagnant, as proposed for ice deep within the trough, the properties of the ice would change.
It is suggested that stagnant conditions would weaken ice crystal fabric, thus influencing susceptibility to ablation. Indeed, Reference Raymond and HarrisonRaymond and Harrison (1975) indicate that the absence of ongoing intracrystalline deformation would compromise englacial texture by the enlargement of minute spaces between individual ice crystals. This in turn would effectively enhance the potential for ablation. Assuming passive or stagnant ice held deep within the subglacial trough was indeed exposed to such conditions, it is suggested that randomly distributed zones of slightly weakened ice crystal fabric would develop, thus leading to lacuna formation when exposed by downwasting.
Ephemeral ponds trapped within small developing lacunas result in lower albedo and absorption of solar radiation, which in turn lead to increased melting and pond growth as lacunas are enlarged (Reference Jeffries, Overland and PerovichJeffries and others, 2013). As lacunas grow and encounter fractures through which drainage may occur, ponds empty. Indeed, the largest and most well-developed lacunas do not contain ponds. Asymmetric lacuna shape appears to be the result of hydrologic feedback providing access of growing supraglacial ponds to a deep-seated fracture system formed during surge-related crevasse development, enhanced by down-dip enlargement along foliation and thrust planes. The net result is asymmetry as noted in the aerial photograph of Figure 1.
Summary and Conclusions
Following the displacement by the 1993–95 surge of a 7.5 km2 lacuna band containing hundreds of depressions (lacunas), a newly formed band appeared 5 years later in exactly the same pre-surge location. The location and orientation of the new lacuna band coincides with a subglacial trough that was clearly expressed as a linear trench at the glacier surface during the surge. Surge-related horizontal thrusts caused glacier thickening as ice moved across the trend of the trough. This movement effectively trapped ice deep within the trough, and isolated it from active ice above, thus leading to passive conditions and stagnation. A new lacuna band formed within this ice after downwasting exposed it at the surface.
Lacuna formation represents a unique property of glacier ice that is so rarely observed it has eluded attention in the literature. Although lacunas appear to represent a type of differential ablation, at Bering Glacier the contrasting rates of ablation are thought to be associated with non-uniform ice density. It is postulated that stagnant conditions led to changes that compromised ice texture, resulting in randomly distributed pockets of diminished density, followed by differential ablation and lacuna formation.
Recommended future research
-
1. Measure daily summer rates of ablation in lacunas and on ice between lacunas
-
2. Compare density and ice fabric in and between lacunas
-
3. Conduct portable seismic surveys to determine whether the physical properties of ice below lacuna bands differ from those of ice elsewhere
-
4. Conduct thorough ice-penetrating radar surveys to confirm subglacial troughs and map trough depth, width and extent
-
5. Consider the possibility of a lacuna life cycle (properties of young, mature and old lacunas).
Acknowledgements
The results of fieldwork cited in this investigation were collected by the Bering Research Group (BERG) spanning several summers. Key members of the BERG group are Palmer K. Bailey (responsible for all glacier surface surveys and resulting profiles), Eric Natal (GPS mapping), Don Cadwell and Ernie Muller. More than a dozen students from the State University of New York College at Oneonta, and many Earthwatch volunteers also assisted in field studies. Prominent among the students were Dan Nierenberg and Dave Mase. I am also grateful for the cooperation and assistance of the Prince William Science Center, Cordova, Alaska, namely Nancy Bird and Penny Oswalt. Many helpful comments and suggestions by two anonymous reviewers and Chief Editor Jo Jacka were incorporated into this paper.