


1. Introduction
The Amazon River is the largest supplier of materials to the world’s oceans, providing about 20% of the global water (Callède et al. Reference Callède, Guyot, Ronchail, L’Hôte, Niel and de Oliveira2004), ∼10% of the dissolved load (Gaillardet et al. Reference Gaillardet, Viers, Dupré, Holland and Turekian2003) and ∼3% of the suspended load (Milliman and Syvitski, Reference Milliman and Syvitski1992). The Andean Amazonian rivers are dominant contributors transporting more than 95% of the mean annual suspended sediment flux delivered (2/3 and 1/3 from the Solimões and Madeira rivers, respectively, see Figure 1a for location (Filizola and Guyot, Reference Filizola and Guyot2004). The geological history of the Amazon’s palaeo-drainage is the result of the interaction of geodynamic mechanisms (acting within the South American plate) with climate and sea-level fluctuations (Sacek et al. Reference Sacek, Mutz, Bicudo, de Almeida and Ehlers2023). Recent studies have shown the existence of continent-wide cratonic palaeo-drainage originated in the Amazon craton between the Cenomanian and the Maastrichtian in western Amazonia (Hurtado et al. Reference Hurtado, Roddaz, Santos, Baby, Antoine and Dantas2018; Rodrigues et al. Reference Rodrigues, Roddaz, Santos, Louterbach, D’Apolito, Brusset, Dantas and Negri2023). Western Amazonia started to be sourced by the Andes between the late Maastrichtian and the Palaeocene (Hurtado et al. Reference Hurtado, Roddaz, Santos, Baby, Antoine and Dantas2018; Louterbach et al. Reference Louterbach, Roddaz, Antoine, Marivaux, Adnet, Bailleul, Dantas, Santos, Chemale, Baby, Sanchez and Calderon2018b); whereas the eastern Amazonian palaeo-drainage of the Palaeogene had cratonic provenance (Stewart et al. Reference Stewart, Gutjahr, James, Anand and Wilson2016; van Soelen et al. Reference van Soelen, Kim, Santos, Dantas, Vasconcelos de Almeida, Pires, Roddaz and Sinninghe Damsté2017). The Neogene configuration of the Amazonian palaeo-drainage still remains debated (Roddaz et al. Reference Roddaz, Viers, Brusset, Baby and Hérail2005; Hoorn et al. Reference Hoorn, Wesselingh, ter Steege, Bermudez, Mora, Sevink, Sanmartín, Sanchez-Meseguer, Anderson, Figueiredo, Jaramillo, Riff, Negri, Hooghiemstra, Lundberg, Stadler, Särkinen and Antonelli2010; Roddaz et al. Reference Roddaz, Hermoza, Mora, Baby, Parra, Christophoul, Brusset and Espurt2011; Albert et al. Reference Albert, Val, Hoorn, Albert, Val and Hoorn2018; Hoorn et al. Reference Hoorn, Bogotá-A, Romero-Baez, Lammertsma, Flantua, Dantas, Dino, do Carmo and Chemale2017; van Soelen et al. Reference van Soelen, Kim, Santos, Dantas, Vasconcelos de Almeida, Pires, Roddaz and Sinninghe Damsté2017; Sacek et al. Reference Sacek, Mutz, Bicudo, de Almeida and Ehlers2023; ). Most previous studies focused on the timing of the onset of the transcontinental Amazon River (Figueiredo et al. Reference Figueiredo, Hoorn, van der Ven and Soares2009; Gorini et al. Reference Gorini, Haq, dos Reis, Silva, Cruz, Soares and Grangeon2014; Hoorn et al. Reference Hoorn, Bogotá-A, Romero-Baez, Lammertsma, Flantua, Dantas, Dino, do Carmo and Chemale2017; van Soelen et al. Reference van Soelen, Kim, Santos, Dantas, Vasconcelos de Almeida, Pires, Roddaz and Sinninghe Damsté2017) and its driving mechanism (e.g. Andean mountain building, flat-slab subduction or dynamic topography; Shephard et al. Reference Shephard, Müller, Liu and Gurnis2010; Eakin et al. Reference Eakin, Lithgow-Bertelloni and Dávila2014; Sacek, Reference Sacek2014; Rodríguez Tribaldos et al. Reference Rodríguez Tribaldos, White, Roberts and Hoggard2017; Bicudo et al. Reference Bicudo, Sacek, de Almeida, Bates and Ribas2019, Reference Bicudo, Sacek and Paes de Almeida2020).The Neogene geological history of the western Amazonian palaeo-drainage is less constrained but viewed as similar in all western Amazonian basins (Roddaz et al. Reference Roddaz, Hermoza, Mora, Baby, Parra, Christophoul, Brusset and Espurt2011). These basins (Figure 1b) were part of an unique Amazonian retroarc foreland basin (Roddaz et al. Reference Roddaz, Hermoza, Mora, Baby, Parra, Christophoul, Brusset and Espurt2011) fed by Andean rivers during the Miocene (Roddaz et al. Reference Roddaz, Viers, Brusset, Baby and Hérail2005; Custódio et al. Reference Custódio, Roddaz, Santos, Dantas, Brusset, Louterbach, Hurtado and Gonçalves2024) that connected the Andes to the Pebas megawetland system (Hoorn et al. Reference Hoorn, Wesselingh, ter Steege, Bermudez, Mora, Sevink, Sanmartín, Sanchez-Meseguer, Anderson, Figueiredo, Jaramillo, Riff, Negri, Hooghiemstra, Lundberg, Stadler, Särkinen and Antonelli2010; Boonstra et al. Reference Boonstra, Ramos, Lammertsma, Antoine and Hoorn2015; Villegas et al. Reference Villegas, van Soelen, van Manen, Flantua, Santos, Roddaz, Dantas, van Loon, Damsté, Kim and Hoorn2016). After the demise of the Pebas megawetland and the end of the Acre Phase in the Late Miocene (Hoorn et al. Reference Hoorn, Wesselingh, ter Steege, Bermudez, Mora, Sevink, Sanmartín, Sanchez-Meseguer, Anderson, Figueiredo, Jaramillo, Riff, Negri, Hooghiemstra, Lundberg, Stadler, Särkinen and Antonelli2010), the Pliocene uplift of the Fitzcarrald Arch separated the Solimoes from the Madeira drainage basins (see Figure 1a for location, Espurt et al. Reference Espurt, Baby, Brusset, Roddaz, Hermoza, Regard, Antoine, Salas-Gismondi and Bolaños2007, Reference Espurt, Baby, Brusset, Roddaz, Hermoza and Barbarand2011a; Roddaz et al. Reference Roddaz, Hermoza, Mora, Baby, Parra, Christophoul, Brusset and Espurt2011).
(a) Map of the Amazon basin showing the main Amazonian rivers. The red rectangle indicates the approximate position of Figure 2. MDD: Madre de Dios River. Modified from Bouchez et al. (Reference Bouchez, Gaillardet, France-Lanord, Maurice and Dutra-Maia2011). (b) Geomorphic map delimiting the present-day location of the main Western Amazonian basins belonging to the Amazonian retroarc foreland basin system (DeCelles and Giles, Reference DeCelles and Giles1996) sensu DeCelles and Giles (Reference DeCelles and Giles1996). NAFB: North Amazonian retroarc foreland basin; SAFB: South Amazonian retroarc foreland basin; Fdp: Foredeep; Fb: Forebulge; Bb: backbulge. Modified from Roddaz et al. (Reference Roddaz, Hermoza, Mora, Baby, Parra, Christophoul, Brusset and Espurt2011).

The tropical Andes and the adjacent Amazon Basin are the world’s most biodiverse regions (Rahbek et al. Reference Rahbek, Borregaard, Colwell, Dalsgaard, Holt, Morueta-Holme, Nogues-Bravo, Whittaker and Fjeldså2019; Hoorn et al. Reference Hoorn, Palazzesi and Silvestro2022). The present-day biodiversity of the Amazon region inherited from the Neogene and Andean mountain building, which was the main factor for the evolution of Amazonian landscapes and ecosystems (Hoorn et al. Reference Hoorn, Wesselingh, ter Steege, Bermudez, Mora, Sevink, Sanmartín, Sanchez-Meseguer, Anderson, Figueiredo, Jaramillo, Riff, Negri, Hooghiemstra, Lundberg, Stadler, Särkinen and Antonelli2010). Within the Amazon Basin, major tributaries and their drainage dynamics represent tectonically driven river captures (Albert et al. Reference Albert, Bernt, Fronk, Fontenelle, Kuznar and Lovejoy2021). The landscape dynamics caused by topographic barrier migration are suspected to have played a major role in the diversification of Amazonian vertebrates since the Neogene (Ribas et al. Reference Ribas, Aleixo, Nogueira, Miyaki and Cracraft2011; Oberdorff et al. Reference Oberdorff, Dias, Jézéquel, Albert, Arantes, Bigorne, Carvajal-Valleros, De Wever, Frederico, Hidalgo, Hugueny, Leprieur, Maldonado, Maldonado-Ocampo, Martens, Ortega, Sarmiento, Tedesco, Torrente-Vilara, Winemiller and Zuanon2019; Albert et al. Reference Albert, Bernt, Fronk, Fontenelle, Kuznar and Lovejoy2021) and, even, since the Palaeogene (Musher et al. Reference Musher, Giakoumis, Albert, Del-Rio, Rego, Thom, Aleixo, Ribas, Brumfield, Smith and Cracraft2022; Cassemiro et al. Reference Cassemiro, Albert, Antonelli, Menegotto, Wüest, Cerezer, Coelho, Reis, Tan, Tagliacollo, Bailly, da Silva, Frota, da Graça, Ré, Ramos, Oliveira, Dias, Colwell, Rangel and Graham2023). Hence, constraining the Neogene history of western Amazonian palaeo-drainage is not only important for understanding the Andean uplift but may also provide important temporal milestones for understanding the origin of the Amazonian biodiversity.
In this study, we provide new stratigraphic constraints, seismic interpretations (based on the interpretation of a new subsurface seismic dataset), sedimentological sections, major and trace element geochemistry, Sr–Nd isotopes and U–Pb detrital zircon ages on the Neogene sedimentary deposits of the Salvación syncline of the northern part of the Madre de Dios Basin (South Peru), one of the widest biodiversity hot spots in Amazonia (Torre-Marin Rando et al. Reference Torre-Marin Rando, González-Rojí, Hurni, Mathez-Stiefel, Messmer, Raible, Snethlage, Stocker and Fischer2021). We revise the Neogene stratigraphy of the Salvación syncline and determine the provenance of the Neogene sedimentary rocks. We show that the Neogene sedimentary rocks of the northern part of the Madre de Dios Basin are sourced from the Eastern Cordillera (EC) and the Altiplano and that they have a different provenance to coeval sedimentary rocks of the southern part of the basin (Moizinho et al. Reference Moizinho, Roddaz, Brichau, Louterbach, Dantas, Santos, Bayon, Bailleul, Vink and Hoorn2023). Together with previous findings, our dataset indicates that a long lived intrabasinal drainage barrier may have existed between the Cretaceous and the Pliocene in the Madre de Dios Basin.
2. Geological setting
2.a. Structural setting
The Madre de Dios Basin is located between 12º and 14º S latitudes in the south-eastern part of the Peruvian Andes and Amazonian Basin (Figures 1 and 2). The Madre de Dios Basin comprises the Madre de Dios Sub-Andean Zone (SAZ) and the Madre de Dios foredeep and is included in the southern Amazonian retroarc foreland basin (Roddaz et al. Reference Roddaz, Viers, Brusset, Baby and Hérail2005). The SAZ is separated from the Eastern Cordillera (EC) by the Azulmayo thrust, named ‘Main thrust’ in Perez et al. (Reference Perez, Horton, McQuarrie, Stubner and Ehlers2016) and from the Madre de Dios foredeep by the Tambopata thrust, which corresponds to the Sub-Andean thrust front (Figures 2 and 3). The Madre de Dios foredeep is limited by the Brazilian Shield to the north and northeast and the Fitzcarrald Arch to the north and northwest. In the northern part of the Madre de Dios area (Pongo de Coñeq area, Figures 2 and 3), the piggy-back basin (Salvación syncline) is transported by the Sub-Andean thrust front (Louterbach et al. Reference Louterbach, Roddaz, Bailleul, Antoine, Adnet, Kim, van Soelen, Parra, Gérard, Calderon, Gagnaison, Sinninghe Damsté and Baby2014; Perez et al. Reference Perez, Horton, McQuarrie, Stubner and Ehlers2016). The Salvación syncline comprises Late Cretaceous-Cenozoic marine, tide-influenced and fluvial deposits (Gil Rodriguez, Reference Gil Rodriguez2001, Reference Gil Rodriguez2002; Louterbach et al. Reference Louterbach, Roddaz, Bailleul, Antoine, Adnet, Kim, van Soelen, Parra, Gérard, Calderon, Gagnaison, Sinninghe Damsté and Baby2014). In the southern part of the Madre de Dios area (Inambari area, Figures 2 and 3, Moizinho et al. Reference Moizinho, Roddaz, Brichau, Louterbach, Dantas, Santos, Bayon, Bailleul, Vink and Hoorn2023), the Punquiri piggy-back syncline is also transported eastward by the Sub-Andean thrust front, termed Tambopata thrust (Baby et al. Reference Baby, Calderon, Hurtado and Bandach2018a, b). The strata involved in the Punquiri syncline are Paleogene to Pleistocene in age (Louterbach, Reference Louterbach2014; Baby et al. Reference Baby, Calderon, Hurtado and Bandach2018a, b; Moizinho et al. Reference Moizinho, Roddaz, Brichau, Louterbach, Dantas, Santos, Bayon, Bailleul, Vink and Hoorn2023).
Structural map of the studied area. Seismic lines used by Mélanie Louterbach (Louterbach, Reference Louterbach2014) are indicated by dark blue dashed lines. F1 to F3 refer to the faults identified in seismic lines. Red lines correspond to back-thrust faults. The main outcrops used for stratigraphic review are located on the map, depicted by a star (biostratigraphy) or a yellow rectangle (geochronology).

Geological map of the study area (modified after INGEMMET maps of (Chávez et al. Reference Chávez, Salas, Gutiérrez and Cuadros1997; Vargas Vilchez and Hipólito Romero, Reference Vargas Vilchez and Hipólito Romero1998). The samples analysed in this study are located in this map with a yellow star. The arrows indicate the direction (Puerto Maldonado town) where the modern river sands of the Madre de Dios River have been sampled.

2.b. Stratigraphy of the Madre de Dios Basin
The Cenozoic sedimentary infill of the Madre de Dios Basin comprises approximately 3.3 km of siliciclastic sediments (Gil Rodriguez, Reference Gil Rodriguez2002; Louterbach, Reference Louterbach2014; Moizinho et al. Reference Moizinho, Roddaz, Brichau, Louterbach, Dantas, Santos, Bayon, Bailleul, Vink and Hoorn2023). The detailed stratigraphic record of both the SAZ and foredeep depozones can be found elsewhere (i.e. Gil Rodriguez, Reference Gil Rodriguez2001; Hermoza, Reference Hermoza2004; Roddaz et al. Reference Roddaz, Hermoza, Mora, Baby, Parra, Christophoul, Brusset and Espurt2011). The sedimentary succession of the SAZ consists of the sedimentary rocks of the Palaeocene Huayabamba Formation, the Miocene Ipururo Group and the Plio-Pleistocene Mazuko Formation. The Huayabamba Formation and the Ipururo Group are present in the foredeep but the Plio-Pleistocene Mazuko Formation is absent. The stratigraphic ages of the Cenozoic sedimentary succession are supported by palynological data (Valdivia, Reference Valdivia1974; Caldas and Kehrer, Reference Caldas and Kehrer1982; Gutierrez, Reference Gutierrez1982; Carpenter and Berumen, Reference Carpenter and Berumen1999), thermochronological analysis (Hermoza, Reference Hermoza2004) and radiometry (40Ar/39Ar dating, Campbell et al. Reference Campbell, Heizler, Frailey, Romero-Pittman and Prothero2001; Gil Rodriguez, Reference Gil Rodriguez2001; Moizinho et al. Reference Moizinho, Roddaz, Brichau, Louterbach, Dantas, Santos, Bayon, Bailleul, Vink and Hoorn2023). The Palaeocene Huayabamba Formation consists of estuarine tide-dominated sedimentary rocks of Andean origin (Louterbach et al. Reference Louterbach, Roddaz, Bailleul, Antoine, Adnet, Kim, van Soelen, Parra, Gérard, Calderon, Gagnaison, Sinninghe Damsté and Baby2014, Reference Louterbach, Roddaz, Antoine, Marivaux, Adnet, Bailleul, Dantas, Santos, Chemale, Baby, Sanchez and Calderon2018b). The Ipururo Group of the SAZ consists of three formations: the Bala Formation, Quendeque Formation and Charqui Formation (Roddaz et al. Reference Roddaz, Hermoza, Mora, Baby, Parra, Christophoul, Brusset and Espurt2011). The deposits in these formations are predominantly fluvial to alluvial (Gil Rodriguez, Reference Gil Rodriguez2001, Reference Gil Rodriguez2002; Hermoza, Reference Hermoza2004; Roddaz et al. Reference Roddaz, Hermoza, Mora, Baby, Parra, Christophoul, Brusset and Espurt2011) although some coastal facies have been recognized in the Bolivian Quendeque Formation (Hovikoski et al. Reference Hovikoski, Gingras, Räsänen, Rebata, Guerrero, Ranzi, Melo, Romero, del Prado, Jaimes and Lopez2007a, b). The Ipururo Group of the Peruvian foredeep depozone includes the Ipururo Formation and Units A and B of the Madre de Dios Formation (Campbell et al. Reference Campbell, Heizler, Frailey, Romero-Pittman and Prothero2001). The Miocene age of the Ipururo Formation has been established based on stratigraphic correlations (Hermoza, Reference Hermoza2004). The Late Miocene age of the Madre de Dios Formation is supported by 40Ar/39Ar dating on feldspars at 9.01 ± 0.28 Ma (Campbell et al. Reference Campbell, Heizler, Frailey, Romero-Pittman and Prothero2001). The depositional environment of the Madre de Dios Formation was interpreted as tide-dominated estuaries (Hovikoski et al. Reference Hovikoski, Räsänen, Gingras, Roddaz, Brusset, Hermoza, Pittman and Lertola2005; Roddaz et al. Reference Roddaz, Brusset, Baby and Hérail2006).
2.c. Neogene sedimentary infill and sedimentation rates
The detailed Neogene sedimentary infill of the Madre de Dios Basin has been described in Louterbach (Reference Louterbach2014) and Moizinho et al. (Reference Moizinho, Roddaz, Brichau, Louterbach, Dantas, Santos, Bayon, Bailleul, Vink and Hoorn2023) based on the sedimentary sections outcropping in the Punquiri and Salvación synclines (Figures 2 and 3).
The Neogene sedimentary infill of the Punquiri syncline may be divided into two sedimentary sequences (Moizinho et al. Reference Moizinho, Roddaz, Brichau, Louterbach, Dantas, Santos, Bayon, Bailleul, Vink and Hoorn2023). The first sequence consists of channelized arkosic fine to coarse-grained sandstones fining upward into fine-grained sandstones to siltstones (Moizinho et al. Reference Moizinho, Roddaz, Brichau, Louterbach, Dantas, Santos, Bayon, Bailleul, Vink and Hoorn2023). The base of the channels is composed of cm to dm scale conglomerates. This facies association is comprises siltstones and mudstones overbank deposits and is interpreted as fluvial channel-fill deposits (Moizinho et al. Reference Moizinho, Roddaz, Brichau, Louterbach, Dantas, Santos, Bayon, Bailleul, Vink and Hoorn2023). The second sequence consists of clast supported conglomerates with a medium to coarse-grained arkosic sandstone fining upward to sandstones matrix. This facies developed on an erosive surface and is associated with mudstones and siltstones overbank deposits. The facies association of the second sequence represents braided river deposits (Moizinho et al. Reference Moizinho, Roddaz, Brichau, Louterbach, Dantas, Santos, Bayon, Bailleul, Vink and Hoorn2023). Growth strata deposits are observed in the Late Miocene-Pleistocene sediments of the Punquiri syncline (Louterbach, Reference Louterbach2014; Moizinho et al. Reference Moizinho, Roddaz, Brichau, Louterbach, Dantas, Santos, Bayon, Bailleul, Vink and Hoorn2023). The sedimentation rates calculated using the Petromod 1D software show a twofold increase from the Early-Middle Miocene (212.8–118.2 m/Ma) to the Late Miocene-Quaternary (381.1–354.4 m/Ma, Louterbach, Reference Louterbach2014).
The facies description and facies association of the Neogene sedimentary infill of the Salvación syncline are available in Louterbach (Reference Louterbach2014). Three depositional sequences were interpreted from the Neogene sedimentary infill of the Salvación syncline. The first depositional sequence is Early to Middle Miocene in age and consists of well-developed paleosols and laterally migrating sandy bars interpreted as meandering fluvial deposits (Marivaux et al. Reference Marivaux, Salas-Gismondi, Tejada, Billet, Louterbach, Vink, Bailleul, Roddaz and Antoine2012) and fluvial sandy channels associated with fine grained overbank sediments deposited by a fluvial system under a monsoon-like tropical climate (Antoine et al. Reference Antoine, Roddaz, Brichau, Tejada-Lara, Salas-Gismondi, Altamirano, Louterbach, Lambs, Otto and Brusset2013). The second depositional sequence is Late Miocene-Early Pliocene in age (Louterbach, Reference Louterbach2014). It consists of isolated sandy to conglomeratic channels finning upward to siltstones and abundant overbank deposits including fine laminated mudstones and siltstones and paleosols. It is interpreted as deposited in either a large floodplain across in which the channel meandered or a rapid floodplain aggradation rate relative to the frequency of channel avulsion (Louterbach, Reference Louterbach2014). The third depositional sequence is Late Pliocene to Pleistocene in age. It is composed of thick vertically stacked conglomerates deposited by braided streams in proximal fluvial/alluvial environment (Louterbach, Reference Louterbach2014). Growth strata deposits are observed in the Late Miocene-Pliocene sediments of the Salvación syncline (Louterbach, Reference Louterbach2014). Similary to Punquiri syncline, the sedimentation rates calculated using the Petromod 1D software show a twofold increase from the Early-Middle Miocene (119.98–146.2 m/Ma) to the Late Miocene-Quaternary (359.2.1–344.6 m/Ma, Louterbach, Reference Louterbach2014).
2.d. Biostratigraphic constraints and seismic stratigraphic correlations
The stratigraphic dating of the Salvación syncline (Pongo de Coñeq area) is based on published studies (Marivaux et al. Reference Marivaux, Salas-Gismondi, Tejada, Billet, Louterbach, Vink, Bailleul, Roddaz and Antoine2012; Antoine et al. Reference Antoine, Roddaz, Brichau, Tejada-Lara, Salas-Gismondi, Altamirano, Louterbach, Lambs, Otto and Brusset2013; Louterbach et al. Reference Louterbach, Roddaz, Bailleul, Antoine, Adnet, Kim, van Soelen, Parra, Gérard, Calderon, Gagnaison, Sinninghe Damsté and Baby2014), which described Palaeogene and Neogene outcrops. Three seismic sections, imaging the Pongo de Coñeq SAZ and Madre de Dios foredeep (seismic lines Hepc-09-02, Hepc-09-01 and 96MGLP101), were used to make correlations within the Salvación syncline. The seismic facies were identified in the Cenozoic infill, based on amplitude characteristics and correlated with the Cariyacu-1X well, seismic sections (Hepc-09-01 and Hepc-09-02). The definition of seismic facies and seismic correlations within the northern part of the Madre de Dios Basin was made by Mélanie Louterbach during her PhD thesis (Louterbach, Reference Louterbach2014).
The stratigraphic dating of the Punquiri can be found in Moizinho et al. (Reference Moizinho, Roddaz, Brichau, Louterbach, Dantas, Santos, Bayon, Bailleul, Vink and Hoorn2023). However, it was impossible to correlate the results obtained in the Salvación syncline (Louterbach, Reference Louterbach2014) to those recently published of the southern part of the Madre de Dios Basin (Moizinho et al. Reference Moizinho, Roddaz, Brichau, Louterbach, Dantas, Santos, Bayon, Bailleul, Vink and Hoorn2023). This is because the axis of the Punquiri syncline is offset to the north with respect to that of the Salvación syncline and almost no along-strike fault correlation can be made between the Pongo de Coneq and Inambari area (Figure 2). A possible explanation for the impossibility of seismic and fault correlations could be the presence of unmapped transfer fault or other structures located between the two area, potentially between 71°00′ and 70°30′ where the Tampobata thrust front is offset to the north in the Punquiri syncline (Figure 3).
2.e. Neogene deformation and erosion of the Eastern Cordillera (EC) and Subandean zone (SAZ)
The deformation and erosion of the southern Peruvian Amazonian thrust wedge, which include the EC and SAZ of the Madre de Dios Basin, have been the subject of numerous studies. Based on the construction of balanced-cross sections associated with thermochronology ages and provenance data, Perez et al. (Reference Perez, Horton, McQuarrie, Stubner and Ehlers2016) suggested that the EC started to deform and exhume in the Eocene with the reactivation of Triassic normal fault. A Paleogene age of onset of deformation is also proposed by Baby et al. (Reference Baby, Calderon, Hurtado and Bandach2018a, Reference Baby, Calderón, Hurtado, Louterbach, Espurt, Brusset, Roddaz, Brichau, Eude, Calves, Quispe, Ramirez, Bandach and Bolaños2018b) based on the identification in seismic lines of growth strata deposits associated with the reactivation of Permo-Triassic normal fault. Following this Paleogene period, the northern Bolivian and southern Peruvian Amazonian EC and SAZ experimented significant deformation and erosion during the Neogene in response to the interplay of Climatic and Tectonics processes (McQuarrie et al. Reference McQuarrie, Ehlers, Barnes and Meade2008; Louterbach et al. Reference Louterbach, Fernández, Sisinni, Gutierrez and Zamora2018a; Baby et al. Reference Baby, Calderón, Hurtado, Louterbach, Espurt, Brusset, Roddaz, Brichau, Eude, Calves, Quispe, Ramirez, Bandach and Bolaños2018b; Falkowski et al. Reference Falkowski, Ehlers, McQuarrie, Glover, Perez and Buford Parks2023; Moizinho et al. Reference Moizinho, Roddaz, Brichau, Louterbach, Dantas, Santos, Bayon, Bailleul, Vink and Hoorn2023). Wet climate is advocated to limit the propagation of deformation within the wedge between ca 19 and 8 Ma (McQuarrie et al. Reference McQuarrie, Ehlers, Barnes and Meade2008) and favoured the development of passive roof duplexes combined with other tectonics and lithological processes (Mora et al. Reference Mora, Ketcham, Higuera-Díaz, Bookhagen, Jimenez and Rubiano2014). Tectonics-induced deformation favoured the propagation of the SAZ towards the craton, topographic growth and out of sequence thrusting of the EC since the Late Miocene (Baby et al. Reference Baby, Calderon, Hurtado and Bandach2018a, b; Falkowski et al. Reference Falkowski, Ehlers, McQuarrie, Glover, Perez and Buford Parks2023; Moizinho et al. Reference Moizinho, Roddaz, Brichau, Louterbach, Dantas, Santos, Bayon, Bailleul, Vink and Hoorn2023). Occurrence of Pliocene (U–Th)/He ages across the EC is interpreted as indicating widespread Pliocene incision of the southern Peruvian and Bolivian EC in response to precipitation changes induced by sea surface temperature changes during the global transition from early Pliocene warmth to late Pliocene cooling (Lease and Ehlers, Reference Lease and Ehlers2013). However, evidences of Pliocene growth strata deposits in the SAZ suggest that deformation is also a driver for the Pliocene erosion recorded in the EC and SAZ of the Madre de Dios Basin (Louterbach, Reference Louterbach2014; Moizinho et al. Reference Moizinho, Roddaz, Brichau, Louterbach, Dantas, Santos, Bayon, Bailleul, Vink and Hoorn2023). Paleoelevation models suggest that the Aycacucho region (72–76° longitudes W and 13–15° latitudes S) reached modern elevation as early as 22 Ma and that other parts of the southern Peruvian EC gained 1.5–2 km of elevation between 25 and 10 Ma (Sundell et al. Reference Sundell, Saylor, Lapen and Horton2019). Following these models, modern elevation of the Altiplano and EC adjacent to the Madre de Dios Basin is attained at ca 10 Ma (Sundell et al. Reference Sundell, Saylor, Lapen and Horton2019).
3. Materials and methods
3.a. Sampling and sedimentary sections
The Salvación syncline provides relatively good outcrop conditions for western Amazonia. Three composite sections were constructed in the PhD thesis by Mélanie Louterbach at 1/500 scale, based on three field work campaigns across the Salvación syncline made between 2010 and 2012 (Louterbach, Reference Louterbach2014). The outcrops of the composite sections were only accessible by boat. Rock descriptions were reported at a decimetre scale. Sedimentary hiatuses were estimated using GPS locations and dip measurements. In this study, we only provide the thickness of studied sections, but additional details on sedimentary facies and depositional environments can be found elsewhere (Marivaux et al. Reference Marivaux, Salas-Gismondi, Tejada, Billet, Louterbach, Vink, Bailleul, Roddaz and Antoine2012; Antoine et al. Reference Antoine, Roddaz, Brichau, Tejada-Lara, Salas-Gismondi, Altamirano, Louterbach, Lambs, Otto and Brusset2013; Louterbach, Reference Louterbach2014; Louterbach et al. Reference Louterbach, Roddaz, Bailleul, Antoine, Adnet, Kim, van Soelen, Parra, Gérard, Calderon, Gagnaison, Sinninghe Damsté and Baby2014). The stratigraphic datum was set to the base of the Cretaceous series. The location of all samples collected in this study can be found in the Supplementary Table S1 and in Figure 4. The stratigraphic dating of the Salvación syncline (Pongo de Coñeq area) is based on published studies (Marivaux et al. Reference Marivaux, Salas-Gismondi, Tejada, Billet, Louterbach, Vink, Bailleul, Roddaz and Antoine2012; Antoine et al. Reference Antoine, Roddaz, Brichau, Tejada-Lara, Salas-Gismondi, Altamirano, Louterbach, Lambs, Otto and Brusset2013; Louterbach et al. Reference Louterbach, Roddaz, Bailleul, Antoine, Adnet, Kim, van Soelen, Parra, Gérard, Calderon, Gagnaison, Sinninghe Damsté and Baby2014), which described Palaeogene and Neogene outcrops. In addition, this paper presents a new palynological stratigraphic constraint on one of the outcrops (MD 189). Finally, the details regarding the analytical methods for determining major and trace elements concentrations, Sr–Nd isotopic compositions, detrital zircon U–Pb ages and palynological data can be found in the supplementary dataset (Supplementary information and supplementary Fig. S1).
Synthetic sedimentary log sections measured in the Salvación syncline and in the Pantiacolla anticline, along the Pongo de Coñeq area showing the position of each sample studied for its biostratigraphic content (in blue) and its U–Pb zircon ages or Sr–Nd isotopic compositions (in red). Green rectangles correspond to the outcrop observations made on the field. The location of each seismic marker identified from 2D seismic line Hepc-09-01 is shown in red (T1), orange (T2), yellow (T3) and grey (T4). MD = Samples/Outcrops. Biostratigraphic and provenance results of samples/outcrops MD239, MD176, MD177, MD184, MD85, MD255 and MD256 were published in (Louterbach et al. 2018). Biostratigraphic results of outcrops MD 61 and MD 67 were published in (Marivaux et al. Reference Marivaux, Salas-Gismondi, Tejada, Billet, Louterbach, Vink, Bailleul, Roddaz and Antoine2012) and in (Antoine et al. Reference Antoine, Roddaz, Brichau, Tejada-Lara, Salas-Gismondi, Altamirano, Louterbach, Lambs, Otto and Brusset2013), respectively. (1) refers to (Louterbach et al. 2018), (2) to (Marivaux et al. Reference Marivaux, Salas-Gismondi, Tejada, Billet, Louterbach, Vink, Bailleul, Roddaz and Antoine2012), (3) to (Antoine et al. Reference Antoine, Roddaz, Brichau, Tejada-Lara, Salas-Gismondi, Altamirano, Louterbach, Lambs, Otto and Brusset2013) and (4) to (Louterbach, Reference Louterbach2014) and (5) to this study. Modified from (Louterbach, Reference Louterbach2014).

3.b. Major and trace element concentrations and Sr–Nd Isotopes
3.b.1. Bulk rock
Six fine-grained Neogene sedimentary rocks were collected from river outcrops along the Salvación syncline (see Figure 2 and Table S1 for location). Major and trace element concentrations were measured at the Service d’Analyse des Roches et Mineraux (SARM, INSU facility, Vandoeuvre-Les-Nancy, France) by ICP-OES (Na, Mg, K, Ca, Sc, Ti, Mn, Fe, Al, Si and P) and ICP-MS (Rb, Cs, Ba, Sr, Th, U, Y, Zr, Nb, Hf, Cr, V, Co, Cu, Ni, Zn, La, Ce, Pr, Nd, Sm, Eu, Gd, Tb, Dy, Ho, Er, Tm, Yb, Lu and Ta) after alkaline fusion. Analytical details are available at http://helium.crpg.cnrs-nancy.fr/SARM/ and in Carignan et al. (Reference Carignan, Hild, Mevelle, Morel and Yeghicheyan2001). Precision was better than 5%, for the elements measured by ICP-OES, and 10% for elements measured by ICP-MS. It is possible to use the chemical index of alteration (CIA) to assess the degree of paleo chemical weathering in source regions at the time of sediment deposition (Nesbitt and Young, Reference Nesbitt and Young1982; Fedo et al. Reference Fedo, Wayne Nesbitt and Young1995). This index measures the weathering intensity of feldspars relative to unaltered protoliths and is defined as CIA = [Al2O3/(Al2O3+CaO*+Na2)+K2O)] x 100 (in molar proportions), in which CaO* represents the CaO content in the silicate fraction. To determine CaO*, we have used measured CaO values whenever CaO ≤ Na2O or CaO = Na2O when CaO>Na2O (Bock et al. Reference Bock, Mclennan and Hanson1998). The Eu anomaly was calculated relative to chondrite: Eu/Eu* = EuN/(SmN x GdN)½, where N refers to the chondrite-normalized concentration value (Barrat et al. Reference Barrat, Zanda, Moynier, Bollinger, Liorzou and Bayon2012), in order to assess the basic versus felsic nature of corresponding source rocks (Cullers, Reference Cullers2000) and to the PAAS: Eu/Eu*PAAS = EuPAAS/(SmPAAS x GdPAAS)½, where PAAS refers to the PAAS normalized values (Taylor and McLennan, Reference Taylor and McLennan1985a; Pourmand et al. Reference Pourmand, Dauphas and Ireland2012; Barrat et al. Reference Barrat, Bayon and Lalonde2023;). The Cerium anomaly (ΩCe), normalized to PAAS, was calculated following (De Baar et al. Reference De Baar, Bacon, Brewer and Bruland1985): ΩCe = 2 x (Ce sample/CePAAS)/[(Lasample/LaPAAS) + (Prsample/PrPAAS)], where Xsample is the concentration of samples and XPAAS refers to the PAAS concentration (Barrat et al. Reference Barrat, Bayon and Lalonde2023).
The Nd–Sr isotopic compositions were measured at Geosciences Environment Toulouse (GET). Details regarding the analytical procedures and measurement of Sr–Nd isotopes at GET (Toulouse, France) can be found in the supplementary dataset.
The measured 143Nd/144Nd ratios are expressed as the fractional deviation in parts per 104 (units) from 143Nd/144Nd: ${\rm{{\varepsilon} Nd}}\left( 0 \right) = \left( {{{\left( {^{143}{\rm{Nd}}{/^{144}}{\rm{Nd}}} \right)}_{\rm S}}/{{\left( {^{143}{\rm{Nd}}{/^{144}}{\rm{Nd}}} \right)}_{{\rm{CHUR}}}}-1} \right)^*{10^4}$
where (143Nd/144Nd)S is the present-day ratio measured in the sample and (143Nd/144Nd)CHUR is the 143Nd/144Nd of the Chondritic Uniform Reservoir at present (0.512638; Jacobsen and Wasserburg, Reference Jacobsen and Wasserburg1980).
3.b.2. Labile sedimentary Fe-oxides
The rare earth element (REE) composition of extractable Fe-oxide phases (e.g., ferrihydrite, lepidocrocite) leached from sediments can provide additional constraints for distinguishing bedrock lithology and weathering processes in modern river basins (Bayon et al. Reference Bayon, Lambert, Vigier, De Deckker, Freslon, Jang, Larkin, Piotrowski, Tachikawa, Thollon and Tipper2020; Jang et al. Reference Jang, Bayon, Pourret, Joe, Kim, Byun, Forwick, León and Nam2024). Given the well-defined lithological contrasts within the Madre de Dios Basin (Figure 3), we applied this new approach by analysing Fe-oxide leachates from ten sediment samples from the northern Pongo de Coneq section (n = 4) and the southern Inambari section (n = 6) (Supplementary Fig. S2, Table S1). For a detailed tectono-stratigraphic evolution discussion for the Inambari, the reader is referred to Moizinho et al. (Reference Moizinho, Roddaz, Brichau, Louterbach, Dantas, Santos, Bayon, Bailleul, Vink and Hoorn2023).
Bulk sediment samples were first sieved to obtain the <63 µm fraction and then subjected to a stepwise leaching protocol following the method described by Bayon et al. (Reference Bayon, German, Boella, Milton, Taylor and Nesbitt2002). Carbonates were initially removed using 5% acetic acid (AA). Subsequently, easily reducible iron oxyhydroxides – such as ferrihydrite and lepidocrocite – were extracted using a mixture of 15% AA and 0.05 M hydroxylamine hydrochloride (HH). The leachate was then filtered through a 0.20 µm membrane, evaporated at 120°C for 24 hours, redissolved in nitric acid to eliminate residual HH, evaporated again at 110°C and finally dissolved in 4 M hydrochloric acid.
Major and trace element abundances were determined at the Pôle Spectrométrie Océan (Brest, France) using a Thermo Scientific Element XR sector field (SF) ICP-MS operated in low-resolution mode. Elemental concentrations were calculated using the Tm addition method, following procedures outlined by Barrat et al. (Reference Barrat, Keller, Amossé, Taylor, Nesbitt and Hirata1996) and Barrat et al. (Reference Barrat, Zanda, Moynier, Bollinger, Liorzou and Bayon2012). To assess the precision and accuracy of our data, a series of certified reference materials (BCR-2, DNC-1, GSPN-2, GSPN-3 and GSMC-3) were analysed. The precision for major and trace elements was better than 3 %, and the accuracy of measured concentrations was typically <5 %. The REE concentrations are reported relative to the initial mass of bulk sediment and were normalized to values for the PAAS (Pourmand et al. Reference Pourmand, Dauphas and Ireland2012), denoted by the subscript ‘N’.
3.c. U–Pb dating
Five Neogene sandstones were collected from river outcrops along the Salvación syncline (see Figures 2 and 3 and Table S1 for locations), and one modern sand sample was obtained at Puerto Maldonado to determine their U–Pb zircon age distribution (see Table S1 for locations). Details regarding the LA-ICP-MS U–Th–Pb dating of the analysed samples at the Laboratory of Geochronology of the University of Brasilia (Brazil) can be found in the supplementary information and in Table S2 (supplementary dataset). In short, to ensure data quality, U–Pb age measurements were screened by excluding zircon grains with the following characteristics: (1) elevated 204Pb values; (2) large uncertainties in isotopic ratios (greater than 3%); and (3) discordance exceeding 10% calculated as (1-(206Pb/238U age/207Pb/205Pb age))*100. All resulting data are available in Supplementary Table 2 the 206Pb/238U ratio for grains younger than 1.0 Ga and the 206Pb/207Pb ratio for those older than 1.0 Ga, following the approach of Nemchin and Cawood (Reference Nemchin and Cawood2005).
To statistically compare the detrital age distributions of the analysed samples, we used the standard multidimensional scaling (MDS) statistical technique popularized by Vermeesch (Reference Vermeesch2013). The MDS method is a ‘superset of principal component analysis’ that, given a table of pairwise ‘dissimilarities’ between samples, produces a ‘map’ of points on which ‘similar’ samples cluster closely together and ‘dissimilar’ samples plot far apart (Vermeesch, Reference Vermeesch2013). Following the latest recommendations by Vermeesch (Reference Vermeesch2018), we used the Kolmogorov–Smirnov test to produce an MDS map comparing the analysed samples. The closest and second closest neighbours are linked by solid and dashed lines, respectively, and the goodness of fit was evaluated using the ‘stress’ value of the configuration (0.2 = poor; 0.1 = fair; 0.05 = good; Vermeesch, Reference Vermeesch2013). The MDS map was generated using the provenance package of Vermeesch et al. (Reference Vermeesch, Resentini and Garzanti2016).
We also reported the maximum depositional age for one sample (MD61) calculating the ‘maximum likelihood age’ (MLA). The MLA is a statistical model that assumes that the zircon U–Pb ages defined a two component mixture, in which a ‘fraction of the population is derived from a discrete minimum age peak and the remaining grains follow a (log)normal distribution’ (see Vermeesch, Reference Vermeesch2021 and the references therein). The MLA was calculated using IsoplotR (Vermeesch, Reference Vermeesch2018).
4. Results
4.a. Stratigraphic constraints
Sample MD 189 (Figures 2 and 3, Table S3) was dated based on its palynological content (see the supplementary dataset for details). The presence of Retitriporites crotonicolumellatus from 18.4–0, Cichoreacidites longispinosus from 17.5–0, Polypodiaceoisporites pseudopsilatus from 16.9–0 Ma (Jaramillo et al. Reference Jaramillo, D’Apolito, da Silva-Caminha and Caballero-Rodríguez2025) and Spirosyncolpites spiralis from 18.4–1.5 Ma (Jaramillo et al. Reference Jaramillo, D’Apolito, da Silva-Caminha and Caballero-Rodríguez2025) all suggest that sample MD 189 is Early Miocene to Pleistocene in age. However, because this sample is stratigraphically 2000 m above the 15.6–14.7 Ma MD67 sample in the Shintuya section (Figure 4), we favor a Late Miocene-Pleistocene age for this sample. The extremely high abundance of reworked Palaeozoic megaspores further suggests that these sediments were sourced from a Paleozoic hinterland.
The sample MD 189 presented above, as well as outcrops dated in published studies, was projected along seismic section Hepc-09-01 (Figure 5). These included the MD 61 ‘Pinturan’ biochronological unit (between 18.75 and 16.5 Ma, Marivaux et al. Reference Marivaux, Salas-Gismondi, Tejada, Billet, Louterbach, Vink, Bailleul, Roddaz and Antoine2012), MD 67 (of Colloncuran-early Laventan age, between 15.6 and 13.0 Ma, Antoine et al. Reference Antoine, Roddaz, Brichau, Tejada-Lara, Salas-Gismondi, Altamirano, Louterbach, Lambs, Otto and Brusset2013) and MD 184 (Thanetian age, between 59.2 and 56 Ma, Louterbach et al. Reference Louterbach, Roddaz, Bailleul, Antoine, Adnet, Kim, van Soelen, Parra, Gérard, Calderon, Gagnaison, Sinninghe Damsté and Baby2014). Four seismic markers (T1 to T4) were interpreted for the Neogene sedimentary infill based on their proximity to the biostratigraphic dating at the surface (Fig. S1), according to Louterbach’s PhD (Louterbach, Reference Louterbach2014). The T1 marker corresponds to the outcrop MD67 sample at surface, dated to the late Early to late Middle Miocene and referred to as belonging to the Middle Miocene in this study, for simplification. The T2 marker is close to the Miocene to Pleistocene MD 189 outcrop, located stratigraphically below (Figure 4). Although care must be taken, the T2 marker is between 2400 and 2500 m in the Shintuya section, which is stratigraphically above the Late Miocene to Early Pleistocene MD246 sample, located at 2025m in the Pongo de Coñeq section. It follows that the T2 marker may be younger than Middle Miocene. For this reason, we ascribed a Late Miocene age to the T2 seismic marker. Based on its stratigraphic position and lithostratigraphic correlation with the base of the Plio-Pleistocene correlation of the Mazuko Formation, we assigned a Pliocene age to the T3 marker. The T4 marker is the youngest stratigraphic seismic marker identified in the Salvación syncline. It corresponds to the uppermost erosive surface documented in this syncline and based on the INGEMMET geological map (Figure 3), we interpret it as having a Pleistocene age.
Interpretation of seismic profile HEPC-09-01 across the Salvación syncline and Pantiacolla anticline. Seismic line location is shown on Figure 1. The Neogene reflectors (T1 to T4) were calibrated using dated outcrops (MD66/189, MD 67, MD 184/85, see Supplementary dataset for details). Faults are indicated by thick black lines.

The synthetic sedimentary sections show the thickness, the stratigraphic constraints, the stratigraphic position of each sample analysed for Sr–Nd isotopes and U–Pb dating, and the approximate projection of seismic reflectors T1 to T4 (see Figure 4). A stratigraphic age was ascribed to the Neogene samples analysed for their Sr–Nd isotopes and U–Pb zircon age distribution, based on their position within these sedimentary sections.
The samples MD 83 and MD 61 were collected at the MD 61 outcrop and are late Early Miocene in age, between 18.75 and 16.5 Ma, (Marivaux et al. Reference Marivaux, Salas-Gismondi, Tejada, Billet, Louterbach, Vink, Bailleul, Roddaz and Antoine2012). The samples MD 62A and MD 62B were collected at the MD 62 outcrop estimated to be between 15 and 13 Ma (Louterbach, Reference Louterbach2014). The sample MD 67 was collected at the MD67 outcrop (760 m above the stratigraphic datum) which was dated between 15.6 and 14.7 Ma (Antoine et al. Reference Antoine, Roddaz, Brichau, Tejada-Lara, Salas-Gismondi, Altamirano, Louterbach, Lambs, Otto and Brusset2013). Sample MD 187 was collected 920 m above the stratigraphic datum and 160 m above sample MD 67 in the Shituya section. It is located between seismic marker T1 (Middle Miocene) and T2. Stratigraphically, MD 187 is at a deeper stratigraphic level than MD 62 (Middle Miocene, between 15 and 13 Ma). So we ascribed a Middle Miocene age for MD 187 sample.
Sample MD 252 was collected 600 m above the stratigraphic datum, located between the Palaeocene samples analysed in Louterbach et al. (Reference Louterbach, Roddaz, Bailleul, Antoine, Adnet, Kim, van Soelen, Parra, Gérard, Calderon, Gagnaison, Sinninghe Damsté and Baby2014, Reference Louterbach, Roddaz, Antoine, Marivaux, Adnet, Bailleul, Dantas, Santos, Chemale, Baby, Sanchez and Calderon2018b) and sample MD 61. This sample is thought to be of Early to Middle Miocene in age and is considered to be the oldest sample in this study. Sample MD 61 was obtained 792 m above the stratigraphic datum and is the second oldest analysed sample, inferred to have been deposited between 18.75 and 16.5 Ma (Marivaux et al. Reference Marivaux, Salas-Gismondi, Tejada, Billet, Louterbach, Vink, Bailleul, Roddaz and Antoine2012). Sample MD 243 was obtained 980 m above the stratigraphic datum between MD 61 and MD 62 of Middle Miocene age (15 and 13 Ma; see Louterbach, Reference Louterbach2014). Sample MD 246 is stratigraphically above MD 243 and is located 2025 m above the stratigraphic datum. Based on its palynological content (see Louterbach, Reference Louterbach2014 for details), it is Late Miocene to Pleistocene in age. However, because it is stratigraphically located between seismic markers T2 (Late Miocene) and T3 (Middle Miocene), we favor a Late Miocene age for sample MD 243. Sample MD 251 was obtained from the top of the Pongo de Coñeq sedimentary section (Figure 5), 4200 m above the stratigraphic datum in the Salvación syncline axis. It was sampled at the centre of the syncline and is stratigraphically situated above seismic marker T4 (Pleistocene). Hence, we ascribed a Pleistocene age to this sample MD251.
4.2. Major and trace element concentrations and Sr–Nd isotopes
4.b.1. Bulk rock
The concentrations of both major and trace elements in the analysed samples (Table S4) were normalized against the Post Archean Australian Shales (PAAS) concentration (Taylor and McLennan, Reference Taylor and McLennan1985; Pourmand et al. Reference Pourmand, Dauphas and Ireland2012, Figure 6). All samples show depletion in Cs, Cr, V, Co, Cu and Ni and enrichment in P2O5, Zr, Nb, Hf and Y. Enrichment in CaO was noted in MD62B and MD67, while other samples were depleted. The Al/Si molar ratios of analysed samples range from 0.24 to 0.36 (Table S4). The CIA values of the bulk samples range from 64 to 76.
(a) Major and selected trace element contents of analysed samples normalized to PAAS (Taylor and McLennan, 1985; Pourmand et al. Reference Pourmand, Dauphas and Ireland2012). From left to right on the diagram, these include the major elements (SiO2, TiO2, Al2O3, Fe2O3, MnO, MgO, CaO, Na2O, K2O and P2O5), LILE (Rb, Cs, Ba, Sr, Th and U), HFSE (Y, Zr, Nb, Hf) and TTE (Sc, Cr, Co, V and Ni). (b): Rare earth element (REE) contents of studied samples normalized to PAAS (Taylor and McLennan, 1985; Pourmand et al. Reference Pourmand, Dauphas and Ireland2012).

The analysed samples have slightly lower Cr/Th ratios (5.04–6.60) to those of PAAS (7.53) but quite similar Th/Sc ratios (0.81–0.99) compared to the PAAS value (0.92). The shale-normalized REE patterns of analysed samples are relatively flat, exhibiting slightly positive Eu anomalies (Eu/Eu* between 0.66 and 0.79 and Eu/Eu*PAAS between 1.18 and 1.41). Our samples do not display any particular Ce anomalies (i.e., ΩCe ∼ 1). Radiogenic Nd isotopic compositions range from ƐNd (0) −9.8 and −5.2, Sr isotopic compositions display limited variability with 87Sr/86Sr varying from 0.710571 to 0.718402 (Table 1).
Nd–Sr isotopic systematics of bulk sedimentary rocks analysed in this study

4.b.2. Labile Fe-oxides
The REE concentrations of Fe-oxide leachates from the southern (Inambari) and northern (Pongo de Coneq) sectors of the Madre de Dios Basin reveal distinct compositional differences (Table S5). In the Inambari section, Nd concentrations range from 1.15 to 17.81 µg/g, with the majority of samples falling between 1 and 5 µg/g. By comparison, Nd concentrations in the Pongo de Coñeq samples are lower, ranging from 0.98 to 3.66 µg/g. When normalized to PAAS and further normalized to Gd to minimize dilution effects, the REE patterns highlight a clear mid-REE (MREE) enrichment in the northern Pongo de Coñeq samples (Figure 7a). In contrast, the Inambari samples exhibit relatively elevated light REE (LREE) concentrations compared to heavy REEs (HREE), consistent with flatter or gently LREE-enriched profiles (Figure 7b).
Shale-normalized REE patterns (PAAS; Taylor and McLennan, 1985; Pourmand et al. Reference Pourmand, Dauphas and Ireland2012) for leached Fe-oxide from Neogene sediments of the (a) Pongo de Coneq and (b) Inambari sections. REE concentrations are reported relative to the initial mass of bulk sediment. For clarity, REE data were also normalized GdPAAS to avoid any dilution effect. Concativity indices (CI) were calculated using the weighted geometric means of shale-normalized La and Yb (see text for details). (c) Plot of shale-normalized (Gd/Yb)N versus (La/Gd)N used to discriminate between sources of Fe-oxides in sediments, including secondary Fe-oxides from sulfide oxidation, ancient marine Fe-oxides from sedimentary rock weathering, secondary Fe-oxides from silicate rock weathering and volcanogenic Fe-oxides (Bayon et al. Reference Bayon, Lambert, Vigier, De Deckker, Freslon, Jang, Larkin, Piotrowski, Tachikawa, Thollon and Tipper2020; Jang et al. Reference Jang, Bayon, Pourret, Joe, Kim, Byun, Forwick, León and Nam2024).

4.c. U–Pb dating results
The U–Pb zircon age distributions of analysed samples of the Salvación syncline and modern sands of the Madre de Dios River as well as the percentages of U–Pb zircon ages representing orogenic events of the Amazon craton and Andes are shown in Figures 8 and 9 and in Table 2, respectively. Details of the individual U–Pb zircon ages for each sample are presented in the supplementary material (Table S2) and in the supplementary information. The U–Pb age distributions of all analysed samples are dominated by zircon ages 0.9–1.3 Ga (Grenville/Sunsas), 0.5–0.7 Ga (Brasilian/Pampean), 290–252 Ma (Permian magmatism) and to a lesser extent by zircons ages younger than 130 Ma (Andean Arc) (Table 2 and Figures 8 and 9). The MLA age of MD 61 sample yields an age of 16.31 ± 0.28 Ma (Supplementary Fig. S3), which is in agreement with the “Pinturan” age (between 18.75 and 16.5 Ma) proposed by Marivaux et al. (Reference Marivaux, Salas-Gismondi, Tejada, Billet, Louterbach, Vink, Bailleul, Roddaz and Antoine2012). In the MDS graph (Figure 10), the Early to Middle Miocene samples (MD 61 and MD 252) and the modern Madre de Dios River sediments are connected by solid lines suggesting that they have quite similar U–Pb zircon age distributions. The Middle Miocene samples (MD 243 and MD 61) are also connected by solid and dashed lines with the Permian Mitu sandstones analysed in Spikings et al. (Reference Spikings, Reitsma, Boekhout, Mišković, Ulianov, Chiaradia, Gerdes and Schaltegger2016). The Late Miocene (MD 246) sample is connected by solid lines with the Palaeocene samples analysed in Louterbach et al. (Reference Louterbach, Roddaz, Antoine, Marivaux, Adnet, Bailleul, Dantas, Santos, Chemale, Baby, Sanchez and Calderon2018b) suggesting a good degree of similarity. The Pleistocene sample (MD 251) is connected by dashed lines to the Paleozoic metasediments of the EC analysed in Reimann et al. (Reference Reimann, Bahlburg, Kooijman, Berndt, Gerdes, Carlotto and López2010) and Bahlburg et al. (Reference Bahlburg, Vervoort, Andrew DuFrane, Carlotto, Reimann and Cárdenas2011). The Maastrichtian samples analysed in Louterbach et al. (Reference Louterbach, Roddaz, Antoine, Marivaux, Adnet, Bailleul, Dantas, Santos, Chemale, Baby, Sanchez and Calderon2018b) plot apart from the analysed samples, suggesting that they are dissimilar. Hence, based on Table 2 and Figures 8, 9 and 10, two main differences in U–Pb zircon age distributions can be found along the stratigraphic succession, indicating two main changes in zircon distributions along the succession. The Early to Middle Miocene samples are characterized by an important contribution of Palaeozoic magmatic (especially Permian) zircons. This Permian contribution is dominant for the Middle Miocene sample MD 243 (55.1%, Table 2). The first change was observed between the Middle and Late Miocene. The Late Miocene sample MD 246 is characterized by an increase of Cretaceous Andean Arc and Grenville/Sunsas zircon (13.9% and 56.3%, respectively) and a strong decrease in the Palaeozoic magmatic zircon contribution (3.8%) compared with the Early to Middle Miocene samples. The second change is seen between the Pleistocene and the Late Miocene. The youngest Pleistocene sample (MD 251) has fewer contributions of Cretaceous Andean Arc (1.2%) and Grenville/Sunsas (31.8%) zircons, but a higher contribution of Brazilian/Pampean and Rondonia-San Ignacio zircons (20.0% and 15.3%, respectively) than the late Miocene sample (MD 246). When compared with the Neogene sandstones of the southern part of the Madre de Dios Basin (Moizinho et al. Reference Moizinho, Roddaz, Brichau, Louterbach, Dantas, Santos, Bayon, Bailleul, Vink and Hoorn2023), most of the analysed samples plot apart from the ‘Neogene Inambari’ field and show no connection with these samples, with the exception of the Pleistocene sample (MD 251) and to a lesser extent, the Early Miocene MD 252 sample.
Stratigraphic evolution of U–Pb ages on zircon grains with the kernel density estimates (KDEs, in grey), histograms (light green bars) and pie plots for the analysed samples. The notation n indicates the number of concordant zircon analysed. AA: Andean Arc (less than130 Ma); JA: Jurassic Arc (216–130 Ma); TR: Triassic Rift (250–216 Ma); PMA: Paleozoic Magmatic Arc (0.4–0.25 Ga); FA: Famatinian (0.5–0.4 Ga); B-P: Brazilian-Pampean (0.7–0.5 Ga); G-S: Grenville – Sunsás (1.3–0.9 Ga); R-SI: Rondonia – San Ignacio mobile belt (1.54–1.3 Ga); RN-J: Rio Negro – Juruena mobile belt (1.82–1.54 Ga); V-T: Ventuari-Tapajós (Trans-amazonian) mobile belt (2.0–1.82 Ga); MI: Maroni – Itacaiúnas Province (2.2–2.0 Ga); Central Amazonian: Central Amazonian province (>2.2 Ga).

Stratigraphic evolution of U–Pb ages on zircon grains with the kernel density estimates (KDEs, in dark grey) and histograms (grey) for concordant U–Pb zircon ages younger than 1500 Ma. The notation n = a/b indicates the number of zircon grains where a represent the number of zircon grains with concordant ages younger than 1500 Ma and b the total number of zircon grain with concordant ages. AA: Andean Arc (less than 130 Ma); JA: Jurassic Arc (216–130 Ma); TR: Triassic Rift (250–216 Ma); PMA: Paleozoic Magmatic Arc (0.4–0.25 Ga); FA: Famatinian (0.5–0.4 Ga); B-P: Brazilian-Pampean (0.7–0.5 Ga); G-S: Grenville – Sunsás (1.3–0.9 Ga); R-SI: Rondonia – San Ignacio mobile belt (1.54–1.3 Ga).

Percentages of U–Pb ages representing known orogenic events (bold) on the Amazonian craton and adjacent regions. Age ranges are from Chavez et al. (Reference Chavez, Roddaz, Dantas, Santos and Alván2022) and Reimann et al. (Reference Reimann, Bahlburg, Kooijman, Berndt, Gerdes, Carlotto and López2010)

(a) MDS map based on the U–Pb age distributions of detrital zircons of the analysed samples using the Kolmogorov–Smirnov test. Closest and second closest neighbors are linked by solid and dashed lines, respectively; Data for MD Paleocene (sum of MD85, MD177, MD255 and MD256), MD239 and MD176 can be found in (Louterbach et al. 2018); Mitu Group (1) refers to the Mitu sandstones, Triassic magmatic rocks and Cretaceous sandstone of the Huancané Formation analysed in (Spikings et al. Reference Spikings, Reitsma, Boekhout, Mišković, Ulianov, Chiaradia, Gerdes and Schaltegger2016); Mitu Group (2) refers to the sandstones of the Southern Peru Mitu Group (HUS002, HUS014, POS002, POS003, POS004 and TAS002) analysed in (Panca et al. Reference Panca, Bahlburg, Cárdenas, Berndt, Lünsdorf and Gerdes2024); Paleozoic metasediments EC consists of the sum of the zircon ages of the metasedimentary rocks of the Eastern Cordillera analysed in (Reimann et al. Reference Reimann, Bahlburg, Kooijman, Berndt, Gerdes, Carlotto and López2010) and in (Bahlburg et al. Reference Bahlburg, Vervoort, Andrew DuFrane, Carlotto, Reimann and Cárdenas2011). The “Inambari Neogene” field encompasses all the Neogene sandstones of the southern part of the Madre de Dios Basin analysed in (Moizinho et al. Reference Moizinho, Roddaz, Brichau, Louterbach, Dantas, Santos, Bayon, Bailleul, Vink and Hoorn2023); For convenience, the labels of these samples have been removed but they are shown in supplementary figures S2 and S3; (b) Shepard plot of the U–Pb data showing the transformation from dissimilarity to distances and disparities. The low stress value of 0.067 (∼6.7%) indicates a good transformation (Vermeesch, Reference Vermeesch2013).

5. Discussion
5.a. Provenance interpretation
Sedimentary sorting, weathering and diagenesis might influence the concentrations of major and trace elements and prevent the use of Eu anomalies, Cr/Th ratios and Th/Sc ratios, for determining the provenance of sedimentary rock (McLennan et al. Reference McLennan, Hemming, McDaniel and Hanson1993). The effect of sedimentary sorting may be evaluated using the Al/Si ratio which is a proxy of grain size (Bouchez et al. Reference Bouchez, Gaillardet, France-Lanord, Maurice and Dutra-Maia2011). In this study, the absence of any particular correlation between the Al/Si ratio and Eu/Eu*, Cr/Th and ƐNd (Supplementary Table S6) suggests that sedimentary sorting has not modified these provenance proxies. Additionally, the absence of negative Ce anomalies (ΩCe, Table S4) excludes the presence of significant authigenic smectite that could have possibly formed during post-depositional diagenetic processes (Rodrigues et al. Reference Rodrigues, Roddaz, Santos, Louterbach, D’Apolito, Brusset, Dantas and Negri2023). To summarize, we are confident that the Eu anomaly, Cr/Th and Th/Sc ratios, as well as Nd isotopic compositions, of analysed samples can be used here as robust provenance proxies. The Eu anomalies, the Cr/Th ratios and the Th/Sc ratios support a silicic/felsic nature for source rocks. Indeed, fine-grained sedimentary rocks derived from silicic/felsic sources are characterized by low Eu/Eu* ratios (0.3–0.94), high Th/Sc (> 0.64) and low Cr/Th (< 15) (Cullers, Reference Cullers2000). Additionally, the provenance of Amazonian sedimentary rocks can be distinguished using their Nd isotopic composition (Basu et al. Reference Basu, Sharma and DeCelles1990; Roddaz et al. Reference Roddaz, Viers, Brusset, Baby and Hérail2005). Sedimentary rocks sourced from the Cratonic regions of the Amazon Basin are characterized by more negative ƐNd(0) values, between −13.8 and −25, compared to Andean-derived sediments (Roddaz et al. Reference Roddaz, Viers, Brusset, Baby and Hérail2005; Figueiredo et al. Reference Figueiredo, Hoorn, van der Ven and Soares2009; Nie et al. Reference Nie, Horton, Saylor, Mora, Mange, Garzione, Basu, Moreno, Caballero and Parra2012; Horbe et al. Reference Horbe, Motta, de Almeida, Dantas and Vieira2013; Hoorn et al. Reference Hoorn, Bogotá-A, Romero-Baez, Lammertsma, Flantua, Dantas, Dino, do Carmo and Chemale2017; Rodrigues et al. Reference Rodrigues, Roddaz, Santos, Louterbach, D’Apolito, Brusset, Dantas and Negri2023). The ƐNd(0) values of the analysed samples are higher than −9.8, hence suggesting an Andean source for the Neogene sediments of the Salvación syncline. Modern Sr–Nd isotopic compositions of suspended particulate matter (SPM) transported by tropical south American rivers have different isotopic compositions depending on their drainage basin (Allègre et al. Reference Allègre, Dupré, Négrel and Gaillardet1996; Viers et al. Reference Viers, Roddaz, Filizola, Guyot, Sondag, Brunet, Zouiten, Boucayrand, Martin and Boaventura2008; Santos et al. Reference Santos, Sondag, Cochonneau, Lagane, Brunet, Hattingh and Chaves2015; Rousseau et al. Reference Rousseau, Roddaz, Moquet, Delgado, Calves and Bayon2019), and can be used for reconstructing past drainage configuration in the Amazon Basin. In the 87Sr/86Sr vs ƐNd(0) diagram (Figure 11), the analysed Neogene samples from the northern part of the Madre de Dios Basin plot close to the Altiplano and Solimões SPM fields indicating a similar Andean source and a lithologically similar drainage basin to that of the Solimões. In this diagram (Figure 11), the analysed samples can be distinguished from the Neogene samples of the northern Bolivian SAZ (Roddaz et al. Reference Roddaz, Viers, Brusset, Baby and Hérail2005) and the southern part of the Madre de Dios Basin (Moizinho et al. Reference Moizinho, Roddaz, Brichau, Louterbach, Dantas, Santos, Bayon, Bailleul, Vink and Hoorn2023), which plot closer to the SAZ and Madeira SPM fields. These findings suggest that the Neogene fine-grained sedimentary rocks of the northern part of the Madre de Dios basin have a different Andean source than those of the southern part of the Madre de Dios Basin.
87Sr/86Sr–ƐNd(0) diagram for the Neogene Madre de Dios foreland basin sedimentary rocks compared with several relevant source areas and modern suspended particulate material in western Amazonia. Quaternary Ecuadorian volcanic lavas are from (Barragan et al. Reference Barragan, Geist, Hall, Larson and Kurz1998); the Mesozoic and Neogene volcanic rocks are from (Kay et al. Reference Kay, Coira and Viramonte1994); data for the Central depression, the Altiplano, the Eastern Cordillera and the Subandean zone are taken from (Pinto, Reference Pinto2003; Roddaz et al. Reference Roddaz, Viers, Brusset, Baby and Hérail2005). SPM from the Tapajos, Negro, Urucara and Trompetas (Allègre et al. Reference Allègre, Dupré, Négrel and Gaillardet1996), Madeira and Solimões rivers (Viers et al. Reference Viers, Roddaz, Filizola, Guyot, Sondag, Brunet, Zouiten, Boucayrand, Martin and Boaventura2008) and the Amazon, Orinoco and Maroni rivers (Rousseau et al. Reference Rousseau, Roddaz, Moquet, Delgado, Calves and Bayon2019). The red circles correspond to the Sr–Nd isotopic compositions of the sedimentary rocks of the Southern part of the Madre de Dios Basin analysed in Moizinho et al. (Reference Moizinho, Roddaz, Brichau, Louterbach, Dantas, Santos, Bayon, Bailleul, Vink and Hoorn2023). The blue circles show the Sr–Nd isotopic compositions of the sedimentary rocks of the Southern part of the Madre de Dios Basin (this study). The grey circles indicate the Sr–Nd isotopic composition of the Neogene sedimentary rock of the Beni Basin (north Bolivia) analysed in Roddaz et al. (Reference Roddaz, Viers, Brusset, Baby and Hérail2005). SAFB and PC refer to South Amazonian Foreland Basin (Roddaz et al. Reference Roddaz, Viers, Brusset, Baby and Hérail2005) and Pongo de Coñeq area (Louterbach, Reference Louterbach2014).

The REE composition of leached Fe-oxide fractions from sediments in the Madre de Dios Basin further reveals provenance differences between its northern and southern sectors. Recent studies have shown that mid-REE (MREE) enrichment in Fe-oxides – expressed using the concavity index (CI = GdN/(La6 N × Yb7 N)1/13; Bayon et al. Reference Bayon, Lambert, Vigier, De Deckker, Freslon, Jang, Larkin, Piotrowski, Tachikawa, Thollon and Tipper2020) – is a sensitive tracer of lithological contrasts in drainage basins. In the northern Pongo de Coñeq area (see Figures 2 and 3 for location), Fe-oxides exhibit markedly elevated CI values (4.1 ± 2.6, n = 4; Fig. 7a). In contrast, samples from the southern Inambari region (see Figures 2 and 3 for location) show much lower CI values (1.3 ± 0.4, n = 6; Figure 7b). High CI values (>2.5) are characteristic of regions where oxidative weathering of sulfide-bearing rocks – particularly black shales – can drive the formation of secondary Fe-oxides under low-pH conditions. In these regions, black shale weathering is accompanied by preferential dissolution of MREE-enriched phosphate minerals such as apatite, which can release substantial amounts of dissolved REE in soils than can be subsequently incorporated into neoformed Fe-oxides in soils (Bayon et al. Reference Bayon, Lambert, Vigier, De Deckker, Freslon, Jang, Larkin, Piotrowski, Tachikawa, Thollon and Tipper2020; Jang et al. Reference Jang, Bayon, Pourret, Joe, Kim, Byun, Forwick, León and Nam2024; Moizinho et al. Reference Moizinho, Bayon, Roddaz, Rabineau, Aslanian, Trinquier, Rouget and Santos2026). In this study, it is noteworthy that the Upper Madeira region, where the Pongo de Coñeq samples were collected, is widely recognized as a hotspot for sulfide oxidation in the Amazon headwaters (Moquet et al. Reference Moquet, Crave, Viers, Seyler, Armijos, Bourrel, Chavarri, Lagane, Laraque, Casimiro, Pombosa, Noriega, Vera and Guyot2011, Reference Moquet, Guyot, Crave, Viers, Filizola, Martinez, Oliveira, Sánchez, Lagane, Casimiro, Noriega and Pombosa2016; Torres et al. Reference Torres, West and Clark2015, Reference Torres, West, Clark, Paris, Bouchez, Ponton, Feakins, Galy and Adkins2016; Dellinger et al. Reference Dellinger, Hilton, Baronas, Torres, Burt, Clark, Galy, Ccahuana Quispe and West2023). In contrast, the Inambari samples lack significant MREE enrichment, suggesting limited influence from sulfide weathering processes. Instead, their REE signatures are more typical of secondary Fe-oxides formed in soils through chemical weathering of silicate rocks (CI = 1.6 ± 0.3, n = 24; Bayon et al. Reference Bayon, Lambert, Vigier, De Deckker, Freslon, Jang, Larkin, Piotrowski, Tachikawa, Thollon and Tipper2020). Given the high rates of physical erosion and limited chemical weathering in the Andean and Sub-Andean Zones (Stallard and Edmond, Reference Stallard and Edmond1987), these Fe-oxides likely reflect the recycling of Paleozoic and Precambrian siliciclastic sediments rather than in situ soil formation.
Finally, a difference in provenance between the Neogene sedimentary rocks of the northern and southern part of the Madre de Dios Basin can be also inferred from the U–Pb zircon age distributions. The U–Pb zircon age distribution of the northern part of the Madre de Dios is characterized by the presence of Cretaceous to Cenozoic Andean arc zircons, whereas these zircons are absent from the Neogene samples from the southern part of the Madre de Dios Basin (Moizinho et al. Reference Moizinho, Roddaz, Brichau, Louterbach, Dantas, Santos, Bayon, Bailleul, Vink and Hoorn2023). The difference in provenance is also confirmed by the statistical analysis of the U–Pb zircon distributions of the Neogene samples as shown in the MDS maps (Figure 10 and Supplementary Figs S4 and S5). In these maps, the Neogene sedimentary rocks of the southern part of the Madre de Dios Basin, which were interpreted to be sourced by the EC and SAZ (Moizinho et al. Reference Moizinho, Roddaz, Brichau, Louterbach, Dantas, Santos, Bayon, Bailleul, Vink and Hoorn2023) define a distinct group when compared with the sedimentary rocks from the northern part of the Madre de Dios Basin.
Regarding sediment provenance, all studied samples display a significant proportion of zircons younger than 500 Ma, which typifies an Andean provenance (Hurtado et al. Reference Hurtado, Roddaz, Santos, Baby, Antoine and Dantas2018; Chavez et al. Reference Chavez, Roddaz, Dantas, Santos and Alván2022; Table 3). The presence of Cretaceous and Cenozoic zircons further suggests a subordinate contribution from the Altiplano in all of the samples (Tables 2 and 3) It should be noted that a dominant and significant proportion of Grenville/Sunsas U–Pb zircon ages (0.9–1.3 Ga) in all analysed samples are not useful for differentiating Andean and cratonic sources because the Grenville/Sunsas zircons can be found elsewhere in the Andes (Coastal Cordillera, Altiplano, and EC, Table 3) or in the Amazon craton (Table 3). In addition, the MDS map shows different contributions of the source area during the Neogene. The Early to Middle Miocene sample (MD 252) plots close to the modern sands of the Madre de Dios River, sampled at Puerto Maldonado (MDD River), indicating similar contribution from the different Andean sources. The Middle Miocene samples (MD 243 and MD 61) are connected with the Permian Mitu sandstones analysed in Spikings et al. (Reference Spikings, Reitsma, Boekhout, Mišković, Ulianov, Chiaradia, Gerdes and Schaltegger2016) by solid and dashed lines, indicating a similar provenance. We interpret a dominant EC source because the plutonic Permo-Triassic rocks and the volcanic rocks of the Mitu Formation are in the EC (Spikings et al. Reference Spikings, Reitsma, Boekhout, Mišković, Ulianov, Chiaradia, Gerdes and Schaltegger2016). In addition, we suggest that the strong increase in Permian zircon contributions, the decrease in Brazilian/Pampean zircon contribution and the absence of Cenozoic Andean Arc zircons in the MD 243 sample may be the result of the increasing erosion of the EC. The Late Miocene (MD 246) and Pleistocene (MD 251) samples plot apart from the Middle Miocene samples. The Late Miocene sample (MD 246) is connected to the Paleocene samples of the Pongo de Coñeq area analysed in Louterbach et al. (2018), suggesting a similar provenance. The Pleistocene sample (MD 251) is connected with solid line with the Plio-Pleistocene sample of the southern part of the Madre de Dios Basin by a solid line, suggesting a shared provenance. This sample is also connected to the Palaeozoic metasediments of the Eastern Cordillera analysed in Reimann et al. (Reference Reimann, Bahlburg, Kooijman, Berndt, Gerdes, Carlotto and López2010) and Bahlburg et al. (Reference Bahlburg, Vervoort, Andrew DuFrane, Carlotto, Reimann and Cárdenas2011) by dashed line. We suggest that this Pleistocene sample has greater contributions from the recycled sedimentary rocks of the SAZ, indicating increasing erosion and deformation of the SAZ. This latter hypothesis is supported by (i) the high content of reworked Palaeozoic megaspores found in sample MD 189 which is stratigraphically between MD 246 and MD 251 (Figure 5), (ii) by the increasing contribution of the Brazilian/Pampean zircons to the Pleistocene sample (MD 251) and (iii) by the presence of well-developed Pleistocene growth strata deposits in the Salvación synline that suggest Pleistocene growth of the Pantiacolla anticline and Pongo de Coneq structures (Louterbach, Reference Louterbach2014; Baby et al. Reference Baby, Calderon, Hurtado and Bandach2018a; Figures 2 and 3 for location).
Synthesis of the potential source location for the U–Pb zircon age (see text for details and references); CC: Coastal Cordillera, Alt: Altiplano, EC: Eastern Cordillera; Craton: Amazon craton. Modified from Chavez et al. (Reference Chavez, Roddaz, Dantas, Santos and Alván2022)

CC: Coastal Cordillera, Alt: Altiplano, EC: Eastern Cordillera; Craton: Amazon craton; Modified from Chavez et al. (Reference Chavez, Roddaz, Dantas, Santos and Alván2022).
5.b. Paleogeography and biological implications
Our provenance investigation indicates that two different drainage basins with different Andean sources coexisted during the Neogene in the Madre de Dios Basin (Figures 12 and 13). The northern part of the Basin is characterized by Solimoes-like ƐNd(0) values for fined grained sedimentary rocks, authigenic Fe-oxides formed from sulfide oxidation processes and zircons sourced from the Altiplano, EC and SAZ. In contrast, the southern part displays fine grained sedimentary rocks with Madeira-like ƐNd(0) composition, Fe-oxides formed via silicate weathering processes and zircon derived from the EC and SAZ (Moizinho et al. Reference Moizinho, Roddaz, Brichau, Louterbach, Dantas, Santos, Bayon, Bailleul, Vink and Hoorn2023). Several mechanisms/processes may account for the coexistence of two drainage basins in the same retroarc foreland basin system during the Neogene.
Synthetic sketches showing the paleogeographic evolution of the Madre de Dios Basin during the Neogene based on the results of our provenance interpretations and detailed sedimentological works avalaible in Louterbach (Reference Louterbach2014) and Moizinho et al. (Reference Moizinho, Roddaz, Brichau, Louterbach, Dantas, Santos, Bayon, Bailleul, Vink and Hoorn2023). PC: Pongo de Coñeq; IN: Inambari; AP: Altiplano; EC: Eastern Cordillera; SAZ: Subandean Zone. Modified from Louterbach (Reference Louterbach2014). The depositional systems of the late Early-Middle (1.) period is based on Louterbach (Reference Louterbach2014, see geological setting for details) and the depositional systems of the Middle-Late Miocene and Pliocene periods are based on Louterbach (Reference Louterbach2014) and Moizinho et al. (Reference Moizinho, Roddaz, Brichau, Louterbach, Dantas, Santos, Bayon, Bailleul, Vink and Hoorn2023) for the Pongo de Coñeq area and Inambari areas respectively. The extents of the hydrographic basins that fed the fluvial systems of the Inambari and Pongo de Coñeq areas are tentative but may correspond to the potential sources identified in the provenance interpretation section (5.1). The location of the intrabasinal drainage divide is also tentative but may correspond to the area where thrust faults of the Inambari area are offset to the North when compared with thrust faults of the Pongo de Coñeq area (see geological setting and discussion for details). We hypothesize that this drainage divide might be caused by the presence of a reactivated normal or strike faults. Following forward propagation of the Amazonian thrust wedge during the Neogene, this drainage divide related fault would be involved in the thrust systems of the SAZ as a transfer fault causing the offset of the thrust systems of the Inambari area to the North with respect to those of the Pongo de Coñeq area.

Neogene Paleogeographic maps of the studied area. For all maps, the position and extent of the Jurassic and Cretaceous volcanic Andean arcs are based on (Hurtado et al. Reference Hurtado, Roddaz, Santos, Baby, Antoine and Dantas2018 and the references therein). The location and extent of major tectonic provinces and the ages of their more recent metamorphic events of the Amazon craton are modified and adapted from (Cordani et al. Reference Cordani, Sato, Teixeira, Tassinari and Basei2000). The location of the studied area is indicated by a black rectangle in each map (a) Miocene Paleogeographic map. The extent of the Pebas megawetland is based on (Hoorn et al. Reference Hoorn, Wesselingh, ter Steege, Bermudez, Mora, Sevink, Sanmartín, Sanchez-Meseguer, Anderson, Figueiredo, Jaramillo, Riff, Negri, Hooghiemstra, Lundberg, Stadler, Särkinen and Antonelli2010; Boonstra et al. Reference Boonstra, Ramos, Lammertsma, Antoine and Hoorn2015). The position of the thrust front is approximate and based on sequential reconstruction and structural mapping of (Gil Rodriguez et al. Reference Gil Rodriguez, Baby and Ballard2001; Mora et al. Reference Mora, Parra, Strecker, Sobel, Hooghiemstra, Torres and Jaramillo2008; Espurt et al. Reference Espurt, Barbarand, Roddaz, Brusset, Baby, Saillard and Hermoza2011b; Gautheron et al. Reference Gautheron, Espurt, Barbarand, Roddaz, Baby, Brusset, Tassan-Got and Douville2013; Eude et al. Reference Eude, Roddaz, Brichau, Brusset, Calderon, Baby and Soula2015; Baby et al. Reference Baby, Calderon, Hurtado and Bandach2018a, 2018b; Moizinho et al. Reference Moizinho, Roddaz, Brichau, Louterbach, Dantas, Santos, Bayon, Bailleul, Vink and Hoorn2023). The red, blue and black curves delimit the extent of the Eastern Amazonian Palaeo-drainage Basin (EAPB), the South Western Amazonian Palaeo-drainage Basin (SWAPB) and the North Western Amazonian Palaeo-drainage Basin (NWAPB). The extent of Andes and Eastern Cordillera domains are based on (Roddaz et al. Reference Roddaz, Hermoza, Mora, Baby, Parra, Christophoul, Brusset and Espurt2011). (b) Pliocene paleogeographic map. The blue and black curves delimit the extent of the South Western Amazonian Palaeo-drainage Basin (SWAPB) and the Amazonian Palaeo-drainage Basin (APB). The location and extent of the Iquitos Forebulge (Iquitos Fb) is based on Roddaz et al. (Reference Roddaz, Viers, Brusset, Baby and Hérail2005). The position of the thrust front is approximate and based on sequential reconstruction and structural mapping of (Gil Rodriguez et al. Reference Gil Rodriguez, Baby and Ballard2001; Mora et al. Reference Mora, Parra, Strecker, Sobel, Hooghiemstra, Torres and Jaramillo2008; Espurt et al. Reference Espurt, Barbarand, Roddaz, Brusset, Baby, Saillard and Hermoza2011b; Gautheron et al. Reference Gautheron, Espurt, Barbarand, Roddaz, Baby, Brusset, Tassan-Got and Douville2013; Eude et al. Reference Eude, Roddaz, Brichau, Brusset, Calderon, Baby and Soula2015; Baby et al. Reference Baby, Calderon, Hurtado and Bandach2018a, Reference Baby, Calderón, Hurtado, Louterbach, Espurt, Brusset, Roddaz, Brichau, Eude, Calves, Quispe, Ramirez, Bandach and Bolaños2018b; Moizinho et al. Reference Moizinho, Roddaz, Brichau, Louterbach, Dantas, Santos, Bayon, Bailleul, Vink and Hoorn2023). (c) Pleistocene to present-day configuration of the Amazon Basin. Ina: Inambari River; MDD: Madre de Dios River; FA: Fitzcarrald Arch; CA: Contamana Arch; Iq Fb: Iquitos forebulge; PM: Pastaza Megafan.

Autocyclic change in sedimentary patterns such as stream avulsion or point bar migration which are produced by processes within the sedimentary system (Cecil, Reference Cecil, Cecil and Edgar2003) might induce local change in sedimentary provenance. However we found this hypothesis unlikely because (i) both depositional sequences 1 and 2 from the Pongo Coneq area and the first sequence of the Inambari area consist of meandering or fluvial channel developed in an extensive floodplain area (Louterbach, Reference Louterbach2014; Moizinho et al. Reference Moizinho, Roddaz, Brichau, Louterbach, Dantas, Santos, Bayon, Bailleul, Vink and Hoorn2023) and show no provenance variation upsection (Moizinho et al. Reference Moizinho, Roddaz, Brichau, Louterbach, Dantas, Santos, Bayon, Bailleul, Vink and Hoorn2023; this study) and (ii) the youngest depositional sequences of both area which consists of braided river or alluvial fan deposits show no provenance variation upsections. Differential erosion, linked to marked changes in the spatial distribution of precipitation (rainfall) in the source area, could possibly account for the difference in provenance between the northern and southern parts of the Madre de Dios Basin during the Neogene. However, we find this hypothesis unlikely because there is no evidence of for such differences in rainfall or climatic regimes between the two studied areas during the Neogene. Instead, previous studies have suggested that the Madre de Dios Basin experienced a similar climatic regime to the northern Bolivian Beni Basin (McQuarrie et al. Reference McQuarrie, Ehlers, Barnes and Meade2008) and that the EC adjacent to both basins was affected by a widespread Pliocene incision probably due to the combined effects of changes in paleoclimate (Lease and Ehlers, Reference Lease and Ehlers2013; Falkowski et al. Reference Falkowski, Ehlers, McQuarrie, Glover, Perez and Buford Parks2023) and tectonic surface uplift and deformation in both the EC and SAZ (Moizinho et al. Reference Moizinho, Roddaz, Brichau, Louterbach, Dantas, Santos, Bayon, Bailleul, Vink and Hoorn2023). Differences in the surface uplift of the EC and Altiplano due to differences in deformation might also explain the difference in provenance found between the northern and southern parts of the Madre de Dios Basin. We also found this hypothesis to be unlikely because no significant difference in the Neogene deformation of the SAZ was found to the south to latitude 12°S (Mora et al. Reference Mora, Baby, Roddaz, Parra, Brusset, Hermoza and Espurt2011; Baby et al. Reference Baby, Calderón, Hurtado, Louterbach, Espurt, Brusset, Roddaz, Brichau, Eude, Calves, Quispe, Ramirez, Bandach and Bolaños2018a, b). The available palaeoelevation model also suggests no difference in surface uplift between the northern and southern parts of the Madre de Dios Basin (Sundell et al. Reference Sundell, Saylor, Lapen and Horton2019). Alternatively, we propose that the observed difference in provenance is best reconciled by the presence of a palaeogeographic barrier within the Madre de Dios retroarc foreland Basin (Figure 12). At this stage, the exact location and the mechanisms responsible for the presence of such palaeogeographic barrier during the Neogene remain unclear. A potential candidate might be the intrabasinal Madidi Arch, which is located somewhere in the Madre de Dios SAZ, but this structure may not have affected the Neogene sedimentary record (Figure 2 in McGroder et al. Reference McGroder, Lease, Pearson, DeCelles, Ducea, Carrapa and Kapp2015). Other structural evidences may indicate the presence of this barrier. First, no along strike correlations of thrust faults between the Pongo and Inambari area can be made. The thrust front of the Inambari area is offset to the north with respect to the thrust front of the Pongo de Coneq area (Figures 2 and 3). The F2 and F3 faults that are major faults of the Pongo de Coneq area were not identified in the Inambari area (see Figures 2 and 3). Also, it was not possible to correlate the seismic reflectors identified in the Pongo de Coneq area with those identified in the Inambari area (Louterbach, Reference Louterbach2014). A possible explanation for the impossibility of seismic and fault correlations could be the presence of unmapped transfer fault or other structures located between the two area, somewhere between 71°00 and 70°30W longitude (Figures 2 and 3). In fold and trust belt, transfer faults can develop due to reactivation of pre-existing strike slip and/or normal faults. The presence of such transfer fault has been documented elsewhere in fold and thrust belt around the world including in the Andes and Pyrenees (e.g. Espurt et al. Reference Espurt, Brusset, Baby, Hermoza, Bolaños, Uyen and Déramond2008; Muñoz, Reference Muñoz2017). However, with the dataset we have, more geomorphological and structural works in the Madre de Dios fold and thrust belt are needed to identify correctly the presence of these transfer faults.
Interestingly, different provenance was found for the Cretaceous sedimentary rocks from the northern and southern parts of the Madre de Dios Basin (Rodrigues et al. Reference Rodrigues, Roddaz, Santos, Louterbach, D’Apolito, Brusset, Dantas and Negri2023). Maastrichtian sedimentary rocks from the northern part of the Madre de Dios Basin were sourced by the central part of the Amazonian craton and were part of the same palaeo-drainage system as those located in the other Peruvian and Ecuadorian Amazonian basins (Rodrigues et al. Reference Rodrigues, Roddaz, Santos, Louterbach, D’Apolito, Brusset, Dantas and Negri2023). In contrast, coeval Cretaceous rocks of the southern part of the Madre de Dios Basin were sourced by local cratonic sources and were not connected with this craton wide palaeo-drainage system. Although Palaeogene provenance data are lacking for the southern part of the Madre de Dios Basin, we speculate that the drainage divide highlighted in our study might be inherited from Cretaceous times. Given the fact that the sedimentary rocks of the northern part of Madre de Dios Basin have Solimoes-like ƐNd(0) values and those of the southern part have Madeira-like ƐNd(0) values, we propose that the southern limit of the Maastrichtian to Mio-Pliocene Amazonian palaeo-drainage basin was located within the Madre de Dios Basin (Figure 13). Finally, it follows that the uplift of the Fitzcarrald Arch during the Pliocene (Espurt et al. Reference Espurt, Baby, Brusset, Roddaz, Hermoza, Regard, Antoine, Salas-Gismondi and Bolaños2007, Reference Espurt, Baby, Brusset, Roddaz, Hermoza and Barbarand2011a) is responsible for the latest reorganization of the Amazonian drainage and hence is the mechanism at the origin of the modern configuration of the Amazonian drainage (Figures 12 and 13).
A major implication of our findings is that the presence of a long-lived Cretaceous to Pliocene drainage divide between the northern and southern parts of the Madre de Dios Basin might have promoted endemism and species diversification at that time. Major rivers and their drainage dynamics are suspected to significantly affect the allopatric speciation of Amazonian vertebrates in the Plio-Pleistocene (Ribas et al. Reference Ribas, Aleixo, Nogueira, Miyaki and Cracraft2011). Recent studies have also highlighted the role of landscape dynamics in shaping the geological history of drainage basin connections on the assembly and diversification of Amazonian ‘basin-wide fish faunas’ since the Palaeogene (Cassemiro et al. Reference Cassemiro, Albert, Antonelli, Menegotto, Wüest, Cerezer, Coelho, Reis, Tan, Tagliacollo, Bailly, da Silva, Frota, da Graça, Ré, Ramos, Oliveira, Dias, Colwell, Rangel and Graham2023). For example, Musher et al. (Reference Musher, Giakoumis, Albert, Del-Rio, Rego, Thom, Aleixo, Ribas, Brumfield, Smith and Cracraft2022) ascribed the Cenozoic diversification of the Tityridae (bird) families in the Amazon Basin to be partly caused by barrier displacement and a dynamic spatially heterogenous landscape. Similarly, tectonically driven Amazonian river captures such as the transcontinentalization of the Amazon River that connected eastern and western Amazonia or the Pliocene Fitzcarrald Arch uplift (Espurt et al. Reference Espurt, Baby, Brusset, Roddaz, Hermoza, Regard, Antoine, Salas-Gismondi and Bolaños2007, Reference Espurt, Baby, Brusset, Roddaz, Hermoza and Barbarand2011a) during the Neogene are suspected to have played a major role in the lineage diversification of taxa in the lowlands of the Amazon Basin (Albert et al. Reference Albert, Bernt, Fronk, Fontenelle, Kuznar and Lovejoy2021, and the references therein). The region of the Fitzcarrald Arch, including the Madre de Dios Basin, has high fish diversity, including relatively ancient fish species that originated before the uplift of the Fitzcarrald Arch (Albert et al. Reference Albert, Carvalho, Petry, Holder, Maxime, Espino, Corahua, Quispe, Rengifo, Ortega and Reis2011). The richness of fish species in the Amazon Basin is higher in the western part with fish dispersal progressing eastward (Oberdorff et al. Reference Oberdorff, Dias, Jézéquel, Albert, Arantes, Bigorne, Carvajal-Valleros, De Wever, Frederico, Hidalgo, Hugueny, Leprieur, Maldonado, Maldonado-Ocampo, Martens, Ortega, Sarmiento, Tedesco, Torrente-Vilara, Winemiller and Zuanon2019) after the Amazon River became transcontinental during the Late Miocene (Figueiredo et al. Reference Figueiredo, Hoorn, van der Ven and Soares2009; Gorini et al. Reference Gorini, Haq, dos Reis, Silva, Cruz, Soares and Grangeon2014; van Soelen et al. Reference van Soelen, Kim, Santos, Dantas, Vasconcelos de Almeida, Pires, Roddaz and Sinninghe Damsté2017) and the Pliocene uplift of the Fitzcarrald Arch (Espurt et al. Reference Espurt, Baby, Brusset, Roddaz, Hermoza, Regard, Antoine, Salas-Gismondi and Bolaños2007, Reference Espurt, Baby, Brusset, Roddaz, Hermoza and Barbarand2011a). Interestingly, the Madre de Dios Basin has one of the highest fish species diversity and endemic richness of western Amazonian basins (Oberdorff et al. Reference Oberdorff, Dias, Jézéquel, Albert, Arantes, Bigorne, Carvajal-Valleros, De Wever, Frederico, Hidalgo, Hugueny, Leprieur, Maldonado, Maldonado-Ocampo, Martens, Ortega, Sarmiento, Tedesco, Torrente-Vilara, Winemiller and Zuanon2019). This characteristic probably originated from Miocene times and may be due to its geographic isolation (dispersal limitation). We therefore suggest that the long-lived drainage divide within the Madre de Dios Basin might be one of the drivers for the inherited high diversity and rich endemism of the fish species.
6. Conclusions
The combination of field work, stratigraphic correlation (using a new subsurface dataset) and provenance data (major and trace element concentrations, REE of Fe-oxides, Sr–Nd isotopes and zircon U–Pb dating) from the Madre de Dios Basin yields the following conclusions:
-
• The fine-grained Neogene sedimentary rocks of the northern part of the Madre de Dios Basin have trace element ratios (Cr/Th and Th/Sc) and REE patterns that typify a felsic/silicic source;
-
• They are characterized by Solimões-like ƐNd(0) values for fine-grained sedimentary rocks and zircons sourced from the Altiplano and EC;
-
• Contrasting REE composition of leached Fe-oxides in the Pongo de Coneq and Inambari sections indicates different lithological sources between the northern and southern parts of the Madre de Dios Basin;
-
• The zircon age distribution of the Neogene sedimentary rocks indicates sources located in the Altiplano, EC and SAZ;
-
• The Neogene sedimentary rocks of the northern part of the Madre de Dios Basin have a different provenance than the Neogene sedimentary rocks of the southern part of the Madre de Dios Basin, which are characterized by Madeira-like ƐNd(0) values and zircon sourced from the EC and SAZ (Moizinho et al. Reference Moizinho, Roddaz, Brichau, Louterbach, Dantas, Santos, Bayon, Bailleul, Vink and Hoorn2023);
-
• The observed difference in provenance likely reflects the existence of a palaeogeographic barrier within the Madre de Dios retroarc foreland Basin, although its exact location and the mechanisms responsible for its presence during the Neogene remain unclear.
Finally, given that the Cretaceous sedimentary rocks of the northern and southern parts of the Madre de Dios Basin have different provenance (Rodrigues et al. Reference Rodrigues, Roddaz, Santos, Louterbach, D’Apolito, Brusset, Dantas and Negri2023), we propose that the southern limit of the Maastrichtian to Plio-Pleistocene Amazonian palaeo-drainage basin was located within the Madre de Dios Basin. We also speculate that this long-lived intrabasinal drainage divide might be a driver for endemism and species diversification within the Madre de Dios Basin.
Supplementary material
The supplementary material for this article can be found at https://doi.org/10.1017/S0016756826100636
Acknowledgements
This work received financial and institutional supports by Repsol S.A., Perupetro and the IRD (Institut pour la recherche et le Développement). The field works and sedimentological analyses were undertaken during the PhD of ML. This study was also supported and funded by CAPES-COFECUB program Te 924/18 ‘Paléo-Amazone: evolution Néogène de l’Amazonie Brésilienne’, the joint Brazilian-European facility for climate and geodynamic research on the Amazon River Basin sediment (CLIM-AMAZON) project and the Agence Nationale de Recherche ECLIP-SED project (ANR-20-CE01-0003). Caroline Sanchez is thanked for help in Nd–Sr isotopic composition measurements. We thank the editor Jan Schönig, Heinrich Balburg as well as an anonymous reviewer for helpful comments that improved our manuscript.
Competing interests
The authors declare that they have no known competing financial interests or personal relationships that could have appeared to influence the work reported in this paper.


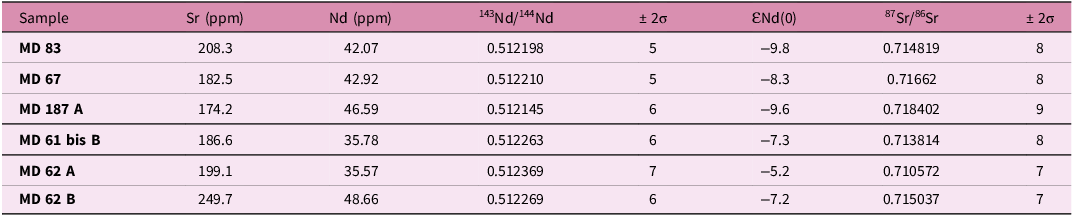


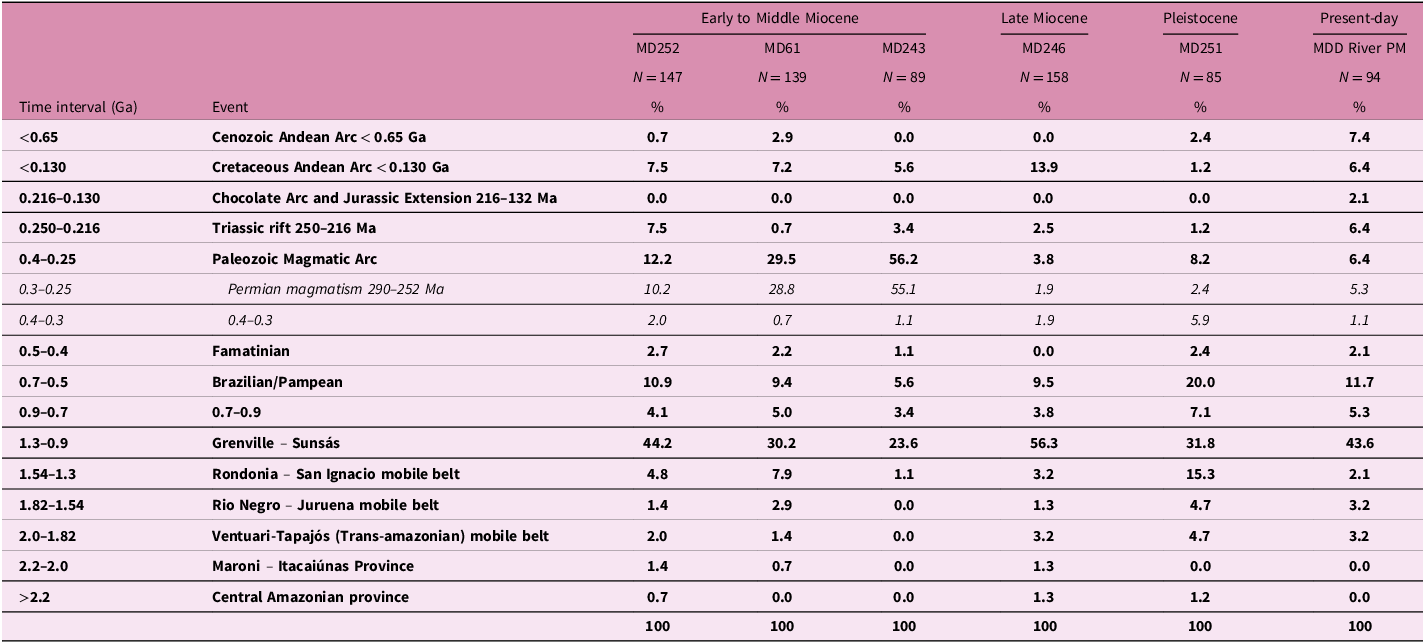


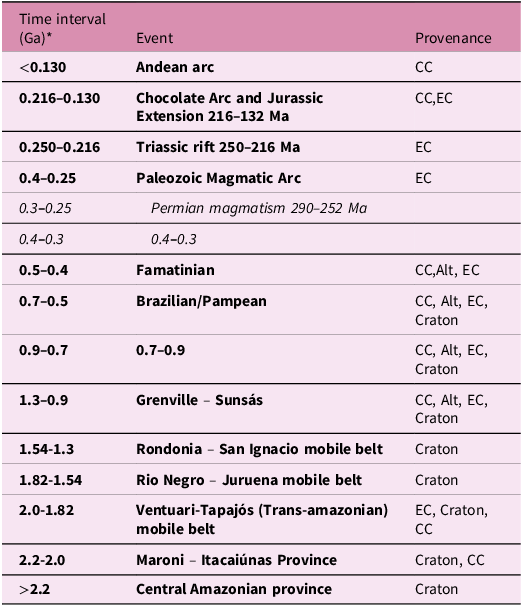


 Open access