





Impact statement
Low-lying atoll islands are among the world’s most vulnerable places on Earth due to rising sea levels. Global computer modelling studies suggest that by 2050, what used to be rare, extreme floods could happen every year in tropical regions. This study examines those predictions by analysing an island flooding event in the Maldives that occurred on 1 July 2022. The flooding was caused by long-period swell waves coinciding with an extremely high tide level and affected 20 islands. The flooding event was simulated with a computer model, and the results were compared with field observations. The model did not get everything right, but it was reasonably accurate in predicting the height reached by the waves and the occurrence of flooding. By looking at all the major storms that occurred over the period 1990–2023, it was concluded that the 1 July flooding event was a relatively rare event. However, with sea levels rising, such flooding could occur every few years by 2050. This prediction ignores any natural or anthropogenic adjustments to the island morphology. Although this study was conducted for one island only, the results have application to other Maldivian islands. This study implies that the expected increase in flood frequency and magnitude over the next few decades requires authorities in the Maldives to act swiftly in assessing future flood risk. Based on such assessments, viable adaptation strategies to mitigate against the adverse impact of flooding need to be identified, evaluated and implemented without delay.
Key points
-
• A distant swell event coinciding with spring high tide resulted in flooding of 20 islands in the Maldives on 1 July 2022.
-
• The event was simulated using one-dimensional XBeach-NH calibrated and validated with a hydrodynamic data set collected on one of the flooded islands.
-
• The 1 July event can be considered a 1:25-year flooding event, but due to sea-level rise, such flooding could occur every few years by 2050.
Introduction
Atoll islands are wave-built accumulations of gravel or sand that sit on top of coral reef platforms. The existence of these islands is intrinsically linked to the reef ecology, as they rely on the reef’s production of sediments; however, their formation, maintenance and dynamics are primarily governed by physical processes involving sea level, waves and currents (Kench, Reference Kench, Masselink and Gehrels2014). Key hydrodynamic processes include: (1) shoaling and frictional dissipation of waves across the forereef (Lowe et al., Reference Lowe, Falter, Bandet, Pawlak, Atkinson, Monismith and Koseff2005; Monismith et al., Reference Monismith, Rogers, Koweek and Dunbar2015); (2) loss in wave energy as waves break on the forereef and in the shallow water across the reef platform (Brander et al., Reference Brander, Kench and Hart2004; Lowe et al., Reference Lowe, Falter, Bandet, Pawlak, Atkinson, Monismith and Koseff2005; Monismith et al., Reference Monismith, Herdman, Ahmerkamp and Hench2013; Beetham et al., Reference Beetham, Kench, O’Callaghan and Popinet2016); (3) generation of long-period waves and wave set-up across the reef (Pomeroy et al., Reference Pomeroy, Lowe, Symonds, Van Dongeren and Moore2012; Cheriton et al., Reference Cheriton, Storlazzi and Rosenberger2016; Masselink et al., Reference Masselink, Tuck, McCall, Dongeren, Ford and Kench2019; Cheriton et al., Reference Cheriton, Storlazzi and Rosenberger2020; Cheriton et al., Reference Cheriton, Storlazzi, Oberle, Rosenberger and Brown2024); and (4) the combined wave motion results at the island beach in wave run-up (Shope et al., Reference Shope, Storlazzi and Hoeke2017; Quataert et al., Reference Quataert, Storlazzi, van Dongeren and McCall2020; Scott et al., Reference Scott, Antolinez, McCall, Storlazzi, Reniers and Pearson2020). If the waves are energetic and the water level is high, the run-up may extend to the top of the island, resulting in (5) overwash and flooding of the island (Beetham & Kench, Reference Beetham and Kench2018; Hoeke et al., Reference Hoeke, Damlamian, Aucan and Wandres2021).
A characteristic feature of atoll islands is their low-lying nature (<2–4 m above mean sea level), which makes them vulnerable to coastal flooding and island inundation during episodic extreme wave and water-level events. Sea-level rise (SLR) is expected to significantly increase the frequency and intensity of coastal flooding, shoreline erosion and saltwater intrusion into the freshwater lens of atoll islands. The most recent report by the Intergovernmental Panel on Climate Change (IPCC, Reference Masson-Delmotte, Zhai, Pirani, Connors, Péan, Berger, Caud, Chen, Goldfarb, Gomis, Huang, Leitzell, Lonnoy, Matthews, Maycock, Waterfield, Yelekçi, Yu and Zhou2021) predicts a global mean SLR by 2100 (relative to 1986–2005) of 0.44–0.76 m according to the intermediate emission scenario SSP2-4.5. Several recent studies have used such sea-level projections together with wave transformation models to forecast future flooding on specific atoll islands (Beetham et al., Reference Beetham, Kench, O’Callaghan and Popinet2016; Storlazzi et al., Reference Storlazzi, Gingerich, van Dongeren, Cheriton, Swarzenski, Quataert, Voss, Field, Annamalai, Piniak and McCall2018; Brown et al., Reference Brown, Wadey, Nicholls, Shareef, Khaleel, Hinkel, Lincke and McCabe2020; Amores et al., Reference Amores, Marcos, Le Cozannet and Hinkel2022) or atoll islands in general (Quataert et al., Reference Quataert, Storlazzi, van Rooijen, Cheriton and van Dongeren2015; Beetham et al., Reference Beetham, Kench and Popinet2017; Pearson et al., Reference Pearson, Storlazzi, van Dongeren, Tissier and Reniers2017; Beetham & Kench, Reference Beetham and Kench2018). Global application of flooding models further predicts that extreme sea levels (i.e., those that have a 1:100 probability of occurrence) will become increasingly common due to SLR (Taherkhani et al., Reference Taherkhani, Vitousek, Barnard, Frazer, Anderson and Fletcher2020). It is suggested that, even under a modest SLR scenario, a large part of the tropics, where all atoll islands are located, would be exposed annually to the present-day 100-year event from 2050 (Vousdoukas et al., Reference Vousdoukas, Mentaschi, Voukouvalas, Verlaan, Jevrejeva, Jackson and Feyen2018).
Hydrodynamic models used for predicting the impact of SLR on atoll islands invariably assume that the islands are inert features and that there is no morphological adjustment to the island. This is an oversimplification, as many observational studies have reported on the physical and morphological impacts of extreme wave and water-level events leading to atoll island inundation and overwash, either as a result of tropical cyclones (Maragos et al., Reference Maragos, Baines and Beveridge1973; Baines & McLean, Reference Baines and McLean1976; Scoffin, Reference Scoffin1993; Kayanne et al., Reference Kayanne, Aoki, Suzuki, Hongo, Yamano, Ide, Iwatsuka, Takahashi, Katayama, Sekimoto and Isobe2016; Duvat & Pillet, Reference Duvat and Pillet2017), distant swell events (Hoeke et al., Reference Hoeke, McInnes, Kruger, McNaught, Hunter and Smithers2013; Smithers & Hoeke, Reference Smithers and Hoeke2014; Wadey et al., Reference Wadey, Brown, Nicholls and Haigh2017; Duvat et al., Reference Duvat, Pillet, Volto, Terorotua and Laurent2020) or tsunami (Kench et al., Reference Kench, McLean, Brander, Nichol, Smithers, Ford, Parnell and Aslam2006; Gischler & Kikinger, Reference Gischler and Kikinger2007; Kan et al., Reference Kan, Ali and Riyaz2007; Kench et al., Reference Kench, Nichol, Smithers, McLean and Brander2008; Hoeke et al., Reference Hoeke, McInnes, Kruger, McNaught, Hunter and Smithers2013). These morphological impacts have also started to become modelled physically (Tuck et al., Reference Tuck, Ford, Masselink and Kench2019a; Tuck et al., Reference Tuck, Kench, Ford and Masselink2019b; Tuck et al., Reference Tuck, Ford, Kench and Masselink2021) and numerically (Masselink et al., Reference Masselink, Beetham and Kench2020; Roelvink et al, Reference Roelvink, Masselink, Stokes and McCall2025; Yao et al., Reference Yao, Kuang, Zhao, Song and Chen2025), and can increase island resilience. Ignoring the morphological impacts of SLR on atoll islands, it is widely considered that many of the atoll islands will be uninhabitable by the mid-21st century because of SLR exacerbating wave-driven flooding (Storlazzi et al., Reference Storlazzi, Gingerich, van Dongeren, Cheriton, Swarzenski, Quataert, Voss, Field, Annamalai, Piniak and McCall2018).
The general aim of this study is to present field observations and numerical model results of atoll island flooding as a result of a distant-swell event coinciding with an extra high spring tide using a locally calibrated and validated numerical model, and apply this model to investigate future flood risk due to SLR. The flooding event, which occurred on 1 July 2022 (referred to as the ‘1 July event’), affected more than 20 islands across several of the southern atolls of the Maldives and was the most significant flooding event in the region since at least 2007. Other studies have investigated increased island flooding in the Maldives due to SLR (Amores et al., Reference Amores, Marcos, Pedreros, Le Cozanet, Lecacheux, Rohmer, Hinkel, Gussman, van der Pol, Shareef and Khaleel2021; Reference Amores, Marcos, Le Cozannet and Hinkel2022); however, these previous investigations have used uncalibrated hydrodynamic models and idealised topographic profiles. The specific objectives of this article are to extend previous studies on flooding in the Maldives by: (1) documenting the relatively rare 1 July event and probabilistically characterising the oceanic forcing conditions (Section title “Study area and 1 July event”); (2) using data collected from one of the flooded islands just after the flooding event to describe the hydrodynamic conditions across the reef platform (Section title “Results field campaign”); (3) reproducing the flooding event using a phase-resolving numerical model (XBeach-NH) that is calibrated and validated with the local hydrodynamic data (Section title “Results of numerical modelling”); and (4) applying the numerical model to all 158 storms that occurred over the period 1993–2022 and evaluating island flooding risk in the past, present and future (Section title “Application of the model to past, present and future island flooding”).
Study area and 1 July event
Description of study area: Geography and oceanography
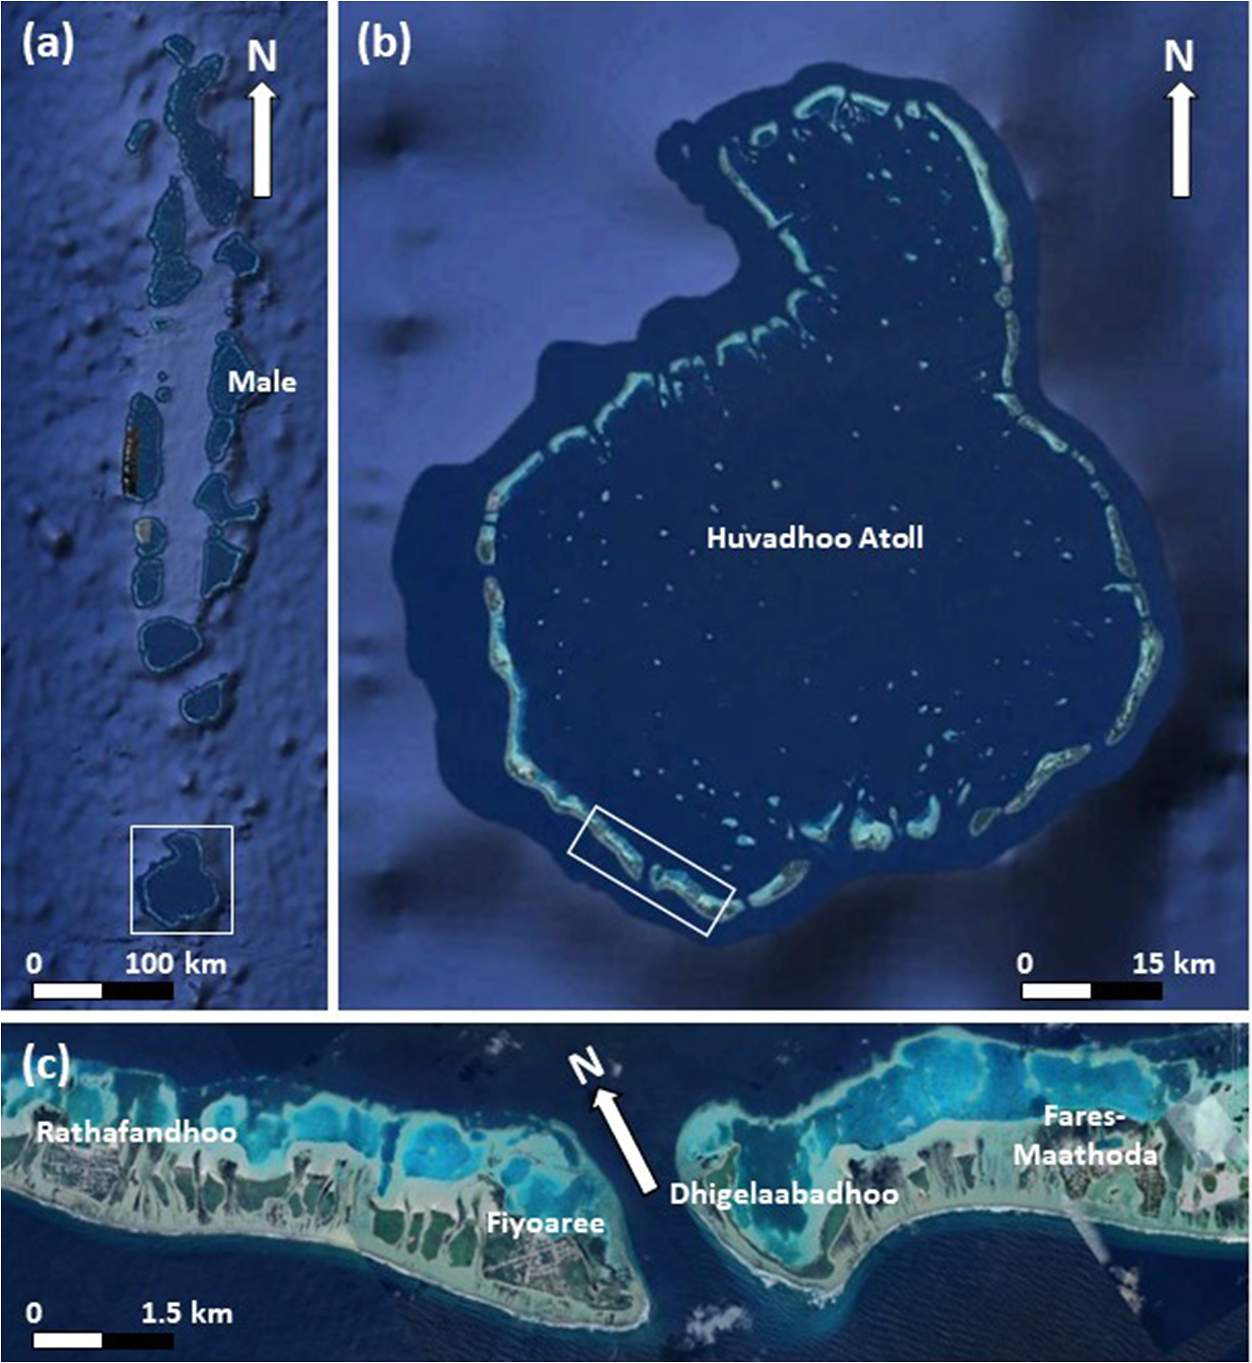
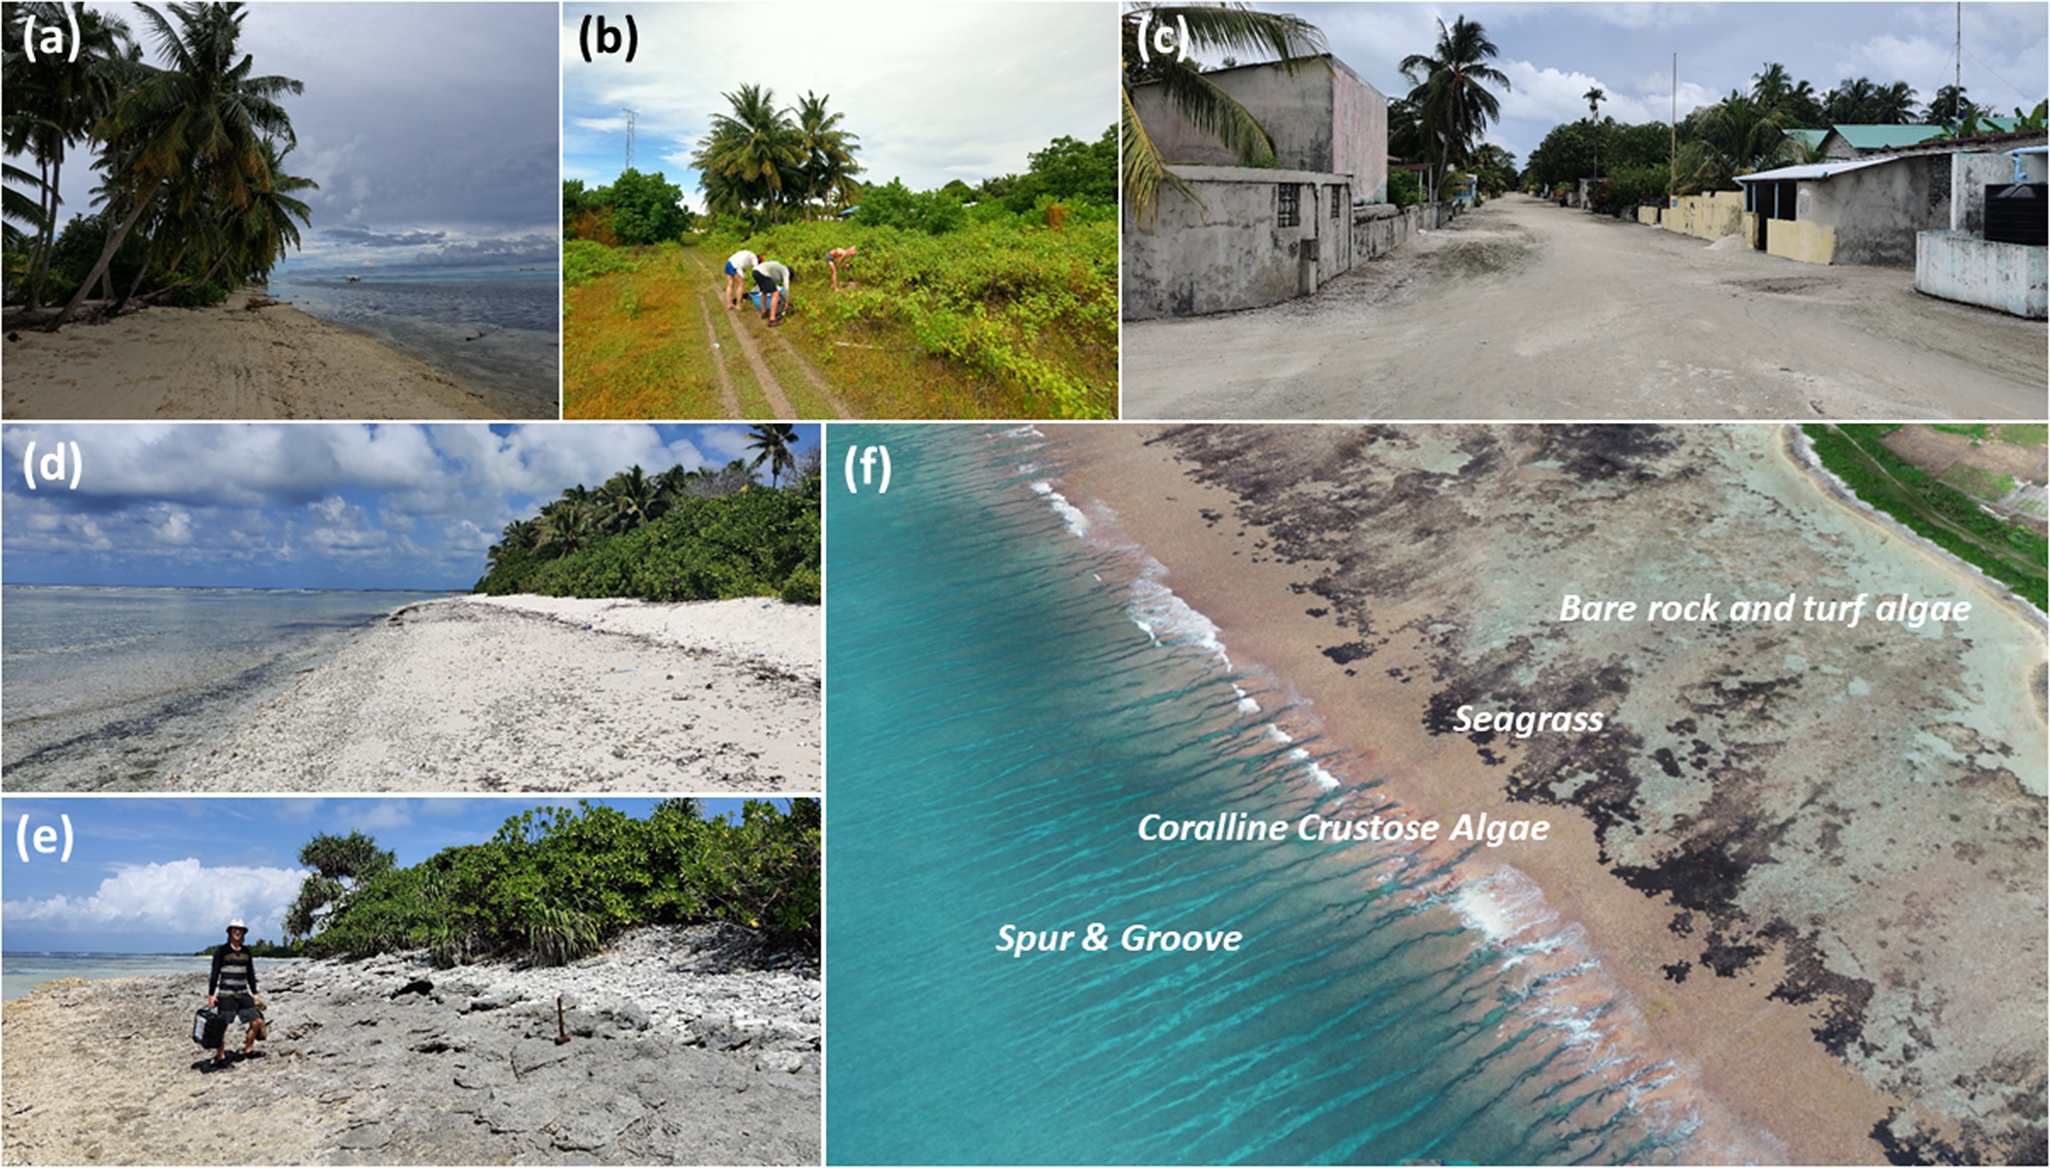
Huvadhoo Atoll is the southernmost of the large atolls in the Maldives (Figure 1a, b), and the main study site, the island of Fiyoaree, is located along the most exposed southwest (SW) rim of the atoll. Fiyoaree has much in common with the inhabited islands of Rathafandhoo to the west and Fares-Maathoda (Figure 1c) to the east, which are also considered in this study. Fioyaree is 1,600 m long and 600 wide, and is fronted by a c. 200-m wide reef platform. The island has a population of c. 1,500. Outside the build-up area (Figure 2c), the island consists of a mixture of farmland (southeast [SE] and northwest [NW] of the village; Figure 2b), palm trees (NW tip of the island) and mangroves (SE tip of the island). Most of the island is elevated 1–1.5 m above mean sea level (MSL), but a part-natural and part-maintained gravel ridge is present around the margin of most of the island, especially along the most exposed part (Figure 2d,e). As part of a groundwater survey of Fiyoaree commissioned by the Maldives Government, the elevation of the island crest was surveyed at various locations along the ocean beach and indicated a typical elevation of 1–1.5 m MSL for the NW and SE margins of the island, and c. 2 m MSL for the central part of the island (MoEnv., 2020). The ocean sandy beach is widest along the central part of the island (Figure 2d), and is replaced by a coral rubble beach towards the NW and SE tips of the island. A sandy beach is also present along the lagoon shore (Figure 2a).
(a) Map of the Maldives with box indicating Huvadhoo Atoll. (b) Satellite image of Huvadhoo Atoll with box demarcating studied atoll islands. (c) Satellite image of Rathafandhoo, Fiyoaree, Dhigelaabadhoo and Fares-Maathoda. Source: GoogleMap.

Representative photos taken from key environments on Fiyoaree. (a) Lagoon beach; (b) agricultural area in the island interior; (c) centre of the village; (d) sandy ocean beach; (e) conglomerate platform with coral rubble ridge along the ocean-side flanks of the island; and (f) drone photograph of reef platform fronted by forereef characterised by an extensive spur-and-groove system. Source: Authors.

The reef platform in front of the island has an elevation of c. -0.5 m MSL and is covered by water under practically all wave and tide conditions. The platform is relatively devoid of sediment; gravel sheets/ridges, found on some of the neighbouring islands and in the shallow passages between islands, are not present. The platform is either bare rock, or covered with turf algae or seagrass (Figure 2f). The only significant sediment store on the platform is a c. 0.2-m high and 10-m wide seagrass-covered ‘bar’ or ‘terrace’ present just seaward along the toe of most of the beach, and mainly composed of silt and fine-sand material. Live coral is present on the reef platform mainly within localised depressions in the platform that are permanently submerged. At the seaward margin of the reef platform, an extensive and elevated region with crustose coralline algae and other corals is present. Seaward of this region, the topography drops down steeply with a gradient of 0.08 across the heavily spur-and-grooved and highly rugose forereef (Figure 2f). The spur-and-groove topography is highly variable, but a typical spacing is 10–15 m, and the maximum depth of the grooves relative to the spurs can be up to several meters.
The Maldives are micro-tidal, and the mean neap and spring tide range at the study site is 0.5 and 1 m, respectively (based on tide gauge record from Gan, located 100 km south of the study area on Addu Atoll, but considered representative of the tides in the study area). Although the region can be affected by distant cyclone-generated waves, it is located outside the cyclonic belt, and surge levels are generally <0.15 m (also based on Gan tide gauge data). The Maldives are affected by four types of wave conditions (Amores et al., Reference Amores, Marcos, Le Cozannet and Hinkel2022): SW Monsoon, SW Swell, SE Swell and NE Monsoon. The largest waves affecting the SW rim of Huvadhoo Atoll (including Fiyoaree) are SW Swell, and these tend to be maximised during the period June–August, with typical and maximum wave heights of 1 and 2.5 m, respectively. According to a modelling study by Amores et al. (Reference Amores, Marcos, Pedreros, Le Cozanet, Lecacheux, Rohmer, Hinkel, Gussman, van der Pol, Shareef and Khaleel2021), the 1 in 100-year Hs associated with SW swell at the study site is c. 3.5 m.
Despite the low elevation of Fiyoaree (generally <2 m above MSL), island flooding (by ocean waves) is a rare occurrence. In recent times, significant island flooding occurred in September 1987, December 2004 (Boxing Day tsunami) and May 2007, and, throughout the Maldives, a combination of high tides with large waves and long periods (>15 s) is considered necessary to induce flooding (Wadey et al., Reference Wadey, Brown, Nicholls and Haigh2017). Under energetic wave conditions coinciding with high tide, the gravel ridge along the island’s margin does get activated regularly, but its elevation and dense vegetation generally prevent significant island flooding.
Climatic and oceanographic conditions during the 1 July event
The 1 July flooding event was the result of a combination of high water levels and energetic, long-period waves, but measured water level and wave conditions for the study site are not available. Therefore, water level data were obtained from the Gan tide gauge, and wave data were obtained for a grid cell SW of Fioyaree [73°, 0°] from the Copernicus Marine Environment Monitoring Service (CMEMS) Global Ocean Waves Analysis and Forecast [Global Ocean Waves Analysis and Forecast|Copernicus Marine Service (https://data.marine.copernicus.eu/product/GLOBAL_ANALYSISFORECAST_WAV_001_027/description)], representing a water depth of 1,000 m, based on the Météo-France WAve Model (MFWAM) (Ardhuin et al., Reference Ardhuin, Rogers, Babanin, Filipot, Magne, Roland, Van der Westhuysen, Queffeulou, Lefevre, Aouf and Collard2010).
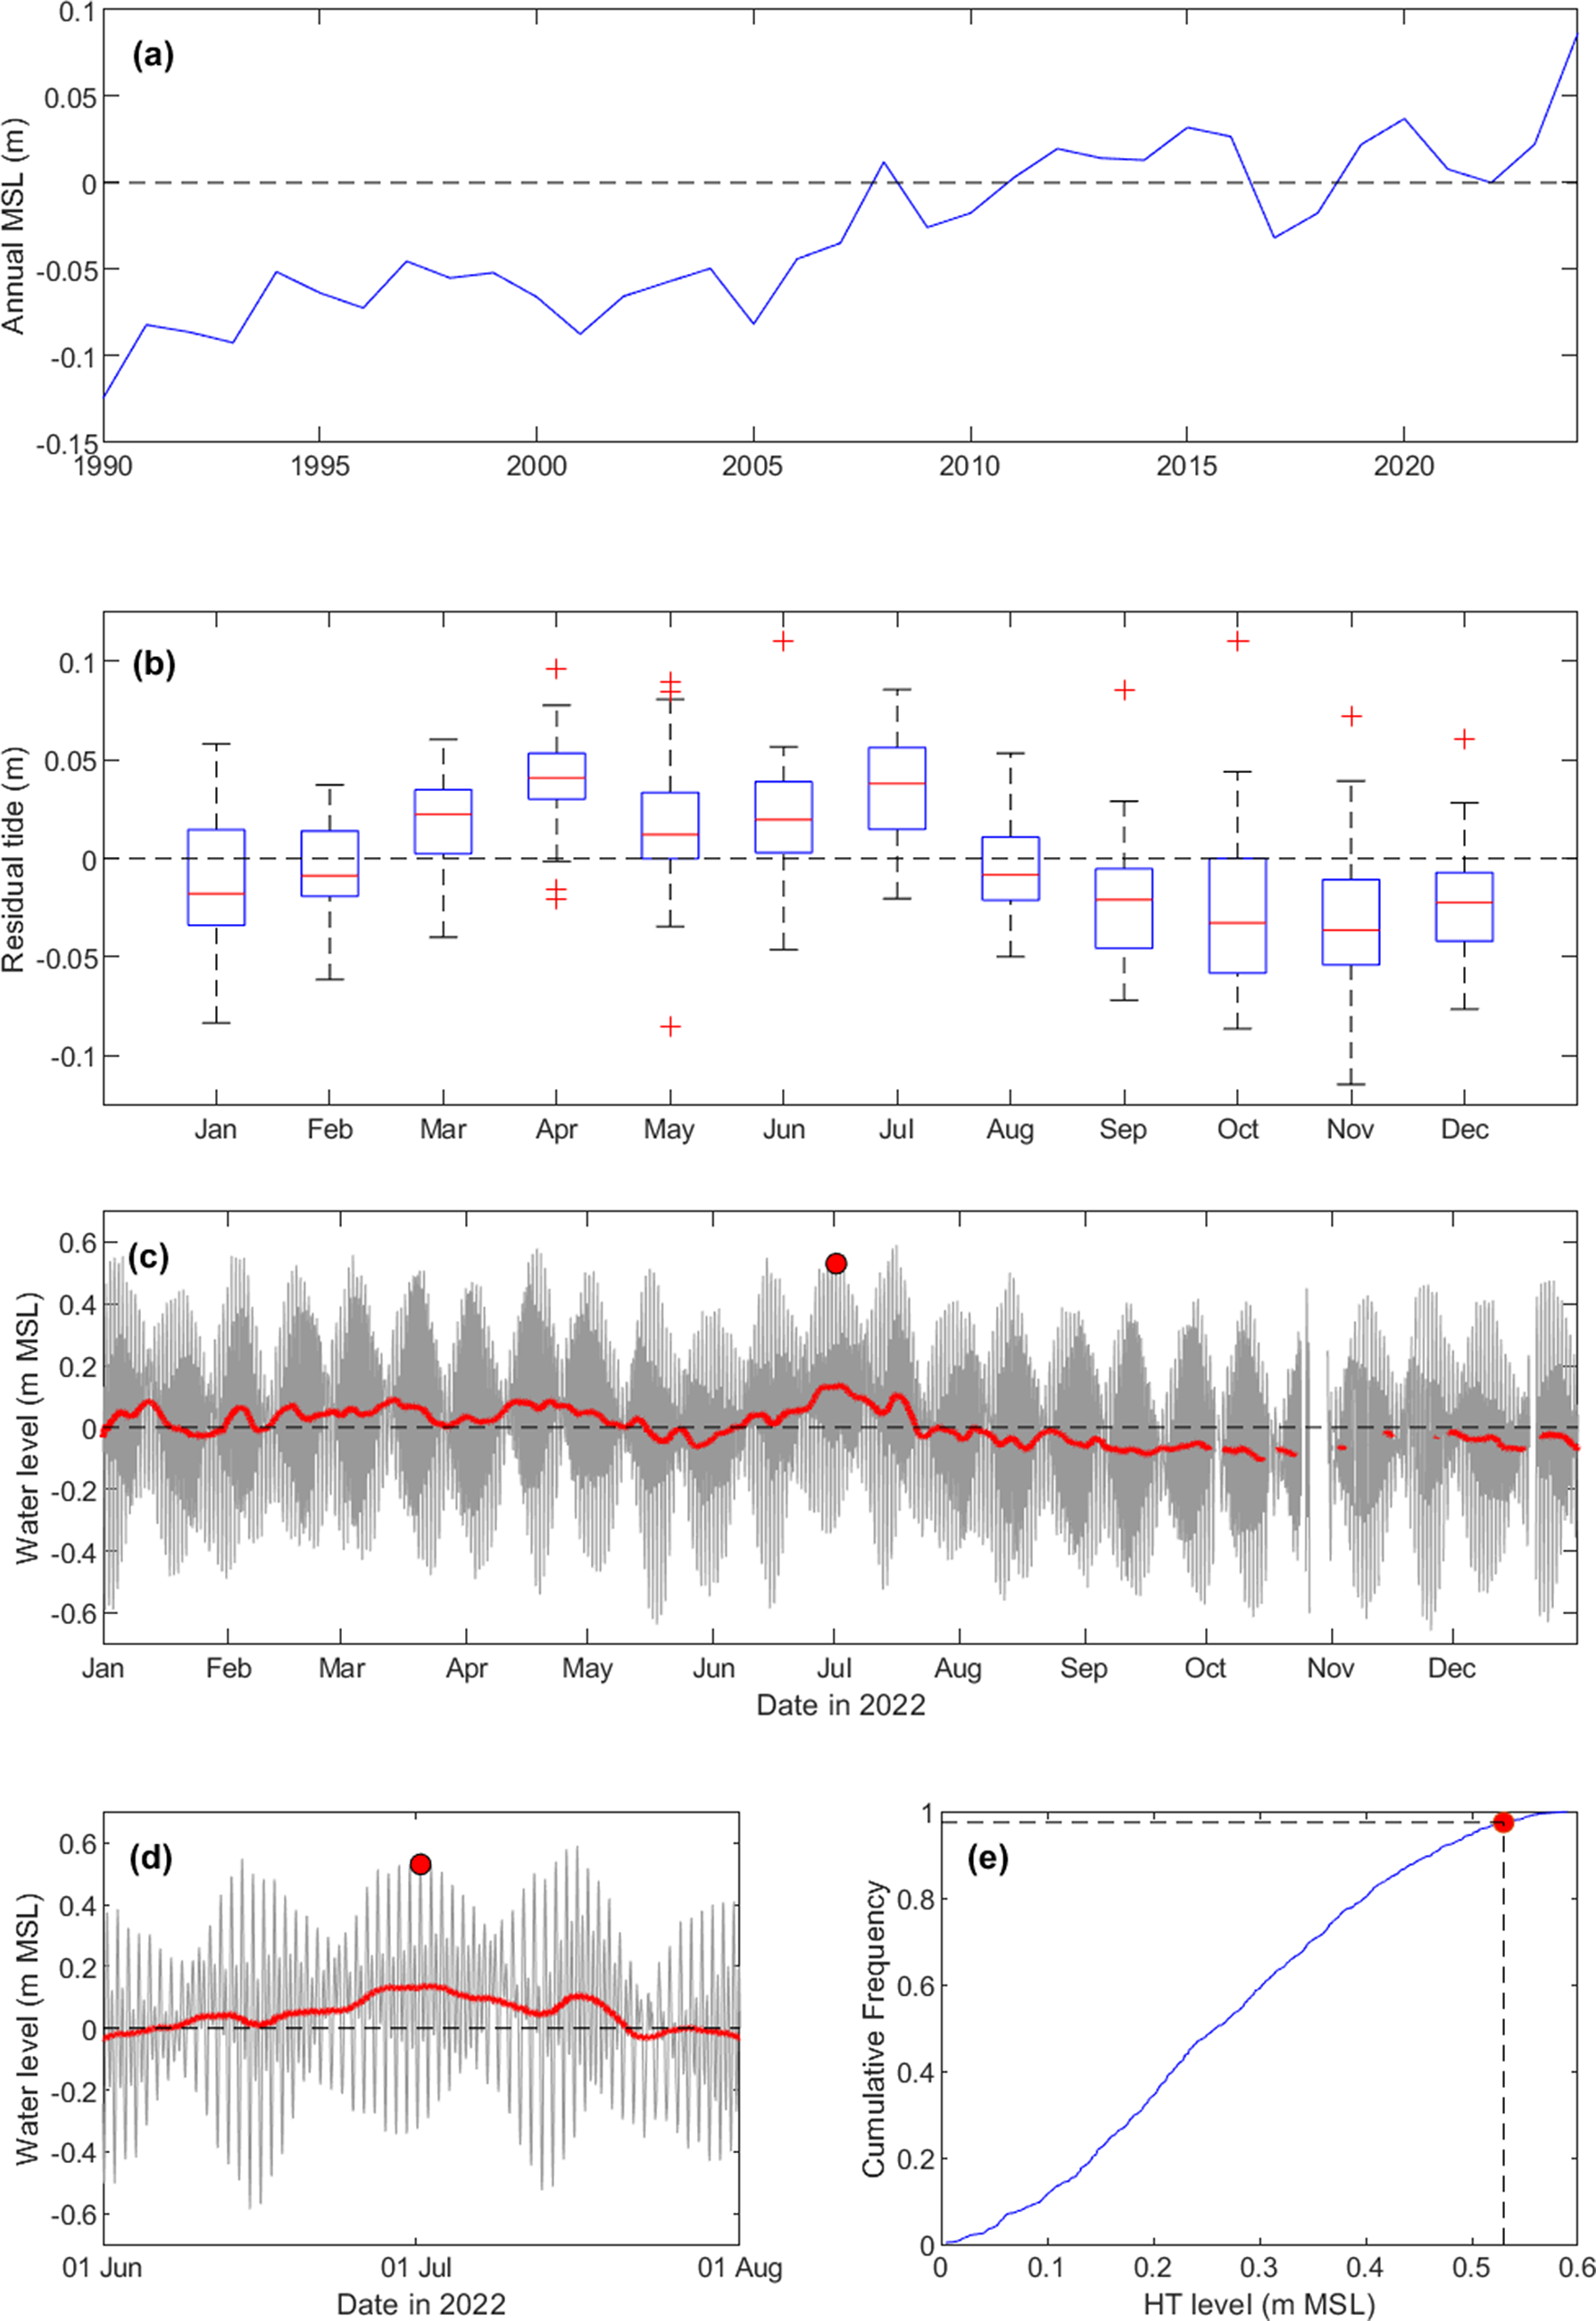
The sea level during the 1 July event was placed in a wider context using the full sea-level data set (1990–2023) from Gan (Figure 3). Sea level at Gan is considered representative of the water level at the study site (with a 30-min time lag), based on a comparison between the Gan sea-level data and that measured in the harbour of Fares-Maathoda located 6 km east of Fioyaree over several months in 2022 (not shown). The SLR over the 1990–2023 period of c. 15 cm recorded by the Gan tide gauge (Figure 3a) represents a rate of SLR of just over 4 mm/yr. The 1 July event was characterised by a maximum water level of 0.53 m MSL. This represents an exceedance probability of 2.5% when considering all high tides of 2022 (Figure 3e). When the complete 34-year sea-level time series of Gan is considered, the 0.53 m MSL represents an exceedance probability of 1.2%. The 2-, 10- and 100-year return period water levels for Gan, computed using the Generalised Extreme Value (GVE) distribution, are 0.57, 0.63 and 0.66 m MSL, respectively. The tidal residual for Gan during several weeks around the 1 July event was 0.15 m (Figure 3d). Although this is relatively modest, it is the highest non-tidal residual that occurred during 2022 (Figure 3c). Inspection of satellite data indicated that the non-tidal residual was associated with a large ‘bulge’ of warm water to the SW of Maldives that moved to the southern atolls of the Maldives (not shown), causing unusually high water levels for more than a week. The residual tide at Gan for the period March–July (coinciding with the SW monsoon) is generally associated with a positive residual, with a mean monthly value of c. 0.05 m (Figure 3c).
Analysis of tide gauge data from Gan: (a) Annual mean water level for period 1990–2023; (b) box plot of the monthly mean water level for the period 1990–2023; (c) water-level time series for 2022; (c) water-level time series for June and July 2022; and (d) cumulative frequency of all high tides during 2022. The 1 July event is indicated by a red circle, and the red line in panels (c) and (d) represents a 3-day moving average of the non-tidal component of the water level (i.e., residual tide). In the boxplot, the central mark indicates the median; the bottom and top edges of the box indicate the 25th and 75th percentiles, respectively; the whiskers extend to the most extreme data points not considered outliers; and the outliers are plotted individually using the ‘+’ marker symbol.

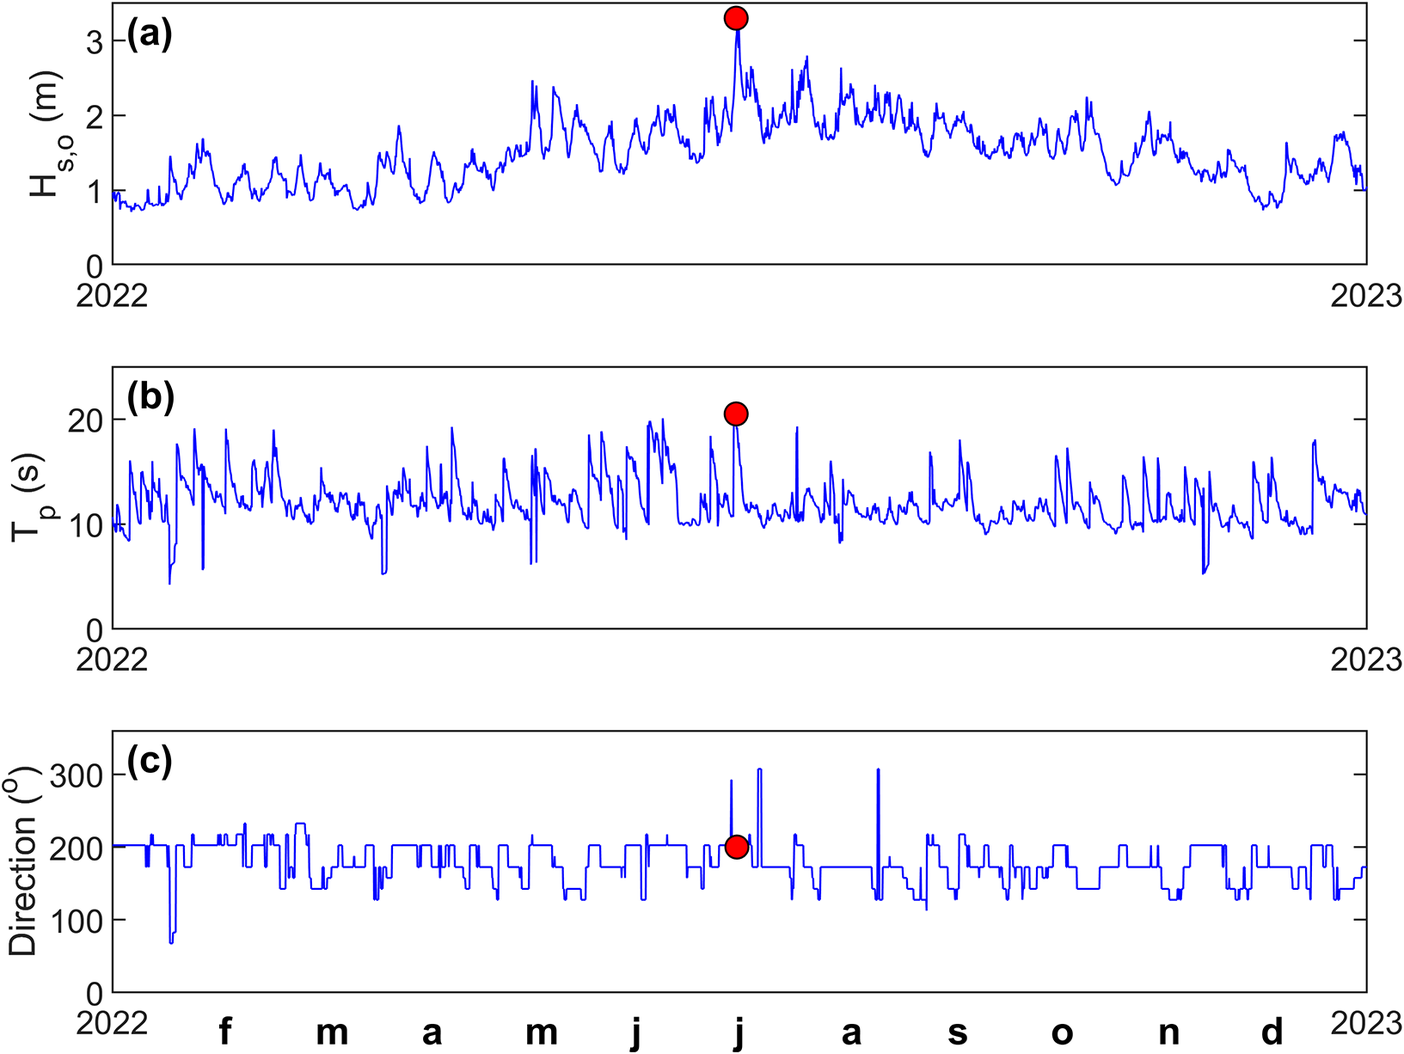
Three-hourly MFWAM-modelled wave data were used to characterise the wave conditions during the 1 July event and compared to the wave conditions for the full year 2022 to provide context (Figure 4). The 1 July event was the most energetic wave condition that occurred in 2022 (Figure 4a) and the offshore wave conditions (at 1,000 m depth) during the peak of the event were characterised by Hs,o = 3.30 m (Figure 4a), Tp = 20.5 s (Figure 4b) and wave direction = 200° (Figure 4c).
Time series of MFWAM-modelled deep-water (1,000 m depth) wave conditions for grid cell SW of Fioyaree during 2022: (a) Wave height Hs,o ; (b) peak wave period Tp ; and (c) wave direction. The 1 July event is indicated by a red circle.

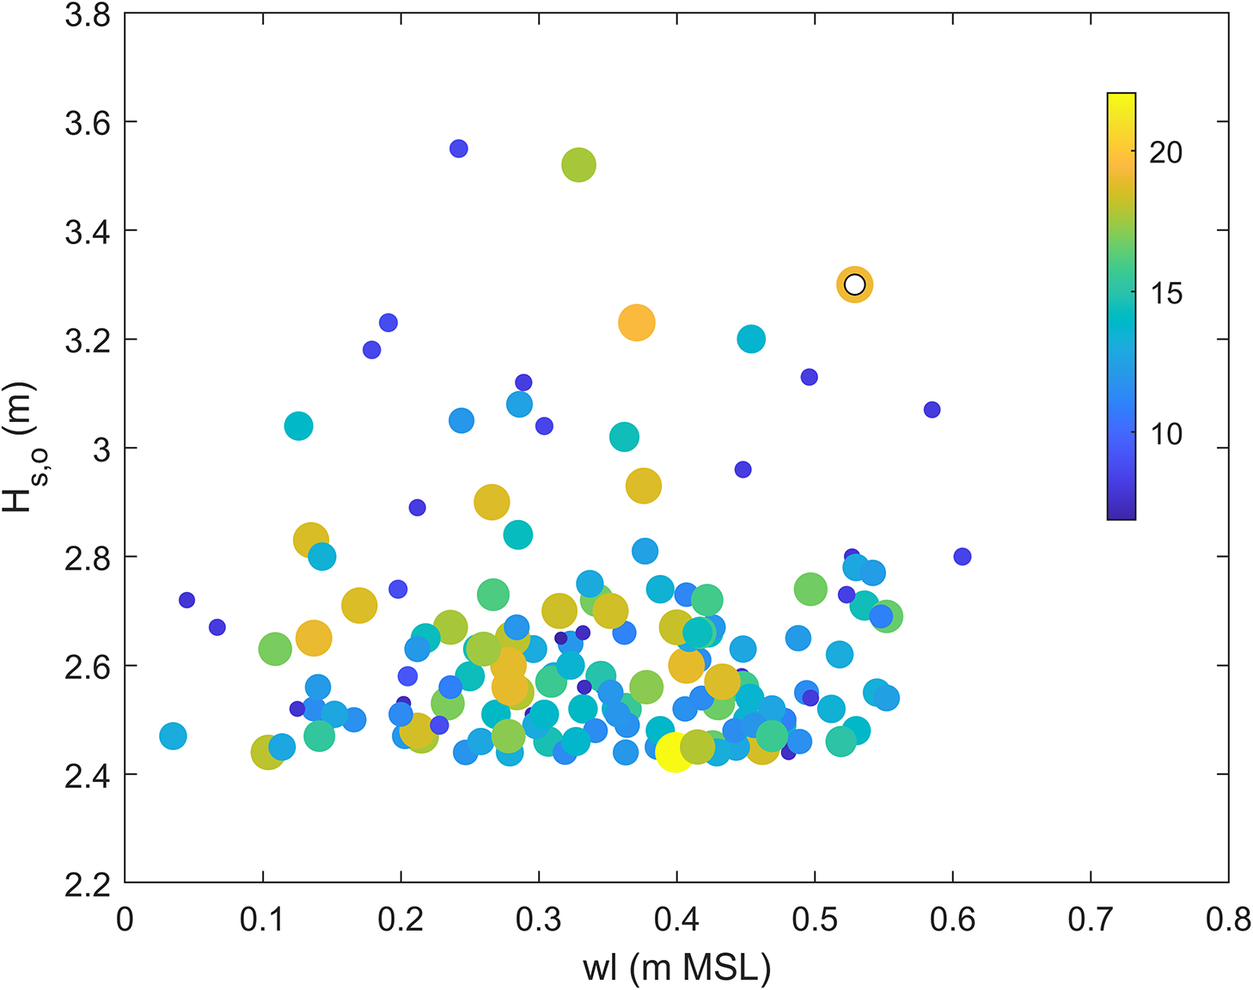
The full MFWAM wave record (1993–2022) was also used to place the 1 July event in a longer-term perspective. The 2-, 10- and 100-year significant wave height, computed using the GVE distribution, is 2.86, 3.27 and 3.58 m, respectively, and the peak wave height during the July event of Hs,o = 3.30 m thus has a 10-year return period. The 30-year wave record was also used to identify all major storm events that occurred over this period. Storms were identified as having a peak wave height larger than the 99% exceedance wave height, which was 2.44 m, and storms had to last at least 6 h and storm peaks had to be more than 8 h apart to count as separate events. A total of 158 storms were identified, and the date/time of each storm peak was used to extract the high tide level associated with the storm from the Gan tide record (maximum high tide (HT) level that occurred within <7 h from the time of the peak in Hs ). Each storm was, thus, uniquely identified by an MFWAM-modelled peak storm wave height Hs,o and peak wave period Tp , and measured high tide wl and plotted in a wl-Hs,o parameter space, with Tp represented by the size and the colour of the symbols (Figure 5). This analysis indicates that the 1 July event was the third-most energetic event in terms of peak wave height and the second largest event in terms of peak wave power. The two events with the largest peak wave height over the 30-year period occurred on 5 November 2016 and 18 May 2020, with maximum Hs,o of 3.55 and 3.52 m, but lower high tide levels of 0.24 and 0.33 m MSL, respectively, compared to 0.53 m MSL for the 1 July event. These two more energetic events in terms of peak wave height had much shorter peak wave periods: Tp < 10 s, compared to Tp = 20.5 s during the 1 July event.
Scatter plot of offshore peak wave height Hs,o versus associated high tide wl for 158 storm events identified from the offshore wave record for the period 1990–2023. The wave height was derived from the time series of MFWAM-modelled deep-water (1,000 m depth) wave conditions for grid cell SW of Fioyaree, and the water level was extracted from the Gan tide gauge record. The water level was normalised by setting the mean water level for 2022 to 0. The symbols are scaled and coloured based on the peak wave period Tp at the height of the storm. The 1 July event is indicated by the yellow-orange symbol with a small white circle inside.

Impact of 1 July event
The most significant flooding occurred during the afternoon high tide on 1 July. According to the National Disaster Management Authority of Maldives, 20 inhabited islands were affected across the southern atolls of Thaa, Huvadhoo and Addu Atoll (https://timesofaddu.com/2022/07/02/sea-swells-flood-over-20-maldives-islands-causing-major-damage/).
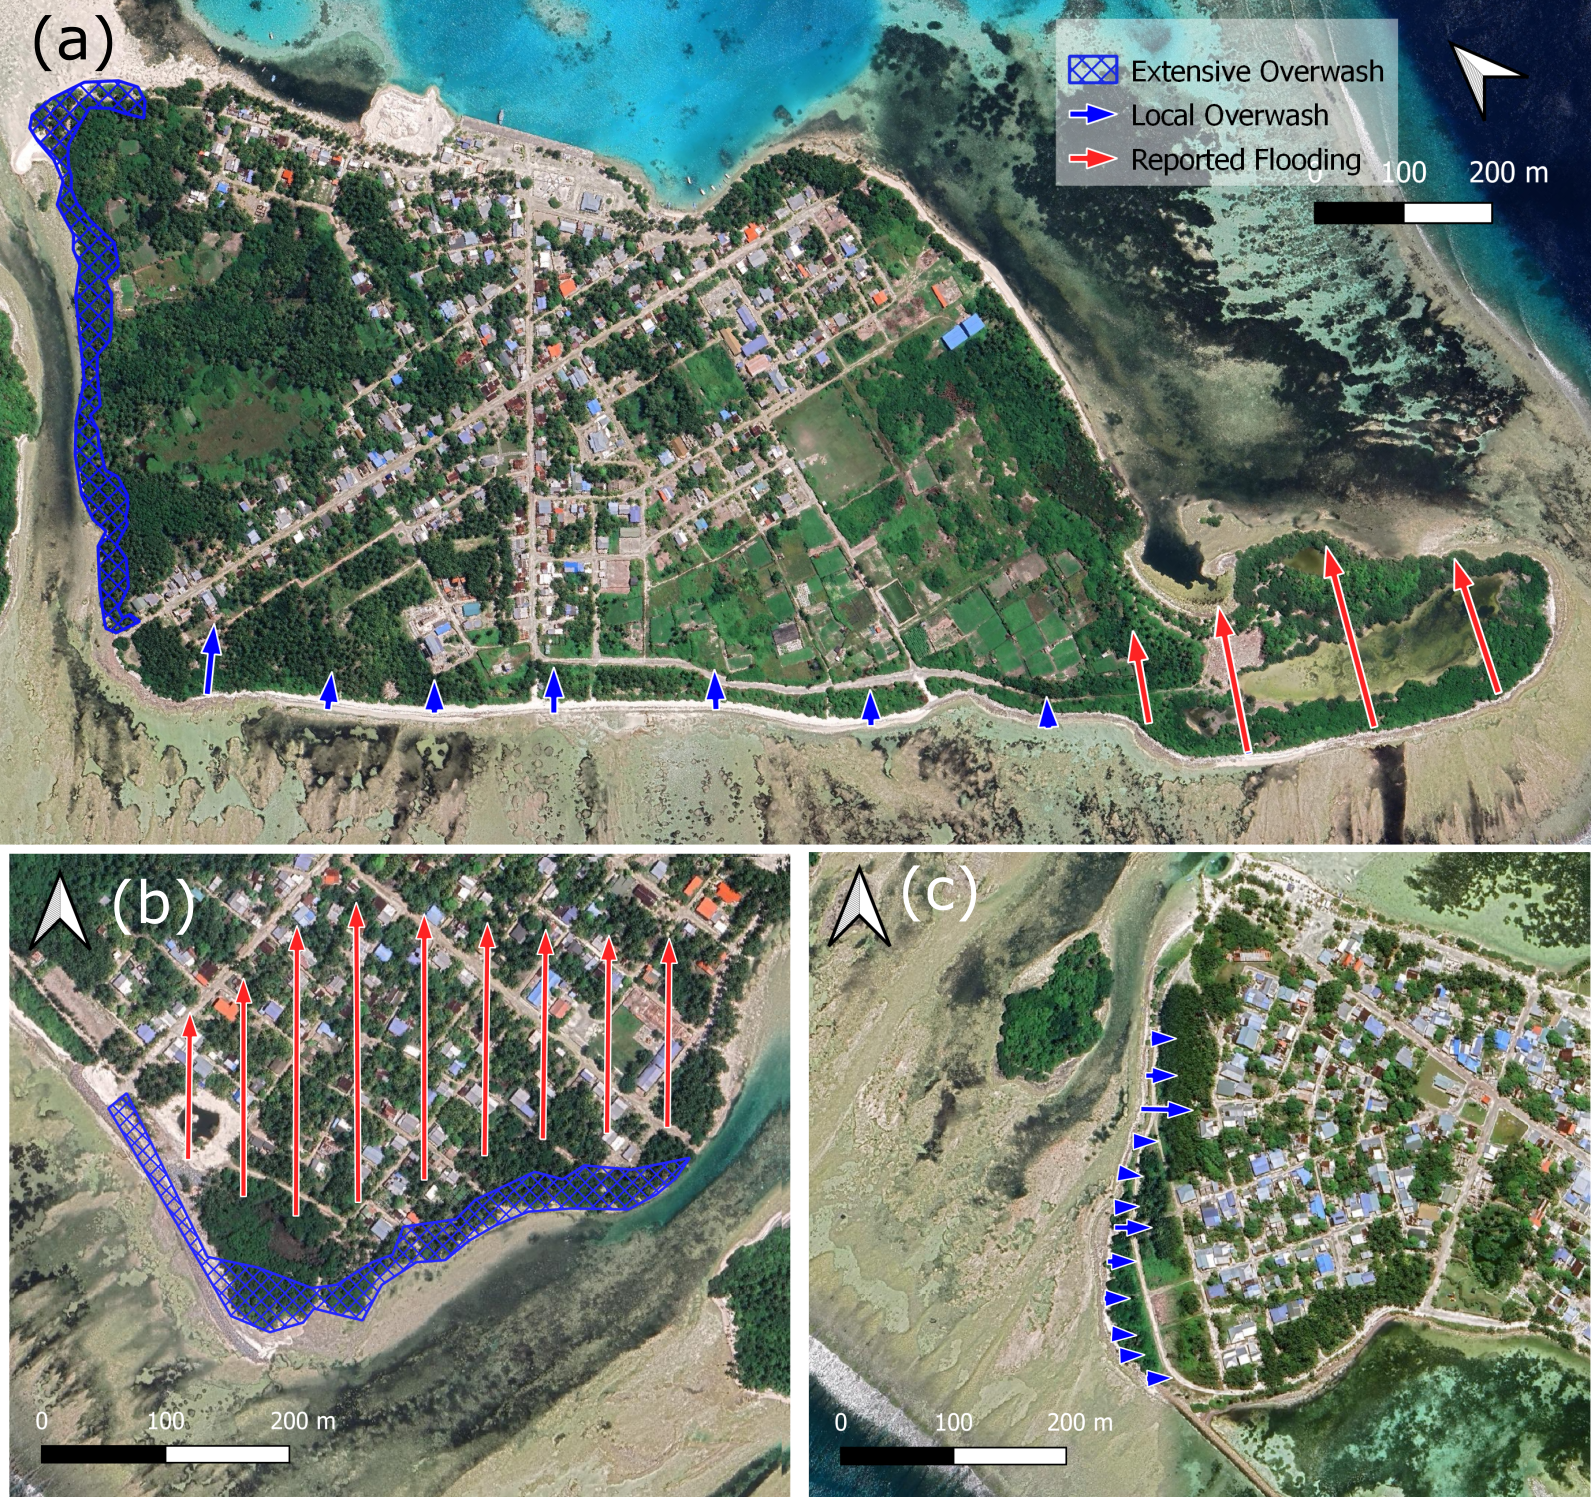
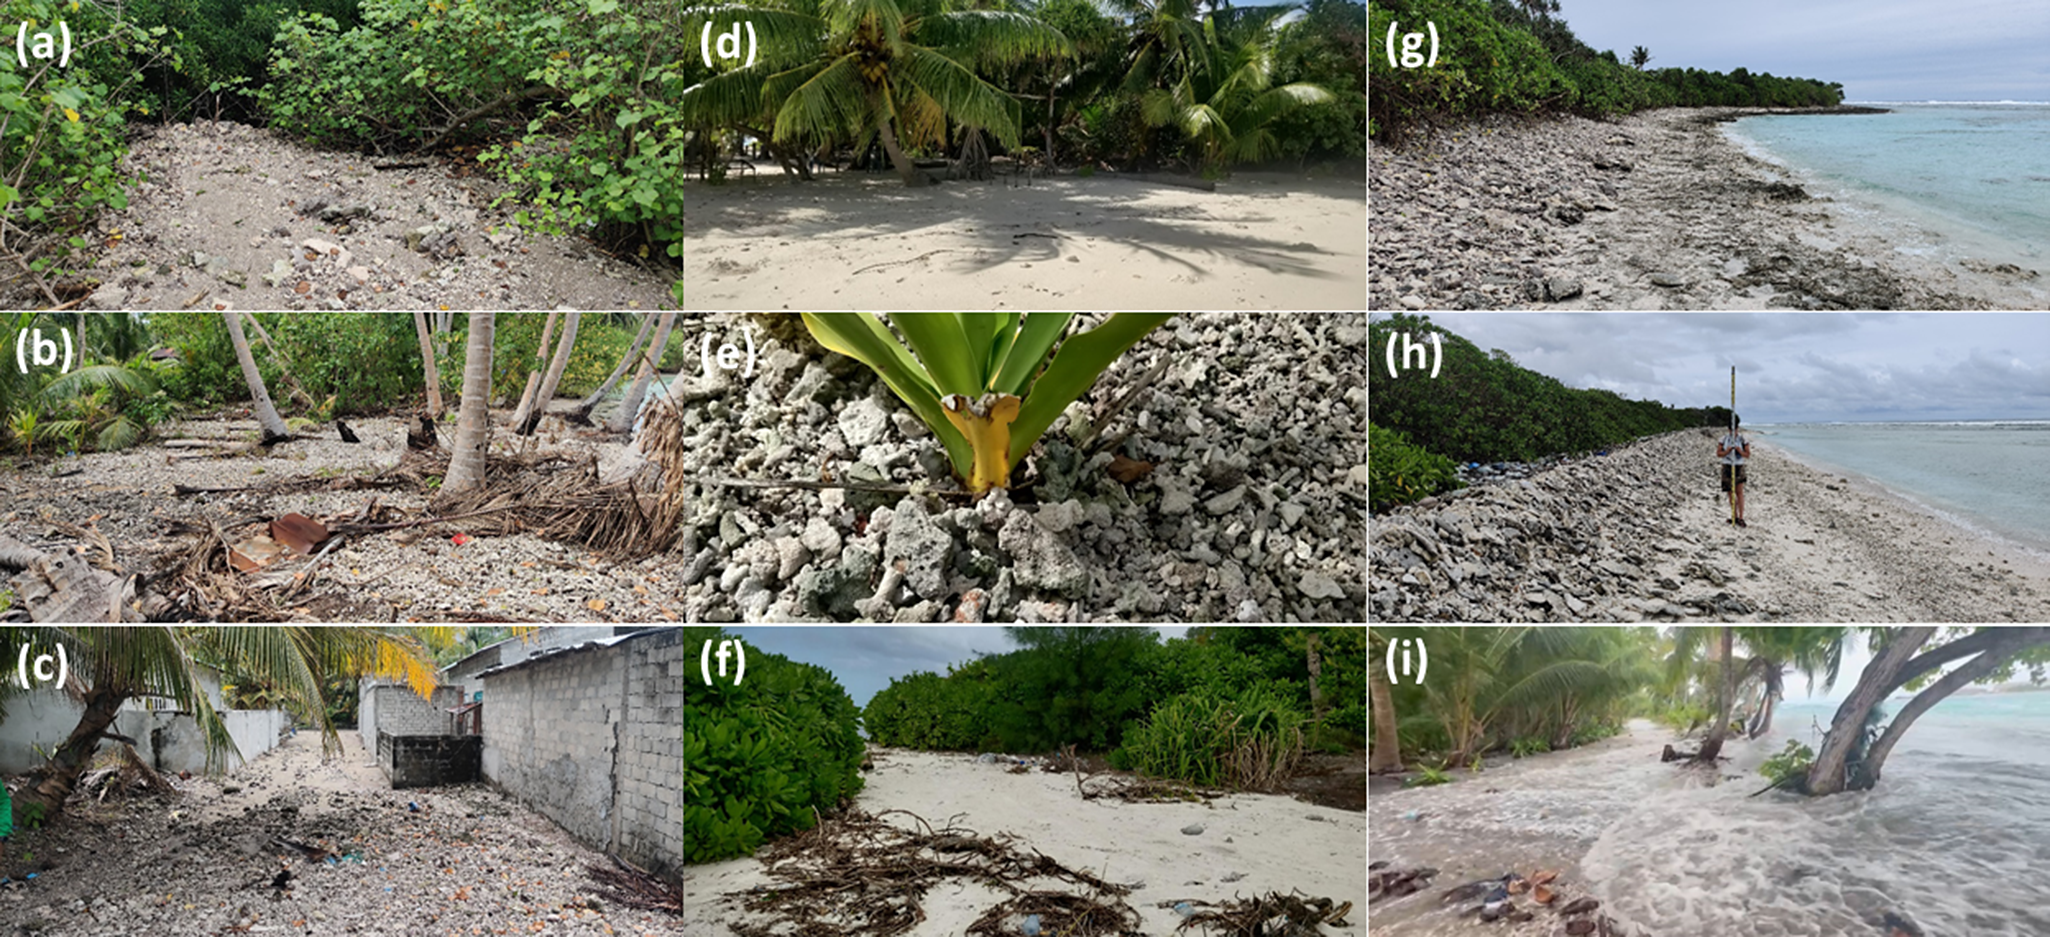
A field team carried out visual observations and mapped the flood extent through recording the position of wrack lines and overwash deposits on the inhabited islands of Rathafandhoo, Fiyoaree and Fares-Maathoda, located along the SW rim of Huvadhoo Atoll, a few days after the event (Figure 6). Additional information on flood extent was obtained from local residents. Visual observations were also made along the western side of the uninhabited island of Dighelaabadhoo, east of Fioyaree. Evidence of island flooding and overwash was ubiquitous, although some of the breaches in the protective gravel ridge, typically present along most of the island margin, had already been repaired. Of the islands surveyed, Rathafandhoo was the most affected with fresh overwash deposits of variable thickness (0.05–0.2 m) covering a 10–30-m-wide strip of the low-lying SE part of the island and encroaching on the mangroves (Figure 7a,b,c). On Rathafandhoo, about 25% of the land area was flooded (Figure 6a) and 90 properties were affected with maximum flood depths of c. 0.2 m. On Fiyoaree and Fares-Maathoda, only a handful of properties were affected by flooding, and here, overwashing was most extensive along the SW part of the islands, especially on Fiyoaree (Figure 6b,c).
Mapped extent of island flooding and overwash deposits recorded after 1 July flooding event: (a) Fioyaree; (b) SE margin of Rathafandhoo; and (c) SW margin of Fares-Maathoda. See Figure 1c for the location of the three atoll islands. Source: GoogleMap.

Photos taken within several days of the 1 July flooding event. Extensive, predominantly gravel, overwash deposits on Rathafandhoo into the (a) mangrove and (b) palm forest and (c) into the village via the roads. Mixture of (d) sandy and (e) gravel overwash sheets on Fiyoaree, and where a gravel ridge is present, (f) overwash tongues are found where there are gaps in the vegetation and/or the ridge. (g) Along the ocean side of most atoll islands in South Huvadhoo atoll, including on Fiyoaree, a conglomerate platform is present, and, on many locations, large pieces of coral rubble were mined from this platform and piled onto or over the gravel ridge. (h) Along the SW margin of Dighelaabadhoo, the existing gravel ridge was raised by 0.5 m and steepened to a 1:1 slope. (i) Footage taken during the flooding event on Fares-Maathoda shows overwashing waves with depths of 0.2–0.5 m, leading to flooding along the SW margin of the island. Source: Authors.

Flooding pathways were generally breaches or depressions (due to public access) in the natural and anthropogenically enhanced gravel ridge (Figure 7f), and then by means of roads and tracks conveying flood water to the low-lying island interior. The extent of the washover deposits, whether sand or coral rubble (Figure 7d,e), appeared to be very much related to the density of the vegetation, with a densely vegetated island margin limiting the landward extent of the washover deposits to <5–10 m. Along the more coarsely grained, open-coast sections of the islands, some of the coral rubble ridges experienced construction (Figure 7h), as demonstrated by the presence of coral rubble that was freshly sourced from the conglomerate platform present along part of the ocean margin of the SW Huvadhoo islands (Figure 7g). Comparison of a profile measured across the gravel part of Dighelaabadhoo, between May 2022 (provided by Paul Kench, pers. comm.) and July 2022, showed that the ridge had accreted by up to 0.5 m. Video footage during the flood event on Fares-Maathoda (Figure 7i) shows that overwashing waves had maximum depths of at least 0.2 m.
Methods
Field campaigns
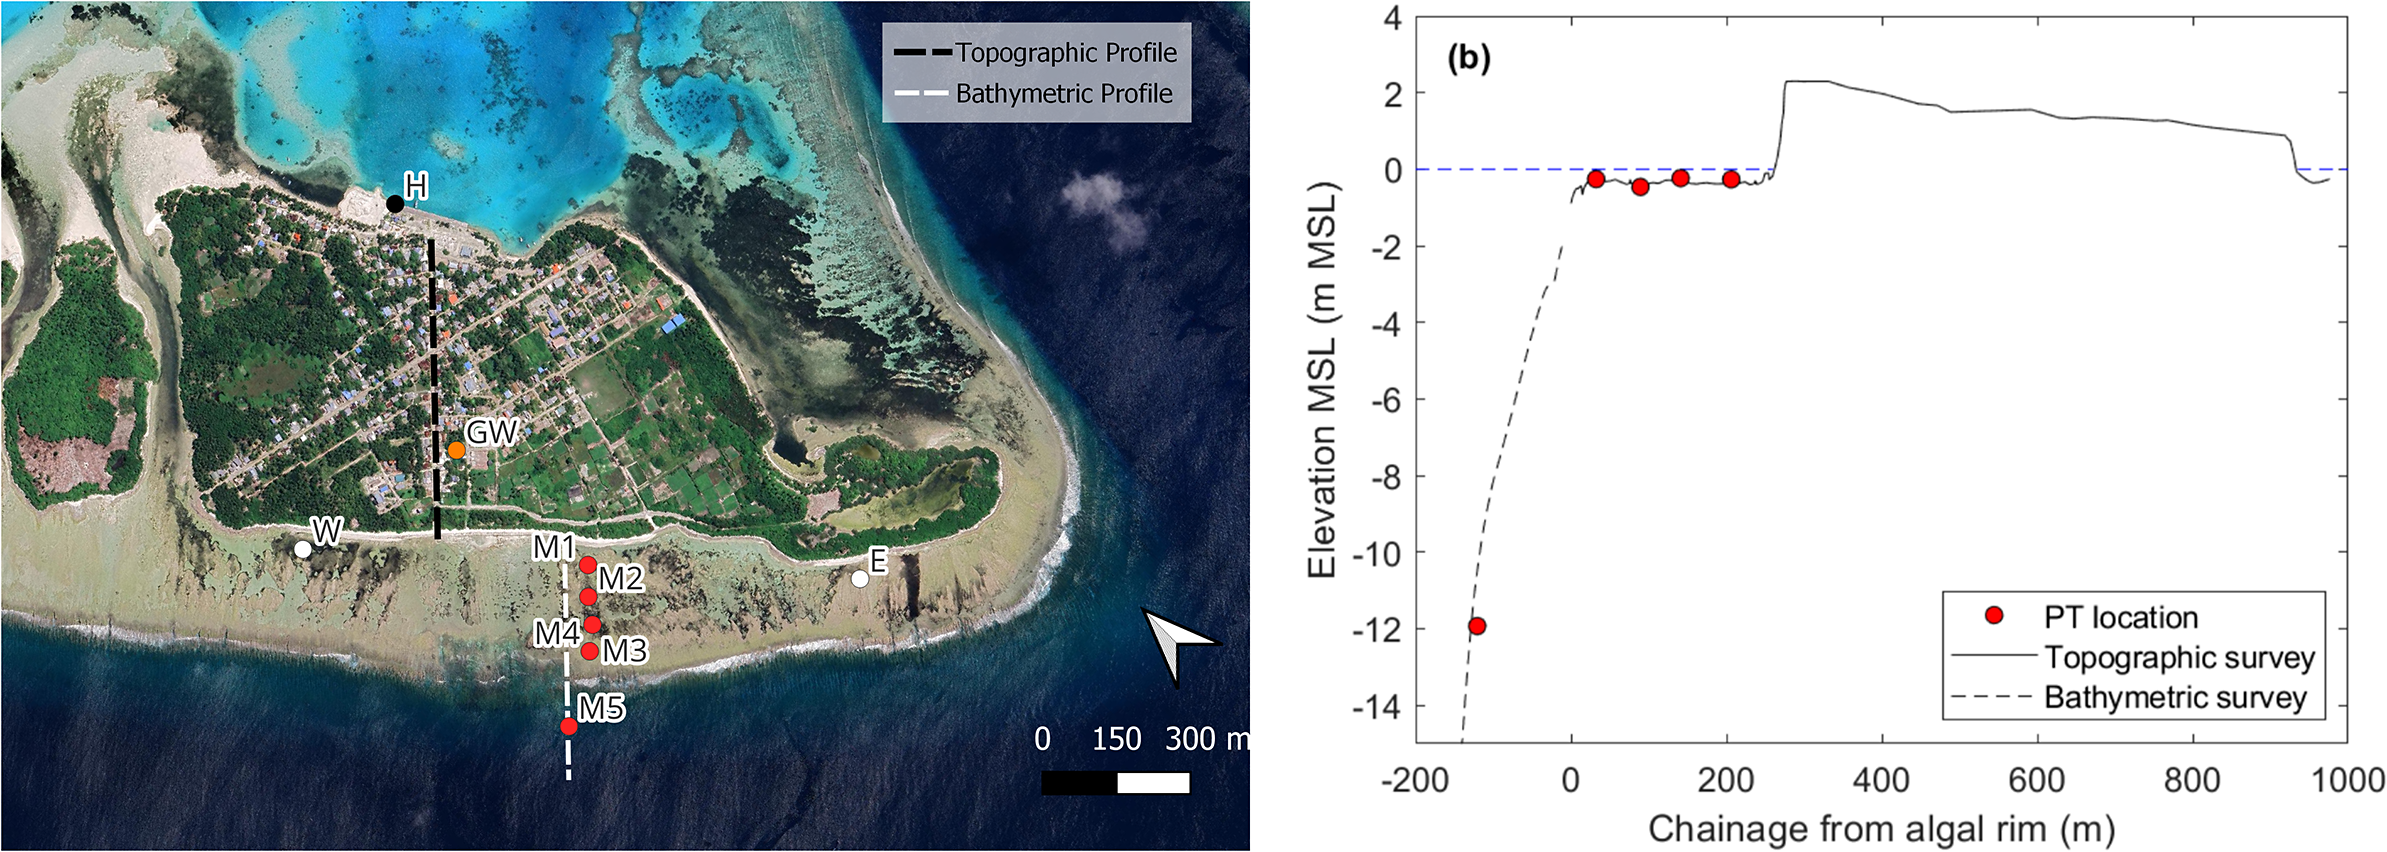
Two field campaigns were held on Fiyoaree in 2022: a 2-week campaign in January, followed by a 1-week campaign in July that took place only a few days after the 1 July island flooding event. During the first campaign, topographic, bathymetric and ecological surveys were conducted and several sediment samples were collected from the ocean and lagoon beach and from sediment cores. Island and reef platform topography was obtained using a combination of Real-Time Kinematic Global Navigation Satellite System (RTK-GNSS), automatic level, Uncrewed Aerial Vehicle and boat-based single-beam echosounder. All survey data were related to MSL using several months of sea level recorded in the Fares-Maathoda harbour in 2022 using a tide gauge (vented pressure sensor). During the second field campaign, 10 pressure sensors (PTs) were deployed (Figure 8) over 2 months during the generally more energetic July–August period, and data were collected continuously at 2 Hz. The extent of overwash deposits and island flooding resulting from the 1 July event was mapped.
(a) Satellite image of Fioyaree with location of all instruments during the July 2022 field campaign; and (b) assembled cross-island-platform profile derived from combined topographic (RTK-GNSS and electronic level) and bathymetric survey (single-beam echosounder) with the locations of the wave sensors on the central transect. Source of (a): GoogleMap.

Instrument positions and elevations of the PTs on the reef platform and in the harbour were recorded using RTK-GNNS (with error dz = 0.03 m) and related to MSL using the tide gauge data. Determining the offshore water level from a submerged PT is challenging as the elevation of the sensor cannot readily be measured. Here, the elevation of the submerged PT z was obtained by computing the mean water depth over the field campaign <h > and relating this to the mean water level in the lagoon <η> (recorded by the harbour PT): z = <η> − <h>. This approach is justified because the ocean and lagoon tidal signal at the field site are very similar (Supplementary Figure S1a). High tide in the lagoon and the ocean are concurrent, and the water level difference between the lagoon and ocean never exceeds 0.1 m, with a root mean square error (RMSE) of 0.03 m (Supplementary Figure S1b). Scatter plots between the ocean and lagoon water levels further reveal that there is no systematic tidal dependency in the difference between the respective water levels (Supplementary Figure S1c,d). Any small differences between the lagoon and ocean water levels can easily be explained in terms of wind setup (especially in the lagoon).
Hydrodynamic data analysis focused on 1-h time series to represent a compromise between tidal non-stationarity and the need to have sufficiently long time series to study infragravity (IG; f = 0.005–0.05 Hz) and very low frequency (VLF; f = 0.001–0.005 Hz) wave energy. Sea-swell wave energy (SS) is defined by wave motion at frequencies <0.05 Hz. All wave heights are significant wave heights and were computed as four times the square root of the spectral variance summed across the relevant frequency bands. During low tide conditions, water depths across the reef platform were generally <0.25 m, and ponding occurred due to the raised algal rim present along most of the seaward margin of the reef platform. Therefore, the hydrodynamic analysis presented here focused on mid- to high tide conditions, referred to as ‘HT half cycles’, for which the offshore water level is >0 m MSL. The offshore wave data, collected in 12 m water depth, was corrected for depth attenuation and deshoaled to 25 m using linear theory, and is denoted by Hs,25m.
Numerical modelling
The phase-resolving version of XBeach (XB-NH) was used for the numerical modelling because, compared to the phase-averaged (XB-SB) model, this version performs better for run-up on steep beaches (McCall et al., Reference McCall, Poate, Masselink, Roelvink, Almeida, Davidson and Russell2014; De Beer et al., Reference De Beer, McCall, Long, Tissier and Reniers2021) and in coral reef environments (Quataert et al., Reference Quataert, Storlazzi, van Dongeren and McCall2020), and also has fewer tuning parameters because the physics are better represented. The model was run in one-dimension (1D) because of computational efficiency and the lack of a complete digital elevation model of the island. A central profile line was extracted from the survey data and included the transect with five PTs (Figure 8). Numerical modelling was only conducted using this central transect.
A large number of model calibration runs were conducted using a subset of data comprising all 1-h time series for the period 10–16 July 2022 (‘calibration data set’) for which the ocean water level was >0 m MSL (N = 86). All model runs were forced with the measured water level and a JONSWAP wave spectrum characterised by Hs,25m and Tp from the offshore PT and the offshore model boundary was at 25 m depth. The sole calibration parameter was the bed roughness, quantified by the Colebrook-White roughness cf in XB-NH, and this parameter was considered spatially variable, with the largest roughness attributed to the forereef with spur-and-groove topography. In the model, the subtidal region and the reef platform were considered impermeable, whereas the island was considered permeable with a hydraulic conductivity of K = 0.005 ms−1. Model performance was evaluated using the RMSE, bias and correlation coefficient (r). The variables for which the model was calibrated were extracted from the PT closest to the island (M1) and included wave setup η and the total, SS, IG and VLF wave height (Hs , Hs,SS , Hs,IG and Hs,VLF , respectively).
The objective of this research is to investigate the 1 July 2022 flooding event, and, ideally, wave run-up should be used for model calibration as wave run-up elevation in relation to island elevation controls overwash and flooding. It is important on the outside to distinguish between the run-up height (vertical distance of run-up above still water level [SWL]) and the run-up elevation (vertical distance of run-up above the MSL datum). Run-up observations were, however, not available, and the total water height (TWH), defined here as (η + Hs,SS + Hs,IG + Hs,VLF ), was used for calibration as a surrogate for run-up height. It is noted that this simple linear addition of wave terms is not physically correct, but it was found that the maximum run-up height was very well predicted by the modelled TWH at the toe of the island beach. After model calibration, the model was validated using a different subset of the hydrodynamic data for the period 18–31 July 2022 (‘validation data set’), also for which the ocean water level was >0 m MSL (N = 164).
The validated/calibrated XBeach model was used to simulate the 1 July flooding event, forced by the Gan water level data and the MFWAM wave data (with a wave height correction to account for nearshore wave transformation). The modelled run-up elevation during the event was compared to the elevation of the island and to visual observations of island flooding.
The calibrated and validated XBeach-NH model was also used to develop a run-up predictor for Fioyaree based on offshore wave conditions and water level. A large number (N = 231) of simulations were conducted using a combination of offshore wave height (Hs,o = 2–4 m) and water level (wl = 0–1 m MSL). Initially, a peak wave period of Tp = 20 s was assumed in these simulations, as such a period is commonly associated with island flooding in the Maldives (Wadey et al., Reference Wadey, Brown, Nicholls and Haigh2017). For model forcing, the offshore wave height was corrected to account for nearshore wave transformation, and the model was forced with Hs,25m. The measured profile used in the previous simulations was modified to create a beach face that extends to 3 m MSL to focus only on run-up and not overwash. A hydraulic conductivity value of K = 0.005 ms−1 and the calibrated spatial variability in the bed roughness (cf = 0.15 in the spur-and-groove region and cf = 0.01 elsewhere) were used. The 2% exceedance run-up R 2% elevation, rather than the maximum run-up Rmax elevation, was extracted from the modelled data set and visualised within the wl-Hs,o parameter space as a nomogram. The effect of changing sea level on these results was then evaluated.
The role of Tp on run-up, and thus potential for overwash and island flooding, was also investigated. Using a constant water level of 0.53 m MSL and a constant offshore wave height of 3 m (as during the high tide peak of the 1 July event), XBeach was forced with Tp ranging from 5 to 25 s and R 2% was investigated. Model parameters were the same as for the runs used for constructing the nomogram. Finally, the importance of Tp was also addressed by computing R 2% for all the storm events that occurred over the 1990–2023 period. XBeach was forced by the maximum wl, Hs,o and Tp that occurred during each event. Because the wl value for the identified storms reflects the long-term change in sea level at Gan (cf., Figure 3), wl associated with each storm was recalculated from the detrended Gan sea-level record and was normalised by setting the mean sea level for 2022 to 0.
Results field campaign
Morphology and sedimentology
A single representative cross-island and cross-reef profile was extracted from the survey data (Figure 8b). This profile represents a blending of the profile across the island via the main road (using automatic level), the transect across the reef platform with the main instrument array (using GNSS) and a subtidal profile (using echo-sounder). The transect was also used in the XBeach modelling. At the location of the transect, the island is 650 m wide, and the crest elevation at the lagoon and ocean side is 0.9 m MSL and 2.3 m MSL, respectively. The reef platform is 220-m wide and has an average elevation of −0.4 m MSL. At its ocean side, there is an algal rim with an elevation of −0.15 m MSL. The algal rim slopes gently down from its highest elevation over a distance of c. 30 m, and then the forereef steeply slopes down with a gradient of 0.08.
The beach at the ocean-side of the island is composed of predominantly medium-to-coarse sand with a D 50 at the West, Main and East transect of 0.56, 0.33 and 0.67 mm, respectively, and has a steep gradient of 0.1–0.15. The back of the beach is generally characterised by a coral rubble ridge with varying clast sizes (1–10 cm). The surface sediments of the island are highly variable, and size analysis of shallow (0.3 m) sediment cores taken from across the island shows a D 50 value ranging from 0.15 to 13.1 mm and half of the core samples are characterised by a bimodal sediment distribution containing sand and gravel. The beach at the lagoon-side of the island tends to consist of finer sediments than the ocean-side beach, and analysis of a single sample yielded a D 50 of 0.31 mm.
Hydrodynamics
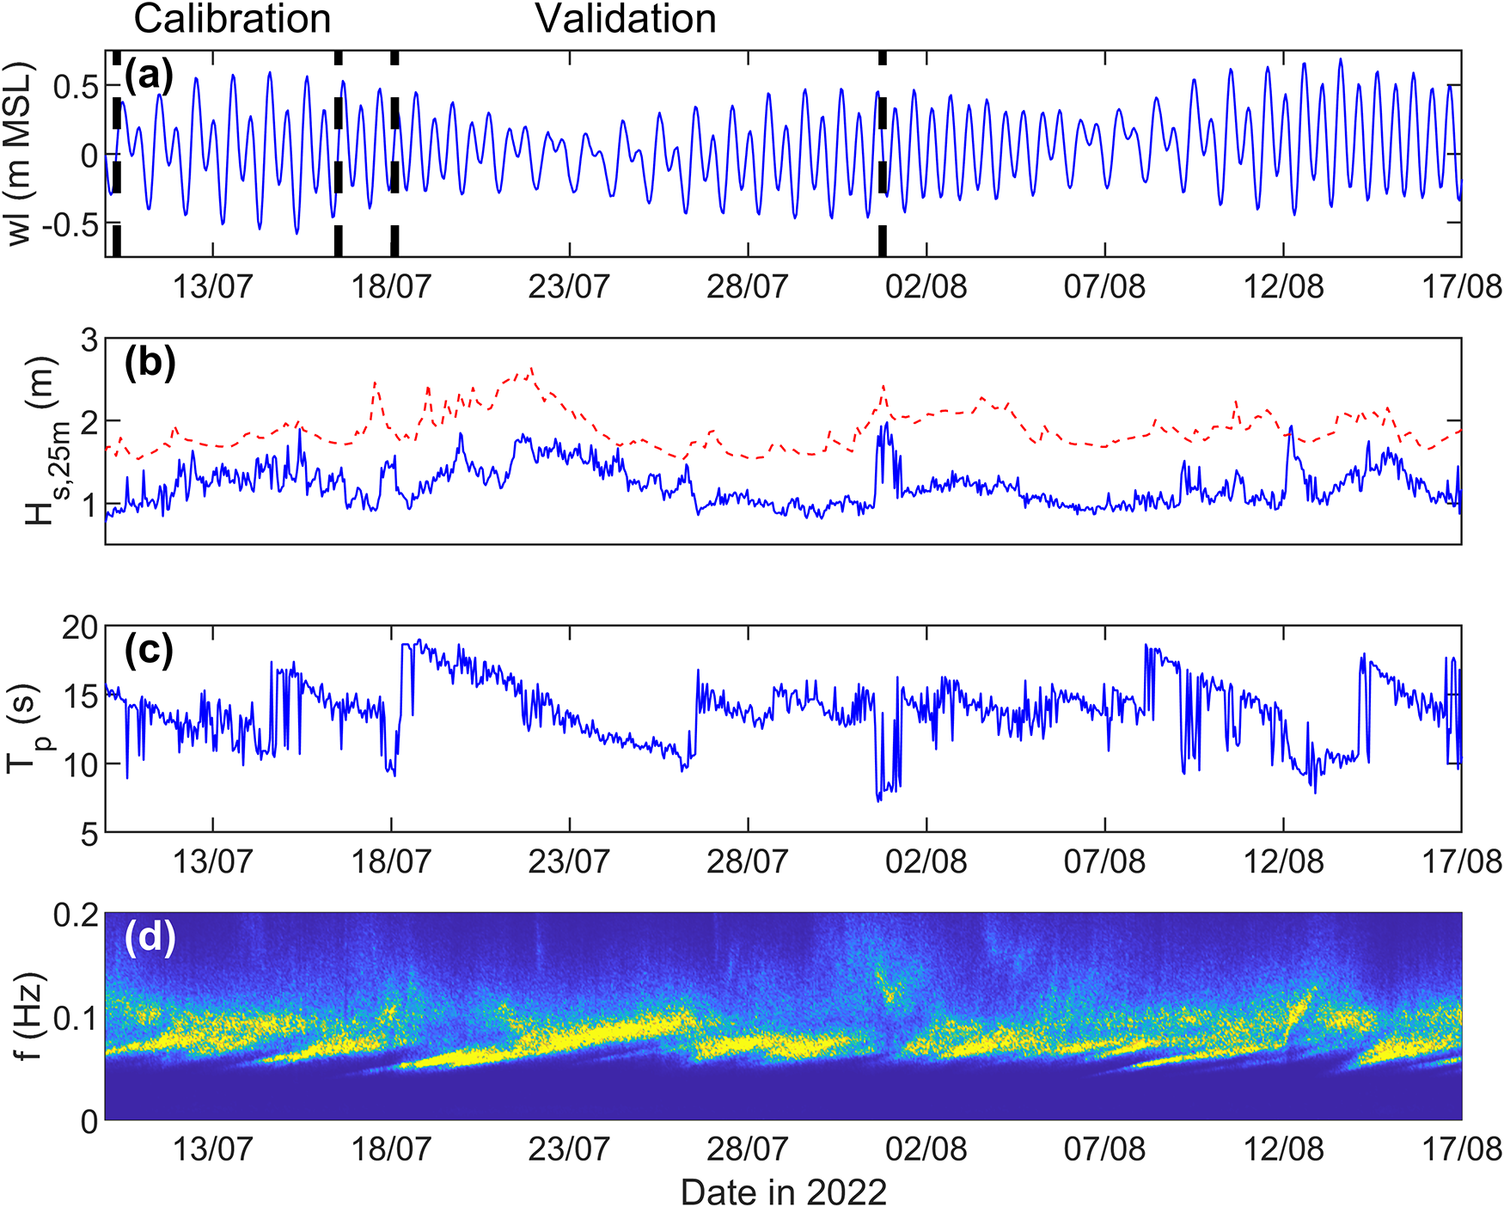
The July–August 2022 field deployment covered almost three complete neap-to-spring tidal cycles (Figure 9a) and wave heights Hs,25m in excess of 1.5 m with peak wave periods Tp of 15–18 s were experienced (Figure 9b,c). Normalised wave spectra suggest that these energetic episodes were remote swell events (as opposed to wind-wave events), as the peak wave period decreased (as opposed to increased) during the events (Figure 9d), reflecting wave dispersion (as opposed to wave generation). Comparison between the measured wave data (deshoaled to 25 m depth) collected over a 6-week period (9 July–17 August 2022) and the overlapping MFWAM-modelled wave data (shoaled to 25 m depth) indicates that the measured Hs,25m is 63% of the modelled Hs,25m. The peak wave period is poorly predicted by MFWAM (r = 0.31, but no obvious bias; not shown); therefore, the modelled Tp without any correction is used for the 1 July flood event simulation.
Summary of the hydrodynamic conditions during the July 2022 field campaign. Time series of: (a) detrended water level wl, (b) measured (blue line) and MFWAM-modelled (red dashed line) wave height in 25 m water depth Hs,25m (c) measured peak wave period Tp , and (d) measured normalised wave spectra (spectral energy increases from dark blue to yellow). Measured wave conditions are based on data collected by a pressure sensor deployed in c. 12 m water depth, with the wave height deshoaled to 25 m using linear theory. The modelled wave height represents the MFWAM-modelled offshore wave height shoaled to 25 m using linear theory.

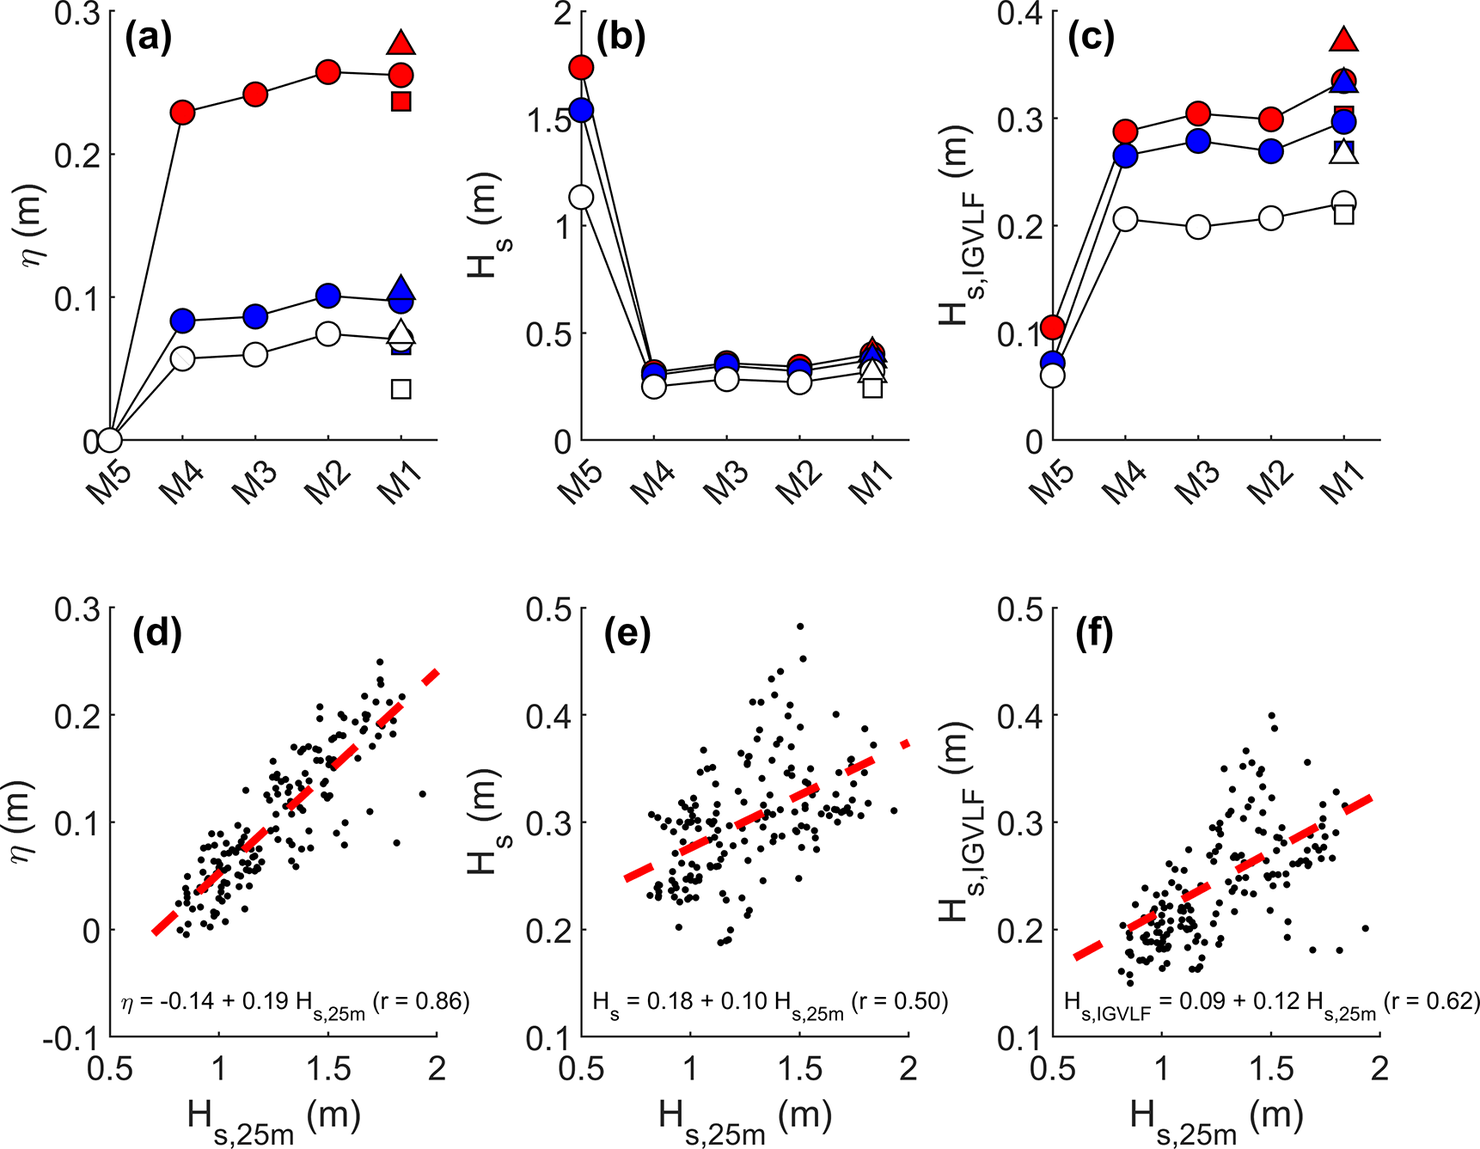
The energetic period 18–31 July 2022 was selected for investigating the cross-reef variation in hydrodynamics, specifically the mean water level (wave setup) and wave conditions. Only HT half cycles were considered. The across-reef variation in wave set-up η, total wave height Hs and combined IG and VLF wave height Hs,IGVLF is illustrated in Figure 10a–c for three examples 1-h data segments. None of the time-averaged hydrodynamic parameters show much variability across the reef platform (cf. Supplementary Table S1), but η and Hs,IGVLF do show a strong dependence on the offshore wave conditions, with the largest and smallest values associated with the largest and smallest Hs,25m , respectively. This is further explored in Figure 10d–f, which represents scatter plots of Hs,25m versus the hydrodynamic parameters averaged across the reef platform with their best-fit lines. A strong linear dependence of η and Hs,IGVLF on Hs,25m is apparent with r-values of 0.86 and 0.62, respectively. As Hs,SS across the reef is not significantly related to Hs,25m , and is mainly related to the water depth across the reef platform (not shown), the significant correlation between Hs,25m and Hs across the reef platform (r = 0.50) is mainly attributed to the relation between Hs,25m and Hs,IGVLF. Figure 10d,f suggest that η and Hs,IGVLF across the reef platform are roughly 10–20% of Hs,25m , which is in line with observations on other coral reefs (e.g., Vetter et al., Reference Vetter, Becker, Merrifield, Pequignet, Aucan, Boc and Pollock2010; Pomeroy et al., Reference Pomeroy, Lowe, Symonds, Van Dongeren and Moore2012).
Example of across-reef variation, from M5 (offshore) to M1 (toe of island beach), in (a) wave set-up η, (b) wave height Hs and (c) IG and VLF wave height Hs,IGVLF for a 1-h data segment with wave height Hs,25m of 1.74, 1.54 and 1.13 m (red, blue and white symbols, respectively). The wave statistics for E (triangles) and W (squares) are also plotted. Scatter plot and best-fit lines of across-reef averaged (d) η, (e) Hs and (f) Hs,IGVLF taking into account all 1-h pressure sensor data segments collected on the reef (M1–M4, E and W) for the period 18–31 July 2022, and only considering the top part of the tidal cycles (offshore water level wl > 0 m).

The same subset of data collected over the energetic period 18–31 July 2022 was subjected to further time- and frequency-domain analysis to investigate the mechanism for generating the combined IG and VLF motion across the reef platform. Wave spectra computed for data collected at the base of the beach show a prominent SS and IG wave peak at 13–14 and 25–30 s, respectively, with a clear spectral value at a frequency of 0.05 Hz (Supplementary Figure S2). Most wave energy is contained within the IG domain (20–200 s), but significant amounts of wave energy are also present within the VLF domain (>200 s). The spectrum associated with HT half cycles also displays a broad peak at 4–5 s, associated with secondary waves that typically develop over horizontal surfaces (Masselink, Reference Masselink1998).
Following List (Reference List1992), further analysis was conducted between the offshore wave groupiness and the low-frequency water motion across the reef platform. The raw offshore wave signal (uncorrected for depth attenuation) was used to obtain the wave groupiness signal GF by taking the modulus of the detrended time series and low-pass filtering using a simple Fourier filter with a cut-off frequency of 0.02 Hz. The wave signal across the reef platform was simply low-pass-filtered using the same 0.02 Hz cut-off. The different low-pass-filtered signals can be compared visually (Supplementary Figure S3a), but cross-correlation analysis was conducted to quantify maximum correlation coefficients and associated time lags (Supplementary Figure S3b,c). The overall picture that emerges from this analysis is that of a breakpoint-forced wave that is generated across the forereef in the breaking zone and then propagates onshore across the reef platform as a free wave at the shallow water wave speed (Pomeroy et al., Reference Pomeroy, Lowe, Symonds, Van Dongeren and Moore2012; Masselink et al., Reference Masselink, Tuck, McCall, Dongeren, Ford and Kench2019).
Results of numerical modelling
Modelling calibration
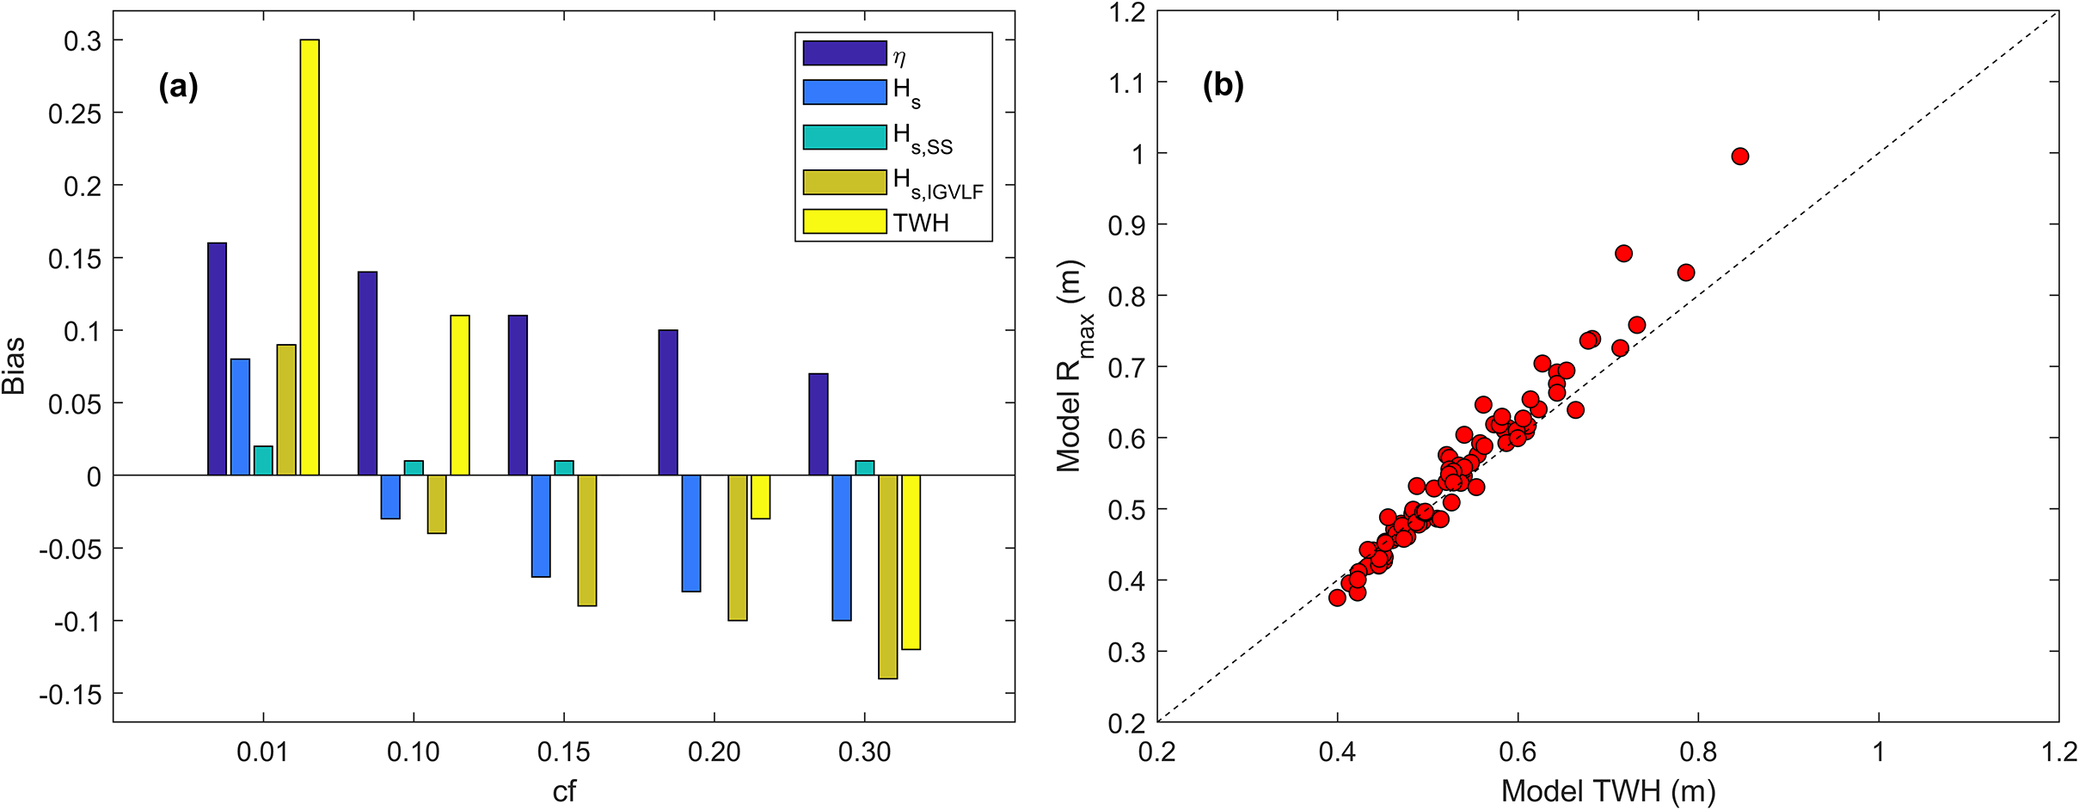
In the phase-resolving XBeach model, the bed roughness cf is the main calibration parameter, and calibration involved varying cf and investigating the mean RMSE, bias and r computed considering all 1-h time series collected over the period 10–16 July 2020 for which the ocean water level was >0 m MSL (N = 86). Of the three model performance indicators, the bias is considered the most relevant indicator because, due to the relatively large correlation values (r > 0.8), the RMSE is mainly determined by the bias. The model was relatively insensitive to the bed roughness in the subtidal region beyond 10 m water depth and across the platform and beach, but was extremely sensitive to the bed roughness across the spur-and-groove section (from −10 m MSL to the algal rim). The calibration results with enhanced roughness over the spur-and-groove section are illustrated in Figure 11a and tabulated in Supplementary Table S2. The bed roughness for the island, the reef platform and the deeper subtidal region was set to cf = 0.01 in these calibration runs.
A low bed roughness (cf = 0.01; relatively smooth surface) across the entire model domain results in a large over-prediction of wave setup and wave height across the reef platform (bias >0.15 m). A large roughness (cf = 0.3; highly rugose surface) across the spur-and-groove section only modestly reduces the over-prediction of setup (bias <0.1 m), but results in a large under-prediction in the IG and VLF wave height (bias < −0.15 m) (Figure 11a and Supplementary Table S2). It is impossible to accurately model both wave setup η and IG and VLF wave height simultaneously: if good agreement in η is reached, the wave heights are under-predicted, whereas if good agreement in wave height is reached, η is over-predicted. This overprediction of setup (or underestimation of IG and VLF waves at the expense of correct setup predictions) has previously been shown by Van Dongeren et al. (Reference Van Dongeren, Lowe, Pomeroy, Trang, Roelvink, Symonds and Ranasinghe2013) to be a limitation of 1D modelling in cases where shoreward mass flux at the reef crest is transported alongshore on the reef platform or lagoon, which is not accounted for in a 1D model. The only way in the 1D model to bring the modelled wave setup in line with the observations, whilst not overly reducing the Hs,IGVLF , is by reducing the gradient of the spur-and-groove section (not shown); however, this is clearly inappropriate as the subtidal gradient is a measured boundary condition and not a calibration parameter.
Our main interest is in correctly modelling wave run-up, because the elevation of the run-up compared to island elevation determines island freeboard (Matias et al., Reference Matias, Williams, Masselink and Ferreira2012), which in turn controls occurrence and magnitude of overwash. However, there are no field observations of run-up to compare the model results with. The run-up height in the model can be parameterised by the TWH at the toe of the island beach, defined as (η + Hs,SS + Hs,IG + Hs,VLF ) (Figure 11b). Therefore, the XBeach model was optimised by aiming for good agreement with the observed TWH, while accepting that this will overestimate η and underestimate Hs,IG and Hs,VLF. The closest agreement between modelled and measured TWH is achieved with a bed roughness of cf = 0.15 across the spur-and-groove region (Figure 11a and Supplementary Table S2), which is in line with earlier studies representing forereefs with high coral coverage (e.g., Storlazzi et al., Reference Storlazzi, Reguero, Cole, Lowe, Shope, Gibbs, Nickel, McCall, Van Dongeren and Beck2019; Roelvink et al., Reference Roelvink, Storlazzi, Van Dongeren and Pearson2021), and this setting was used in all subsequent simulations. The full calibration results for the calibrated model, with cf = 0.15 across the spur-and-groove region and cf = 0.01 elsewhere, is illustrated in Supplementary Figure S4. The data are presented in conventional scatter plots of measured versus predicted parameter values and indicates overestimation of η, underestimation of Hs,IG and Hs,VLF and good model performance for Hs,SS and TWH.
(a) Model bias averaged over the calibration data set for the different hydrodynamic components as a function of bd roughness cf. The hydrodynamic components are for the innermost PT (M1) and include: wave setup η, total wave height Hs , SS wave height Hs,SS , IG wave height Hs,IG , VLF wave height Hs,VLF and the total water height TWH (= η + Hs,SS + Hs,IG + Hs,VLF ). (b) Scatter plot of model TWH versus modelled maximum wave run-up height Rmax. The 1:1 dashed line (b) is not the best line of fit, but used to indicate similarity between Rmax and TWH.

Model validation
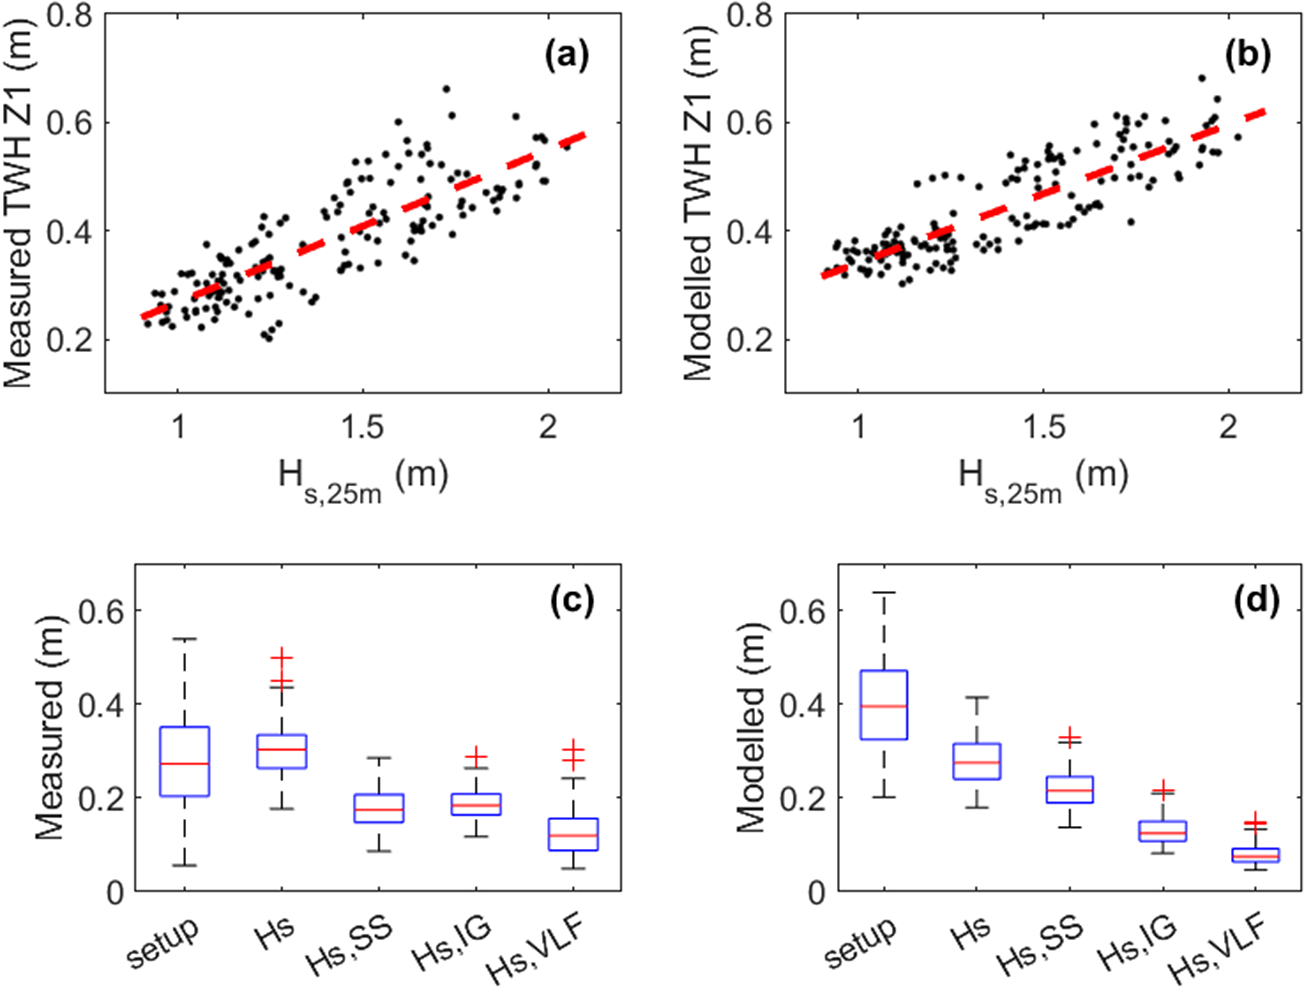
Model validation was conducted using 1-h time series for the period 18–31 July 2020, again for ocean water level wl > 0 m MSL (N = 164). The correlation between Hs,25m and TWH for the model results is almost identical to that for field measurements (Figure 12a,b), and the RMSE, bias and r associated with the comparison between measured and modelled TWH are 0.07 m, 0.06 m and 0.93, respectively (Supplementary Table S3). As TWH is considered the most relevant parameter for run-up and overwash, this is encouraging. However, model performance for the individual hydrodynamic parameters is less favourable, and η is over-predicted, while Hs and Hs,IGVLF are under-predicted (Supplementary Table S3). The measured and modelled data were partitioned into the different hydrodynamic components, and their statistical distributions were compared (Figure 12c,d). This comparison further highlights the shortcomings in the numerical model: η is over-predicted, while Hs,IG and Hs,VLF are under-predicted (Figure 12c,d). In general, the performance statistics for the validation are not as good as for the calibration. This is because the validation data set includes more energetic wave conditions (Supplementary Figure S9), and Hs,IG and Hs,VLF are especially under-predicted for more energetic wave conditions (Supplementary Figure S4f,g).
Results of XBeach model validation using data from the period 18/07 to 01/08. Scatter plot of (a) measured and (b) modelled total water height TWH (= η + Hs,SS + Hs,IG + Hs,VLF ) at M1 versus the wave height in 25 m water depth Hs,25m. Boxplots of the different contributors to the TWH for the (c) measured and (d) modelled data. The different contributors have been averaged across the reef platform (i.e., considering M1, M2, M3 and M4): wave setup, total wave height Hs , SS wave height Hs,SS , IG wave height Hs,IG and VLF wave height Hs,VLF. In the boxplots, the central mark indicates the median; the bottom and top edges of the box indicate the 25th and 75th percentiles, respectively; the whiskers extend to the most extreme data points not considered outliers; and the outliers are plotted individually using the ‘+’ marker symbol.

The model validation data were also used to investigate the mechanism of IG-VLF generation and was subjected to an identical cross-correlation analysis as the field data. The analysis confirms the presence of a group-bound long wave beyond the wave breakpoint, and that the combined IG-VLF motion across the reef platform originates as a breakpoint-forced wave that propagates onshore across the reef platform as a free wave (Supplementary Figure S4). The cross-correlation analysis shows very similar results for the measured and modelled data, although the amount of IG and VLF energy in the model data is significantly less than in the measured data and the cross-correlation coefficients are higher.
Modelling the 1 July event
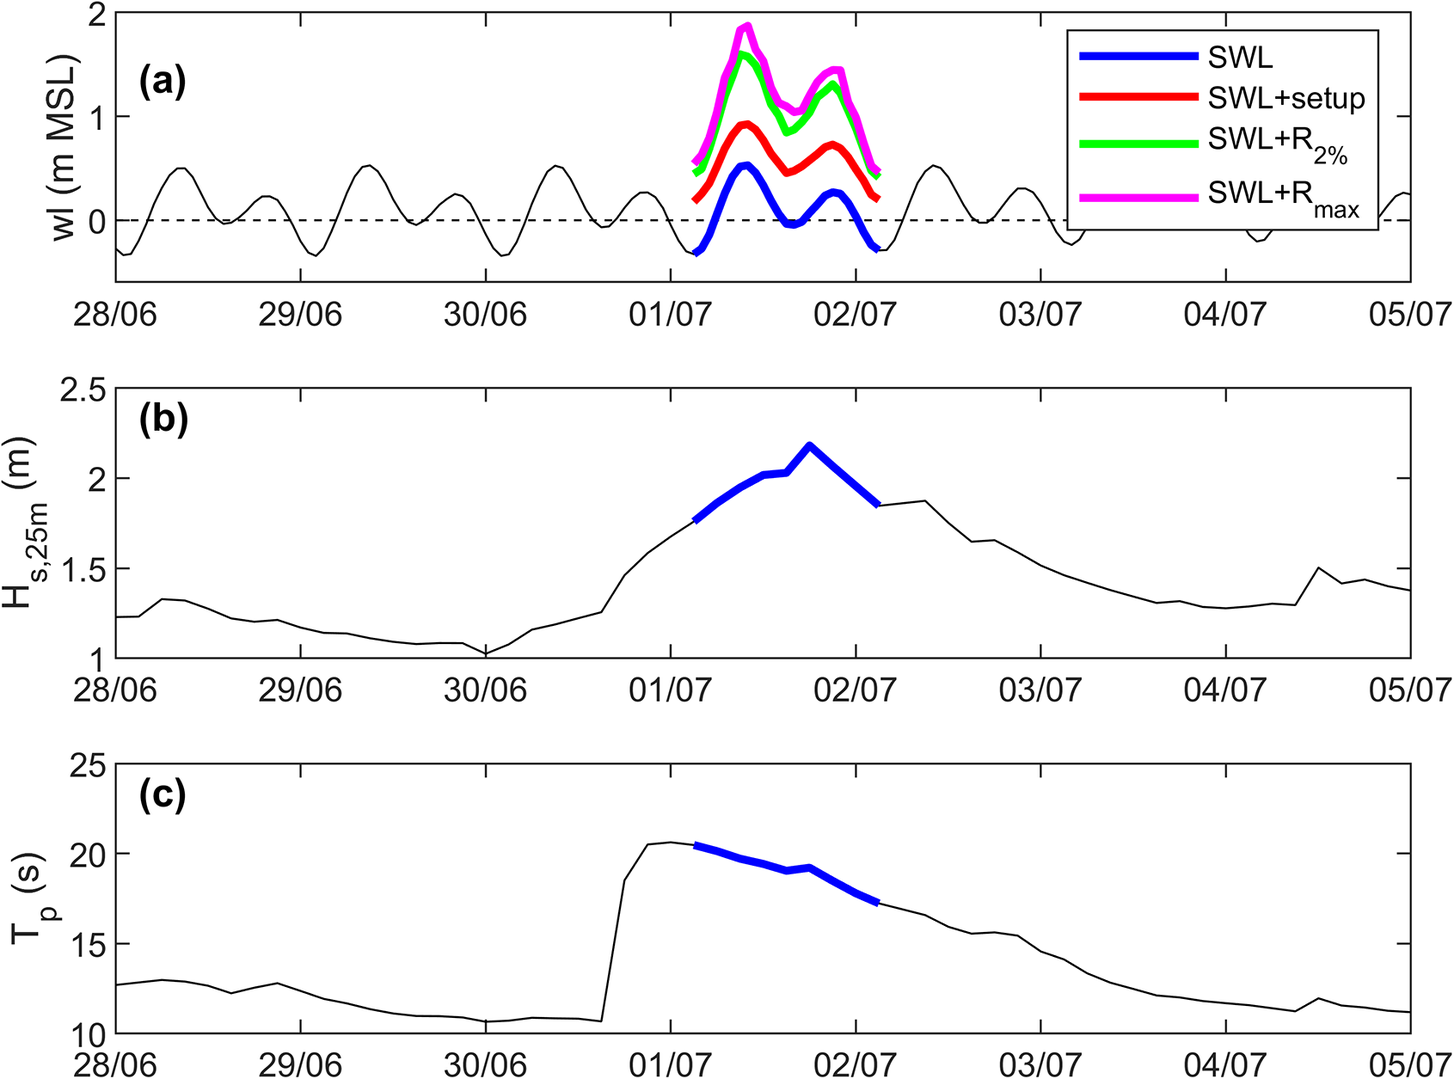
The calibrated and validated XBeach model was forced with the observed water-level time series from Gan and the MFWAM-modelled waves with the local correction based on measured wave data. Only the 25-h period that included two full tidal cycles with the peak of the wave event was modelled (Figure 13). Two maximum water levels over the modelled time period were extracted from the model data: one based on the maximum run-up elevation (Rmax = 1.87 m MSL) and one based on the 2% exceedance run-up elevation (R2% = 1.60 m MSL). The highest water level reached during the 1 July event is made up of a 0.53 m MSL still water level, and a maximum and 2% exceedance run-up height of 1.34 and 1.07 m, respectively. The component of the run-up that is due to wave setup η is 0.39 m.
Time series of: (a) water level wl; (b) wave height Hs,25m ; and (c) peak wave period Tp for the week, including the 1 July 2022 flooding event. The blue lines represent the model boundary conditions, and the red, green and magenta lines in panel (a) are the modelled water levels. Only the 25 hours indicated by the bold lines have been modelled. The water level data are the measured tide level from Gan and was normalised by setting the mean water level for 2022 to 0.

The modelled run-up for the 1 July event cannot readily be compared to the field data due to a lack of robust run-up data. Most of the flooding during the 1 July event occurred on the SE side of Rathafandhoo (for which there are no topographic data, nor wave data) and the SW side of Fioyaree (for which there are no wave data either). Topographic data indicate that the elevation of the island ridge along the SW side of Fiyoaree is typically 1–1.5 m MSL (MoEnv, 2020), whereas the elevation of the ocean ridge is generally 2–2.3 m. However, the ocean ridge has lower sections (e.g., beach access from the island), and there were also numerous breaches in the ridge after the 1 July flood event. Island flooding is likely to have occurred via these pathways, and this notion is supported by the numerous ‘tongue-shaped’ overwash deposits at the back of the gravel ridge. For values for Rmax and R 2% of 1.87 and 1.60 m MSL, respectively, at the peak of the flooding event, widespread flooding would be expected along the SW side of Fioyaree (Figure 7d) and localised flooding associated with topographic lows in the ridge on the ocean side (Figure 7f). However, during the post-event flood mapping, there was also plenty of evidence of minor overwash where the gravel ridge seemed relatively intact. In addition, observations on Dighelaabadhoo, located just east of Fioyaree, of washover deposits at the back of the 2 m high gravel ridge suggest that run-up did significantly overwash the ridge.
Application of the model to past, present and future island flooding
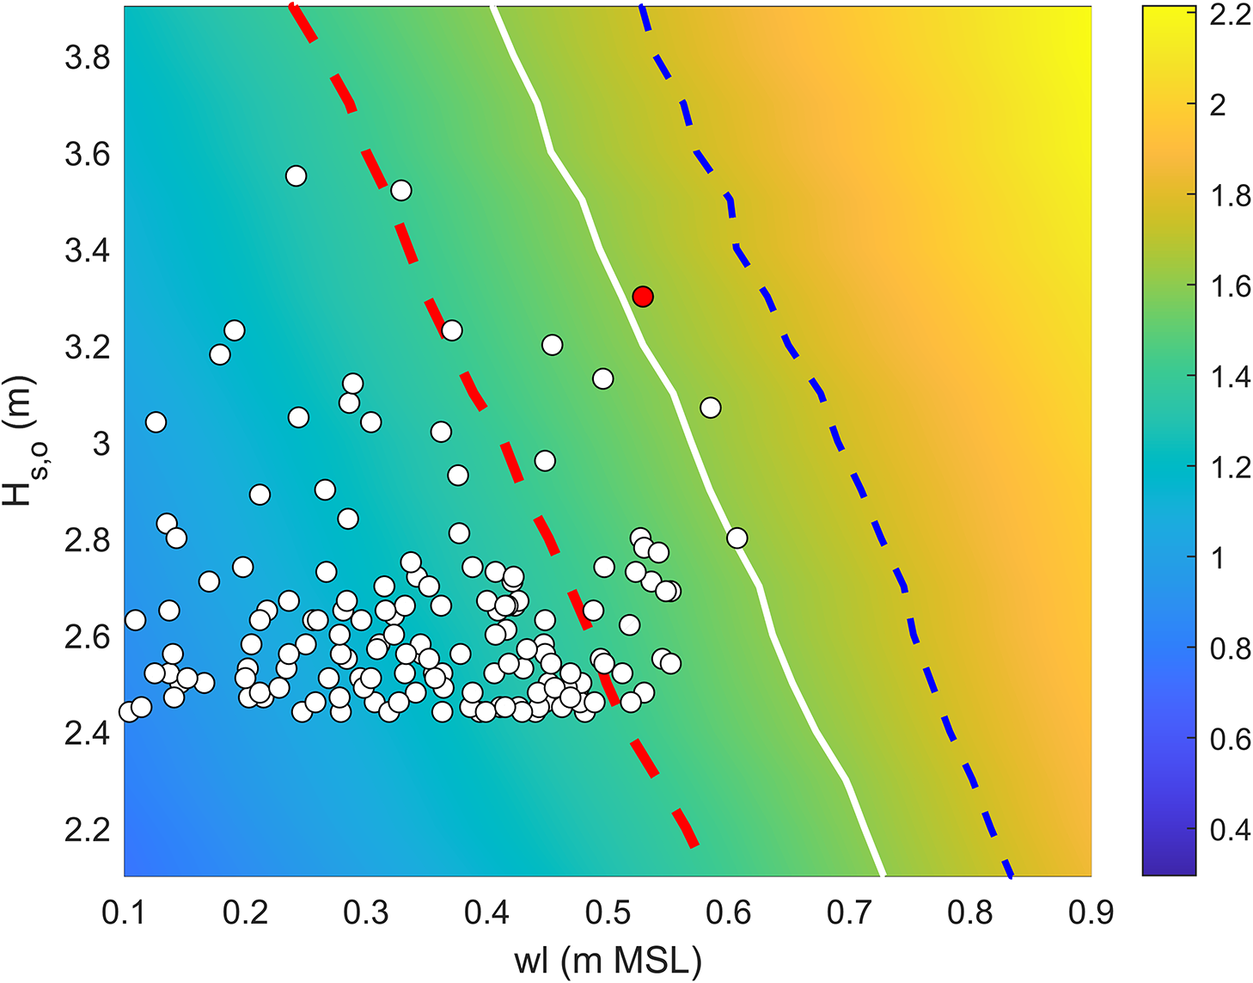
The calibrated and validated XBeach-NH model for Fioyaree was used to plot the 2% exceedance run-up elevation R 2% in a nomogram as a function of offshore water level wl and offshore wave height Hs,o , for a constant peak wave period of Tp = 20 s (Figure 14). All major storm events that occurred over the period 1993–2022, including the 1 July event, are plotted within this parameter space based on their MFWAM-modelled offshore peak wave height Hs,o and the associated measured high tide wl (Figure 14). R 2% increases with both wl and Hs,o , and only the upper-right part of the nomogram is associated with overwash and island flooding (R2% > 1.5 m MSL). Three contour lines are visualised in the nomogram: (1) 1.6 m MSL, which represents the R 2% elevation associated with the 1 July event and which resulted in extensive island overwash (representing a R 2% height of 1.1 m); (2) 1.75 m MSL, which would represent the R 2% elevation required to cause extensive island flooding similar to the 1 July event (representing a R 2% height of 1.25 m), in 1990 when MSL was 0.15 m lower than present; and (3) 1.4 m MSL, which would represent the R 2% elevation required to cause extensive island flooding similar to the 1 July event (representing a R 2% height of 0.9 m), in 2050 when MSL is expected to be 0.2 m higher than present according to SSP-4.5 (IPCC, Reference Masson-Delmotte, Zhai, Pirani, Connors, Péan, Berger, Caud, Chen, Goldfarb, Gomis, Huang, Leitzell, Lonnoy, Matthews, Maycock, Waterfield, Yelekçi, Yu and Zhou2021).
There are three major implications of Figure 14 and these have application beyond the island of Fioyaree, as the 1 July flooding event affected 20 islands along the SW rim of Huvadhoo Atoll. First, only three events occurred over the period 1990–2023 that passed the overwash limit: 6 May 2004 pm, 15 October 2008 pm and 1 July 2022 pm. There was reported flooding in May 2004 only at one island in Huvadhoo Atoll (Hoandedhoo), and no flooding reports for the 15 October 2008 event. However, neither were swell-wave events, as the peak wave period during both storms was <15 s (Figure 5). It is, thus, suggested that significant flooding of islands along the SW rim of Huvadhoo is currently, roughly, a 1:25-year event. Second, it is unlikely that the 1 July event would have resulted in overwash if it had occurred in 1990. Third, 25 storm events that occurred over the period 1990–2023 are plotted above the R 2% = 1.4 m MSL contour in Figure 14 (these events would have a run-up height of >0.9 m) and can thus be considered capable of inducing overwash and island flooding by 2050.
Nomogram showing the modelled 2% exceedance run-up elevation R 2% (relative to MSL) as a function of water level wl and deep water wave height Hs,o , and a constant peak wave period of Tp = 20 s. The circles show the 158 extreme events that occurred over the period 1990–2023, with the red circle representing the 1 July event, positioned in the nomogram based on their peak Hs,o (MFWAM-modelled) and peak (measured from Gan tide record) wl. The Gan water-level record was normalised by setting the mean water level for 2022 to 0. The red dashed, white solid and blue dashed lines represent the R 2% = 1.4, 1.6 and 1.75 m MSL contour lines, respectively.

However, the role of the peak wave period Tp during the storm events should also be considered. It is widely accepted that island flooding in the Maldives is associated with long-period (Tp > 15 s) swell (Wadey et al., Reference Wadey, Brown, Nicholls and Haigh2017) and the nomogram in Figure 14 was derived using a Tp of 20 s, as this was the Tp during the 1 July event. However, not all storm events identified from the MFWAM-modelled offshore wave record are characterised by a large Tp (Figure 5). The sensitivity of wave run-up to Tp was investigated by comparing the 2% exceedance run-up elevation R 2% predicted by the XBeach model for a constant water level wl = 0.53 m MSL and deep water wave height Hs,o = 3.0 m, but for varying Tp. The modelled runup increases with wave period (Supplementary Figure S6). The dependency of R 2% on Tp is particularly significant for Tp < 15 s, with R 2% rapidly reducing with decreasing Tp.
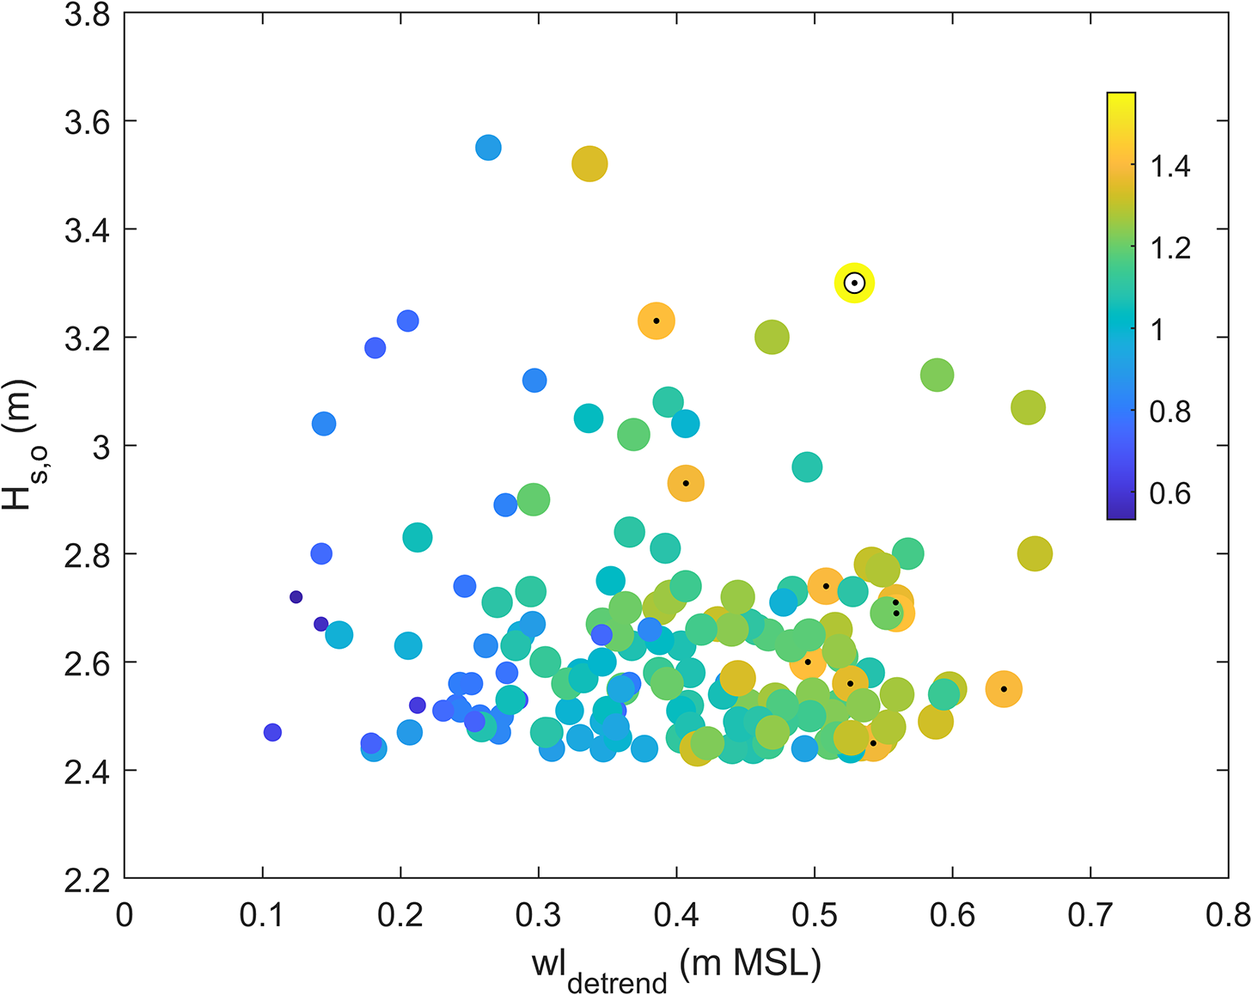
Acknowledging the importance of wave period, therefore, XBeach was also used to compute the R 2% elevation for all storm events that occurred over the 1990–2023 period, using not only their individual maximum wl and Hs,o but also the Tp that occurred during each of the storms. Assuming an R 2% elevation of ≥1.4 m MSL is required to initiate extensive overwash in 2050 (when sea level is 0.2 m higher than at present), it can be concluded that 10 of the storm events that occurred over the 1990–2023 period, all with Tp > 15 s, would likely result in island overwash on the scale of the 1 July event (Figure 15). It is, therefore, concluded that by 2050, island flooding is likely to occur on average every few years.
Discussion and conclusions
A large number (20) of southern Maldivian atoll islands were significantly affected by a flooding event that took place on the afternoon of 1 July 2022. Flooding was especially extensive along the SW margin of Huvadhoo Atoll, where flooding was reported to be the worst since at least the 2004 Boxing Day tsunami, making it a rare event. Significant coastal flooding of islands is actually surprisingly uncommon in the Maldives (inland flooding due to excessive rainfall is a much greater hazard) and probably stems from the fact that many Maldivian atolls were established during the mid-Holocene (2,000–3,000 years ago) under slightly (c. 0.5 m) higher sea levels than present (Kench et al., Reference Kench, Owen, Beetham, Mann, McLean and Ashton2020). Therefore, their development may have been characterised by more intense and frequent flooding than at present (East et al., Reference East, Perry, Kench, Liang and Gulliver2018) and the current flooding regime may not reflect the contemporary sea-level position in relation to the island elevation.
Flooding occurred during a relatively modest spring high tide (c. 0.4 m MSL), but the high tide was augmented by a residual water level of c. 0.15 m, and the combined result was one of the highest water levels of 2022 (0.53 m MSL). The high water level coincided with the most energetic wave conditions experienced in 2022, characterised by an MFWAM-modelled offshore wave height Hs,o of 3.3 m, which has a 10-year return period. A key contributing factor to the flooding was the long wave period during the peak of the storm of Tp = 20.5 s, confirming the notion that flooding in the Maldives is primarily associated with long swell events (Wadey et al., Reference Wadey, Brown, Nicholls and Haigh2017).
Hydrodynamic data collected over a 2-month period immediately following the event on one of the affected islands, Fioyaree, were used to calibrate and validate the phase-resolving 1D XBeach model (XB-NH). A high roughness for the distinctive spur-and-groove section, roughly located between 0 m MSL and 10 m water depth, was required to bring the model results in line with the observations of waves and water level across the reef platform. A Colebrook-White roughness cf of 0.15 was allocated to the spur-and-groove section, and a cf value of 0.01 for the deeper subtidal region and the reef platform. The model results are sensitive to the cf value of the spur-and-groove section, with increased or decreased roughness having an opposing effect on wave setup and IG and VLF wave heights, as also shown by Van Dongeren et al. (Reference Van Dongeren, Lowe, Pomeroy, Trang, Roelvink, Symonds and Ranasinghe2013). The calibrated value of cf found in this study is, however, in line with previous modelling studies representing high coral cover (e.g., Storlazzi et al., Reference Storlazzi, Reguero, Cole, Lowe, Shope, Gibbs, Nickel, McCall, Van Dongeren and Beck2019; Roelvink et al., Reference Roelvink, Storlazzi, Van Dongeren and Pearson2021) and lies well within the range of previously reported cf values of 0.002 (Quataert et al., Reference Quataert, Storlazzi, van Dongeren and McCall2020) to 0.4 (Klaver et al., Reference Klaver, Nederhoff, Giardino, Tissier, Van Dongeren and Van Der Spek2019).
Model calibration and validation were conducted, but there were four main shortcomings to this part of the study. (1) The wave height derived from wave data collected in 12 m water depth (and linearly deshoaled to 25 m) was 63% of the MFWAM-modelled wave height from the deep water node (and shoaled to 25 m water depth). The large difference between offshore and nearshore wave height elicits caution when applying modelled offshore wave conditions to model nearshore hydrodynamics in atoll island settings in the absence of observational wave data. (2) This study uses a 1D hydrodynamic model, and it would have been more appropriate to set up a two-dimensional (2D) model on the island-scale. According to Van Dongeren et al. (Reference Van Dongeren, Lowe, Pomeroy, Trang, Roelvink, Symonds and Ranasinghe2013), the use of a 1D XB-NH model requires a high value of cf to reduce overestimation of wave setup at the expense of underestimation of IG and VLF wave height predictions. This was indeed observed, as the calibrated model overestimated the wave setup η (positive bias of c. 0.1 m) and underestimated the combined IG and VLF wave height Hs,IGVLF (negative bias of c. 0.1 m). It should be pointed out, however, that the 2D XB-NH model calibrated by Quataert et al. (Reference Quataert, Storlazzi, van Dongeren and McCall2020) also shows a significant under-prediction of the VLF wave height (see their Figure 6). (3) The field data did not include run-up information, but the model results suggested that run-up height can be parameterised by the TWH, defined as the sum of wave setup and SS, IG and VLF wave height measured at the toe of the island beach: η + Hs,SS + Hs,IG + Hs,VLF. Therefore, the model was optimised to minimise the bias in predicting TWH. Nevertheless, the modelled run-up elevation during the 1 July event was lower than the elevation of a gravel ridge present along most of the ocean-side of the island, suggesting that run-up may have been under-predicted. Field observations (wrack lines, overwash deposits and flood marks on buildings), on the other hand, indicated that island flooding mainly occurred along the island margins, where the gravel ridge is lower, and through localised depressions in the gravel ridge resulting from pedestrian access and following breaching of the gravel ridge. It is inferred on the basis of the combined evidence that the 2% exceedance run-up elevation R 2% during the peak of the flooding event may have been underestimated by up to 0.3 m, most likely due to an under-estimation of the combined IG-VLF wave motion. (4) Consistent with all previous local (Amores et al., Reference Amores, Marcos, Le Cozannet and Hinkel2022), regional (Taherkhani et al., Reference Taherkhani, Vitousek, Barnard, Frazer, Anderson and Fletcher2020) and global (Vousdoukas et al., Reference Vousdoukas, Mentaschi, Voukouvalas, Verlaan, Jevrejeva, Jackson and Feyen2018) predictions of future coastal flooding, the present study also ignores any natural adjustments to the island morphology due to flooding. Sediment deposition due to overwash processes can result in an increase in island elevation (Tuck et al., Reference Tuck, Ford, Masselink and Kench2019a; Tuck et al., Reference Tuck, Kench, Ford and Masselink2019b; Masselink et al., Reference Masselink, Beetham and Kench2020; Tuck et al., Reference Tuck, Ford, Kench and Masselink2021; Roelvink et al., Reference Roelvink, Masselink, Stokes and McCall2025) and may represent a natural adaptation to increased flood risk.
The calibrated and validated XBeach model was used to develop a 2% exceedance run-up elevation predictor that could potentially be used for evaluating future flood risk. Comparison between wave height and water level characteristics associated with major historic storm events and the run-up nomogram (Figure 15) explains why, in the past, flooding on Fioyaree was rare and will become increasingly common in the future. Specifically, in 1990, MSL was 0.15 m lower than currently, and a wave run-up elevation of 1.75 m MSL (run-up height of 1.25 m) would have been required to result in island flooding. None of the historic events exceeded this value; therefore, coastal flooding was extremely rare. In 2022, for which MSL was set to 0 m, a wave run-up elevation of 1.6 m MSL (run-up height of 1.1 m) led to island flooding. Of all the events since 1990, only the 1 July flooding event (and perhaps one additional event in May 2004) would have exceeded this value, making coastal flooding a c. 1:25-year event. In 2050, MSL is expected to be 0.2 m higher than in 2022, according to SSP-4.5 (IPCC, Reference Masson-Delmotte, Zhai, Pirani, Connors, Péan, Berger, Caud, Chen, Goldfarb, Gomis, Huang, Leitzell, Lonnoy, Matthews, Maycock, Waterfield, Yelekçi, Yu and Zhou2021), and a wave run-up elevation of 1.4 m MSL (run-up height of 0.9 m) would result in island flooding. Ten of the historic events over the 1990–2024 period would exceed this value, thereby, causing coastal flooding every few years. The expected increase in frequency of coastal flooding in the Maldives over the next few decades requires atoll and island authorities in the Maldives to act swiftly to adapt to future flood risk.
Scatter plot of offshore peak wave height Hs,o versus associated high tide wl for 158 storm events identified from the offshore wave record for the period 1990–2023. The wave height was derived from the time series of MFWAM-modelled deep-water (1,000 m depth) wave conditions for grid cell SW of Fioyaree, and the water level was extracted from the Gan tide gauge record. The water-level record was detrended, and the water level was normalised by setting the mean water level for 2022 to 0. The symbols are scaled and coloured based on the 2% exceedance run-up elevation R 2% (relative to MSL). The 1 July event is indicated by the yellow symbol with a small white circle inside; all symbols with a black dot represent R 2% > = 1.4 m MSL.

Open peer review
To view the open peer review materials for this article, please visit http://doi.org/10.1017/cft.2025.10013.
Supplementary material
The supplementary material for this article can be found at http://doi.org/10.1017/cft.2025.10013.
Data availability statement
Raw field data and numerical model parameters and results are publicly available and can be accessed via 10.24382/ce07577f-c55d-44aa-bdb7-0e06aeb72a5c (Masselink, Reference Masselink2024).
Acknowledgements
The authors would like to thank Liane Brodie, Kit Stokes, Daniel Conley and Peter Ganderton for helping out in the field and Lauren Bierman for identifying the source of the large tidal residual during the 1 July event. We thank LAMER for their partnership, support and use of resources during the field campaigns, especially Kandahalagalaa Ali Zuhair for his local insight, logistical support, skippering and overall assistance in the collection of field data. The authors also thank the Fioyaree island community for allowing them to make measurements and install instruments on their island.
Author contribution
GM conceived of the idea, received funding, collected field data, conducted the data analysis and carried out the numerical modelling. TP and TS collected field data, supported the data analysis and assisted with the writing. FR and RMC supported the numerical modelling and assisted with the writing.
Financial support
This research was supported by EPSRC Research Grant: Natural Adaptation of Atoll Islands to Sea-Level Rise Offering Opportunities for Ongoing Human Occupation (EP/X029506/1) awarded to Professor Gerhard Masselink, University of Plymouth.
Competing interests
The authors declare none.


 Open access


Comments
It is our pleasure to submit the paper ‘Numerical modelling of the 1 July 2022 flooding event, Southwest Huvadhoo Atoll, Maldives: Implications for the future’ to Coastal futures, special issue on Extreme Events. The paper documents a major atoll island flooding event that occurred on 1 July 2022 in the Maldives, and uses a calibrate numerical model to simlate this event. The model is then used to evaluate future island flood risk.