

In April 2006, Alex House Ground Floor Ward at the Bethlem Royal Hospital was converted from a mixed-gender to an all-female in-patient unit but retained its mixed-gender staff. There has been ongoing debate surrounding the issue of staff gender. Should an acute female in-patient psychiatric unit be staffed by women alone?
In 2002, the Department of Health released a report entitled Women's Mental Health: Into the Mainstream. 1,2 It focused on the main issues facing psychiatric care for women and suggested that a single-gender unit (staff gender not specified) should be an option for women, stressing their right to choice.
There is very little published data on this subject. In a study by Hingley & Goodwin, 48% of women preferred mixed-gender in-patient accommodation. Reference Hingley and Goodwin3 A further study by Batcup found that only 19% of the sampled in-patients wanted a single-gender environment, Reference Batcup4 whereas Mezey et al found that the majority of female in-patients preferred a mixed-gender unit. Reference Mezey, Hassell and Bartlett5
An audit at the Bethlem Royal Hospital (January 2006) looked at attitudes of service users and their carers to the proposed changes from mixed- to single-gender wards and towards staff gender. Reference Sullivan6 More than half of the female responders (58.9%, n = 67) showed some preference for female staff: primary nurses (61.4%), psychiatrist (39.8%), ward doctor (38.6%), occupational therapist (52.9%), social worker (55.7%) and psychologists (51.1%). However, the study was aimed at service users in general, rather than women who had been inpatients on a psychiatric ward. We were only able to find one other study that addressed service users’ views on staff gender, by Barlow & Wolfson. Reference Barlow and Wolfson7 They surveyed a sample of 50 female in-patients from acute and rehabilitation wards and found that although just 14% preferred female-only staff, 42% preferred a female key worker and a similar number (40%) had no preference.
As regards staff views, there is little published research, but Daffern et al found that although staff gender ratio calculated on a shift-by-shift basis had no effect on the number of violent events, staff confidence in managing aggression seemed to be influenced by the presence of male staff. Reference Daffern, Mayer and Martin8 This accords well with a study by Hatch-Maillette who found that male staff viewed threat situations as significantly less threatening than female staff. Reference Hatch-Maillette9 In a further study in 2003, the same author highlights similar issues making the link between employee well-being, job satisfaction, morale and organisational productivity. Reference Hatch-Maillette and Scalora10
Our survey aimed to look at the views of current in-patients on an all-female ward to staff gender. The ward is a 20-bed unit for women with acute mental health problems aged 18–65 years. Current staffing balance is 3:1 (female:male). There is a fast turnover of patients, with average in-patient stay being 28 days.
Method
A simple questionnaire (Brief Satisfaction Survey, Box 1) was designed, comprising seven questions on attitudes to staff gender, the current staff ratio and perceptions of safety, but not intended to assess general satisfaction on the ward (this is audited separately). The questionnaire was distributed by a junior doctor to all 20 in-patients once a month over a 4-month period (August-November 2006); patients were asked to complete it anonymously and honestly. No other staff members were involved and the questionnaire was collected later the same day. Even if a patient had completed the questionnaire the month before, they were asked to fill it in again to give an accurate cross-sectional representation of the ward.
Collected data excluded patients on leave but included those who refused and/or were too unwell at the time of study. As the survey was ongoing, many patients who had been too unwell to participate one month were able to participate the following month.
Box 1. Brief Satisfaction Surveya
-
1. Do you feel safe on the ward?
-
2. Do you prefer the ward to have only female patients?
-
3. Do you feel comfortable having male staff on the ward?
-
4. Would you prefer the staff to be all female too?
-
5. Do you prefer a majority of female staff but some male staff too?
-
6. Do you think the current staffing balance is right?
-
7. Is there anything you would like to see changed on the ward which would improve your care?
a. Answers to questions 1–6 were: yes, no, not sure; the last question is an open one.
Staff attitudes to staff gender were surveyed anonymously in October 2006 using the same questionnaire and the same method.
Results
Patient survey
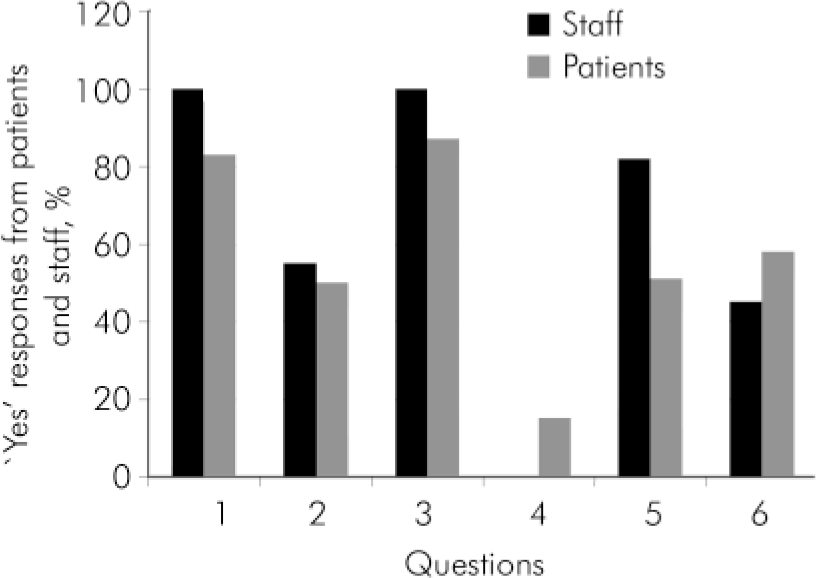
The survey was carried out four times in 4 months, with 52 surveys completed in total (Table 1). The average response rate was 74.5%. Of the responders, 83% reported feeling safe on the ward, 50% said they would prefer a single-gender rather than mixed-gender inpatient environment, 87% reported feeling comfortable with male staff and 15% would like the staff to be all-female. Regarding staff ratio, 58% thought the current ratio correct and 51% reported preferring more female than male staff.
Patient and staff responses to staff gender surveya
| % (n) | |||
|---|---|---|---|
| Yes | No | Don't know | |
| 1 Do you feel safe on the ward? | |||
| Patients | 83 (43) | 11 (6) | 6 (3) |
| Staff | 100 (11) | 0 | 0 |
| 2 Do you prefer the ward to have only female patients? | |||
| Patients | 50 (26) | 38 (19) | 12 (7) |
| Staff | 55 (6) | 27 (3) | 9 (1) |
| 3 Do you feel comfortable having male staff on the ward? | |||
| Patients | 87 (45) | 4 (2) | 9 (5) |
| Staff | 100 (11) | 0 | 0 |
| 4 Would you prefer the staff to be all female too? | |||
| Patients | 15 (8) | 72 (37) | 13 (7) |
| Staff | 0 | 100 (11) | 0 |
| 5 Do you prefer a majority of female staff but some male staff too? | |||
| Patients | 51 (26) | 26 (14) | 23 (12) |
| Staff | 82 (9) | 18 (2) | 0 |
| 6 Do you think the current staffing balance is right? | |||
| Patients | 58 (30) | 27 (14) | 15 (8) |
| Staff | 45 (5) | 45 (5) | 9 (1) |
The only additional comments made by patients were about staff ratio – four expressed a preference for an equal male:female staff gender ratio.
Staff survey
The staff survey revealed that 100% felt safe on the ward, 55% preferred female-only in-patient wards, 100% felt comfortable with male staff, no staff members (0%) supported an all-female staff and 82% were in favour of a predominantly female staff. Regarding staff ratio, 45% thought the current 3:1 ratio was optimal.
Three staff members made comments; two regarding safety on the ward: ‘Having male staff around makes me feel safer if a patient becomes violent or aggressive’ and ‘I would be concerned about our ability to safely restrain patients if staff was all-female’; the other comment was about the ward itself, saying it was ‘a safe and friendly environment’.
Discussion
This survey is the first within our trust since the initial service review to explore the attitudes of patients and staff to staff gender. The aim was to obtain a representative cross-section of patients’ attitudes by repeating this survey over a 4-month period. The study had a good response rate of 74.5% given its setting in the acute in-patient ward. Although 50% of patients surveyed preferred to be in a single-gender (female) ward, 87% reported feeling comfortable with male staff and only 4% felt uncomfortable with men. Further, 15% of responders would like to see the unit have an all-female staff, but 50% preferred more female than male staff and 58% felt the current 3:1 staff gender ratio was acceptable; 72% of the patients in our study would like a mixed-gender staff, which was reflected in the patients’ comments.
The staff were unanimously (100%) in favour of mixed staffing on an all-female ward, although remained in favour of having more female staff. It is interesting that the views of staff and patients are in line, although the staff sample was particularly small (Fig. 1).
These results are in line with those of Mezey et al, Reference Mezey, Hassell and Bartlett5 in that most patients preferred a staff gender mix in the acute in-patient setting, felt comfortable with male staff and were not in favour of the idea of a female-only staffed unit. Staff who responded were strongly in favour of retaining male staff, who play a vital role on the ward. Several staff members commented on safety, particularly at times when patients need to be restrained. Our survey does not draw any conclusions with regard to safety and its relation to staff gender, although this is an area that needs to be explored further.
Limitations
The limitations of this study were the small sample size (which reflects the study's pilot design), not having additional data for patients (age, ethnic background, religion) and perhaps also the fact that a known team member was distributing the questionnaires, which could introduce bias but which was necessary in this simple study. The simplicity of this study is one of its key strengths, which is why we chose to use the same questionnaire for patients and staff.
Comparison of the percentage of patients and staff who responded ‘yes’ to questions in the Brief Satisfaction Questionnaire (Box 1).
Although women with mental health issues are more likely to have experienced abuse, our study supports Mezey et al in showing that in most cases this does not cause them to feel uncomfortable with men. Reference Mezey, Hassell and Bartlett5 It could be argued that excluding men from the ward might reinforce negative stereotypes. Both patients and staff report that they feel safe, but it was beyond the remit of this study to explore whether they actually are safer and to what extent feeling and being safe contribute to clinical outcome.
Conclusions
Current best practice for staffing single-gender acute in-patient units is unclear and in this regard our study raises as many questions as it provides answers, highlighting the need for further research to address this important question. This should involve a larger sample, ideally across multiple centres, and explore the differing effects of such patient variables as age, diagnosis and previous in-patient experience.
The available evidence reveals that a large majority of female in-patient service users prefer to be in a unit with mixed-gender staff. The real key issue brought up in the Bethlem Royal Hospital audit Reference Sullivan6 and particularly in the Department of Health report 2 was that women did not feel their opinions were being listened to.
Declaration of interest
None.


 Open access
eLetters
No eLetters have been published for this article.