


1. Introduction
One of the crucial norms in the financial industry is benchmarking, which takes a relative performance to a benchmark into account. For instance, every hedge fund manager is deemed successful if she can beat the market. Here, the fund manager might choose any market return, for example, S&P 500 index annual return, as the benchmark for her active portfolio management (see, e.g., Alexander et al. (Reference Alexander, Sharpe and Bailey2001)). However, complete outperformance is not always feasible in practice, and the agent may have to adopt passive portfolio management. Being more concerned about her underperformance outcomes, she wants to track the benchmark, hence adopting a limiting underperformance restraint in choosing her portfolio management strategies. From a risk management point of view, the underperformance can be controlled by incorporating a risk constraint that mitigates the expected loss relative to the benchmark level. In addition to the benchmarking concern, most firms in the financial industry are required to maintain a minimal capital reserve to handle extreme financial crises. For an insurance company, it is usual that a minimum guaranteed amount is required to be paid to the policyholders. Minimum guarantees are typically modeled by a portfolio insurance (PI) constraint, see, for example, Grossman and Vila (Reference Grossman and Vila1989); Basak (Reference Basak1995); Grossman and Zhou (Reference Grossman and Zhou1996); Jensen and Sørensen (Reference Jensen and Sørensen2001); Gabih et al. (Reference Gabih, Sass and Wunderlich2009); Di Giacinto et al. (Reference Di Giacinto, Federico, Gozzi and Vigna2014).
Taking these considerations into account, we investigate in this paper a utility maximization problem under a joint PI and limited expected relative loss (LERL) constraint, which is hereafter named as LERL-PI problem. We remark that the limited expected loss (LEL) problem studied in Basak and Shapiro (Reference Basak and Shapiro2001) can be treated as a special case of our LERL-PI problem. By applying a static Lagrangian approach in a complete financial market (see Karatzas et al. (Reference Karatzas, Lehoczky and Shreve1987); Cox and Huang (Reference Cox and Huang1989)), we explicitly obtain the optimal solution to the LERL-PI problem for a general random benchmark along with delicate and rigorous demonstrations, confirming and extending the result in Basak et al. (Reference Basak, Shapiro and Teplá2006). In particular, except for the degenerate PI case, the optimal terminal wealth exhibits a 4-region solution, including two Merton-type forms, the benchmark, and the PI level. Moreover, depending on the choice of the benchmark, the investment outperformance (resp. underperformance) relative to the benchmark may occur in favorable or in unfavorable economic states, indicating a significant trade-off between the outperformance and the underperformance under the presence of a loss constraint.
Risk management (RM) under downside constraints has been widely considered in the literature, see, for example, Grossman and Vila (Reference Grossman and Vila1989); Basak (Reference Basak1995); Grossman and Zhou (Reference Grossman and Zhou1996); Jensen and Sørensen (Reference Jensen and Sørensen2001); Gabih et al. (Reference Gabih, Sass and Wunderlich2009); Chen et al. (Reference Chen, Nguyen and Stadje2018); Dong et al. (Reference Dong, Wu, Lv and Wang2020); Dong and Zheng (Reference Dong and Zheng2020); Nguyen and Stadje (Reference Nguyen and Stadje2020); Escobar-Anel et al. (Reference Escobar-Anel, Wahl and Zagst2021); Gu et al. (Reference Gu, Steffensen and Zheng2021). The LERL-RM framework is suggested by Basak et al. (Reference Basak, Shapiro and Teplá2006), where only the optimal terminal wealth for the stock market benchmark is given without rigorous proof. We extend the setting in Basak et al. (Reference Basak, Shapiro and Teplá2006) to more general benchmarks that include the so-called constant proportion portfolio insurance (CPPI) benchmark, see, for example, Bertrand and Prigent (Reference Bertrand and Prigent2003); Bertrand and Prigent (Reference Bertrand and Prigent2005); Bertrand and Prigent (Reference Bertrand and Prigent2011); Maalej et al. (Reference Maalej and Prigent2016). With an additional PI constraint, our framework also incorporates the minimal capital requirement. Using concavification techniques, Liang et al. (Reference Liang, Liu and Zhang2021) studied an optimization framework with benchmark-dependent utility function, allowing discussion of various technical issues that typically appear in risk management problems with constraints. In addition to the actuarial portfolio optimization literature, our framework also falls into the mainstream of active portfolio management under a risk constraint introduced in Browne (Reference Browne1999a,Reference Browneb, Reference Browne2000) and widely studied thereafter. For a general review, we refer to Grinold and Kahn (Reference Grinold and Kahn2019); see also Alexander and Baptista (Reference Alexander and Baptista2008, Reference Alexander and Baptista2010); Lioui and Poncet (Reference Lioui and Poncet2013).
To illustrate the results and understand the effect of the model parameters thereon, we conduct an intensive numerical analysis for various benchmarking frameworks such as hybrid, mixed and CPPI benchmarks. Our numerical results show that for an out/underperformance benchmark portfolio management, the LERL-PI risky investment ratio is bounded in the range limited by the LEL-PI and PI strategies for the most part. In particular, the LERL-PI agent in very good market scenarios will adopt an investment strategy close to the Merton ratio to beat the benchmark. However, when the market is no longer extremely good, the agent is sensible to reduce the risky asset holding significantly due to the loss constraint. Particularly, the LERL-PI decision-maker tries to match the benchmark return as much as possible, hence enlarging the benchmarking region by taking higher risky exposures in intermediate and bad market states. On the other hand, when the economy is extremely bad, the PI constraint now forces her to reduce the risky investment rapidly, whereas the LERL strategy reverts to the Merton ratio. Moreover, for each specific benchmark, the more prudent the benchmark is, for instance, with a higher risk-free investment initiation in the case of a mixed benchmark or with a lower value of the multiplier m in the case of a CPPI benchmark, the closer the LERL-PI strategy gets to the limiting LEL-PI strategy.
Inspired by Chen and Nguyen (Reference Chen and Nguyen2020), we show that the LERL optimal terminal wealth can be replicated by the optimal solution of an optimal asset allocation problem with a benchmark-reference-based utility (BRBU) function. Compared to Chen and Nguyen (Reference Chen and Nguyen2020), our benchmark-reference-based utility does not include the part measuring the satisfaction of the terminal wealth. Remark that we can include this component to achieve the partial equivalence too. However, this subtle adjustment allows us to develop a new performance indicator called the BRBU ratio, which incorporates the LERL-PI agent’s utility loss aversion relative to the benchmark. Our numerical analysis shows that compared with the well-known Omega ratio (considering the actual relative performance) and its utility-transformed version, the BRBU ratio is always positively proportional to the certainty equivalent, hence better reflecting the impact of the benchmarking loss constraint on the underperformance against the outperformance. This finding is aligned with recent literature on portfolio performance that considers the impact of loss aversion on the performance measurements (see, e.g., Zakamouline (Reference Zakamouline2014) and a short discussion in Section 6.1). It is worth noting that the connection with reference-based preference is a relatively new quantitative aspect in this field of research, and we believe that our results shed light on the relation between loss aversion with benchmarking behavior and portfolio performance measurements.
The rest of the paper is organized as follows. Section 2 depicts the model setting of this paper. Section 3 gives a general benchmark setting together with commonly used benchmarks. The optimization problem under a joint LERL and PI constraint is formulated and solved explicitly in Section 4. Section 5 studies the utility maximization problem under the BRBU with a PI constraint and its relation to the LERL-PI problem. In Section 6, numerical analyses for various benchmark choices are carried out. Finally, a conclusion and perspectives are provided in Section 7. The detailed proofs and additional expositions can be found in the Appendix.
2. Model setting
2.1. Financial market
We consider a complete financial market without transaction costs on a filtered probability space $\left(\mathbf{\Omega},\mathcal{F},\mathbb{P};\,(\mathcal{F}_t)_{t\in[0,T]}\right)$
, equipped with d-dimensional Brownian motion W, where
$\left(\mathbf{\Omega},\mathcal{F},\mathbb{P};\,(\mathcal{F}_t)_{t\in[0,T]}\right)$
, equipped with d-dimensional Brownian motion W, where $(\mathcal{F}_t)_{t\in[0,T]}$
is the natural filtration of W, and
$(\mathcal{F}_t)_{t\in[0,T]}$
is the natural filtration of W, and $T>0$
is the terminal time. It includes one risk-free asset
$T>0$
is the terminal time. It includes one risk-free asset $S^0$
and
$S^0$
and $d\ge1$
risky assets
$d\ge1$
risky assets $S=(S^{(1)},\cdots, S^{(d)})$
whose price dynamics are
$S=(S^{(1)},\cdots, S^{(d)})$
whose price dynamics are $\mathcal{F}$
-adapted semimartingales. Under the no-arbitrage condition, there exists a unique equivalent martingale measure
$\mathcal{F}$
-adapted semimartingales. Under the no-arbitrage condition, there exists a unique equivalent martingale measure $\mathbb{Q}\sim \mathbb{P}$
so that the discounted risky asset processes
$\mathbb{Q}\sim \mathbb{P}$
so that the discounted risky asset processes $\left(S_t/S^0_t\right)_{t\in[0,T]}$
are
$\left(S_t/S^0_t\right)_{t\in[0,T]}$
are $(\mathcal{F},\mathbb{Q})$
-local martingales.
$(\mathcal{F},\mathbb{Q})$
-local martingales.
Denote the fractions of wealth invested in the risky assets by a d-dimension $\mathcal{F}$
-predictable process
$\mathcal{F}$
-predictable process $\pi=(\pi_t)_{t\in[0,T]}=\left(\pi_t^{(1)},\cdots,\pi_t^{(d)}\right)_{t\in[0,T]}$
and assume that it is a self-financing strategy. Then, the corresponding portfolio process
$\pi=(\pi_t)_{t\in[0,T]}=\left(\pi_t^{(1)},\cdots,\pi_t^{(d)}\right)_{t\in[0,T]}$
and assume that it is a self-financing strategy. Then, the corresponding portfolio process $X^{\pi}$
with an initial capital x can be expressed as
$X^{\pi}$
with an initial capital x can be expressed as
 \begin{equation} X_t^{\pi}=x+\int_0^t\pi_sdS_s,\quad t\in[0,T].\end{equation}
As usual, we only consider investment strategies $\pi_t$
for which the portfolio process (2.1) admits a unique strong solution, and
$\pi_t$
for which the portfolio process (2.1) admits a unique strong solution, and $X_t^{\pi}$
is bounded from below so that arbitrage opportunities are excluded. It is known that the discounted portfolio process
$X_t^{\pi}$
is bounded from below so that arbitrage opportunities are excluded. It is known that the discounted portfolio process $X^{\pi}/S^0$
is a
$X^{\pi}/S^0$
is a $(\mathcal{F},\mathbb{Q})$
super-martingale. Below, the superscript
$(\mathcal{F},\mathbb{Q})$
super-martingale. Below, the superscript $\pi$
in
$\pi$
in $X^{\pi}$
will be omitted when there is no confusion.
$X^{\pi}$
will be omitted when there is no confusion.
We remark that such a complete market setting implies a unique stochastic discount factor or pricing kernel defined by $\xi_T\,:\!=\,\frac{S^0_0}{S_T^0}\frac{d\mathbb{Q}}{d\mathbb{P}}$
, where
$\xi_T\,:\!=\,\frac{S^0_0}{S_T^0}\frac{d\mathbb{Q}}{d\mathbb{P}}$
, where $\frac{d\mathbb{Q}}{d\mathbb{P}}$
is the Radon-Nikodym derivative of
$\frac{d\mathbb{Q}}{d\mathbb{P}}$
is the Radon-Nikodym derivative of $\mathbb{Q}$
with respect to
$\mathbb{Q}$
with respect to $\mathbb{P}$
. Economically,
$\mathbb{P}$
. Economically, $\xi_T$
reflects the status of the economy at time T in the sense that it is low if the economy is booming and is high in a depression. Specifically, for any
$\xi_T$
reflects the status of the economy at time T in the sense that it is low if the economy is booming and is high in a depression. Specifically, for any $\omega\in\mathbf{\Omega}$
,
$\omega\in\mathbf{\Omega}$
, $\xi_T(\omega)$
can be viewed as the Arrow-Debreu value per unit probability P of $1 payoff of an asset in state
$\xi_T(\omega)$
can be viewed as the Arrow-Debreu value per unit probability P of $1 payoff of an asset in state $\omega$
at time T, and 0 otherwise. Owing to this explanation, we can later construct benchmarks characterizing optimal wealth and strategy as functions of
$\omega$
at time T, and 0 otherwise. Owing to this explanation, we can later construct benchmarks characterizing optimal wealth and strategy as functions of $\xi_T$
to show how they evolve with respect to the state of the economy. Also, we assume that
$\xi_T$
to show how they evolve with respect to the state of the economy. Also, we assume that $\xi_T$
is atomless throughout this paper.
$\xi_T$
is atomless throughout this paper.
By the martingale approach (see, e.g., Karatzas et al. (Reference Karatzas, Lehoczky and Shreve1987); Cox and Huang (Reference Cox and Huang1989)), solving the dynamic utility maximization problem by finding a self-financing optimal investment strategy $\pi$
is equivalent to selecting an optimal terminal wealth
$\pi$
is equivalent to selecting an optimal terminal wealth $X_T$
financed by the initial capital x. We denote the set of all attainable terminal portfolios
$X_T$
financed by the initial capital x. We denote the set of all attainable terminal portfolios $X_T$
by
$X_T$
by
 \begin{equation*} \mathbb{X}\,:\!=\, \left\{X_T\,:\, \mathbb{E}(\xi_TX_T)\leq x,\ X_T\text{ is }\mathcal{F}_T\text{-measurable, and }X_T\geq 0\ a.s.\right\},\end{equation*}
where $\mathbb{E}(\xi_TX_T)\leq x$
is the so-called budget constraint.
$\mathbb{E}(\xi_TX_T)\leq x$
is the so-called budget constraint.
Later, we will adopt a one-dimension Black-Scholes model for numerical demonstration. Since we consider a general complete market in the theoretical part, the results can be easily extended to other complete market models like the local volatility model, stochastic interest rate model with a zero-coupon bond, and the Heston stochastic volatility model with an additional financial derivative for completion.
2.2. The agent’s preference
In this paper, the agent’s preference is modeled by a strictly increasing, strictly concave, and continuously differentiable utility function $U\,:\,(0,+\infty)\mapsto({-}\infty,+\infty)$
satisfying the following two conditions:
$U\,:\,(0,+\infty)\mapsto({-}\infty,+\infty)$
satisfying the following two conditions:
Assumption 1. (Inada’s conditions)
 \begin{equation} \lim_{y\rightarrow 0}U^{\prime}(y)=+\infty\quad\text{and}\quad \lim_{y\rightarrow{+\infty}}U^{\prime}(y)=0. \end{equation}
Note that the Inada’s conditions imply that
 \begin{equation} \lim_{y\rightarrow 0}I(y)=+\infty\quad\text{and}\quad \lim_{y\rightarrow+\infty}I(y)=0,\end{equation}
where $I(\cdot)=(U^{\prime})^{-1}(\cdot)$
, which excludes utility functions with constant absolute relative aversion. However, our approach can be easily extended to such a framework.
$I(\cdot)=(U^{\prime})^{-1}(\cdot)$
, which excludes utility functions with constant absolute relative aversion. However, our approach can be easily extended to such a framework.
Assumption 2. (Integrability Conditions) For all $\lambda>0$
, it holds that
$\lambda>0$
, it holds that
 \begin{equation*} (i)\ \mathbb{E}(\xi_TI(\lambda\xi_T))<+\infty\qquad (ii)\ \mathbb{E}(U(I(\lambda\xi_T)))<+\infty\qquad (iii)\ \mathbb{E}\left(\xi_T^2|I^{\prime}(\lambda\xi_T)|\right)<+\infty. \end{equation*}
As shown below, while the first and second integrability conditions are technically needed to ensure the existence of Lagrangian multipliers, the third condition in Assumption 2 allows one to switch the expectation and the differential operators (see Appendix D) when examining the relationship between Lagrange multipliers and other parameters in the optimization problem.
3. Benchmark setting and examples
3.1. General benchmark setting
Benchmarking is a universal practice in both active and passive asset management. This subsection provides specifications on the benchmark process $(Y_t)_{t\in[0,T]}$
. Typically, a benchmark represents a general indicator of market sentiment and direction.Footnote 1 A specific choice for the benchmark falls into three usual categories: a portfolio, an index (including the stock indices, e.g., S&P 500 as the most popular example), or any economic indicator. Motivated by various works on portfolio management with benchmarking, for example, Basak et al. (Reference Basak, Shapiro and Teplá2006); Cuoco and Kaniel (Reference Cuoco and Kaniel2011), we focus on a class of benchmark portfolios that are positively correlated with the stock market. These benchmarks are the mostly used benchmark when considering mutual funds and pension funds whose investment management is typically procyclical to the overall state of the economy represented by the market price density
$(Y_t)_{t\in[0,T]}$
. Typically, a benchmark represents a general indicator of market sentiment and direction.Footnote 1 A specific choice for the benchmark falls into three usual categories: a portfolio, an index (including the stock indices, e.g., S&P 500 as the most popular example), or any economic indicator. Motivated by various works on portfolio management with benchmarking, for example, Basak et al. (Reference Basak, Shapiro and Teplá2006); Cuoco and Kaniel (Reference Cuoco and Kaniel2011), we focus on a class of benchmark portfolios that are positively correlated with the stock market. These benchmarks are the mostly used benchmark when considering mutual funds and pension funds whose investment management is typically procyclical to the overall state of the economy represented by the market price density $\xi_T$
(see the discussion in Section 2.1). Based on this, it is reasonable to set the benchmark process as an inversely monotone function with respect to
$\xi_T$
(see the discussion in Section 2.1). Based on this, it is reasonable to set the benchmark process as an inversely monotone function with respect to $\xi_T$
. More precisely, we assume that
$\xi_T$
. More precisely, we assume that $Y_T=f(\xi_T)$
where
$Y_T=f(\xi_T)$
where $f\,:\,[0,+\infty)\mapsto[0,+\infty)$
is a non-increasing and continuous function satisfying the following assumption:
$f\,:\,[0,+\infty)\mapsto[0,+\infty)$
is a non-increasing and continuous function satisfying the following assumption:
Assumption 3. For any $\lambda>0$
, the functions
$\lambda>0$
, the functions $f(\xi)$
and
$f(\xi)$
and $I(\lambda\xi)$
cross each other once at
$I(\lambda\xi)$
cross each other once at $\xi_c\in(0,+\infty)$
or
$\xi_c\in(0,+\infty)$
or $f(\xi)=I(\lambda_B\xi)$
for some
$f(\xi)=I(\lambda_B\xi)$
for some $\lambda_B>0$
.
$\lambda_B>0$
.
As will be shown in Section 3.2, Assumption 3 can be checked directly for various popular benchmarks. For convenience of presentation, we distinguish the following 3 cases: Cases (1), (2) (when the benchmark curve $f(\xi)$
and the Merton curve
$f(\xi)$
and the Merton curve $I(\lambda\xi)$
cross at a unique intersection) and Case (3) (when
$I(\lambda\xi)$
cross at a unique intersection) and Case (3) (when $f(\xi)=I(\lambda_B\xi)$
), which are summarized in Table 1. Obviously, Case (3) means that the benchmark belongs to the family of Merton portfolios with some multiplier
$f(\xi)=I(\lambda_B\xi)$
), which are summarized in Table 1. Obviously, Case (3) means that the benchmark belongs to the family of Merton portfolios with some multiplier $\lambda_B>0$
. As illustrated in Figure 1, Case (1) (resp. Case (2)) means that the Merton portfolio (resp. the benchmark) is more responsive to the economy change than the benchmark (resp. the Merton curve). Therefore, below, Case (1) and Case (2) will be named as out/underperformance and under/outperformance respectively. Note that by the intermediate value theorem, it is easy to see that Case (1) is fulfilled if for any
$\lambda_B>0$
. As illustrated in Figure 1, Case (1) (resp. Case (2)) means that the Merton portfolio (resp. the benchmark) is more responsive to the economy change than the benchmark (resp. the Merton curve). Therefore, below, Case (1) and Case (2) will be named as out/underperformance and under/outperformance respectively. Note that by the intermediate value theorem, it is easy to see that Case (1) is fulfilled if for any $\lambda>0$
, the function
$\lambda>0$
, the function $\xi\mapsto f(\xi)/I(\lambda\xi)$
is increasing and the following asymptotic results hold
$\xi\mapsto f(\xi)/I(\lambda\xi)$
is increasing and the following asymptotic results hold
 \begin{equation*} \lim_{\xi\nearrow +\infty}\frac{f(\xi)}{I(\lambda\xi)}>1 \quad \mbox{and} \quad\lim_{\xi\searrow 0}\frac{f(\xi)}{I(\lambda\xi)}<1.\end{equation*}
A similar condition can be easily used to verify Case (2).
Three situations for benchmarking and portfolio management

Intersection of the Merton curve with the benchmark.

Remark 3.1. We remark that for Case (1), f can even be an increasing function because it does not violate Assumption 3. However, as mentioned above, it is economically reasonable to set $f(\xi_T)$
as a decreasing function of
$f(\xi_T)$
as a decreasing function of $\xi_T$
. In Case (2), we can deduce that f is monotonically decreasing and satisfying
$\xi_T$
. In Case (2), we can deduce that f is monotonically decreasing and satisfying
 \begin{equation} \lim_{\xi\rightarrow 0}f(\xi)=+\infty \quad\text{and}\quad \lim_{\xi\rightarrow+\infty}f(\xi)=0, \end{equation}
according to (2.3) and Table 1. It is also observed that Case (1) holds true if f is a positive constant (see Example 1) or f is decreasing and bounded below by a positive constant.
Throughout the paper, we make use of the following assumption:
Assumption 4.
 \begin{equation*} \mathbb{E}(\xi_Tf(\xi_T))<+\infty \quad\text{and}\quad \mathbb{E}(U(f(\xi_T)))<+\infty.\end{equation*}
Assumption 4 means that the benchmark is replicable and the benchmark expected utility is finite. The above endogenous benchmark structure is quite general, and various widely used benchmark settings in the literature can be included in our setting.
3.2. Benchmark examples
Before giving benchmark examples, we first introduce the Black-Scholes model consisting of one risky asset S with return $\mu$
and volatility
$\mu$
and volatility $\sigma$
and a risk-free asset
$\sigma$
and a risk-free asset $S^0$
with constant interest rate r. In particular, the asset price dynamics are given by
$S^0$
with constant interest rate r. In particular, the asset price dynamics are given by
 \begin{equation*} dS_t=S_t(\mu dt+\sigma dW_t),\quad dS_t^0=rS_t^0dt,\quad S_0^0=1.\end{equation*}
It is well-known that the risky asset price can be expressed as $S_t=S_0\exp{((\mu-\frac{\sigma^2}{2})t+\sigma W_t)}$
by Itô’s lemma, where
$S_t=S_0\exp{((\mu-\frac{\sigma^2}{2})t+\sigma W_t)}$
by Itô’s lemma, where $S_0>0$
is the risky asset price at time 0. In such a complete market setting, the unique market price density is defined by
$S_0>0$
is the risky asset price at time 0. In such a complete market setting, the unique market price density is defined by
 \begin{equation*} d\xi_t=-\xi_t(rdt+\theta dW_t),\quad \xi_0=1,\end{equation*}
where $\theta=\frac{\mu-r}{\sigma}$
is the market price of risk. Similarly to
$\theta=\frac{\mu-r}{\sigma}$
is the market price of risk. Similarly to $S_t$
, we have
$S_t$
, we have $\xi_t=\exp\left({-}rt-\frac{1}{2}\theta^2t-\theta W_t\right)$
. Let
$\xi_t=\exp\left({-}rt-\frac{1}{2}\theta^2t-\theta W_t\right)$
. Let $\pi_t$
be the fraction invested in the risky asset at time t. Then, the corresponding wealth process with an initial capital
$\pi_t$
be the fraction invested in the risky asset at time t. Then, the corresponding wealth process with an initial capital $x>0$
is given by
$x>0$
is given by
 \begin{equation} dX_t=(r+\pi_t(\mu-r))X_tdt+\pi_t\sigma X_tdW_t,\quad X_0=x.\end{equation}
Below, we consider four benchmark examples that satisfy Assumption 3. Note that under a Black-Scholes market, the counter-monotonicity of f to $\xi_T$
indicates a nonnegative position in the risky asset S.
$\xi_T$
indicates a nonnegative position in the risky asset S.
Example 1. (Money benchmarks) A simple benchmark is $f(\xi_T)=\overline{x}$
, where
$f(\xi_T)=\overline{x}$
, where $\overline{x}$
is a constant. It is evident that this case belongs to Case (1) and can be interpreted as the money market benchmark, see the numerical Section 6.3.
$\overline{x}$
is a constant. It is evident that this case belongs to Case (1) and can be interpreted as the money market benchmark, see the numerical Section 6.3.
Example 2. (Stock market benchmarks) Another important benchmark is $f(\xi_T)=S_T$
, as considered in (Basak et al. Reference Basak, Shapiro and Teplá2006, Section 4.3) with a power utility
$f(\xi_T)=S_T$
, as considered in (Basak et al. Reference Basak, Shapiro and Teplá2006, Section 4.3) with a power utility $U(y)=\frac{y^{1-\gamma}}{1-\gamma}$
with
$U(y)=\frac{y^{1-\gamma}}{1-\gamma}$
with $\gamma\neq 1$
and
$\gamma\neq 1$
and $\gamma >0$
. To verify Assumption 3, it suffices to observe that
$\gamma >0$
. To verify Assumption 3, it suffices to observe that
 \begin{equation*} f(\xi_T)=S_T =S_0e^{\left(\mu-\frac{\sigma^2}{2}\right)T+\sigma W_T}=S_0e^{\left(\mu-\frac{\sigma^2}{2}\right)T-\left(r+\frac{\theta^2}{2}\right)\frac{\sigma T}{\theta}}\times e^{\left(\left({-}r-\frac{\theta^2}{2}\right)T-\theta W_T\right)\times \left( -\frac{\sigma}{\theta}\right)}\,:\!=\,A\xi_T^{-\frac{\sigma}{\theta}},\end{equation*}
which is obviously a monotonically decreasing and differentiable function. To discuss the benchmark classification,we can consider the following equation
 \begin{equation*} f(y)-I(\lambda y) =Ay^{-\frac{\sigma}{\theta}}-\lambda^{-\frac{1}{\gamma}}y^{-\frac{1}{\gamma}} =\lambda^{-\frac{1}{\gamma}}y^{-\frac{1}{\gamma}}\left(A\lambda^{\frac{1}{\gamma}}y^{\frac{1}{\gamma}-\frac{\sigma}{\theta}}-1\right) =0.\end{equation*}
If $\frac{\sigma}{\theta}=\frac{1}{\gamma}$
, we have
$\frac{\sigma}{\theta}=\frac{1}{\gamma}$
, we have $f(y)=I(\lambda_By)$
for
$f(y)=I(\lambda_By)$
for $\lambda_B=A^{-\gamma}$
, which shows that the benchmark belongs to family of Merton curves (i.e., Case (3)). If
$\lambda_B=A^{-\gamma}$
, which shows that the benchmark belongs to family of Merton curves (i.e., Case (3)). If $\frac{\sigma}{\theta}\neq\frac{1}{\gamma}$
, the root is
$\frac{\sigma}{\theta}\neq\frac{1}{\gamma}$
, the root is $A^{\frac{1}{\frac{\sigma}{\theta}-\frac{1}{\gamma}}}\lambda^{\frac{1}{\frac{\gamma\sigma}{\theta}-1}}$
, and we obtain the following classification:
$A^{\frac{1}{\frac{\sigma}{\theta}-\frac{1}{\gamma}}}\lambda^{\frac{1}{\frac{\gamma\sigma}{\theta}-1}}$
, and we obtain the following classification:
 \begin{align*} \text{Case (1): }&f(y)-I(\lambda y) \left \{ \begin{array}{l@{\quad}r} <0 & \text{ if }y<A^{\frac{1}{\frac{\sigma}{\theta}-\frac{1}{\gamma}}}\lambda^{\frac{1}{\frac{\gamma\sigma}{\theta}-1}}\\[4pt] >0 & \text{ if }y>A^{\frac{1}{\frac{\sigma}{\theta}-\frac{1}{\gamma}}}\lambda^{\frac{1}{\frac{\gamma\sigma}{\theta}-1}} \end{array} \right. \text{for}\quad\frac{\sigma}{\theta}<\frac{1}{\gamma};\\[6pt] \text{Case (2): }&f(y)-I(\lambda y) \left \{ \begin{array}{r@{\quad}c@{\quad}l} >0 & \text{ if }y<A^{\frac{1}{\frac{\sigma}{\theta}-\frac{1}{\gamma}}}\lambda^{\frac{1}{\frac{\gamma\sigma}{\theta}-1}}\\[4pt] <0 & \text{ if }y>A^{\frac{1}{\frac{\sigma}{\theta}-\frac{1}{\gamma}}}\lambda^{\frac{1}{\frac{\gamma\sigma}{\theta}-1}} \end{array} \right. \text{for}\quad\frac{\sigma}{\theta}>\frac{1}{\gamma}.\end{align*}
As mentioned after Assumption 3, we remark that the benchmark classification can be checked by considering the function $f(\xi)/I(\lambda \xi)$
.
$f(\xi)/I(\lambda \xi)$
.
Example 3. (Hybrid benchmarks) Under the Black-Scholes market consisting of a risk-free asset and only one risky asset, the choice of the benchmark is limited by the set of all possible combinations of these two assets. In terms of combinations, one can form a benchmark whose return rate is a weighted average of the risk-free rate r and the return of stock $R_T^S$
, called the hybrid benchmark (see, e.g., (Basak et al. Reference Basak, Shapiro and Teplá2006, Section 4.2)). More precisely, the return of this benchmark
$R_T^S$
, called the hybrid benchmark (see, e.g., (Basak et al. Reference Basak, Shapiro and Teplá2006, Section 4.2)). More precisely, the return of this benchmark $R_T^Y$
from time 0 to time T is
$R_T^Y$
from time 0 to time T is
 \begin{equation*} R_T^Y=\frac{1}{T}\ln\frac{Y^H_T}{Y^H_0}=\alpha r+(1-\alpha)R_T^S,\end{equation*}
where $R_T^S=\frac{1}{T}\ln\frac{S_T}{S_0}$
is the return of the stock market from time 0 to time T and the riskless investment proportion
$R_T^S=\frac{1}{T}\ln\frac{S_T}{S_0}$
is the return of the stock market from time 0 to time T and the riskless investment proportion $\alpha\in[0,1]$
. Then, the benchmark
$\alpha\in[0,1]$
. Then, the benchmark $Y_T^H=f^H(\xi_T)$
can be expressed as a function of
$Y_T^H=f^H(\xi_T)$
can be expressed as a function of $\xi_T$
, namely
$\xi_T$
, namely $f^H(\xi_T) \,:\!=\,B\xi_T^{-\frac{\sigma}{\theta}(1-\alpha)}$
, where
$f^H(\xi_T) \,:\!=\,B\xi_T^{-\frac{\sigma}{\theta}(1-\alpha)}$
, where $B=Y_0^He^{\left(\alpha r+\left(\mu-\frac{\sigma^2}{2}\right)(1-\alpha)\right)T-\left(r+\frac{\theta^2}{2}\right)\frac{\sigma }{\theta}(1-\alpha)T}$
. Then, it is clear that
$B=Y_0^He^{\left(\alpha r+\left(\mu-\frac{\sigma^2}{2}\right)(1-\alpha)\right)T-\left(r+\frac{\theta^2}{2}\right)\frac{\sigma }{\theta}(1-\alpha)T}$
. Then, it is clear that $f^H$
is a monotonically decreasing function. To check Assumption 3, we solve the following equation
$f^H$
is a monotonically decreasing function. To check Assumption 3, we solve the following equation
 \begin{equation} f^H(y)-I(\lambda y) =By^{-\frac{\sigma}{\theta}(1-\alpha)}-\lambda^{-\frac{1}{\gamma}}y^{-\frac{1}{\gamma}} =\lambda^{-\frac{1}{\gamma}}y^{-\frac{1}{\gamma}}\left(B\lambda^{\frac{1}{\gamma}}y^{\frac{1}{\gamma}-\frac{\sigma}{\theta}(1-\alpha)}-1\right) =0.\end{equation}
If $\frac{\sigma}{\theta}(1-\alpha)=\frac{1}{\gamma}$
, we obtain Case (3) by setting
$\frac{\sigma}{\theta}(1-\alpha)=\frac{1}{\gamma}$
, we obtain Case (3) by setting $\lambda_B=B^{-\gamma}$
. For other cases, the root is
$\lambda_B=B^{-\gamma}$
. For other cases, the root is $B^{\frac{1}{\frac{\sigma}{\theta}(1-\alpha)-\frac{1}{\gamma}}}\lambda^{\frac{1}{\frac{\gamma\sigma}{\theta}(1-\alpha)-1}}$
. Following a similar calculation as in Example 2, it belongs to Case (1) (resp. Case (2)) if
$B^{\frac{1}{\frac{\sigma}{\theta}(1-\alpha)-\frac{1}{\gamma}}}\lambda^{\frac{1}{\frac{\gamma\sigma}{\theta}(1-\alpha)-1}}$
. Following a similar calculation as in Example 2, it belongs to Case (1) (resp. Case (2)) if $\frac{\sigma}{\theta}(1-\alpha)<\frac{1}{\gamma}$
(resp.
$\frac{\sigma}{\theta}(1-\alpha)<\frac{1}{\gamma}$
(resp. $\frac{\sigma}{\theta}(1-\alpha)>\frac{1}{\gamma})$
.
$\frac{\sigma}{\theta}(1-\alpha)>\frac{1}{\gamma})$
.
Example 4. (Mixed benchmarks) Another benchmark example is to combine the risk-free asset and the risky asset with different proportions. In particular, assuming that the proportion of capital invested in the risk-free asset is $\beta\in(0,1)$
in the mixed benchmark and
$\beta\in(0,1)$
in the mixed benchmark and $S_0=1$
, the mixed benchmark
$S_0=1$
, the mixed benchmark $Y^M$
is defined by
$Y^M$
is defined by
 \begin{equation*} Y_T^M=\beta Y_0^Me^{rT} +(1-\beta)Y_0^Me^{\left(\mu-\frac{\sigma^2}{2}\right)T-\left(r+\frac{\theta^2}{2}\right)\frac{\sigma T}{\theta}}\xi_T^{ -\frac{\sigma}{\theta}}.\end{equation*}
Clearly $Y_T^M$
is bounded from below by
$Y_T^M$
is bounded from below by $\beta Y_0^Me^{rT}$
and we are in Case (1) if
$\beta Y_0^Me^{rT}$
and we are in Case (1) if $\frac{1}{\gamma}\geq\frac{\sigma}{\theta}$
, (see Remark 3.1). We remark that if
$\frac{1}{\gamma}\geq\frac{\sigma}{\theta}$
, (see Remark 3.1). We remark that if $\frac{1}{\gamma}<\frac{\sigma}{\theta}$
, the Merton curve may intersect the benchmark more than once and Assumption 3 is violated.
$\frac{1}{\gamma}<\frac{\sigma}{\theta}$
, the Merton curve may intersect the benchmark more than once and Assumption 3 is violated.
Example 5. (CPPI benchmarks) With a portfolio insurance constraint in our setting, it is natural to consider other portfolio insurance strategies as a benchmark. One standard method is the so-called constant proportion portfolio insurance (CPPI, see, e.g., Bertrand and Prigent (Reference Bertrand and Prigent2005)). To construct a CPPI portfolio, the investor sets a floor $L_t=L_0e^{rt}$
as a lower bound of portfolio and dynamically calculates a cushion
$L_t=L_0e^{rt}$
as a lower bound of portfolio and dynamically calculates a cushion $C_t$
defined as the difference between the portfolio wealth
$C_t$
defined as the difference between the portfolio wealth $X_t^{CPPI}$
and the floor
$X_t^{CPPI}$
and the floor $L_t$
. The amount of capital invested in the risky asset is given by the cushion scaled by a predetermined multiplier m. To embed a CPPI benchmark into our framework, we first infer the dynamic of
$L_t$
. The amount of capital invested in the risky asset is given by the cushion scaled by a predetermined multiplier m. To embed a CPPI benchmark into our framework, we first infer the dynamic of $C_t$
and terminal benchmark value
$C_t$
and terminal benchmark value ${Y}_T^{CPPI}=C_T+L_T$
as a function of
${Y}_T^{CPPI}=C_T+L_T$
as a function of $\xi_T$
. By construction, we first have
$\xi_T$
. By construction, we first have
 \begin{equation*} d{Y}_t^{CPPI} =dC_t+rL_tdt=\left({Y}_t^{CPPI}-mC_t\right)\frac{dB_t}{B_t}+mC_t\frac{dS_t}{S_t}\\ =(C_t+L_t-mC_t)rdt+mC_t(\mu dt+\sigma dW_t),\end{equation*}
which implies the cushion dynamics $dC_t=C_t[((1-m)r+m\mu)dt+m\sigma dW_t]$
. Solving this SDE, we obtain
$dC_t=C_t[((1-m)r+m\mu)dt+m\sigma dW_t]$
. Solving this SDE, we obtain
 \begin{equation*} C_T=\left({Y}_0^{CPPI}-L_0\right)e^{\left[\left(1-\frac{m}{2}-\frac{m\sigma}{\theta}\right)r+\frac{m\mu}{2}-\frac{m^2\sigma^2}{2}\right]T} \xi_T^{-\frac{m\sigma}{\theta}} \,:\!=\,F\xi_T^{-\frac{m\sigma}{\theta}}.\end{equation*}
The terminal value of CPPI portfolio is then quantified as ${Y}_T^{CPPI}=F\xi_T^{-\frac{m\sigma}{\theta}}+L_0e^{rT}$
.
${Y}_T^{CPPI}=F\xi_T^{-\frac{m\sigma}{\theta}}+L_0e^{rT}$
.
Similarly to the mixed benchmark, the terminal value of CPPI benchmark is bounded from below, implying only Case (1) is applicable when $\frac{m\sigma}{\theta}\leq\frac{1}{\gamma}$
according to Remark 3.1.
$\frac{m\sigma}{\theta}\leq\frac{1}{\gamma}$
according to Remark 3.1.
4. The LERL-PI problem
In this section, we investigate an expected utility maximization problem under a joint LERL and PI constraint. In Basak et al. (Reference Basak, Shapiro and Teplá2006), a similar problem is considered without a portfolio insurance constraint, and the benchmark is specifically chosen as the stock market. However, the mentioned work focuses on economic applications without giving rigorous proofs for the optimal portfolio. Here, we consider a more general framework than the setting in Basak et al. (Reference Basak, Shapiro and Teplá2006) by allowing the benchmark to follow a stochastic process $Y_T=f(\xi_T)$
generated by an initial capital
$Y_T=f(\xi_T)$
generated by an initial capital $Y_0$
(see Section 3) and assuming an additional lower bound L for terminal wealth. Below, the optimal solution to the LERL-PI problem will be given explicitly.
$Y_0$
(see Section 3) and assuming an additional lower bound L for terminal wealth. Below, the optimal solution to the LERL-PI problem will be given explicitly.
4.1. Problem formulation
The LERL-PI problem is stated as
 \begin{equation} \max_{{X_T\in\mathbb{X}},\, X_T\geq L}\mathbb{E}\left(U(X_T)\right)\quad \text{ s.t. }\mathbb{E}\left(\xi_T(f(\xi_T)-X_T)\mathbf{1}_{X_T\leq f(\xi_T)}\right)\leq\epsilon,\end{equation}
where $X_T$
is the terminal wealth defined by (2.1),
$X_T$
is the terminal wealth defined by (2.1), $f(\xi_T)$
is the benchmark at time T as discussed in Section 3,
$f(\xi_T)$
is the benchmark at time T as discussed in Section 3, $\epsilon\geq 0$
is the LERL loss bound, and
$\epsilon\geq 0$
is the LERL loss bound, and $L\geq 0$
is the minimum guarantee level. The PI constraint guarantees that the terminal wealth is above the level L at maturity.
$L\geq 0$
is the minimum guarantee level. The PI constraint guarantees that the terminal wealth is above the level L at maturity.
Remark 4.1. (LERL constraint under $\mathbb{Q}$
or
$\mathbb{Q}$
or $\mathbb{P}$
?) Note that the LERL constraint under the risk-neutral measure
$\mathbb{P}$
?) Note that the LERL constraint under the risk-neutral measure $\mathbb{Q}$
in Problem (4.1) determines the present value of the expected loss relative to the benchmark, whereas the quantity
$\mathbb{Q}$
in Problem (4.1) determines the present value of the expected loss relative to the benchmark, whereas the quantity $\mathbb{E}[(X_T-f(\xi_T))_{-}]$
provides the future expected loss relative to the benchmark under the physical measure
$\mathbb{E}[(X_T-f(\xi_T))_{-}]$
provides the future expected loss relative to the benchmark under the physical measure $\mathbb{P}$
which therefore, from a risk management perspective, seems more naturally to solve.However, like the existing literature, for example, Basak and Shapiro (Reference Basak and Shapiro2001); Basak et al. (Reference Basak, Shapiro and Teplá2006), we focus in this paper on the optimal portfolio problem under the risk-neutral LERL constraint. There are several reasons supporting our choice: First, by working on the closed-form solution under risk-neutral LERL constraint, we manage to establish an (partial) equivalent result with our benchmark-reference-based (BRBU) problem (5.1) whose the ratio of the loss-gain parameters eventually helps define a new portfolio performance criterion. This will be investigated in detail in Sections 5-6 of the paper. Second, while showing only the result on the risk-neutral LERL constraint, our methodology can be directly applied to the version under the physical measure
$\mathbb{P}$
which therefore, from a risk management perspective, seems more naturally to solve.However, like the existing literature, for example, Basak and Shapiro (Reference Basak and Shapiro2001); Basak et al. (Reference Basak, Shapiro and Teplá2006), we focus in this paper on the optimal portfolio problem under the risk-neutral LERL constraint. There are several reasons supporting our choice: First, by working on the closed-form solution under risk-neutral LERL constraint, we manage to establish an (partial) equivalent result with our benchmark-reference-based (BRBU) problem (5.1) whose the ratio of the loss-gain parameters eventually helps define a new portfolio performance criterion. This will be investigated in detail in Sections 5-6 of the paper. Second, while showing only the result on the risk-neutral LERL constraint, our methodology can be directly applied to the version under the physical measure $\mathbb{P}$
. The Lagrangian analysis shall be adjusted accordingly, but it seems unclear how to retain the equivalence result with the solution to the BRBU problem (5.3) in this case. Third, as the expected loss under the risk-neutral measure provides the financial value of that loss (relative to the benchmark) corrected by a discount factor, it would be easier to communicate its interpretation to people who think about risk in terms of the value of holding or selling it, see, for example, Gu et al. (Reference Gu, Steffensen and Zheng2021). Lastly, we remark that under a particular setting in our framework where the benchmark is a constant (money market benchmark) considered in Example 1 and later in Section 6.2, it is shown in Gu et al. (Reference Gu, Steffensen and Zheng2021, Proposition 2.1) that the optimal solution under the risk-neutral expected loss satisfies the constraint under the physical measure
$\mathbb{P}$
. The Lagrangian analysis shall be adjusted accordingly, but it seems unclear how to retain the equivalence result with the solution to the BRBU problem (5.3) in this case. Third, as the expected loss under the risk-neutral measure provides the financial value of that loss (relative to the benchmark) corrected by a discount factor, it would be easier to communicate its interpretation to people who think about risk in terms of the value of holding or selling it, see, for example, Gu et al. (Reference Gu, Steffensen and Zheng2021). Lastly, we remark that under a particular setting in our framework where the benchmark is a constant (money market benchmark) considered in Example 1 and later in Section 6.2, it is shown in Gu et al. (Reference Gu, Steffensen and Zheng2021, Proposition 2.1) that the optimal solution under the risk-neutral expected loss satisfies the constraint under the physical measure $\mathbb{P}$
, indicating that, being more restrictive, the risk-neutral LERL would be more suitable for risk management purposes than the LERL constraint under the physical measure
$\mathbb{P}$
, indicating that, being more restrictive, the risk-neutral LERL would be more suitable for risk management purposes than the LERL constraint under the physical measure $\mathbb{P}$
.
$\mathbb{P}$
.
Before solving the above constrained optimization, it is important to note that the LERL constraint penalizes both the expected shortfall below the benchmark and the probability of being underperformance as
 \begin{equation*} \mathbb{E}\left(\xi_T(f(\xi_T)-X_T)\mathbf{1}_{X_T\leq f(\xi_T)}\right) =\mathbb{E}\left(\xi_T(f(\xi_T)-X_T)|X_T\leq f(\xi_T)\right)\mathbb{P}(X_T\leq f(\xi_T)).\end{equation*}
To solve Problem (4.1), it is crucial to set a suitable value of the loss bound $\epsilon$
which ensures that the LERL constraint is active. When the LERL constraint is not active, Problem (4.1) degenerates to a PI problem
$\epsilon$
which ensures that the LERL constraint is active. When the LERL constraint is not active, Problem (4.1) degenerates to a PI problem $\max_{{X_T\in\mathbb{X}}, X_T\geq L}\mathbb{E}\left(U(X_T)\right)$
for which case the corresponding optimal terminal wealth is denoted by
$\max_{{X_T\in\mathbb{X}}, X_T\geq L}\mathbb{E}\left(U(X_T)\right)$
for which case the corresponding optimal terminal wealth is denoted by $X_T^{PI(L)}$
. This case has been extensively considered in the literature, for instance, in Grossman and Vila (Reference Grossman and Vila1989); Basak (Reference Basak1995); Grossman and Zhou (Reference Grossman and Zhou1996); Jensen and Sørensen (Reference Jensen and Sørensen2001); Gabih et al. (Reference Gabih, Sass and Wunderlich2009); Chen et al. (Reference Chen, Nguyen and Stadje2018). In our setting, the upper bound
$X_T^{PI(L)}$
. This case has been extensively considered in the literature, for instance, in Grossman and Vila (Reference Grossman and Vila1989); Basak (Reference Basak1995); Grossman and Zhou (Reference Grossman and Zhou1996); Jensen and Sørensen (Reference Jensen and Sørensen2001); Gabih et al. (Reference Gabih, Sass and Wunderlich2009); Chen et al. (Reference Chen, Nguyen and Stadje2018). In our setting, the upper bound $\overline{\epsilon}$
of the LERL loss can be obtained by substituting
$\overline{\epsilon}$
of the LERL loss can be obtained by substituting $X_T^{PI(L)}$
into the LERL expression, that is
$X_T^{PI(L)}$
into the LERL expression, that is
 \begin{equation} \overline{\epsilon} \,:\!=\, \mathbb{E}\left(\xi_T\left(f(\xi_T)-X_T^{PI(L)}\right)\mathbf{1}_{X_T^{PI(L)} \leq f(\xi_T)}\right).\end{equation}
We note that the lower bound $ \underline{\epsilon}$
of the LERL loss can be set equal to zero. In this case, Problem (4.1) becomes
$ \underline{\epsilon}$
of the LERL loss can be set equal to zero. In this case, Problem (4.1) becomes
 \begin{equation} \max_{X_T\in\mathbb{X}, \,X_T\geq \max\{f(\xi_T),L\}}\mathbb{E}\left(U(X_T)\right),\end{equation}
which is admissible only if $x\geq \mathbb{E}(\xi_T\max\{f(\xi_T),L\})$
. Remark that this special case is more general than the setting with
$x\geq \mathbb{E}(\xi_T\max\{f(\xi_T),L\})$
. Remark that this special case is more general than the setting with $L=0$
and
$L=0$
and $f(\xi_T)=S_T$
, where
$f(\xi_T)=S_T$
, where $S_T$
follows a geometric Brownian motion, that has been solved in Teplá (Reference Teplá2001). For completeness, the optimal solution to Problem (4.3) is given in the following proposition for each of the 3 cases of benchmark summarized in Table 1 (see also the discussion on economic interpretations and mathematical conditions on this benchmark classification before Table 1).
$S_T$
follows a geometric Brownian motion, that has been solved in Teplá (Reference Teplá2001). For completeness, the optimal solution to Problem (4.3) is given in the following proposition for each of the 3 cases of benchmark summarized in Table 1 (see also the discussion on economic interpretations and mathematical conditions on this benchmark classification before Table 1).
Proposition 4.1. Assume that $x > \mathbb{E}(\xi_T\max\{f(\xi_T),L\})$
. The optimal terminal wealth of Problem (4.3) is
$x > \mathbb{E}(\xi_T\max\{f(\xi_T),L\})$
. The optimal terminal wealth of Problem (4.3) is
 \begin{equation*} X_T^H\,:\!=\,X_T^H(\lambda^H,\xi_T)= \left\{\begin{array}{l@{\quad}r} I(\lambda^H\xi_T)\mathbf{1}_{\xi_T<\underline{\xi}^H} +f(\xi_T)\mathbf{1}_{\underline{\xi}^H\leq \xi_T< \xi_L^H} +L\mathbf{1}_{\xi_T \geq \xi_L^H}, & \text{ Case (1)}\\[5pt] f(\xi_T)\mathbf{1}_{\xi_T<\underline{\xi}^H} +I(\lambda^H\xi_T)\mathbf{1}_{\underline{\xi}^H\leq \xi_T <\underline{\xi}_L^H} +L\mathbf{1}_{\xi_T\geq \underline{\xi}_L^H}, & \text{ Case (2)} \\[5pt] X_T^{PI(L)}=\max\!\left\{I(\lambda^{PI(L)}\xi_T), L\right\}, & \text{ Case (3)} \end{array}\right. \end{equation*}
where $\lambda^H>0$
and
$\lambda^H>0$
and $\lambda^{PI(L)}>0$
are calculated by solving the budget constraint with equality,
$\lambda^{PI(L)}>0$
are calculated by solving the budget constraint with equality, $\underline{\xi}^H$
and
$\underline{\xi}^H$
and $\xi_L^H$
are obtained by solving
$\xi_L^H$
are obtained by solving $f\left(\underline{\xi}^H\right)=I\left(\lambda_H\underline{\xi}^H\right)$
and
$f\left(\underline{\xi}^H\right)=I\left(\lambda_H\underline{\xi}^H\right)$
and $f\left(\xi_L^H\right)=L$
, and
$f\left(\xi_L^H\right)=L$
, and $\underline{\xi}_L^H=U^{\prime}(L)/\lambda^H$
. If
$\underline{\xi}_L^H=U^{\prime}(L)/\lambda^H$
. If $x = \mathbb{E}(\xi_T\max\{f(\xi_T),L\})$
, then the solution to Problem (4.3) is given by
$x = \mathbb{E}(\xi_T\max\{f(\xi_T),L\})$
, then the solution to Problem (4.3) is given by $\max\{f(\xi_T),L\}$
.
$\max\{f(\xi_T),L\}$
.
Proof. It is a limiting case of Theorem 4.1 as $\epsilon$
tends to 0.
$\epsilon$
tends to 0.
When $x < \mathbb{E}(\xi_T\max\{f(\xi_T),L\})$
, the lower bound of
$x < \mathbb{E}(\xi_T\max\{f(\xi_T),L\})$
, the lower bound of $\epsilon$
cannot be zero. In this case, the lower bound of
$\epsilon$
cannot be zero. In this case, the lower bound of $\epsilon$
can be obtained by solving the following risk minimization problem:
$\epsilon$
can be obtained by solving the following risk minimization problem:
 \begin{equation} \min_{X_T\in\mathbb{X}, \,X_T \geq L} \mathbb{E}\left(\xi_T(f(\xi_T)-X_T) \mathbf{1}_{X_T \leq f(\xi_T)}\right).\end{equation}
Note that the initial capital x has to be above $e^{-rT}L$
to hedge the minimum guarantee level L. The solution is summarized in the following lemma.
$e^{-rT}L$
to hedge the minimum guarantee level L. The solution is summarized in the following lemma.
Lemma 4.1. If $e^{-rT}L \leq x< \mathbb{E}(\xi_T\max\{f(\xi_T),L\})$
, then the solution to Problem (4.4) is
$e^{-rT}L \leq x< \mathbb{E}(\xi_T\max\{f(\xi_T),L\})$
, then the solution to Problem (4.4) is $\mathbb{E}(\xi_T\max\{f(\xi_T),L\})-x$
.
$\mathbb{E}(\xi_T\max\{f(\xi_T),L\})-x$
.
Proof. It is reported in Appendix A.1.
With the above discussion and Lemma 4.1, we can set the lower bound of $\epsilon$
as
$\epsilon$
as
 \begin{equation} \underline{\epsilon} \,:\!=\,\max\{0, \mathbb{E}(\xi_T\max\{f(\xi_T),L\})-x\}.\end{equation}
When the other parameters are fixed, we assume that $\underline{\epsilon}\leq\epsilon<\overline{\epsilon}$
to ensure the bindingness of the LERL constraint in Problem (4.1). Remark that the admissibility of the LERL constraint also depends on other parameters like the initial capital x and the minimum insurance level L. Now, when the other parameters are fixed in Problem (4.1), the LERL constraint is binding if
$\underline{\epsilon}\leq\epsilon<\overline{\epsilon}$
to ensure the bindingness of the LERL constraint in Problem (4.1). Remark that the admissibility of the LERL constraint also depends on other parameters like the initial capital x and the minimum insurance level L. Now, when the other parameters are fixed in Problem (4.1), the LERL constraint is binding if $x_{min}\leq x < x_{max}$
, where
$x_{min}\leq x < x_{max}$
, where $x_{min}$
and
$x_{min}$
and $x_{max}$
are defined in (A.3) and (A.2) respectively (See Appendix B for further elaborations).
$x_{max}$
are defined in (A.3) and (A.2) respectively (See Appendix B for further elaborations).
4.2. Optimal terminal wealth of Problem (4.1)
The optimal terminal wealth of Problem (4.1) for each case of benchmark classification in Table 1 is now summarized in Theorem 4.1 below, assuming that both the LERL and PI constraints are active (see Appendix B for the comprehensive study of the admissibility of Problem (4.1)). We remark that for common utility functions, the corresponding optimal strategies can be derived via the standard argument, see, for example, Chen et al. (Reference Chen, Nguyen and Stadje2018).
Theorem 4.1. Assume that both the LERL and PI constraints are active. Then, the optimal terminal wealth of Problem (4.1) is given by
 \begin{equation} X_T^{LERL-PI}= \left\{\begin{array}{l@{\quad}r} I(\lambda_1\xi_T)\mathbf{1}_{\xi_T<\underline{\xi}} +f(\xi_T)\mathbf{1}_{\underline{\xi}\leq \xi_T<\overline{\xi}} +I((\lambda_1-\lambda_2)\xi_T)\mathbf{1}_{\overline{\xi}\leq\xi_T<\overline{\xi}_L} +L\mathbf{1}_{\xi_T\geq\overline{\xi}_L}, &\text{ Case (1)}\\[5pt] I((\lambda_1-\lambda_2)\xi_T)\mathbf{1}_{\xi_T<\overline{\xi}} +f(\xi_T)\mathbf{1}_{\overline{\xi}\leq\xi_T<\underline{\xi}} +I(\lambda_1\xi_T)\mathbf{1}_{\underline{\xi}\leq\xi_T<\underline{\xi}_L} +L\mathbf{1}_{\xi_T\geq\underline{\xi}_L}, &\text{ Case (2)} \\[5pt] X_T^{PI(L)}=\max\left\{I(\lambda^{PI(L)}\xi_T), L\right\}, &\text{ Case (3)} \end{array}\right. \end{equation}
where $\lambda_1>\lambda_2>0$
are obtained by solving the budget and LERL constraints with equality simultaneously and
$\lambda_1>\lambda_2>0$
are obtained by solving the budget and LERL constraints with equality simultaneously and ${\lambda^{PI(L)}>0}$
is calculated by solving the budget constraint with equality. Here,
${\lambda^{PI(L)}>0}$
is calculated by solving the budget constraint with equality. Here, $\underline{\xi}$
and
$\underline{\xi}$
and $\overline{\xi}$
are obtained by solving
$\overline{\xi}$
are obtained by solving $I(\lambda_1\underline{\xi})=f(\underline{\xi})$
and
$I(\lambda_1\underline{\xi})=f(\underline{\xi})$
and $I((\lambda_1-\lambda_2)\overline{\xi})=f(\overline{\xi})$
respectively,
$I((\lambda_1-\lambda_2)\overline{\xi})=f(\overline{\xi})$
respectively, $\overline{\xi}_L=U^{\prime}(L)/(\lambda_1-\lambda_2)$
, and
$\overline{\xi}_L=U^{\prime}(L)/(\lambda_1-\lambda_2)$
, and $\underline{\xi}_L=U^{\prime}(L)/\lambda_1$
. In Case (3), the LERL loss bound is equal to
$\underline{\xi}_L=U^{\prime}(L)/\lambda_1$
. In Case (3), the LERL loss bound is equal to $\underline{\epsilon}$
or the LERL constraint is inactive.
$\underline{\epsilon}$
or the LERL constraint is inactive.
From the solution structure of Theorem 4.1, we can observe that both Case (1) and Case (2) share a 4-region solution form. The optimal terminal wealth follows the benchmark in the second region, but it takes the PI level L in the fourth region. Therefore, we name the former the benchmarking region and the latter the PI region. However, in the first and third regions, it may refer to the different performance of the portfolio relative to the benchmark. In particular, for the first (resp. third) region, the portfolio outperforms (resp. underperforms) the benchmark for Case (1) and underperforms (resp. outperforms) the benchmark for Case (2). The above observations are summarized in Table 2, where $\xi_L$
is the crossing point of the benchmark curve f and the PI level L,
$\xi_L$
is the crossing point of the benchmark curve f and the PI level L,
LERL-PI solution regions for Case (1) and Case (2)

According to Theorem 4.1 and Table 2, the agent in Case (1) is willing to surpass the benchmark (i.e., outperform) in good market scenarios at the cost of being below the benchmark (i.e., underperform) in bad market scenarios due to the budget constraint. On the contrary, it is observed that the agent in Case (2) wants to beat the benchmark in bad market states at the expense of being underperforming in good market states. Therefore, we name the former case as out/underperformance portfolio management (PM) and the latter as under/outperformance PM.
Remark 4.2. As shown in Theorem 4.1, the LERL-PI optimal terminal wealth is counter-monotonic to the pricing kernel $\xi_T$
, which is consistent with the existing literature on optimal portfolio with thequantile approach, see, for example, He and Zhou (Reference He and Zhou2011); Bernard et al. (Reference Bernard, Moraux, Rüschendorf and Vanduffel2015); Rüschendorf and Vanduffel (Reference Rüschendorf and Vanduffel2020). While the quantile formulation seems applicable to general portfolio choice problems with utility functions that are not necessarily concave, the resolution heavily relies on a delicate analysis of a reduced optimization problem in a subspace of real functions under monotonicity restrictions and the existence of a Lagrangian multiplier. In our setting, with a nonsmooth state-dependent LERL risk constraint, it is unclear if the quantile function, the solution to the reduced functional optimization, exists and how this critical ingredient is chosen in connection with a Lagrangian multiplier. Nevertheless, by relying on a combination of the classical Lagrangian approach and the martingale approach for complete markets (see Karatzas et al. (Reference Karatzas, Lehoczky and Shreve1987); Cox and Huang (Reference Cox and Huang1989)), we manage to fully solve the state-dependent-constrained optimization problem. We also remark that in (Rüschendorf and Vanduffel, Reference Rüschendorf and Vanduffel2020, Section 5), the authors study an optimization problem with the state-dependent constraint modeled by the copula between the terminal wealth and the benchmark payoff. In our setting, the dependence structure between the portfolio and the benchmark is implicitly described via the LERL constraint.
$\xi_T$
, which is consistent with the existing literature on optimal portfolio with thequantile approach, see, for example, He and Zhou (Reference He and Zhou2011); Bernard et al. (Reference Bernard, Moraux, Rüschendorf and Vanduffel2015); Rüschendorf and Vanduffel (Reference Rüschendorf and Vanduffel2020). While the quantile formulation seems applicable to general portfolio choice problems with utility functions that are not necessarily concave, the resolution heavily relies on a delicate analysis of a reduced optimization problem in a subspace of real functions under monotonicity restrictions and the existence of a Lagrangian multiplier. In our setting, with a nonsmooth state-dependent LERL risk constraint, it is unclear if the quantile function, the solution to the reduced functional optimization, exists and how this critical ingredient is chosen in connection with a Lagrangian multiplier. Nevertheless, by relying on a combination of the classical Lagrangian approach and the martingale approach for complete markets (see Karatzas et al. (Reference Karatzas, Lehoczky and Shreve1987); Cox and Huang (Reference Cox and Huang1989)), we manage to fully solve the state-dependent-constrained optimization problem. We also remark that in (Rüschendorf and Vanduffel, Reference Rüschendorf and Vanduffel2020, Section 5), the authors study an optimization problem with the state-dependent constraint modeled by the copula between the terminal wealth and the benchmark payoff. In our setting, the dependence structure between the portfolio and the benchmark is implicitly described via the LERL constraint.
To prove Theorem 4.1, we adopt the static martingale approach. The idea is to find the optimal terminal wealth and derive the corresponding optimal strategy thereon. For $\lambda_1>\lambda_2>0$
,
$\lambda_1>\lambda_2>0$
, $L>0$
and
$L>0$
and $\xi>0$
, we first solve the following Lagrangian maximization problem:
$\xi>0$
, we first solve the following Lagrangian maximization problem:
 \begin{equation} \max_{X\geq L}G(\lambda_1,\lambda_2,X) \,:\!=\,{\max_{X\geq L}\left(U(X)-\lambda_1\xi X-\lambda_2\xi(f(\xi)-X)\mathbf{1}_{X\leq f(\xi)}\right)}. \end{equation}
Lemma 4.2. The unique solution to problem (4.7) is given by
 \begin{equation*} X^{*}(\lambda_1,\lambda_2,\xi) =\left\{\begin{array}{l@{\quad}r} I(\lambda_1\xi)\mathbf{1}_{\xi<\underline{\xi}} +f(\xi)\mathbf{1}_{\underline{\xi}\leq \xi<\overline{\xi}} +I((\lambda_1-\lambda_2)\xi)\mathbf{1}_{\overline{\xi}\leq\xi<\overline{\xi}_L} +L\mathbf{1}_{\xi\geq\overline{\xi}_L}, & \text{ Case (1)},\\[5pt] I((\lambda_1-\lambda_2)\xi)\mathbf{1}_{\xi<\overline{\xi}} +f(\xi)\mathbf{1}_{\overline{\xi}\leq\xi<\underline{\xi}} +I(\lambda_1\xi)\mathbf{1}_{\underline{\xi}\leq\xi<\underline{\xi}_L} +L\mathbf{1}_{\xi\geq\underline{\xi}_L}, & \text{ Case (2)}{,} \end{array}\right. \end{equation*}
where $\underline{\xi}$
,
$\underline{\xi}$
, $\overline{\xi}$
,
$\overline{\xi}$
, $\overline{\xi}_L$
and
$\overline{\xi}_L$
and $\underline{\xi}_L$
are defined in Theorem 4.1. For Case (3), the unique solution to Problem (4.7) is stated in Table 3.
$\underline{\xi}_L$
are defined in Theorem 4.1. For Case (3), the unique solution to Problem (4.7) is stated in Table 3.
The unique solution to Problem (4.7) for Case (3)

Proof. It is shown in Appendix A.2.
By making use of Lemma 4.2, the optimal terminal wealth of Problem (4.1) is given by $X_T^{LERL-PI}=X^{*}(\lambda_1,\lambda_2,\xi_T)$
. To finish, we need to show the existence of the Lagrange multipliers. To this end, for each Case (i),
$X_T^{LERL-PI}=X^{*}(\lambda_1,\lambda_2,\xi_T)$
. To finish, we need to show the existence of the Lagrange multipliers. To this end, for each Case (i), $i=1,2$
, let us define two auxiliary functions:
$i=1,2$
, let us define two auxiliary functions:
 \begin{equation} H_i(\lambda_1,\lambda_2) = \mathbb{E}\left(\xi_TX_T^{LERL-PI}\right)\text{ and }K_i(\lambda_1,\lambda_2) = \mathbb{E}\left(\xi_T\left(f(\xi_T)-X_T^{LERL-PI}\right)\mathbf{1}_{X_T^{LERL-PI}\leq f(\xi_T)}\right).\end{equation}
With the aid of these auxiliary functions, the following proposition asserts the existence of the Lagrange multipliers.
Proposition 4.2. Assume that both the LERL and PI constraints are active. Then, there exists a unique solution $(\lambda_1,\lambda_2)\in \mathbf{D}$
to the system of equations
$(\lambda_1,\lambda_2)\in \mathbf{D}$
to the system of equations
 \begin{equation} \left\{\begin{array}{l@{\quad}r} H_i(\lambda_1,\lambda_2)=x,&\\[4pt] K_i(\lambda_1,\lambda_2)=\epsilon,& \end{array}\right. \end{equation}
for each Case (i), $i=1,2$
. The domain
$i=1,2$
. The domain $\mathbf{D}$
is defined as
$\mathbf{D}$
is defined as
 \begin{equation} \mathbf{D} =\left\{(\lambda_1,\lambda_2)\in(0,+\infty)\times(0,+\infty)\,:\, \lambda_1\in[\lambda^{PI(L)},\overline{\lambda}_1),\ \lambda_2\in[0,\lambda_1{)}\right\}, \end{equation}
where
 \begin{equation*} \overline{\lambda}_1= \left\{\begin{array}{l@{\quad}r} \lambda^H, &\text{if }\mathbb{E}(\xi_T\max\{f(\xi_T),L\})< x,\\[4pt] +\infty, &\text{if } \mathbb{E}(\xi_T\max\{f(\xi_T),L\})\geq x\text{ and Case (1)},\\[4pt] \lambda_a, &\text{if } \mathbb{E}(\xi_T\max\{f(\xi_T),L\})\geq x\text{ and Case (2)}.\\ \end{array}\right. \end{equation*}
The multiplier $\lambda^H$
is defined in Proposition 4.1, and
$\lambda^H$
is defined in Proposition 4.1, and $\lambda_a$
is defined as a limit of
$\lambda_a$
is defined as a limit of $\lambda_1$
such that
$\lambda_1$
such that $\lim_{\lambda_1\rightarrow\lambda_a}\underline{\xi}=\underline{\xi}_L=\xi_L$
.
$\lim_{\lambda_1\rightarrow\lambda_a}\underline{\xi}=\underline{\xi}_L=\xi_L$
.
Proof. It is depicted in Appendix A.3.
With the above preparation, we can now complete the proof of Theorem 4.1.
Proof [Proof of Theorem 4.1]. By Assumptions 2,4 and the following observation
 \begin{equation*} U\left(X_T^{LERL-PI}\right)\leq U(f(\xi_T))+U(L)+U\left(I\left(\left(\lambda_1-\lambda_2\right)\xi_T\right)\right), \end{equation*}
we have $ \mathbb{E}(U\left(X_T^{LERL-PI}\right))<+\infty$
. Let
$ \mathbb{E}(U\left(X_T^{LERL-PI}\right))<+\infty$
. Let $X_T$
be any admissible terminal wealth of Problem (4.1), we obtain
$X_T$
be any admissible terminal wealth of Problem (4.1), we obtain
 \begin{align*} \mathbb{E}(U(X_T)) & \leq \mathbb{E}\left(U(X_T)+\lambda_1(x-\xi_TX_T)+\lambda_2\left(\epsilon-\xi_T(f(\xi_T)-X_T)\mathbf{1}_{X_T\leq f(\xi_T)}\right)\right)\\ & \leq \mathbb{E}\left(\sup_{X_T\geq L}\left(U(X_T)-\lambda_1\xi_TX_T-\lambda_2\xi_T(f(\xi_T)-X_T)\mathbf{1}_{X_T\leq f(\xi_T)}\right)\right)+x\lambda_1+\epsilon\lambda_2\\ & = \mathbb{E}\left(U\left(X_T^{LERL-PI}\right)\right)+\lambda_1\left(x- \mathbb{E}\left(\xi_TX_T^{LERL-PI}\right)\right)\\ & \quad +\lambda_2\left(\epsilon- \mathbb{E}\left(\xi_T\left(f(\xi_T)-{X_T^{LERL-PI}}\right)\mathbf{1}_{X_T^{LERL-PI}\leq f(\xi_T)}\right)\right)\\ & = \mathbb{E}\left(U\left(X_T^{LERL-PI}\right)\right), \end{align*}
where the first inequality follows from the budget and LERL constraints, the first equality follows from Lemma 4.2, and the last equality follows from the bindingness of both constraints:
 \begin{equation} \mathbb{E}\left(\xi_TX_T^{LERL-PI}\right)=x\quad\text{and}\quad \mathbb{E}\left(\xi_T\left(f(\xi_T)-X_T^{LERL-PI}\right)\mathbf{1}_{X_T^{LERL-PI}\leq f(\xi_T)}\right)=\epsilon. \end{equation}
In the expression of $X_T^{LERL-PI}$
, the Lagrangian multipliers
$X_T^{LERL-PI}$
, the Lagrangian multipliers $(\lambda_1, \lambda_2)$
can be obtained by solving (4.11). The existence is proved in Proposition 4.2. Hence,
$(\lambda_1, \lambda_2)$
can be obtained by solving (4.11). The existence is proved in Proposition 4.2. Hence, $X_T^{LERL-PI}$
is optimal. To finish, we remark that in Case (3), either the LERL constraint is inactive or its loss bound is equal to
$X_T^{LERL-PI}$
is optimal. To finish, we remark that in Case (3), either the LERL constraint is inactive or its loss bound is equal to $\underline{\epsilon}$
. The former corresponds to cases (3a) and (3b) in Lemma 4.2, whose LERL loss is obviously equal to 0. The latter corresponds to the case (3c) in Lemma 4.2, and its LERL loss can be computed by substituting
$\underline{\epsilon}$
. The former corresponds to cases (3a) and (3b) in Lemma 4.2, whose LERL loss is obviously equal to 0. The latter corresponds to the case (3c) in Lemma 4.2, and its LERL loss can be computed by substituting $X_T^{PI(L)}$
into (4.11).
$X_T^{PI(L)}$
into (4.11).
5. Benchmark-reference-based utility maximization
In this section, we study the following benchmark-reference-based utility (BRBU) maximization problem:
 \begin{equation} \max_{X_T\in\mathbb{X}, X_T\geq L}\mathbb{E}\left(\tilde{U}(X_T)\right),\end{equation}
where
 \begin{equation} \tilde{U}(y) =\kappa(U(y)-U(f(\xi_T))\mathbf{1}_{y> f(\xi_T)} -\eta(U(f(\xi_T))-U(y))\mathbf{1}_{y\leq f(\xi_T)},\end{equation}
and $\eta\geq\kappa>0$
. Compared with the usual utility function U, the benchmark-reference-based utility
$\eta\geq\kappa>0$
. Compared with the usual utility function U, the benchmark-reference-based utility $\tilde{U}$
includes two components that measure the gain or loss in terms of utility if the portfolio deviates from the benchmark. These components depict the outperformance and underperformance effects controlled by the parameters
$\tilde{U}$
includes two components that measure the gain or loss in terms of utility if the portfolio deviates from the benchmark. These components depict the outperformance and underperformance effects controlled by the parameters $\kappa$
and
$\kappa$
and $\eta$
respectively. If
$\eta$
respectively. If $\kappa=\eta$
, then Problem (5.1) becomes
$\kappa=\eta$
, then Problem (5.1) becomes
 \begin{equation*} \max_{X_T\in\mathbb{X}, X_T\geq L}\mathbb{E}\left(\tilde{U}(X_T)\right)=\kappa\max_{X_T\in\mathbb{X}, X_T\geq L}\mathbb{E}(U(X_T)-U(f(\xi_T)),\end{equation*}
which is equivalent to the PI case. The rationale behind the condition $\eta\geq\kappa>0$
is that the agent has loss aversion in benchmarking behavior.
$\eta\geq\kappa>0$
is that the agent has loss aversion in benchmarking behavior.
We remark that loss aversion and reference-dependent preferences originated in Kahneman and Tversky (Reference Kahneman and Tversky1979). Further discussions can be found, for example, in Köbberling and Wakker (Reference Köbberling and Wakker2005); Köszegi and Rabin (Reference Köszegi and Rabin2006, Reference Köszegi and Rabin2009). A connection between loss aversion and reference-dependent preferences under an intertemporal choice model can be found in Park (Reference Park2016). Our benchmark-reference-based utility is motivated by the gain-loss utility component in the reference-based utility literature. A similar idea has been considered in Chen and Nguyen (Reference Chen and Nguyen2020), wherein the risk management problem under a weighted limited expected loss constraint is linked to an optimal asset allocation problem with an exogenous multiple-reference-based preference. Compared to Chen and Nguyen (Reference Chen and Nguyen2020), our benchmark-reference-based utility (5.2) allows for endogenous benchmarks, which are market-state-dependent. In addition, in contrast to Chen and Nguyen (Reference Chen and Nguyen2020), it does not include the part measuring the satisfaction of the terminal wealth $U(X_T)$
in (5.2). This adjustment enables us not only to characterize the outperformance and the underperformance relative to the benchmark in terms of the Lagrange multipliers but also to develop a utility-based performance ratio thereon. We also note that our setting can be extended to the case with a weighted LERL constraint with different random benchmarks.
$U(X_T)$
in (5.2). This adjustment enables us not only to characterize the outperformance and the underperformance relative to the benchmark in terms of the Lagrange multipliers but also to develop a utility-based performance ratio thereon. We also note that our setting can be extended to the case with a weighted LERL constraint with different random benchmarks.
Our first attempt is to connect Problem (5.1) and Problem (4.1) so that a quantitative linkage among benchmarking, loss aversion, and reference-dependent preferences can be established. To this end, we first solve Problem (5.1) in the following theorem, where the three different benchmark cases are the same as the one depicted in Table 1.
Theorem 5.1. The optimal terminal wealth $X_T^{BRBU}$
of Problem (5.1) is given by
$X_T^{BRBU}$
of Problem (5.1) is given by
 \begin{align} \begin{split} X_T^{BRBU} =&\left\{\begin{array}{l@{\quad}r} I\left(\frac{z}{\kappa}\xi_T\right)\mathbf{1}_{\xi_T<\xi^{\kappa}} +f(\xi_T)\mathbf{1}_{\xi^{\kappa}\leq \xi_T<\xi^{\eta}} +I\left(\frac{z}{\eta}\xi_T\right)\mathbf{1}_{\xi^{\eta}\leq\xi_T<\xi^{\eta}_L} +L\mathbf{1}_{\xi_T\geq\xi^{\eta}_L}, &\text{ Case (1)}\\[6pt] I\left(\frac{z}{\eta}\xi_T\right)\mathbf{1}_{\xi_T<\xi^{\eta}} +f(\xi_T)\mathbf{1}_{\xi^{\eta}\leq \xi_T<\xi^{\kappa}} +I\left(\frac{z}{\kappa}\xi_T\right)\mathbf{1}_{\xi^{\kappa}\leq\xi_T<\xi^{\kappa}_L} +L\mathbf{1}_{\xi_T\geq\xi^{\kappa}_L}, &\text{ Case (2)} \\[6pt] X_T^{PI(L)}=\max\left\{I(\lambda^{PI(L)}\xi_T), L\right\}, &\text{ Case (3)} \end{array}\right. \end{split} \end{align}
where ${z>0}$
and
${z>0}$
and ${\lambda^{PI(L)}>0}$
are calculated such that the corresponding budget constraint holds,
${\lambda^{PI(L)}>0}$
are calculated such that the corresponding budget constraint holds, $\xi^{\kappa}$
and
$\xi^{\kappa}$
and $\xi^{\eta}$
are obtained by solving
$\xi^{\eta}$
are obtained by solving $I\left(\frac{z}{\kappa}\xi^{\kappa}\right)=f(\xi^{\kappa})$
and
$I\left(\frac{z}{\kappa}\xi^{\kappa}\right)=f(\xi^{\kappa})$
and $I\left(\frac{z}{\eta}\xi^{\eta}\right)=f(\xi^{\eta}),$
respectively,
$I\left(\frac{z}{\eta}\xi^{\eta}\right)=f(\xi^{\eta}),$
respectively, $\xi^{\eta}_L=\eta U^{\prime}(L)/z$
, and
$\xi^{\eta}_L=\eta U^{\prime}(L)/z$
, and $\xi^{\kappa}_L=\kappa U^{\prime}(L)/z$
.
$\xi^{\kappa}_L=\kappa U^{\prime}(L)/z$
.
Proof. It is depicted in Appendix A.5.
We observe that Theorems 4.1 and 5.1 share a similar solution structure. If we set the same initial capital x, the same benchmark $f(\xi_T)$
, and the same portfolio insurance level L in both Problem (4.1) and Problem (5.1), a natural question is to ask if we can achieve an equivalence between them. The answer is partially positive. Indeed, setting
$f(\xi_T)$
, and the same portfolio insurance level L in both Problem (4.1) and Problem (5.1), a natural question is to ask if we can achieve an equivalence between them. The answer is partially positive. Indeed, setting
 \begin{equation} \lambda_1=\frac{z}{\kappa} \quad\text{and}\quad \lambda_1-\lambda_2=\frac{z}{\eta},\end{equation}
then, their solutions (5.3) and (4.6) can be matched. It means that we can replicate $X_T^{LERL-PI}$
from (4.6) by a given
$X_T^{LERL-PI}$
from (4.6) by a given $X_T^{BRBU}$
from (5.3). In this case, the corresponding LERL loss bound
$X_T^{BRBU}$
from (5.3). In this case, the corresponding LERL loss bound $\epsilon^{*}$
is needed and calculated as follows:
$\epsilon^{*}$
is needed and calculated as follows:
 \begin{equation} \epsilon^{*} =\mathbb{E}\left(\xi_T\left(f(\xi_T)-X_T^{BRBU}\right)\mathbf{1}_{X_T^{BRBU}\leq f(\xi_T)}\right).\end{equation}
However, the situation is different if we want to replicate $X_T^{BRBU}$
by a given
$X_T^{BRBU}$
by a given $X_T^{LERL-PI}$
. Note that if
$X_T^{LERL-PI}$
. Note that if $(z,\kappa,\eta)$
satisfies (5.4), so does the triple
$(z,\kappa,\eta)$
satisfies (5.4), so does the triple $(cz,c\kappa,c\eta)$
for any
$(cz,c\kappa,c\eta)$
for any $c>0$
. Based on this discussion, we can develop a partial equivalence result summarized in the following proposition.
$c>0$
. Based on this discussion, we can develop a partial equivalence result summarized in the following proposition.
Proposition 5.1. Assume that both the LERL and PI constraints are binding. Then, the optimal terminal wealth of Problem (4.1) stated in (4.6) can be replicated by the optimal terminal wealth of Problem (5.1) stated in (5.3) by setting
 \begin{equation*} \lambda_1=\frac{z}{\kappa} \quad\text{and}\quad \lambda_2=\frac{z(\eta-\kappa)}{\kappa\eta}, \end{equation*}
given that both problems share the same initial capital x, the same benchmark $f(\xi_T)$
, and the same portfolio insurance level L.
$f(\xi_T)$
, and the same portfolio insurance level L.
Proof. It is directly followed by matching (4.6) and (5.3) and calculation of corresponding LERL loss bound by (5.5).
We call $\kappa/\eta$
the benchmark-reference-based utility (BRBU) performance ratio as it indicates how the LERL-PI agent evaluates her portfolio outperformance proportion over her underperformance proportion relative to the benchmark. Although it seems hard to calculate the corresponding
$\kappa/\eta$
the benchmark-reference-based utility (BRBU) performance ratio as it indicates how the LERL-PI agent evaluates her portfolio outperformance proportion over her underperformance proportion relative to the benchmark. Although it seems hard to calculate the corresponding $\kappa$
and
$\kappa$
and $\eta$
directly from a given
$\eta$
directly from a given $X_T^{LERL-PI}$
, its ratio can be obtained easily by using the multipliers of the LERL-PI problem as follows:
$X_T^{LERL-PI}$
, its ratio can be obtained easily by using the multipliers of the LERL-PI problem as follows:
 \begin{equation} \frac{\kappa}{\eta}=\frac{\lambda_1-\lambda_2}{\lambda_1}.\end{equation}
Unlike the Omega ratio (see (6.1)) which only captures the actual relative performance, the BRBU ratio quantifies the relative utility gain/loss to the benchmark (i.e., loss aversion). In the next section, we will numerically compare the BRBU ratio with Omega performance ratio for different types of benchmark.
6. Numerical examples
In this section, we numerically illustrate our results and demonstrate various sensitivity properties proved in Appendix A.2 in a one-dimension Black-Scholes market (see Section 3.2) with a power utility $U(y)=\frac{y^{1-\gamma}}{1-\gamma}$
, where
$U(y)=\frac{y^{1-\gamma}}{1-\gamma}$
, where $\gamma\neq 1$
and
$\gamma\neq 1$
and $\gamma >0$
. The inverse of the first derivative U’ is then given by
$\gamma >0$
. The inverse of the first derivative U’ is then given by $I(y)=y^{-\frac{1}{\gamma}}$
. In the sequel, unless specified otherwise, the model parameters for numerical analysis are fixed in Table 4.
$I(y)=y^{-\frac{1}{\gamma}}$
. In the sequel, unless specified otherwise, the model parameters for numerical analysis are fixed in Table 4.
Parameter values in numerical examples

6.1. Portfolio performance with benchmark
A performance measurement for a risky portfolio typically means a score attached to the portfolio. The goal of any investor who uses a particular performance measure is to select the portfolio for which this measure is the greatest. The literature on portfolio performance evaluation is vast, starting with the Sharpe ratio (see Sharpe (Reference Sharpe1966)). Alternative performance measures are reward-to-risk ratios representing a fraction where a measure of reward is divided by a measure of risk. Examples of such reward-to-risk ratios include the Sortino ratio (see, e.g., Sortino and Price (Reference Sortino and Price1994); Sortino et al. (Reference Sortino, Van Der Meer and Plantinga1999)) and the Omega ratio (see, e.g., Keating and Shadwick (Reference Keating and Shadwick2002)). For further expositions, we refer to Caporin et al. (Reference Caporin, Jannin, Lisi and Maillet2014).
In our framework, we adopt the Omega ratio of the portfolio $X_T$
with respect to the benchmark
$X_T$
with respect to the benchmark $Y_T$
defined by
$Y_T$
defined by
 \begin{equation} \Omega_{{Y_T}}\left(X_T\right) \,:\!=\,\frac{\mathbb{E}\left(\max\{X_T-{Y_T},0\}\right)} {\mathbb{E}\left(\max\{Y_T-X_T,0\}\right)},\end{equation}
which quantifies the expected outperformance over the expected underperformance of a portfolio $X_T$
with respect to the benchmark
$X_T$
with respect to the benchmark ${Y_T}$
at maturity. We remark that the Omega ratio is also known as a gain-loss ratio, see, for example, Bernardo and Ledoit (Reference Bernardo and Ledoit2000); Cochrane and Saa-Requejo (Reference Cochrane and Saa-Requejo2000); Cherny and Madan (Reference Cherny and Madan2009). Furthermore, it is well-documented that the Omega ratio is deemed a better portfolio performance measurement than the Sharpe ratio and the Sortino ratio as its calculation captures the whole portfolio distribution (see also Bernard et al. (Reference Bernard, Vanduffel and Ye2019); Lin et al. (Reference Lin, Saunders and Weng2019); Guan et al. (Reference Guan and Liang2021) for related elaborations).
${Y_T}$
at maturity. We remark that the Omega ratio is also known as a gain-loss ratio, see, for example, Bernardo and Ledoit (Reference Bernardo and Ledoit2000); Cochrane and Saa-Requejo (Reference Cochrane and Saa-Requejo2000); Cherny and Madan (Reference Cherny and Madan2009). Furthermore, it is well-documented that the Omega ratio is deemed a better portfolio performance measurement than the Sharpe ratio and the Sortino ratio as its calculation captures the whole portfolio distribution (see also Bernard et al. (Reference Bernard, Vanduffel and Ye2019); Lin et al. (Reference Lin, Saunders and Weng2019); Guan et al. (Reference Guan and Liang2021) for related elaborations).
For our expected utility maximization under a joint LERL-PI framework, it is reasonable to look at the following portfolio performance measurement, which we call the “utility-transformed” Omega ratio,
 \begin{equation} U\Omega_{{Y_T}}\left(X_T\right) \,:\!=\,\Omega_{U(Y_T)}\left(U(X_T)\right) =\frac{\mathbb{E}\left((U(X_T)-U({Y_T}))\mathbf{1}_{X_T>{Y_T}}\right)} {\mathbb{E}\left((U({Y_T})-U(X_T))\mathbf{1}_{X_T<{Y_T}}\right)}.\end{equation}
Observe that $U\Omega_{{Y_T}}$
is the Omega ratio of the utility of the portfolio
$U\Omega_{{Y_T}}$
is the Omega ratio of the utility of the portfolio $U(X_T)$
with respect to the utility of the benchmark
$U(X_T)$
with respect to the utility of the benchmark $U(Y_T)$
, and it quantifies utility gain over utility loss of the portfolio performance relative to the benchmark
$U(Y_T)$
, and it quantifies utility gain over utility loss of the portfolio performance relative to the benchmark ${Y_T}$
. Compared to the Omega ratio
${Y_T}$
. Compared to the Omega ratio $\Omega_{{Y_T}}$
, the utility-transformed ratio
$\Omega_{{Y_T}}$
, the utility-transformed ratio $U\Omega_{{Y_T}}$
aims at measuring the relative utility performance to the benchmark. Below, these measurements are numerically compared with the new BRBU performance ratio
$U\Omega_{{Y_T}}$
aims at measuring the relative utility performance to the benchmark. Below, these measurements are numerically compared with the new BRBU performance ratio $\kappa/\eta$
defined by (5.6). It turns out that the BRBU ratio is aligned with the certainty equivalent defined by
$\kappa/\eta$
defined by (5.6). It turns out that the BRBU ratio is aligned with the certainty equivalent defined by
 \begin{equation*} CE\,:\!=\,U^{-1}\left(\mathbb{E}\left(U\left(X_T^{LERL-PI}\right)\right)\right),\end{equation*}
a certain terminal wealth level that generates the same expected utility. As shown below, while the Omega ratio and the utility-transformed Omega ratio do not vary consistently with the CE, the utility gain-loss ratio of the BRBU problem which positively moves with the CE in all the cases of benchmark.
Remark 6.1. As mentioned above, a performance measurement for a risky portfolio typically means a score attached to the portfolio, and the goal of any investor who uses a particular performance measure is to select the portfolio for which this measure is the greatest. Such a performance measure should incorporate the agent’s preference and risk profiles modeled by a utility function. In the utility-based approach, an investor equipped with a particular utility function computes a performance measure related to the expected utility level provided by a risky portfolio. Intuitively, the higher the performance measure of a portfolio is, the higher the level of expected utility the portfolio provides. We remark that using the level of expected utility, which can be seen by computing the certainty equivalent, as a basic indicator is aligned with the so-calledmaximum principle stated in (Pedersen and Satchell, Reference Pedersen and Satchell2002, Proposition 1).
Remark 6.2. Note that because the agent in our setting has to satisfy a benchmark-dependent loss constraint, her portfolio performance with respect to a benchmark is hardly determined. Following the portfolio performance literature, we numerically study various widely used performance indicators, such as the Omega ratio and the utility-transformed Omega ratio, but at the same time look at the CE when discussing about these ratios. As mentioned above, a “good” performance measure should capture the basic indicator CE in a reasonable way; in particular, it should be positively aligned with the CE.
We conclude this subsection by commenting on related literature on performance measurement. Rational performance measures can be constructed in an axiomatization framework (see, e.g., De Giorgi (Reference De Giorgi2005); Cherny and Madan (Reference Cherny and Madan2009)) or in a utility-based approach (see, e.g., Pedersen and Satchell (Reference Pedersen and Satchell2002); Zakamouline and Koekebakker (Reference Zakamouline and Koekebakker2009a,Reference Zakamouline and Koekebakkerb)). In Zakamouline (Reference Zakamouline2014), the author demonstrates that loss aversion plays a vital role in performance measurement. Performance measurement in a portfolio insurance context is also studied in Bertrand and Prigent (Reference Bertrand and Prigent2011); Ameur and Prigent (Reference Ameur and Prigent2018).
6.2. Money benchmark
In this subsection, we set the benchmark as a positive constant $\overline{x}$
(interpreted as a money market benchmark). Note that the condition
$\overline{x}$
(interpreted as a money market benchmark). Note that the condition $\overline{x}>L$
is needed; otherwise, the LEL constraint is not active. As discussed in Example 1, this constant benchmark satisfies Assumption 3 and corresponds to Case (1), that is, out/underperformance PM. Problem (4.1) now becomes an expected utility maximization problem under a joint LEL and PI constraint, named LEL-PI problem. We set the constant benchmark
$\overline{x}>L$
is needed; otherwise, the LEL constraint is not active. As discussed in Example 1, this constant benchmark satisfies Assumption 3 and corresponds to Case (1), that is, out/underperformance PM. Problem (4.1) now becomes an expected utility maximization problem under a joint LEL and PI constraint, named LEL-PI problem. We set the constant benchmark $\overline{x}=100e^{rT}$
, unless specified otherwise. We remark that if the PI level L is set to zero, the LEL-PI problem becomes a limited expected loss (LEL) risk management which has been studied in Basak and Shapiro (Reference Basak and Shapiro2001). We start with a numerical demonstration for the properties of the LEL-PI solution stated in Lemmas A.4–A.9 and Remark A.1. In particular, Figure 2a shows that while keeping the outperformance region and the benchmarking region unchanged, the PI constraint only influences the underperformance region, which demonstrates the discussion in Remark A.1. In addition, Figure 2b demonstrates that the initial capital x has no impact on the underperformance region. When additional capital is provided, the outperformance region enlarges with a shrinking benchmarking region, which aligns with the results from Lemma A.4. Economically, when the LERL loss bound
$\overline{x}=100e^{rT}$
, unless specified otherwise. We remark that if the PI level L is set to zero, the LEL-PI problem becomes a limited expected loss (LEL) risk management which has been studied in Basak and Shapiro (Reference Basak and Shapiro2001). We start with a numerical demonstration for the properties of the LEL-PI solution stated in Lemmas A.4–A.9 and Remark A.1. In particular, Figure 2a shows that while keeping the outperformance region and the benchmarking region unchanged, the PI constraint only influences the underperformance region, which demonstrates the discussion in Remark A.1. In addition, Figure 2b demonstrates that the initial capital x has no impact on the underperformance region. When additional capital is provided, the outperformance region enlarges with a shrinking benchmarking region, which aligns with the results from Lemma A.4. Economically, when the LERL loss bound $\epsilon$
is fixed (so is the underperformance), the risk manager in Case (1) would devote the additional capital to improve the portfolio performance in good states so as to maximize her utility.
$\epsilon$
is fixed (so is the underperformance), the risk manager in Case (1) would devote the additional capital to improve the portfolio performance in good states so as to maximize her utility.
Impact of $\overline{x}$
on the certainty equivalent and the portfolio performance ratios
$\overline{x}$
on the certainty equivalent and the portfolio performance ratios

Impact of the PI level L, the initial capital level x, the LEL loss bound $\epsilon$
, and the constant benchmark level
$\epsilon$
, and the constant benchmark level $\overline{x}$
on the optimal terminal wealth for the LEL-PI model in out/underperformance PM.
$\overline{x}$
on the optimal terminal wealth for the LEL-PI model in out/underperformance PM.

The impact of the loss bound $\epsilon$
is shown in Figure 2c. It can be observed that the benchmarking region shrinks for a larger loss bound. Specifically, when
$\epsilon$
is shown in Figure 2c. It can be observed that the benchmarking region shrinks for a larger loss bound. Specifically, when $\epsilon\geq\overline{\epsilon}=22.8091$
(see (4.2)), the LEL constraint is no longer binding, and the problem turns into a PI problem with minimum capital level L. Moreover,
$\epsilon\geq\overline{\epsilon}=22.8091$
(see (4.2)), the LEL constraint is no longer binding, and the problem turns into a PI problem with minimum capital level L. Moreover, $\epsilon=0$
means that the agent has no tolerance for the underperformance relative to
$\epsilon=0$
means that the agent has no tolerance for the underperformance relative to $\overline{x}$
, which corresponds to the PI problem with minimum capital level
$\overline{x}$
, which corresponds to the PI problem with minimum capital level $\overline{x}$
.
$\overline{x}$
.
In Figure 2d, the impact of constant benchmark $\overline{x}$
on the optimal terminal wealth
$\overline{x}$
on the optimal terminal wealth $X_T^{LEL-PI}$
is numerically depicted. Notably, the larger
$X_T^{LEL-PI}$
is numerically depicted. Notably, the larger $\overline{x}$
, the larger the benchmarking region, but the smaller the outperformance and underperformance regions. Interestingly, as observed from Table 5, all the performance ratios decrease with the benchmark level
$\overline{x}$
, the larger the benchmarking region, but the smaller the outperformance and underperformance regions. Interestingly, as observed from Table 5, all the performance ratios decrease with the benchmark level $\overline{x}$
, hand in hand with a lower certainty equivalent. This means that setting a higher benchmark level (e.g., higher guaranteed payment requirement or higher standard) would induce the agent to have a higher loss aversion, hence suffering a more significant utility loss from underperformance. Consequently, her optimal strategy is to enlarge the benchmarking region as much as possible. Due to the budget restriction, this will reduce the trade-off between the outperformance and the underperformance. In addition, due to the LERL constraint, adjusting the deterministic benchmark would mainly influence the outperformance region, indicating that a LERL-PI-RM with a higher benchmark (i.e., the agent is bearing a greater loss aversion relative to the benchmark) leads to smaller values for all the performance ratios.
$\overline{x}$
, hand in hand with a lower certainty equivalent. This means that setting a higher benchmark level (e.g., higher guaranteed payment requirement or higher standard) would induce the agent to have a higher loss aversion, hence suffering a more significant utility loss from underperformance. Consequently, her optimal strategy is to enlarge the benchmarking region as much as possible. Due to the budget restriction, this will reduce the trade-off between the outperformance and the underperformance. In addition, due to the LERL constraint, adjusting the deterministic benchmark would mainly influence the outperformance region, indicating that a LERL-PI-RM with a higher benchmark (i.e., the agent is bearing a greater loss aversion relative to the benchmark) leads to smaller values for all the performance ratios.
The above sensitivity analysis suggests that all the performance ratios depict the portfolio performance quite well for the money benchmark case. Note that when $\overline{x}$
increases to
$\overline{x}$
increases to $104.86$
, the initial capital x is no longer enough to hedge such a high level of
$104.86$
, the initial capital x is no longer enough to hedge such a high level of $\overline{x}$
(see Lemma A.6). In this case, all the ratios tend to zero since
$\overline{x}$
(see Lemma A.6). In this case, all the ratios tend to zero since $\lambda_1=+\infty$
and
$\lambda_1=+\infty$
and $\underline{\xi}=0$
, according to Lemma A.7. We also remark that with a smaller constant benchmark value
$\underline{\xi}=0$
, according to Lemma A.7. We also remark that with a smaller constant benchmark value $\overline{x}$
, it is easier for the agent to achieve a higher relative performance to the benchmark, hence implying a greater expected utility level. However, due to various considerations like solvency requirements and risk management perspectives, the benchmark
$\overline{x}$
, it is easier for the agent to achieve a higher relative performance to the benchmark, hence implying a greater expected utility level. However, due to various considerations like solvency requirements and risk management perspectives, the benchmark $\overline{x}$
might be set above a certain value.
$\overline{x}$
might be set above a certain value.
Below we will see that for various random benchmarks, while the Omega ratio (as well as the utility-transformed Omega ratio) may no longer well capture the portfolio performance, the BRBU ratio $\kappa/\eta$
still does quite well, however.
$\kappa/\eta$
still does quite well, however.
6.3. Stock market benchmark
This subsection presents a numerical analysis of the stock benchmark for under/outperformance PM, that is, Case (2). It can be observed from Figure 3b that in contrast to the case with money benchmark, an adjustment of initial capital x has no influence on the underperformance region but on the benchmarking and outperformance regions, substantiating again the result reported in Lemma A.4. It economically implies that the agent using a benchmark that asymptotically dominates the unconstrained Merton curve in good market scenarios (i.e., under/outperformance) is more concerned about the outperformance region and would use any additional capital to improve the portfolio performance in the relatively unfavorable states. From Figure 3a, in contrast to the money benchmark case (out/underperformance), adjusting the PI level L does not change the underperformance region but only influences the outperformance region (see a mathematical justification in Lemma A.8).
Impact of the initial capital x, the PI level L, and the LERL loss bound $\epsilon$
on the optimal terminal wealth for under/outperformance PM with stock market benchmarks.
$\epsilon$
on the optimal terminal wealth for under/outperformance PM with stock market benchmarks.

Figure 3c depicts the impact of the loss bound $\epsilon$
on the optimal terminal portfolio. Compared with the initial capital and the PI level, the upper bound of relative expected loss
$\epsilon$
on the optimal terminal portfolio. Compared with the initial capital and the PI level, the upper bound of relative expected loss $\epsilon$
has a notable impact on all regions of market states. As the loss bound
$\epsilon$
has a notable impact on all regions of market states. As the loss bound $\epsilon$
directly affects the underperformance region (loss region) via the LERL constraint, there is a trade-off between the loss region and the other regions due to the budget constraint. In addition, the higher (resp. lower) the LERL loss bound
$\epsilon$
directly affects the underperformance region (loss region) via the LERL constraint, there is a trade-off between the loss region and the other regions due to the budget constraint. In addition, the higher (resp. lower) the LERL loss bound $\epsilon$
, the lower the optimal terminal wealth in the underperformance (resp. outperformance) region.
$\epsilon$
, the lower the optimal terminal wealth in the underperformance (resp. outperformance) region.
As indicated in Table 6, the higher the present value $S_0$
of the stock benchmark, the lower the certainty equivalent and the performance ratios. Indeed, for the under/outperformance benchmark portfolio management, the outperformance (resp. underperformance) region corresponds to bad (resp. good) market states. Therefore, in this case, a higher initial benchmark value will induce the agent to have a higher loss aversion. According to Figure 3d, the agent chooses to enlarge the benchmarking region to take care of this concern, similar to the situation in which she faces a higher
$S_0$
of the stock benchmark, the lower the certainty equivalent and the performance ratios. Indeed, for the under/outperformance benchmark portfolio management, the outperformance (resp. underperformance) region corresponds to bad (resp. good) market states. Therefore, in this case, a higher initial benchmark value will induce the agent to have a higher loss aversion. According to Figure 3d, the agent chooses to enlarge the benchmarking region to take care of this concern, similar to the situation in which she faces a higher $\overline{x}$
in the money benchmark case (see Figure 2d). At the same time, both the underperformance and outperformance regions diminish. As a result, a smaller outperformance region causes a decrease in expected utility. As seen above, all performance ratios capture well the portfolio performance in this situation.
$\overline{x}$
in the money benchmark case (see Figure 2d). At the same time, both the underperformance and outperformance regions diminish. As a result, a smaller outperformance region causes a decrease in expected utility. As seen above, all performance ratios capture well the portfolio performance in this situation.
Impact of $S_0$
on the certainty equivalent and the portfolio performance ratios
$S_0$
on the certainty equivalent and the portfolio performance ratios

Comparison of different optimal strategies

To further investigate the LERL-PI agent’s investment behavior, we plot the optimal strategies for both money market and stock market benchmarks in Figure 4 and compare them with the unconstrained (Merton) optimal strategy. As shown in Figure 4a, compared to the LEL strategy, the LEL-PI strategy is more conservative in the very bad market states due to the additional PI constraint. As pointed out in (Basak and Shapiro, Reference Basak and Shapiro2001, Proposition 5 (ii)), the LEL strategy is bounded from above by the Merton strategy, which also applies to the LEL-PI strategy.
In Figure 4b, we compare the LERL-PI, LERL, and Merton optimal strategies for the stock market benchmark. It is observed that with an extra PI constraint, the LERL-PI strategy falls to zero in the very bad market states. On the contrary, without a PI constraint, the LERL strategy is bounded below by the Merton strategy and asymptotically converges to the Merton ratio when the market state worsens. Aligned with what is observed in Figure 3, the agent is more concerned about the underperformance relative to the benchmark (i.e., good market states).
In the remaining subsections, we take a deeper look at the LERL-PI solution for hybrid, mixed, and CPPI benchmarks.
6.4. Hybrid benchmark
In this subsection, we study the impact of hybrid benchmarks with respect to the riskless investment proportion $\alpha$
. As mentioned in Example 3, out/underperformance (i.e., Case (1)) or under/outperformance (i.e., Case (2)) PM can happen depending on whether
$\alpha$
. As mentioned in Example 3, out/underperformance (i.e., Case (1)) or under/outperformance (i.e., Case (2)) PM can happen depending on whether $\frac{\sigma}{\theta}(1-\alpha)$
is greater or smaller than
$\frac{\sigma}{\theta}(1-\alpha)$
is greater or smaller than $\frac{1}{\gamma}$
.
$\frac{1}{\gamma}$
.
The result for out/underperformance (resp. under/outperformance) PM is presented in Table 7 (resp. Table 8). We can observe that for out/underperformance PM, the higher the riskless investment proportion $\alpha$
, the lower the certainty equivalent. In addition, we can also observe from Figure 5a and Table 7 that a lower riskless investment proportion
$\alpha$
, the lower the certainty equivalent. In addition, we can also observe from Figure 5a and Table 7 that a lower riskless investment proportion $\alpha$
indicates a shrinking benchmarking region. Eventually, it would become the PI solution when
$\alpha$
indicates a shrinking benchmarking region. Eventually, it would become the PI solution when $\underline{\xi}=\overline{\xi}$
. It happens when
$\underline{\xi}=\overline{\xi}$
. It happens when $\alpha\approx 0.083$
, which is obtained by solving
$\alpha\approx 0.083$
, which is obtained by solving
 \begin{equation} \mathbb{E}\left(\xi_T\left(f^H(\xi_T,\alpha)-X_T^{PI}\right)\mathbf{1}_{X_T^{PI}\leq f(\xi_T)}\right)=\epsilon.\end{equation}
On the other hand, if we keep increasing the riskless investment proportion $\alpha$
, it would eventually become the LEL-PI solution when
$\alpha$
, it would eventually become the LEL-PI solution when $\alpha=1$
since
$\alpha=1$
since $f^H(\xi_T)=Y_0^He^{rT}$
in this situation.
$f^H(\xi_T)=Y_0^He^{rT}$
in this situation.
Effect of $\alpha$
in the hybrid benchmark: out/underperformance PM (Case (1))
$\alpha$
in the hybrid benchmark: out/underperformance PM (Case (1))

Summary of the effect of changing $\alpha$
in under/outperformance PM (Case (2)) with hybrid benchmarks
$\alpha$
in under/outperformance PM (Case (2)) with hybrid benchmarks

Out/underperformance PM with hybrid benchmark: impact of the riskless investment proportion $\alpha$
on the optimal terminal wealth
$\alpha$
on the optimal terminal wealth $X_T^{LERL-PI}$
.
$X_T^{LERL-PI}$
.

Interestingly, for out/underperformance hybrid benchmark PM (Case (1)), both the Omega and utility-transformed Omega ratios do not increase with the certainty equivalent. Indeed, Table 7 shows that the Omega ratio reaches the highest value when $\alpha\approx 0.6$
. The utility-transformed Omega ratio shares a very similar trend with the Omega ratio when changing
$\alpha\approx 0.6$
. The utility-transformed Omega ratio shares a very similar trend with the Omega ratio when changing $\alpha$
. In particular, the measurement
$\alpha$
. In particular, the measurement $U\Omega_{f^H(\xi_T)}$
increases in
$U\Omega_{f^H(\xi_T)}$
increases in $\alpha\in(0,0.8)$
but decreases in
$\alpha\in(0,0.8)$
but decreases in $\alpha\in(0.8,1)$
and thus attains the maximum value at
$\alpha\in(0.8,1)$
and thus attains the maximum value at $\alpha\approx 0.8$
. Apparently, none of these two values of
$\alpha\approx 0.8$
. Apparently, none of these two values of $\alpha$
corresponds to the highest certainty equivalent, which is attained for
$\alpha$
corresponds to the highest certainty equivalent, which is attained for $\alpha\in[0,0.083]$
(PI case). This suggests that the portfolio performance in such a random benchmark LERL-RM situation may not be well reflected by using the Omega ratio or its utility-transformed version. Nevertheless, the BRBU indicator still captures well the portfolio performance relative to the benchmark in this case. Remarkably, as shown in both Tables 7 and 8,
$\alpha\in[0,0.083]$
(PI case). This suggests that the portfolio performance in such a random benchmark LERL-RM situation may not be well reflected by using the Omega ratio or its utility-transformed version. Nevertheless, the BRBU indicator still captures well the portfolio performance relative to the benchmark in this case. Remarkably, as shown in both Tables 7 and 8, $\kappa/\eta$
is always positively proportional to the certainty equivalent, which is not always the case for the classical and the utility-transformed Omega ratio. Let us take a closer inspection. For Case (1), recall that for a lower value of
$\kappa/\eta$
is always positively proportional to the certainty equivalent, which is not always the case for the classical and the utility-transformed Omega ratio. Let us take a closer inspection. For Case (1), recall that for a lower value of $\kappa/\eta$
means that the agent is more concerned about underperformance (unfavorable market states) than outperformance (favorable market states). From Table 7, it can be observed that being more concerned about the underperformance region, the agent would prefer a higher risk-free investment proportion benchmark, which explains why
$\kappa/\eta$
means that the agent is more concerned about underperformance (unfavorable market states) than outperformance (favorable market states). From Table 7, it can be observed that being more concerned about the underperformance region, the agent would prefer a higher risk-free investment proportion benchmark, which explains why $\kappa/\eta$
is negatively proportional to
$\kappa/\eta$
is negatively proportional to $\alpha$
. In addition, to deal with this concern, the agent chooses to enlarge the benchmarking region so that the underperformance region diminishes. However, due to the budget constraint, this results in smaller upside potentials and so is the outperformance region, according to Figure 5a and Table 7; hence, a decrease in the expected utility.
$\alpha$
. In addition, to deal with this concern, the agent chooses to enlarge the benchmarking region so that the underperformance region diminishes. However, due to the budget constraint, this results in smaller upside potentials and so is the outperformance region, according to Figure 5a and Table 7; hence, a decrease in the expected utility.
To gain further insight related to the optimal terminal wealth, we plot in Figure 5b the estimated distribution of $X_T^{LERL-PI}$
by simulating
$X_T^{LERL-PI}$
by simulating $10^7$
paths of the market price density
$10^7$
paths of the market price density $\xi_T$
for different values of
$\xi_T$
for different values of $\alpha$
in Case (1) of the hybrid benchmark. In this density plot, the left tail (resp. right tail) corresponds to the underperformance region (resp. outperformance region), and the central area reflects the benchmarking region, which can be seen by comparing Figure 5b and 5a (the plot of
$\alpha$
in Case (1) of the hybrid benchmark. In this density plot, the left tail (resp. right tail) corresponds to the underperformance region (resp. outperformance region), and the central area reflects the benchmarking region, which can be seen by comparing Figure 5b and 5a (the plot of $X_T^{LERL}$
against
$X_T^{LERL}$
against $\xi_T$
). As pointed out in Figure 5b, as the riskless investment proportion
$\xi_T$
). As pointed out in Figure 5b, as the riskless investment proportion $\alpha$
increases, a less dispersed distribution with thinner tails is displayed. The less dispersed shape corresponds to the larger benchmarking region depicted in Figure 5a and indicates a smaller variance; thus, a less risky investment behavior, which matches the less risky benchmark (higher
$\alpha$
increases, a less dispersed distribution with thinner tails is displayed. The less dispersed shape corresponds to the larger benchmarking region depicted in Figure 5a and indicates a smaller variance; thus, a less risky investment behavior, which matches the less risky benchmark (higher $\alpha$
). The thinner left tail (resp. right tail) coincides with the shrinking PI region (resp. outperformance region), as observed in Figure 5a. Moreover, the size change of both the left and right tails with respect to the change of
$\alpha$
). The thinner left tail (resp. right tail) coincides with the shrinking PI region (resp. outperformance region), as observed in Figure 5a. Moreover, the size change of both the left and right tails with respect to the change of $\alpha$
confirms the trade-off between the underperformance and the outperformance. For instance, a decrease of
$\alpha$
confirms the trade-off between the underperformance and the outperformance. For instance, a decrease of $\alpha$
induces a fatter left tail (higher probability of the underperformance) associated with a fatter right tail (higher probability of the outperformance).
$\alpha$
induces a fatter left tail (higher probability of the underperformance) associated with a fatter right tail (higher probability of the outperformance).
Table 8 shows that when the riskless investment proportion $\alpha$
increases, all the measurements, except for the utility-transformed Omega ratio, rise, capturing well the augmentation in the certainty equivalent. This observation seems surprising as a more prudent investment (i.e., higher
$\alpha$
increases, all the measurements, except for the utility-transformed Omega ratio, rise, capturing well the augmentation in the certainty equivalent. This observation seems surprising as a more prudent investment (i.e., higher $\alpha$
) leads to greater expected utility. However, this can be explained by recalling that for under/outperformance PM (Case (2)), the outperformance region corresponds to the bad market states, and an increase in
$\alpha$
) leads to greater expected utility. However, this can be explained by recalling that for under/outperformance PM (Case (2)), the outperformance region corresponds to the bad market states, and an increase in $\kappa/\eta$
means that the agent gets more concerned about this region and will hence choose a more conservative benchmark (i.e., higher
$\kappa/\eta$
means that the agent gets more concerned about this region and will hence choose a more conservative benchmark (i.e., higher $\alpha$
). In this situation, the agent chooses to reduce the benchmarking region, as depicted in Figure 6a and Table 8, while simultaneously expanding the outperformance and underperformance regions. As a result, this leads to a higher expected utility.
$\alpha$
). In this situation, the agent chooses to reduce the benchmarking region, as depicted in Figure 6a and Table 8, while simultaneously expanding the outperformance and underperformance regions. As a result, this leads to a higher expected utility.
Under/outperformance PM with the hybrid benchmark: Impact of the riskless investment proportion $\alpha$
on the optimal terminal wealth
$\alpha$
on the optimal terminal wealth $X_T^{LERL-PI}$
.
$X_T^{LERL-PI}$
.

The failure of the utility-transformed Omega ratio raises an alert about using performance measures based on merely computing the portfolio performance relative to the benchmark. Unlike the classical Omega ratio, the utility-transformed Omega ratio is inversely proportional to the expected utility. In particular, while an increase in the riskless investment proportion $\alpha$
in the hybrid benchmark (Case (2)) induces a smaller the utility-transformed Omega ratio, it creates a higher
$\alpha$
in the hybrid benchmark (Case (2)) induces a smaller the utility-transformed Omega ratio, it creates a higher $\kappa/\eta$
(i.e., the agent is less loss-averse), resulting in a higher certainty equivalent. Furthermore, as illustrated in Table 8, the BRBU ratio moves in tandem with the certainty equivalent, indicating a potentially suitable candidate for the utility-based performance measure. This aspect will be further investigated in the remaining numerical analysis.
$\kappa/\eta$
(i.e., the agent is less loss-averse), resulting in a higher certainty equivalent. Furthermore, as illustrated in Table 8, the BRBU ratio moves in tandem with the certainty equivalent, indicating a potentially suitable candidate for the utility-based performance measure. This aspect will be further investigated in the remaining numerical analysis.
Remark that $\alpha=0$
corresponds to the stock market benchmark studied in Section 6.3, whereas the problem becomes a pure PI problem when the riskless investment proportion
$\alpha=0$
corresponds to the stock market benchmark studied in Section 6.3, whereas the problem becomes a pure PI problem when the riskless investment proportion $\alpha$
exceeds a specific value (
$\alpha$
exceeds a specific value ( $\approx$
0.76) obtained by solving (6.3) with the given parameters of Case (2) (see Table 4).
$\approx$
0.76) obtained by solving (6.3) with the given parameters of Case (2) (see Table 4).
Similarly to Case (1), it is shown in Figure 6b that an increase in the riskless investment proportion $\alpha$
(less risky benchmark) also induces a less dispersed distribution as observed in Figure 5b. Another similarity between Case (1) and Case (2) lies in the trade-off between the outperformance region and the underperformance region. However, the difference between Case (1) and Case (2) is notable. In particular, for a hybrid benchmark, the LERL-PI terminal wealth in Case (1) displays a single peak distribution (see Figure 5b), whereas it exhibits a multi-peak distribution structure in Case (2), as reported in Figure 6b. Unlike Case (1), the left tail (resp. right tail) of the density plot in Case (2) corresponds to the outperformance region (resp. underperformance region), but the central area (between the first peak and the last peak) also reflects the benchmarking region.
$\alpha$
(less risky benchmark) also induces a less dispersed distribution as observed in Figure 5b. Another similarity between Case (1) and Case (2) lies in the trade-off between the outperformance region and the underperformance region. However, the difference between Case (1) and Case (2) is notable. In particular, for a hybrid benchmark, the LERL-PI terminal wealth in Case (1) displays a single peak distribution (see Figure 5b), whereas it exhibits a multi-peak distribution structure in Case (2), as reported in Figure 6b. Unlike Case (1), the left tail (resp. right tail) of the density plot in Case (2) corresponds to the outperformance region (resp. underperformance region), but the central area (between the first peak and the last peak) also reflects the benchmarking region.
6.5. Mixed benchmark
This subsection considers the mixed benchmark in Example 4 with various proportions of capital invested in the risk-free asset $\beta$
. Recall first from Remark 3.1 that the mixed benchmark can only be fitted in Case (1), that is, out/underperformance PM.
$\beta$
. Recall first from Remark 3.1 that the mixed benchmark can only be fitted in Case (1), that is, out/underperformance PM.
Our numerical result in Table 9 shows that the higher the ratio of capital $\beta$
invested in the money market in the mixed benchmark construction, the higher the certainty equivalent. Surprisingly, both the Omega and utility-transformed Omega ratios decrease with the certainty equivalent, indicating that using these ratios in out/underperformance PM with mixed benchmarks would lead to a largely inaccurate portfolio performance measurement. Interestingly, like Case (1) of the hybrid benchmark, the BRBU indicator well captures the portfolio performance relative to mixed benchmarks. In particular, both the BRBU ratio
$\beta$
invested in the money market in the mixed benchmark construction, the higher the certainty equivalent. Surprisingly, both the Omega and utility-transformed Omega ratios decrease with the certainty equivalent, indicating that using these ratios in out/underperformance PM with mixed benchmarks would lead to a largely inaccurate portfolio performance measurement. Interestingly, like Case (1) of the hybrid benchmark, the BRBU indicator well captures the portfolio performance relative to mixed benchmarks. In particular, both the BRBU ratio $\kappa/\eta$
and the certainty equivalent decrease with
$\kappa/\eta$
and the certainty equivalent decrease with $\beta$
. This can be explained as in Case (1) of the hybrid benchmark that both metrics decrease in
$\beta$
. This can be explained as in Case (1) of the hybrid benchmark that both metrics decrease in $\alpha$
. In addition, as seen in Table 9, the lower the ratio of capital
$\alpha$
. In addition, as seen in Table 9, the lower the ratio of capital $\beta$
invested in the money market, the higher the certainty equivalent. This confirms the intuition that a higher risky investment proportion corresponds to a smaller loss aversion, consequently resulting in an increase in the expected utility. According to Figure 7a and Table 9, a lower
$\beta$
invested in the money market, the higher the certainty equivalent. This confirms the intuition that a higher risky investment proportion corresponds to a smaller loss aversion, consequently resulting in an increase in the expected utility. According to Figure 7a and Table 9, a lower $\beta$
is also accompanied with expanding outperformance and underperformance regions, whereas the benchmarking region is contracting. Moreover, similarly to Case (1) of the hybrid benchmark, we can see that if
$\beta$
is also accompanied with expanding outperformance and underperformance regions, whereas the benchmarking region is contracting. Moreover, similarly to Case (1) of the hybrid benchmark, we can see that if $\beta$
decreases to a certain point (
$\beta$
decreases to a certain point ( $\approx 0.06$
), the benchmarking region disappears, and the LERL-PI problem becomes the PI case. Likewise, the PI solution, which corresponds to
$\approx 0.06$
), the benchmarking region disappears, and the LERL-PI problem becomes the PI case. Likewise, the PI solution, which corresponds to $\kappa=\eta$
, indicates that the agent is indifferent between the outperformance and underperformance effects.
$\kappa=\eta$
, indicates that the agent is indifferent between the outperformance and underperformance effects.
Summary of the effect of changing $\beta$
in the mixed benchmark
$\beta$
in the mixed benchmark

Impact of the ration of capital invested in the money market $\beta$
on the optimal terminal wealth for out/underperformance PM with the mixed benchmark.
$\beta$
on the optimal terminal wealth for out/underperformance PM with the mixed benchmark.

6.6. CPPI benchmark
In this subsection, we analyze the same metrics as in the previous subsections for CPPI benchmarks presented in Example 5, where it is assumed that the multiplier m is bounded from above by the Merton strategy $\theta/(\sigma\gamma)$
.Footnote 2 We remark that for m in the range of
$\theta/(\sigma\gamma)$
.Footnote 2 We remark that for m in the range of $[0,\theta/(\sigma\gamma)]$
, the LERL constraint is always binding and never turns into the PI case, unlike the other benchmarks considered before. Note also that with such a CPPI benchmark, we are in a out/underperformance PM (Case (1)) because the CPPI benchmark entails a lower bound, see Remark 3.1. In the following numerical demonstration, we assume that the PI level is the same as the terminal floor of CPPI benchmarks (
$[0,\theta/(\sigma\gamma)]$
, the LERL constraint is always binding and never turns into the PI case, unlike the other benchmarks considered before. Note also that with such a CPPI benchmark, we are in a out/underperformance PM (Case (1)) because the CPPI benchmark entails a lower bound, see Remark 3.1. In the following numerical demonstration, we assume that the PI level is the same as the terminal floor of CPPI benchmarks ( $L_T=L$
).
$L_T=L$
).
The numerical results are reported in Figure 8 and Table 10 with different values of $m\in[0,0.9]$
. According to Table 10, the higher the predetermined multiplier m, the higher the certainty equivalent and the BRBU ratio
$m\in[0,0.9]$
. According to Table 10, the higher the predetermined multiplier m, the higher the certainty equivalent and the BRBU ratio $\kappa/\eta$
. The reason is that by adopting a utility function with smaller loss aversion, the agent can gain higher upside potentials in good market states, which eventually leads to an increase in certainty equivalent. As demonstrated for hybrid benchmarks (Case (1)) and mixed benchmarks, neither the Omega ratio nor the utility-transformed Omega ratio fully captures the portfolio performance relative to CPPI benchmarks.
$\kappa/\eta$
. The reason is that by adopting a utility function with smaller loss aversion, the agent can gain higher upside potentials in good market states, which eventually leads to an increase in certainty equivalent. As demonstrated for hybrid benchmarks (Case (1)) and mixed benchmarks, neither the Omega ratio nor the utility-transformed Omega ratio fully captures the portfolio performance relative to CPPI benchmarks.
Summary of the effect of changing predetermined multiplier m in the CPPI benchmark

Impact of the predetermined multiplier m on the optimal terminal wealth $X_T^{LERL-PI}$
with the CPPI benchmark.
$X_T^{LERL-PI}$
with the CPPI benchmark.

To gain more insights into the investment choice, we plot in Figures 9 and 10 the optimal LERL-PI investment strategies in the out/underperformance PM (Case (1)) for hybrid, mixed, and CPPI benchmarks in comparison with the limiting LEL-PI, PI, Merton, and the LERL strategy. It is interesting to observe that these three benchmark settings share a very similar investment pattern. In all cases, the LERL-PI risky investment ratio is mostly bounded in the range limited by the LEL-PI and PI strategies, whereas the LERL strategy is limited by the LERL-PI and Merton investment ratio. In particular, the LERL-PI agent in very good market scenarios will adopt an investment strategy close to the Merton ratio to beat the benchmark. When the market is no longer extremely good, the agent, due to the loss constraint, is sensible to reduce the risky asset holding significantly but always keep it smaller than that of the PI strategy and simultaneously greater than the LEL-PI one. In intermediate market states, she tries to replicate the benchmark as much as possible, namely enlarging the benchmarking region, by taking higher risky exposures. However, in bad market states, because of dealing with the underperformance and the LERL constraint, the agent adopts a riskier investment behavior by increasing her risky investment exposures in this region. In addition, without PI constraint, the LERL agent takes even riskier investment behavior than the LERL-PI agent in the intermediate and bad market states. When the market states are extremely bad (i.e., with a very high value of the pricing density $\xi_t$
), the PI constraint now forces her to reduce the risky investment rapidly, whereas the LERL strategy reverts to the Merton ratio. Moreover, for each specific benchmark, a more prudent benchmark (i.e., with higher risk-free investment initiation
$\xi_t$
), the PI constraint now forces her to reduce the risky investment rapidly, whereas the LERL strategy reverts to the Merton ratio. Moreover, for each specific benchmark, a more prudent benchmark (i.e., with higher risk-free investment initiation $\alpha$
(resp.
$\alpha$
(resp. $\beta$
) in case of the hybrid benchmark (resp. mixed benchmark) or with a lower value of the multiplier m in case of the CPPI benchmark) the agent choose, the closer the LERL-PI strategy reaches the limiting LEL-PI strategy.
$\beta$
) in case of the hybrid benchmark (resp. mixed benchmark) or with a lower value of the multiplier m in case of the CPPI benchmark) the agent choose, the closer the LERL-PI strategy reaches the limiting LEL-PI strategy.
LERL-PI optimal investment strategies for out/underperformance PM.

Comparison of optimal investment strategies for out/underperformance PM.

6.7. Discussion
We close this section by commenting on the portfolio performance measurement in a LERL-PI-RM framework, where the agent has to control the portfolio loss relative to a random benchmark. From the above analysis, it is observed that increasing certainty equivalent not only results from a contraction of the benchmarking region but also forms an enlargement of the outperformance region. However, when the loss constraint relative to the benchmark is active, the regulatory effects on the outperformance and underperformance regions may offset each other; hence, the investment performance cannot be fully captured by only looking at the well-known Omega ratio or its utility-transformed version.
Our numerical analysis with various benchmarks shows that the Omega ratio and its utility-transformed version can only reflect the expected utility gain or loss due to the change of loss aversion caused by the different reference levels, but fail to reflect the expected utility performance caused by changing risk profile in the benchmark. Nevertheless, compared with the classical and utility-transformed Omega ratios, the BRBU ratio derived from the benchmark-reference-based utility problem does well for all benchmark types. To account for this result, it is worth recalling that the BRBU ratio takes the agent’s loss aversion into account, whereas the (utility-transformed) Omega ratio does not, as explained in Section 5. Hence, our results suggest a more proper portfolio performance indicator which incorporates the agent’s loss aversion in the LERL benchmarking risk management.
7. Conclusion
We study an optimal investment problem under the joint constraint of portfolio insurance and limited expected relative loss with respect to a general random benchmark. Applying a static martingale approach, we are able to fully characterize the explicit optimal solution with delicate and rigorous demonstrations and perform a sensitivity analysis for the model parameters. More interestingly, we show that the LERL-PI optimal terminal wealth can be replicated by the optimal terminal wealth of the optimization problem with a benchmark-reference-based utility function. We believe that this replication result is of both theoretical and practical interest as it not only builds a connection from risk management to the literature on reference-based preference asset allocation but also enables us to examine the expected utility performance relative to the benchmark in terms of utility gain and loss.
Our intensive numerical analysis sheds light on the optimal portfolio and strategy structure for various benchmarking frameworks such as hybrid, mixed, and CPPI benchmarks. Throughout our numerical experiment, the investment performance under benchmarking loss constraint for different benchmarking frameworks is also compared along with the certainty equivalent, the widely used Omega ratio and its utility-transformed version. Surprisingly, we find that the portfolio performance to the benchmark might not be fully captured by the classical and utility-transformed Omega ratio, reflecting the impact of the benchmarking loss constraint on the underperformance against the outperformance. More interestingly, the expected utility performance can be well depicted by looking at a new portfolio performance ratio obtained from the replicating benchmark-reference-based utility problem, suggesting a more suitable utility-based portfolio performance measurement in the LERL benchmarking risk management.
Our results bring new insights into the agent’s benchmarking behavior and performance measurement, and the linkage with the reference-based preference is a new quantitative aspect in this field of research. Future research may be to consider more general settings, for example, stochastic volatility models and/or multiple periods.
Acknowledgement
The authors acknowledge the support from the Natural Sciences and Engineering Research Council of Canada (Grant No. RGPIN-2021-02594) and the Chair of Actuary, Laval University.
Appendix
A. Proofs of main results
A.1. Proof of Lemma 4.1
We first define an auxiliary set $\mathbf{\Omega}_2\,:\!=\,\{\omega \in \mathbf{\Omega}\,:\,X_T(\omega) > f(\xi_T(\omega))\}$
. Observing
$\mathbf{\Omega}_2\,:\!=\,\{\omega \in \mathbf{\Omega}\,:\,X_T(\omega) > f(\xi_T(\omega))\}$
. Observing
 \begin{equation*} (f(\xi_T)-X_T) \mathbf{1}_{X_T \leq f(\xi_T) }+X_T =\left\{\begin{array}{l@{\quad}r} f(\xi_T), & \text{for } X_T \leq f(\xi_T) \\[5pt] X_T, & \text{for } X_T > f(\xi_T) \end{array}\right. \text{ and }\{\omega\in\mathbf{\Omega}\,:\, \xi_T(\omega)\geq\xi_L\}\subset\mathbf{\Omega}_2,\end{equation*}
where $\xi_L$
is calculated by solving
$\xi_L$
is calculated by solving $f(\xi_T)=L$
or
$f(\xi_T)=L$
or $\xi_L=+\infty$
if
$\xi_L=+\infty$
if $f(\xi_T)>L$
a.s. and thus
$f(\xi_T)>L$
a.s. and thus $\{\omega\in\mathbf{\Omega}\,:\, \xi_T(\omega)\geq\xi_L\}=\emptyset$
. With the budget constraint, we have
$\{\omega\in\mathbf{\Omega}\,:\, \xi_T(\omega)\geq\xi_L\}=\emptyset$
. With the budget constraint, we have
 \begin{align*} \mathbb{E}\left(\xi_T(f(\xi_T)-X_T) \mathbf{1}_{X_T \leq f(\xi_T)}\right) & \geq \mathbb{E}\left(\xi_T(f(\xi_T)-X_T) \mathbf{1}_{X_T \leq f(\xi_T)}\right)+ \mathbb{E}(\xi_TX_T)-x\\[3pt] & = \mathbb{E}\left(\xi_T (X_T-f(\xi_T))\mathbf{1}_{\Omega_2}\right)+\mathbb{E}(\xi_Tf(\xi_T))-x\\[3pt] & \geq \mathbb{E}\left(\xi_T (L-f(\xi_T))\mathbf{1}_{\xi_T\geq \xi_L}\right)+\mathbb{E}(\xi_Tf(\xi_T))-x\\[3pt] & = \mathbb{E}\left(\xi_T\max\{f(\xi_T),L\}\right)-x.\end{align*}
Then, this lower bound is attained if the budget constraint holds with equality and $\mathbf{\Omega}_2=\{\omega\in\mathbf{\Omega}\,:\,\xi_T(\omega)\geq\xi_L\},$
which is possible if we consider an argmin of the form
$\mathbf{\Omega}_2=\{\omega\in\mathbf{\Omega}\,:\,\xi_T(\omega)\geq\xi_L\},$
which is possible if we consider an argmin of the form $\max\{Df(\xi_T),L\}$
, where
$\max\{Df(\xi_T),L\}$
, where $0\leq D<1$
and it satisfies
$0\leq D<1$
and it satisfies $\mathbb{E}(\xi_T\max\{Df(\xi_T),L\})=x.$
Finally, the existence of D follows directly from the intermediate value theorem and the case $D=0$
corresponds to
$D=0$
corresponds to $x=e^{-rT}L,$
and thus,
$x=e^{-rT}L,$
and thus, $X_T=L$
a.s.
$X_T=L$
a.s.
A.2. Proof of Lemma 4.2
Define two auxiliary functions $G_1,G_2\,:\,(0,+\infty)\mapsto\mathbb{R}$
given by
$G_1,G_2\,:\,(0,+\infty)\mapsto\mathbb{R}$
given by
 \begin{equation*} G_1(X)=U(X)-\lambda_1\xi X\quad\text{and}\quad G_2(X)=U(X)-\lambda_1\xi X-\lambda_2\xi(f(\xi)-X),\end{equation*}
and their first derivatives are
 \begin{equation*} G_1^{\prime}(X)=U^{\prime}(X)-\lambda_1\xi\quad\text{and}\quad G_2^{\prime}(X)=U^{\prime}(X)-(\lambda_1-\lambda_2)\xi.\end{equation*}
Then, $G(\lambda_1,\lambda_2,X) =G_1(X)\mathbf{1}_{X\geq f(\xi)}+G_2(X)\mathbf{1}_{L\leq X<f(\xi)}$
, and
$G(\lambda_1,\lambda_2,X) =G_1(X)\mathbf{1}_{X\geq f(\xi)}+G_2(X)\mathbf{1}_{L\leq X<f(\xi)}$
, and $G^{\prime}(\lambda_1,\lambda_2,X) =G_1^{\prime}(X)\mathbf{1}_{X>f(\xi)}+G_2^{\prime}(X)\mathbf{1}_{L< X<f(\xi)}$
for
$G^{\prime}(\lambda_1,\lambda_2,X) =G_1^{\prime}(X)\mathbf{1}_{X>f(\xi)}+G_2^{\prime}(X)\mathbf{1}_{L< X<f(\xi)}$
for $X\neq f(\xi)$
. Since
$X\neq f(\xi)$
. Since $G_1$
and
$G_1$
and $G_2$
are strictly concave and continuously differentiable on
$G_2$
are strictly concave and continuously differentiable on $(0,+\infty)$
, the Lagrangian G exhibits the same properties in
$(0,+\infty)$
, the Lagrangian G exhibits the same properties in $[L,f(\xi))$
and
$[L,f(\xi))$
and $(f(\xi),+\infty)$
. Furthermore,
$(f(\xi),+\infty)$
. Furthermore, $G_1$
and
$G_1$
and $G_2$
attain their maximum at
$G_2$
attain their maximum at $X_1\,:\!=\,I(\lambda_1\xi)$
and
$X_1\,:\!=\,I(\lambda_1\xi)$
and $X_2\,:\!=\,I((\lambda_1-\lambda_2)\xi)$
respectively. Moreover, we have
$X_2\,:\!=\,I((\lambda_1-\lambda_2)\xi)$
respectively. Moreover, we have $X_2>X_1$
because I is strictly decreasing and
$X_2>X_1$
because I is strictly decreasing and $\lambda_1>\lambda_2>0$
. Below, we solve Problem (4.7) case by case.
$\lambda_1>\lambda_2>0$
. Below, we solve Problem (4.7) case by case.
Case (1): To find the global maximum of G, we consider the following cases:
-
(1a) ${\boldsymbol\xi<\underline{\boldsymbol\xi}:}$
In this case,
$X_1>f(\xi)$
. We will show that G is increasing in
$[L,f(\xi) )$
implying the maximum of G occurs in
$[f(\xi),+\infty)$
, which is
$X_1$
. Indeed, for
$X\in[L,f(\xi))$
, where
$G^{\prime}(X)=G^{\prime}_2(X)$
. Since
$X<f(\xi)<X_1<X_2$
, we have
$U^{\prime}(X)>(\lambda_1-\lambda_2)\xi$
, and thus G is increasing in
$[L,f(\xi))$
.
${\boldsymbol\xi<\underline{\boldsymbol\xi}:}$
In this case,
$X_1>f(\xi)$
. We will show that G is increasing in
$[L,f(\xi) )$
implying the maximum of G occurs in
$[f(\xi),+\infty)$
, which is
$X_1$
. Indeed, for
$X\in[L,f(\xi))$
, where
$G^{\prime}(X)=G^{\prime}_2(X)$
. Since
$X<f(\xi)<X_1<X_2$
, we have
$U^{\prime}(X)>(\lambda_1-\lambda_2)\xi$
, and thus G is increasing in
$[L,f(\xi))$
. -
(1b)
$\boldsymbol{\underline{\xi}\leq\xi<\overline{\xi}:}$
This implies that
$X_1\leq f(\xi)<X_2$
. Let us show that the Lagrangian G is increasing in
$[L,f(\xi))$
and decreasing in
$(f(\xi),+\infty)$
; hence,
$f(\xi)$
is the global maximizer. Indeed, for
$X\in[L,f(\xi))$
, we have
$G^{\prime}(X)=G^{\prime}_2(X)$
and
$X<f(\xi)<X_2$
, which implies
$U^{\prime}(X)>(\lambda_1-\lambda_2)\xi$
, and thus G is increasing in
$X\in[L,f(\xi))$
.For
$X\in(f(\xi),+\infty)$
, we have
$G^{\prime}(X)=G^{\prime}_1(X)$
and
$X>f(\xi)\geq X_1$
implying
$U^{\prime}(X)<\lambda_1\xi$
. Therefore, G is decreasing in
$(f(\xi),+\infty)$
. -
(1c)
$\boldsymbol{\overline{\xi}\leq\xi<\overline{\xi}_L:}$
The equivalence to this case is
$f(\xi)\geq X_2>L$
. For
$X\in(f(\xi),+\infty)$
, we have
$X>f(\xi)\geq X_2>X_1$
, which implies
$U^{\prime}(X)<\lambda_1\xi$
, and thus, G is decreasing in
$(f(\xi),+\infty)$
. It means that G attains its maximum
$X_2$
in
$[L,f(\xi))$
. -
(1d)
$\boldsymbol{\xi\geq\overline{\xi}_L:}$
This is equivalent to
$X_2\leq L$
and
$X_2<f(\xi)$
, we need to show G is decreasing on
$[L,+\infty)$
, which implies that L is the global maximizer.Since
$\xi>\overline{\xi}$
, G is decreasing in
$(f(\xi),+\infty)$
from (1c). If
$L\geq f(\xi)$
, then the result follows. Otherwise, if
$L<f(\xi)$
, we need to consider
$X\in[L,f(\xi))$
and observe that
$X>L\geq X_2$
, which implies
$U^{\prime}(X)<(\lambda_1-\lambda_2)\xi$
, and hence G is decreasing in
$[L,f(\xi))$
as well.


Case (2): Similarly to Case (1), we consider different situations depending on the range of $\xi$
to find the global maximum of G.
$\xi$
to find the global maximum of G.
-
(2a)
$\boldsymbol{\xi<\overline{\xi}:}$
We have
$X_2<f(\xi)$
in this case, and
$X_2$
is the global maximizer by showing that G is decreasing in
$[f(\xi),+\infty)$
. The deduction is the same as the one in (1c). -
(2b)
$\boldsymbol{\overline{\xi}\leq\xi<\underline{\xi}:}$
This is tantamount to
$X_1 < f(\xi) \leq X_2$
, and the proof is the same as the one in (1b). -
(2c)
$\boldsymbol{\underline{\xi}\leq\xi<\underline{\xi}_L}$
: We have
$X_1 \geq f(\xi)$
and
$X_1 > L$
in this case. If
$L \geq f(\xi)$
, then
$G(X)=G_1(X)$
, and the maximizer is
$X_1$
. On the other hand, if
$L < f(\xi)$
, we show that
$X_1$
is also the global maximizer by proving G is increasing in
$[L,f(\xi))$
, and it attains its maximum in
$(f(\xi),+\infty)$
. Its proof is the same as the one in (1a). -
(2d)
$\boldsymbol{\xi\geq\underline{\xi}_L>\underline{\xi}:}$
It is equivalent to
$f(\xi) < X_1 \leq L$
, and thus,
$G(X)=G_1(X){\mathbf{1}_{X\geq L}}$
. By showing G is decreasing on
$[L,+\infty)$
, G reaches its maximum at
$X=L$
. Since
$X \geq L \geq X_1$
, we deduce that
$U^{\prime}(X) \leq \lambda_1 \xi$
, and G is decreasing on
$[L,+\infty)$
.


The proof of Case (3) shares a similar deduction as the above and is summarized in Table 11.
Summary of the proof and maximizers for Case (3)

A.3. Proof of Proposition 4.2
To prove Proposition 4.2, we first discuss the range of two Lagrange multipliers with different cases and ranges of the initial capital x. Their lower bounds are the same for the two cases. Fix $\lambda_1$
, then
$\lambda_1$
, then $\lambda_2$
can reach zero, and thus,
$\lambda_2$
can reach zero, and thus, $\overline{\xi}=\underline{\xi}$
. About the lower bound of
$\overline{\xi}=\underline{\xi}$
. About the lower bound of $\lambda_1$
, it should not be smaller than
$\lambda_1$
, it should not be smaller than $\lambda_2$
. In the extreme such that
$\lambda_2$
. In the extreme such that $\lambda_2=0$
, since
$\lambda_2=0$
, since $\overline{\xi}=\underline{\xi}$
, we have a PI solution; hence, the lower bound of
$\overline{\xi}=\underline{\xi}$
, we have a PI solution; hence, the lower bound of $\lambda_1$
is
$\lambda_1$
is $\lambda^{PI(L)}$
.
$\lambda^{PI(L)}$
.
Let us discuss the upper bound of $\lambda_2$
and
$\lambda_2$
and $\lambda_1$
. On one hand, it is clear that
$\lambda_1$
. On one hand, it is clear that $\lambda_2{<}\lambda_1$
, so the optimal terminal wealth is well-defined. On the other hand, the upper bound of
$\lambda_2{<}\lambda_1$
, so the optimal terminal wealth is well-defined. On the other hand, the upper bound of $\lambda_1$
is more complicated, and we explore it case by case in the sequel. If
$\lambda_1$
is more complicated, and we explore it case by case in the sequel. If $\mathbb{E}(\xi_T\max\{f(\xi_T),L\})< x$
, then the initial capital x can hedge
$\mathbb{E}(\xi_T\max\{f(\xi_T),L\})< x$
, then the initial capital x can hedge $\max\{f(\xi_T),L\}$
. According to Proposition 4.1, the upper bound of
$\max\{f(\xi_T),L\}$
. According to Proposition 4.1, the upper bound of $\lambda_1$
is
$\lambda_1$
is $\lambda^H$
.
$\lambda^H$
.
If $\mathbb{E}(\xi_T\max\{f(\xi_T),L\})\geq x$
, then the initial capital x is not enough to hedge
$\mathbb{E}(\xi_T\max\{f(\xi_T),L\})\geq x$
, then the initial capital x is not enough to hedge $\max\{f(\xi_T),L\}$
. Additionally, for Case (1),
$\max\{f(\xi_T),L\}$
. Additionally, for Case (1), $\lambda_1$
can be as large as possible. However, for Case (2),
$\lambda_1$
can be as large as possible. However, for Case (2), $\lambda_1$
can only reach a constant
$\lambda_1$
can only reach a constant $\lambda_a$
such that
$\lambda_a$
such that $\underline{\xi}=\underline{\xi}_L=\xi_L$
. Similarly, for Case (1), if
$\underline{\xi}=\underline{\xi}_L=\xi_L$
. Similarly, for Case (1), if $\lambda_1-\lambda_2\rightarrow\lambda_a$
, then we have
$\lambda_1-\lambda_2\rightarrow\lambda_a$
, then we have $\overline{\xi}=\overline{\xi}_L=\xi_L$
.
$\overline{\xi}=\overline{\xi}_L=\xi_L$
.
Based on the above discussion, we set the domain of these two functions as (4.10). Below, we prove functions defined in (4.8) exhibiting the following properties.
Lemma A.1. For $i=1,2$
,
$i=1,2$
, $H_i(\lambda_1,\lambda_2)$
and
$H_i(\lambda_1,\lambda_2)$
and $K_i(\lambda_1,\lambda_2)$
(see (4.8)) satisfy the following
$K_i(\lambda_1,\lambda_2)$
(see (4.8)) satisfy the following
-
(HK1)
$H_i(\lambda_1,\lambda_2)$
and
$K_i(\lambda_1,\lambda_2)$
are of class
$C^1$
on
$\mathbf{D}$
. -
(H2)
$\frac{\partial}{\partial\lambda_1}H_i(\lambda_1,\lambda_2)<0$
on
$\mathbf{D}$
. -
(H3)
$\frac{\partial}{\partial\lambda_2}H_i(\lambda_1,\lambda_2)>0$
on
$\mathbf{D}$
. -
(H4)
$H_i(\lambda^{PI(L)},0)=x$
and
$H_i(\lambda_1,0)<x$
for all
$\lambda_1\in\left(\lambda^{PI(L)},\overline{\lambda}_1\right)$
. -
(H5) There exist a
$\overline{\lambda}_2$
such that
$H_i(\lambda_1,\overline{\lambda}_2) \,:\!=\,\lim_{\lambda_2\rightarrow\overline{\lambda}_2}H(\lambda_1,\lambda_2)>x$
for all
$\lambda_1\in\left(\lambda^{PI(L)},\overline{\lambda}_1\right)$
. -
(K2)
$\frac{\partial}{\partial\lambda_1}K_i(\lambda_1,\lambda_2)>0$
on
$\mathbf{D}$
. -
(K3)
$\frac{\partial}{\partial\lambda_2}K_i(\lambda_1,\lambda_2)<0$
on
$\mathbf{D}$
. -
(K4)
$K_i(\lambda^{PI(L)},0)=\overline{\epsilon}$
and
$K_i(\lambda_1,0)>\overline{\epsilon}$
(see (4.2)) for all
$\lambda_1\in\left(\lambda^{PI(L)},\overline{\lambda}_1\right)$
.


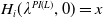


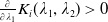

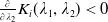


Proof.
-
(HK1) From the expressions of
$H_i$
and
$K_i$
, it is apparent that they are of class
$C^1$
on
$\mathbf{D}$
. -
(H4) When
$\lambda_1=\lambda^{PI(L)}$
and
$\lambda_2=0$
, then
$X_T^{LERL-PI}=X_T^{PI(L)}$
since
$\overline{\xi}=\underline{\xi}$
, and the first result follows from the definition of
$\lambda^{PI(L)}$
. The second result is implied by (H2). -
(H5) Fix
$\lambda_1\in\left(\lambda^{PI(L)},\overline{\lambda}_1\right)$
, let Therefore, we have
\begin{equation*} \overline{\lambda}_2= \left\{\begin{array}{l@{\quad}r} \lambda_1-\lambda_a &\text{ Case (1)},\\[4pt] \lambda_1 &\text{ Case (2)}. \end{array}\right. \end{equation*}
$\overline{\xi}=\overline{\xi}_L=\xi_L$
for Case (1)) and
$\overline{\xi}=0$
for Case (2)). Then, where
\begin{align*} \lim_{\lambda_2\rightarrow\overline{\lambda}_2}X_T^{LERL-PI} =& \left\{\begin{array}{l@{\quad}r} I(\lambda_1\xi_T)\mathbf{1}_{\xi_T<\underline{\xi}} +f(\xi_T)\mathbf{1}_{\underline{\xi}\leq \xi_T <\xi_L} +L\mathbf{1}_{\xi_T\geq \xi_L} &\text{ Case (1)}\\[4pt] f(\xi_T)\mathbf{1}_{\xi_T< \underline{\xi}} +I(\lambda_1\xi_T)\mathbf{1}_{ \underline{\xi}\leq \xi_T< \underline{\xi}_L} +L\mathbf{1}_{\xi_T\geq \underline{\xi}_L} &\text{ Case (2)} \end{array}\right.\\[4pt] >& \left\{\begin{array}{l@{\quad}r} X_T^H &\text{if }x>\mathbb{E}\left(\xi_T\max\left\{f(\xi_T),L\right\}\right),\\[4pt] \max\{f(\xi_T),L\} &\text{if } x\leq \mathbb{E}\left(\xi_T\max\left\{f(\xi_T),L\right\}\right), \end{array}\right. \end{align*}
$X_T^H$
is defined in Proposition 4.1 with the same initial capital in this case. In addition, we have
$X_T^{LERL-PI}\leq L+f(\xi_T)+I((\lambda_1-\lambda_2)\xi_T)$
a.s. By Lebesgue dominated convergence theorem, we can switch the limit and expectation operator to get
\begin{equation*} H_i(\lambda_1,\overline{\lambda}_2) =\lim_{\lambda_2\rightarrow\overline{\lambda}_2}H_i(\lambda_1,\lambda_2) = \mathbb{E}\left(\xi_T\lim_{\lambda_2\rightarrow\overline{\lambda}_2}X_T^{LERL-PI}(\lambda_1,\lambda_2)\right) > x. \end{equation*}
-
(K4) If
$\lambda_1=\lambda^{PI(L)}$
and
$\lambda_2=0$
, then
$X_T^{LERL-PI}=X_T^{PI(L)}$
and the first result follows from the definition of
$\overline{\epsilon}$
, and the second assertion is deduced from (K2).


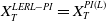

(H2), (H3), (K2), and (K3) are proved by direct calculation (see Appendix D for mathematical justification of interchanging the expectation and derivative operators) and utilizing the fact that I is strictly decreasing, namely,
 \begin{align*} \frac{\partial H_1}{\partial \lambda_1} & =\mathbb{E}\left(\xi_T^2I^{\prime}(\lambda_1\xi_T)\mathbf{1}_{\xi_T<\underline{\xi}}\right) +\mathbb{E}\left(\xi_T^2I^{\prime}((\lambda_1-\lambda_2)\xi_T)\mathbf{1}_{\overline{\xi}\leq \xi_T<\overline{\xi}_L}\right) <0,\\[4pt] \frac{\partial H_2}{\partial \lambda_1} & =\mathbb{E}\left(\xi_T^2I^{\prime}((\lambda_1-\lambda_2)\xi_T)\mathbf{1}_{\xi_T<\overline{\xi}}\right) +\mathbb{E}\left(\xi_T^2I^{\prime}(\lambda_1\xi_T)\mathbf{1}_{\underline{\xi}\leq \xi_T<\underline{\xi}_L}\right) <0,\\[4pt] -\frac{\partial K_1}{\partial \lambda_2} & =\frac{\partial K_1}{\partial \lambda_1}=\frac{\partial H_1}{\partial \lambda_2} =-\mathbb{E}\left(\xi_T^2I^{\prime}((\lambda_1-\lambda_2)\xi_T)\mathbf{1}_{\overline{\xi}\leq \xi_T<\overline{\xi}_L}\right) >0,\\[4pt] -\frac{\partial K_2}{\partial \lambda_2} & =\frac{\partial K_2}{\partial \lambda_1}=\frac{\partial H_2}{\partial \lambda_2} =-\mathbb{E}\left(\xi_T^2I^{\prime}((\lambda_1-\lambda_2)\xi_T)\mathbf{1}_{\xi_T<\overline{\xi}}\right) >0. \end{align*}
A.4. Limiting results
We then study the dependence of $\lambda_2$
on
$\lambda_2$
on $\lambda_1$
and its properties; the result is summarized in the following proposition.
$\lambda_1$
and its properties; the result is summarized in the following proposition.
Proposition A.1. For $i=1,2$
, we have
$i=1,2$
, we have
-
(1) For all
$\lambda_1\in\left(\lambda^{PI(L)},\overline{\lambda}_1\right)$
, there exists a unique
$\lambda_2=\lambda_2(\lambda_1)$
such that
$H_i(\lambda_1,\lambda_2(\lambda_1))=x$
. -
(2) The function
$\lambda_1\mapsto\lambda_2(\lambda_1)$
is of class
$C^1$
and strictly increasing on
$\left(\lambda^{PI(L)},\overline{\lambda}_1\right)$
. -
(3)
$\lambda_2(\lambda^{PI(L)})\,:\!=\,\lim_{\lambda_1\rightarrow\lambda^{PI(L)}}\lambda_2(\lambda_1)=0$
. -
(4) Assume that
$\lim_{\lambda_1\rightarrow\overline{\lambda}_1}H_i(\lambda_1,\lambda_2(\lambda_1))=x$
, the asymptotic behavior when
$\lambda_1\rightarrow\overline{\lambda}_1$
is summarized in Table 12.


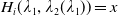


In Table 12, $\lambda^{*}$
is a constant if
$\lambda^{*}$
is a constant if $x>e^{-rT}L$
,
$x>e^{-rT}L$
, $\lambda^{*}=+\infty$
if
$\lambda^{*}=+\infty$
if $x=e^{-rT}L$
, and
$x=e^{-rT}L$
, and $X_T^{*}$
is given by
$X_T^{*}$
is given by
 \begin{equation*} X_T^{*} = \left\{\begin{array}{l@{\quad}r} f(\xi_T)\mathbf{1}_{\xi_T<\xi^{*}}+I(\lambda^{*}\xi_T)\mathbf{1}_{\xi^{*} \leq \xi_T<\xi_L^{*}}+L\mathbf{1}_{\xi_T\geq \xi_L^{*}}, & \text{ Case (1)},\\[4pt] I(\lambda^{*}\xi_T)\mathbf{1}_{\xi_T<\xi^{*}}+f(\xi_T)\mathbf{1}_{\xi^{*} \leq \xi_T<\xi_L}+L\mathbf{1}_{\xi_T\geq \xi_L}, & \text{ Case (2)}, \end{array}\right. \end{equation*}
where $\xi^{*}$
is obtained by solving
$\xi^{*}$
is obtained by solving $f(\xi^{*})=I(\lambda^{*}\xi^{*})$
,
$f(\xi^{*})=I(\lambda^{*}\xi^{*})$
, $\xi^{*}_L=\frac{U^{\prime}(L)}{\lambda^{*}}$
, and
$\xi^{*}_L=\frac{U^{\prime}(L)}{\lambda^{*}}$
, and $X_T^H$
and
$X_T^H$
and $\lambda^H$
are defined in Proposition 4.1 with
$\lambda^H$
are defined in Proposition 4.1 with $\mathbb{E}(\xi_TX_T^H)=x$
. Moreover, the LERL loss of
$\mathbb{E}(\xi_TX_T^H)=x$
. Moreover, the LERL loss of $\lim_{\lambda_1\rightarrow\overline{\lambda}_1}X_T^{LERL-PI}$
is
$\lim_{\lambda_1\rightarrow\overline{\lambda}_1}X_T^{LERL-PI}$
is $\underline{\epsilon}$
(see (4.5)).
$\underline{\epsilon}$
(see (4.5)).
The asymptotic behavior of $\lambda_1$
,
$\lambda_1$
, $\lambda_2$
,
$\lambda_2$
, $\lambda_1-\lambda_2$
and
$\lambda_1-\lambda_2$
and $X_T^{LERL-PI}$

Proof.
-
(1) With Lemma A.1 (HK1), (H3), (H4), and (H5), the result follows by applying the intermediate value theorem.
-
(2) The regularity result follows from Lemma A.1 (HK1), (H3), and the implicit function theorem. By Lemma A.1 (HK1), (H2) and (H3), we have
$\frac{d\lambda_2}{d\lambda_1}=-\frac{\partial H_i}{\partial\lambda_1}/\frac{\partial H_i}{\partial\lambda_2}>0$
, and the second assertion follows. -
(3) Firstly, the existence of the limit follows from (1) and (2). Then, by Lemma A.1 (H4), we get
$x =H(\lambda^{PI(L)},0) =\lim_{\lambda_1\rightarrow\lambda^{PI(L)}}H(\lambda_1,\lambda_2(\lambda_1))$
, implying
$\lambda_2(\lambda^{PI(L)})=0$
. -
(4a)
$\boldsymbol{ \mathbb{E}(\xi_T\max\{f(\xi_T),L\})<x:}$
In this circumstance, we have
$\overline{\lambda}=\lambda^H$
. According to Proposition 4.1, we must have
$\overline{\xi}=\overline{\xi}_L$
for Case (1); thus,
$\lambda_1-\lambda_2\rightarrow \lambda_a$
and
$\lambda_2\rightarrow\lambda^H-\lambda_a$
; for Case (2), we obtain
$\overline{\xi}=0$
; hence
$\lambda_1-\lambda_2\rightarrow 0$
and
$\lambda_2\rightarrow \lambda^H$
; otherwise,
$\lim_{\lambda_1\rightarrow\overline{\lambda}_1}H_i(\lambda_1,\lambda_2(\lambda_1))=x$
would be violated. -
(4b)
$\boldsymbol{ \mathbb{E}(\xi_T\max\{f(\xi_T),L\})=x:}$
For Case (1), because
$\overline{\lambda}_1=+\infty$
, we have
$\underline{\xi}=0$
. From
$ \lim_{\lambda_1\rightarrow\overline{\lambda}_1}H_i(\lambda_1,\lambda_2(\lambda_1)) =x=\mathbb{E}(\xi_T\max\{f(\xi_T),L\})$
, we must have
$\overline{\xi}=\overline{\xi}_L$
implying
$\lambda_1-\lambda_2\rightarrow \lambda_a$
and
$\lambda_2\rightarrow +\infty.$
For Case (2), we get
$\underline{\xi}=\underline{\xi}_L$
since
$\overline{\lambda}_1=\lambda_a$
.
$\lim_{\lambda_1\rightarrow\overline{\lambda}_1}H_i(\lambda_1,\lambda_2(\lambda_1)) =x =\mathbb{E}(\xi_T\max\{f(\xi_T),L\})$
implies that
$\overline{\xi}=0$
,
$\lambda_1-\lambda_2\rightarrow 0$
and
$ \lambda_2\rightarrow \lambda_a$
. -
(4c)
$\boldsymbol{ \mathbb{E}(\xi_T\max\{f(\xi_T),L\})>x:}$
$\overline{\lambda}_1=+\infty$
implies
$\underline{\xi}=0$
in Case (1). According to
$\lim_{\lambda_1\rightarrow\overline{\lambda}_1}H_i(\lambda_1,\lambda_2(\lambda_1)) =x <\mathbb{E}(\xi_T\max\{f(\xi_T),L\})$
, the initial capital x is not enough to hedge
$\max\{f(\xi_T),L\}$
. Therefore, we have
$\overline{\xi}{<}\overline{\xi}_L$
; thus,
$\lambda_1-\lambda_2\rightarrow \lambda^*\in (\lambda_a,\lambda_1)$
and
$\lambda_2\rightarrow +\infty$
. For Case (2)),
$\overline{\lambda}_1=\lambda_a$
implies
$\underline{\xi}=\underline{\xi}_L$
. Similarly,
$\lim_{\lambda_1\rightarrow\overline{\lambda}_1}H_i(\lambda_1,\lambda_2(\lambda_1)) =x <\mathbb{E}(\xi_T\max\{f(\xi_T),L\})$
means that the initial capital x cannot hedge
$\max\{f(\xi_T),L\}$
; hence, we deduce that
$\lambda_1-\lambda_2\rightarrow \lambda^*\in(0,\lambda_a)$
and
$\lambda_2\rightarrow \lambda_a-\lambda^*$
because
$\overline{\xi}>0$
.


Finally, we compute the LERL loss is $\underline{\epsilon}$
for the above cases. For the case (4a) and (4b), since their limits of
$\underline{\epsilon}$
for the above cases. For the case (4a) and (4b), since their limits of $X_T^{LERL-PI}$
are greater than or equal to
$X_T^{LERL-PI}$
are greater than or equal to $f(\xi_T)$
a.s., their LERL loss is 0. For the case (4c) and the case of
$f(\xi_T)$
a.s., their LERL loss is 0. For the case (4c) and the case of $x=e^{-rT}L$
, it follows from utilizing the fact that
$x=e^{-rT}L$
, it follows from utilizing the fact that $X_T^{*}$
satisfies both constraints with equality and direct calculation.
$X_T^{*}$
satisfies both constraints with equality and direct calculation.
Now, we can prove Proposition 4.2 by treating $K_i(\lambda_1,\lambda_2)$
(see (4.8)) as a function of
$K_i(\lambda_1,\lambda_2)$
(see (4.8)) as a function of $\lambda_1$
, for
$\lambda_1$
, for $i=1,2$
.
$i=1,2$
.
Proof [Proof of Proposition 4.2]. We first define two auxiliary functions:
 \begin{equation*} h_i(\lambda_1)=K_i(\lambda_1,\lambda_2(\lambda_1))\quad\text{for}\ \lambda_1\in[\lambda^{PI(L)},\overline{\lambda}_1)\text{ and }i=1,2. \end{equation*}
First, combining the result from Proposition A.1 (2) and Lemma A.1 (HK1), we assert that $h_i$
is of class
$h_i$
is of class $C^1$
.
$C^1$
.
Then, we show that $h_i(\lambda_1)$
can be greater than or less than
$h_i(\lambda_1)$
can be greater than or less than $\epsilon$
. On the one hand, according to Proposition A.1 (3) and Lemma A.1 (K4), we have
$\epsilon$
. On the one hand, according to Proposition A.1 (3) and Lemma A.1 (K4), we have $h_i(\lambda^{PI(L)})=K_i(\lambda^{PI(L)},0)=\overline{\epsilon}>\epsilon$
. On the other hand, we obtain
$h_i(\lambda^{PI(L)})=K_i(\lambda^{PI(L)},0)=\overline{\epsilon}>\epsilon$
. On the other hand, we obtain $h_i(\overline{\lambda}_1) \,:\!=\,\lim_{\lambda_1\rightarrow\overline{\lambda}_1}h_i(\lambda_1) =\lim_{\lambda_1\rightarrow\overline{\lambda}_1}K_i(\lambda_1,\lambda_2(\lambda_1)) =\underline{\epsilon} <\epsilon,$
according to Proposition A.1 (4).
$h_i(\overline{\lambda}_1) \,:\!=\,\lim_{\lambda_1\rightarrow\overline{\lambda}_1}h_i(\lambda_1) =\lim_{\lambda_1\rightarrow\overline{\lambda}_1}K_i(\lambda_1,\lambda_2(\lambda_1)) =\underline{\epsilon} <\epsilon,$
according to Proposition A.1 (4).
In the last part, we prove $h^{\prime}_i(\lambda_1)<0$
. First, we introduce the following new notations and compute
$h^{\prime}_i(\lambda_1)<0$
. First, we introduce the following new notations and compute $h^{\prime}_i(\lambda_1)$
by the chain rule,
$h^{\prime}_i(\lambda_1)$
by the chain rule,
 \begin{align*} &H_{ij} \,:\!=\,\frac{\partial}{\partial\lambda_j}H_i(\lambda_1,\lambda_2(\lambda_1)) \quad\text{and}\quad K_{ij} \,:\!=\,\frac{\partial}{\partial\lambda_j}K_i(\lambda_1,\lambda_2(\lambda_1)), \text{ for }j=1,2,\\ &h^{\prime}_i(\lambda_1) =\frac{\partial}{\partial\lambda_1}K_i(\lambda_1 ,\lambda_2(\lambda_1))+\frac{\partial}{\partial\lambda_2}K_i(\lambda_1 ,\lambda_2(\lambda_1))\lambda^{\prime}_2(\lambda_1) =\frac{1}{H_{i2}}(K_{i1}H_{i2}-K_{i2}H_{i1}). \end{align*}
Hence, it is sufficient to prove $K_{i1}H_{i2}-K_{i2}H_{i1}<0$
since
$K_{i1}H_{i2}-K_{i2}H_{i1}<0$
since $H_{i2}>0$
from Lemma A.1 (H3). From the proof of Lemma A.1, we have
$H_{i2}>0$
from Lemma A.1 (H3). From the proof of Lemma A.1, we have $H_{i2}=K_{i1}=-K_{i2}$
, and thus,
$H_{i2}=K_{i1}=-K_{i2}$
, and thus, $K_{i1}H_{i2}-K_{i2}H_{i1}=K_{i1}(K_{i1}+H_{i1}) <0$
by direct calculation. Then, the assertion follows by applying the intermediate value theorem and Proposition A.1 (1).
$K_{i1}H_{i2}-K_{i2}H_{i1}=K_{i1}(K_{i1}+H_{i1}) <0$
by direct calculation. Then, the assertion follows by applying the intermediate value theorem and Proposition A.1 (1).
A.5. Proof of Theorem 5.1
We follow the same methodology used in the proof of Theorem 4.1. First, for $z,\xi>0$
, we consider the following Lagrangian
$z,\xi>0$
, we consider the following Lagrangian
 \begin{equation*} \Upsilon(z,\xi,X) \,:\!=\,\tilde{U}(X)-z\xi X =\left\{\begin{array}{l@{\quad}r} \eta (U(X)-U(f(\xi)))-z\xi X &\text{ for }X\leq f(\xi)\\[4pt] \kappa(U(X)-U(f(\xi)))-z\xi X &\text{ for }X>f(\xi) \end{array}\right.,\end{equation*}
which is a continuous function of $X\in(0,+\infty)$
. We remark that it is differentiable in X except for the point
$X\in(0,+\infty)$
. We remark that it is differentiable in X except for the point $X=f(\xi)$
. Then, the following lemma solves the corresponding Lagrangian maximization problem.
$X=f(\xi)$
. Then, the following lemma solves the corresponding Lagrangian maximization problem.
Lemma A.2. Consider the Lagrangian maximization problem $\max_{X_T\in\mathbb{X}, X\geq L}\Upsilon(z,\xi,X)$
, then
$\max_{X_T\in\mathbb{X}, X\geq L}\Upsilon(z,\xi,X)$
, then $\digamma(z,\xi)\,:\!=\,\text{arg\,max}_{X_T\in\mathbb{X}, X\geq L}\Upsilon(z,\xi,X)$
is given by
$\digamma(z,\xi)\,:\!=\,\text{arg\,max}_{X_T\in\mathbb{X}, X\geq L}\Upsilon(z,\xi,X)$
is given by
 \begin{equation*} \digamma(z,\xi) \,:\!=\,\left\{\begin{array}{l@{\quad}r} I\left(\frac{z}{\kappa}\xi\right)\mathbf{1}_{\xi<\xi^{\kappa}} +f(\xi)\mathbf{1}_{\xi^{\kappa}\leq \xi<\xi^{\eta}} +I\left(\frac{z}{\eta}\xi\right)\mathbf{1}_{\xi^{\eta}\leq\xi<\xi^{\eta}_L} +L\mathbf{1}_{\xi\geq\xi^{\eta}_L}, &\text{ Case (1)}\\[7pt] I\left(\frac{z}{\eta}\xi\right)\mathbf{1}_{\xi<\xi^{\eta}} +f(\xi)\mathbf{1}_{\xi^{\eta}\leq \xi<\xi^{\kappa}} +I\left(\frac{z}{\kappa}\xi\right)\mathbf{1}_{\xi^{\kappa}\leq\xi<\xi^{\kappa}_L} +L\mathbf{1}_{\xi_T\geq{\xi^{\kappa}_L}}, &\text{ Case (2)} \end{array}\right. \end{equation*}
For Case (3), there are three situations summarized in Table 13.
The Lagrangian maximizer of Case (3)

Proof. It is the same as the proof of Lemma 4.2 by considering the following replacements:
 \begin{align*} &X_1\rightarrow I\left(\frac{z}{{\kappa}}\xi\right),\ X_2\rightarrow I\left(\frac{z}{{\eta}}\xi\right),\ \underline{\xi}\rightarrow\xi^{\kappa},\ \overline{\xi}\rightarrow\xi^{\eta},\ \underline{\xi}_L\rightarrow\xi^{\kappa}_L,\ \overline{\xi}_L\rightarrow\xi^{\eta}_L,\\ &G_1(X)\rightarrow\kappa(U(X)-U(f(\xi)))-z\xi X,\ G_2(X)\rightarrow\eta(U(X)-U(f(\xi)))-z\xi X,\\ &G^{\prime}_1(X)\rightarrow\kappa U^{\prime}(X)-z\xi,\ G^{\prime}_2(X)\rightarrow\eta U^{\prime}(X)-z\xi. \end{align*}
Moreover, we need the existence result of Lagrangian multiplier z, which is stated in the next lemma.
Lemma A.3. There exist a unique solution $z\in(0,+\infty)$
to
$z\in(0,+\infty)$
to $\mathbb{E}(\xi_T\digamma(z,\xi_T))=x$
.
$\mathbb{E}(\xi_T\digamma(z,\xi_T))=x$
.
Proof. $\digamma(z,\xi_T)$
is monotonically decreasing in z, and we thus have
$\digamma(z,\xi_T)$
is monotonically decreasing in z, and we thus have $\lim_{z\rightarrow+\infty}\digamma(z,\xi_T)=L$
and
$\lim_{z\rightarrow+\infty}\digamma(z,\xi_T)=L$
and $\lim_{z\rightarrow0}\digamma(z,\xi_T)=+\infty.$
Applying the monotone convergence theorem, we obtain
$\lim_{z\rightarrow0}\digamma(z,\xi_T)=+\infty.$
Applying the monotone convergence theorem, we obtain
 \begin{equation*} \lim_{z\rightarrow+\infty}\mathbb{E}(\xi_T\digamma(z,\xi_T))=e^{-rT}L<x \quad\text{and}\quad \lim_{z\rightarrow0}\mathbb{E}(\xi_T\digamma(z,\xi_T))=+\infty>x. \end{equation*}
Then, the result follows from the intermediate value theorem.
With these two lemmas, the proof of Theorem 5.1 is wrapped up below.
Proof [Proof of Theorem 5.1]. With Assumption 2, 4 and the following observation
 \begin{equation*} \tilde{U}\left(X_T^{BRBU}\right)\leq (\eta+\kappa)(U(f(\xi_T))+U(L)+U\left(I\left(\frac{z}{\eta}\xi_T\right)\right)+U\left(I\left(\frac{z}{\kappa}\xi_T\right)\right), \end{equation*}
we have $ \mathbb{E}(\tilde{U}\left(X_T^{BRBU}\right))<\infty$
. Furthermore, let
$ \mathbb{E}(\tilde{U}\left(X_T^{BRBU}\right))<\infty$
. Furthermore, let $X_T$
be any admissible terminal wealth of Problem (5.1), we obtain
$X_T$
be any admissible terminal wealth of Problem (5.1), we obtain
 \begin{align*} \mathbb{E}(\tilde{U}(X_T)) & \leq \mathbb{E}\left(\tilde{U}(X_T)+z(x-\xi_TX_T\right) \leq\mathbb{E}\left(\sup_{X_T\geq L}\left(\tilde{U}(X_T)-z\xi_TX_T\right)\right)+xz\\ & = \mathbb{E}\left(\tilde{U}\left(X_T^{BRBU}\right)\right)+z\left(x- \mathbb{E}\left(\xi_TX_T^{BRBU}\right)\right) = \mathbb{E}\left(\tilde{U}\left(X_T^{BRBU}\right)\right), \end{align*}
where the first inequality follows from the budget constraint, the first equality follows from Lemma A.2, and the last equality follows from $\mathbb{E}\left(\xi_TX_T^{BRBU}\right)=x$
, which is possible according to Lemma A.3.
$\mathbb{E}\left(\xi_TX_T^{BRBU}\right)=x$
, which is possible according to Lemma A.3.
B. Bindingness, admissibility and properties of the LERL-PI solution
Having presented the LERL-PI solution in Section 4.2, this appendix studies the admissibility of Problem (4.1) when the parameters can change (ceteris paribus) and further explore properties implied by the optimal solution. Remark first that a related study of the LERL loss bound $\epsilon$
is completed in Section 4.1, wherein the condition
$\epsilon$
is completed in Section 4.1, wherein the condition $\underline{\epsilon}\leq\epsilon<\overline{\epsilon}$
ensures the bindingness of the LERL constraint.
$\underline{\epsilon}\leq\epsilon<\overline{\epsilon}$
ensures the bindingness of the LERL constraint.
In addition to the loss bound $\epsilon$
, the solvability of Problem (4.1) also depends on the initial capital x. Given that other parameters are fixed, we study the minimal and maximal capital such that the LERL constraint is active. In other words, for a minimal capital
$\epsilon$
, the solvability of Problem (4.1) also depends on the initial capital x. Given that other parameters are fixed, we study the minimal and maximal capital such that the LERL constraint is active. In other words, for a minimal capital $x_{min}$
(defined by (A.3)) and a maximal capital
$x_{min}$
(defined by (A.3)) and a maximal capital $x_{max}$
(defined by (A.2)), the LERL constraint is binding if
$x_{max}$
(defined by (A.2)), the LERL constraint is binding if $x_{min}\leq x < x_{max}$
.
$x_{min}\leq x < x_{max}$
.
First, we need to know how the Lagrange multipliers $\lambda_1$
and
$\lambda_1$
and $\lambda_2$
respond to the change of the initial capital x, which is the result of the following lemma.
$\lambda_2$
respond to the change of the initial capital x, which is the result of the following lemma.
Lemma A.4. Assume that the LERL loss bound $\epsilon$
and the minimum insurance level L are fixed, and the LERL constraint is active. We have
$\epsilon$
and the minimum insurance level L are fixed, and the LERL constraint is active. We have
 \begin{equation} \frac{\partial (\lambda_1-\lambda_2)}{\partial x}=0 \quad\text{and}\quad \frac{\partial \lambda_1}{\partial x}=\frac{\partial \lambda_2}{\partial x}<0. \end{equation}
With Lemma A.4, we can determine the minimal and maximal capital for which the LERL constraint is active. We first characterize $x_{max}$
in the next lemma.
$x_{max}$
in the next lemma.
Lemma A.5. Given that the LERL loss bound $\epsilon$
and the PI level L are fixed, if the initial capital x fulfills
$\epsilon$
and the PI level L are fixed, if the initial capital x fulfills
 \begin{equation} x \geq x_{max}\,:\!=\, \mathbb{E}(\xi_T\max\{I((\lambda_1-\lambda_2)\xi_T),L\}), \end{equation}
then the LERL constraint is not binding so that Problem (4.1) becomes a PI problem with a minimum constraint $X_T\geq L$
.
$X_T\geq L$
.
Proof. It is reported in Appendix C.1.
It is obvious that the LERL loss for $x=x_{max}$
is
$x=x_{max}$
is $\overline{\epsilon}$
(see (4.2)). So then, we study
$\overline{\epsilon}$
(see (4.2)). So then, we study $x_{min}$
and its corresponding optimal terminal wealth and LERL loss in the following lemma.
$x_{min}$
and its corresponding optimal terminal wealth and LERL loss in the following lemma.
Lemma A.6. Assume that the minimum insurance level L and the LERL loss bound $\epsilon$
are fixed, Problem (4.1) is admissible if the initial capital x satisfies
$\epsilon$
are fixed, Problem (4.1) is admissible if the initial capital x satisfies
 \begin{equation} x \geq x_{min} \,:\!=\, \mathbb{E}(\xi_T\max\{f(\xi_T),L\})-\epsilon. \end{equation}
Moreover, the LERL loss is $\underline{\epsilon}$
(see (4.5)), and the corresponding optimal terminal wealth
$\underline{\epsilon}$
(see (4.5)), and the corresponding optimal terminal wealth $X_T^{min}$
fulfills
$X_T^{min}$
fulfills
 \begin{equation} \left\{\omega\in\mathbf{\Omega}\,:\, X_T^{min}(\omega)>f(\xi_T(\omega))\right\} =\left\{\omega\in\mathbf{\Omega}\,:\, X_T^{min}(\omega)=L\text{ and }\xi_T(\omega)\geq\xi_L\right\}. \end{equation}
Proof. It is demonstrated in Appendix C.2.
The above deduction can also be seen as a sensitivity analysis of initial capital x. Further, the optimal terminal wealth $X_T^{min}$
where
$X_T^{min}$
where $x=x_{min}$
is shown in the next lemma.
$x=x_{min}$
is shown in the next lemma.
Lemma A.7. If $x=x_{min}$
, then the optimal terminal wealth
$x=x_{min}$
, then the optimal terminal wealth $X_T^{min}$
of Problem (4.1) is given by
$X_T^{min}$
of Problem (4.1) is given by
 \begin{equation*} X_T^{min} = \left\{\begin{array}{l@{\quad}r} f(\xi_T)\mathbf{1}_{\xi_T<\xi^{*}}+I(\lambda^{*}\xi_T)\mathbf{1}_{\xi^{*} \leq \xi_T<\xi_L^{*}}+L\mathbf{1}_{\xi_T\geq \xi_L^{*}}, & \text{Case (1)},\\[4pt] I(\lambda^{*}\xi_T)\mathbf{1}_{\xi_T<\xi^{*}}+f(\xi_T)\mathbf{1}_{\xi^{*} \leq \xi_T<\xi_L}+L\mathbf{1}_{\xi_T\geq \xi_L}, & \text{Case (2)},\\[4pt] X_T^{PI(L)}=\max\left\{I(\lambda^{PI(L)}\xi_T), L\right\}, &\text{Case (3)}, \end{array}\right. \end{equation*}
where $\xi^{*}$
is obtained by solving
$\xi^{*}$
is obtained by solving $f(\xi^{*})=I(\lambda^{*}\xi^{*})$
,
$f(\xi^{*})=I(\lambda^{*}\xi^{*})$
, $\xi^{*}_L=\frac{U^{\prime}(L)}{\lambda^{*}}$
, and
$\xi^{*}_L=\frac{U^{\prime}(L)}{\lambda^{*}}$
, and $\lambda^{*}$
and
$\lambda^{*}$
and $\lambda^{PI(L)}$
are computed by solving the budget constraint with equality.
$\lambda^{PI(L)}$
are computed by solving the budget constraint with equality.
Proof. It is a special case of Theorem 4.1 when the initial capital x tends to $x_{min}$
. We remark that the budget and LERL constraints are equivalent in this case.
$x_{min}$
. We remark that the budget and LERL constraints are equivalent in this case.
Let us now study the admissibility of Problem (4.1) with respect to the minimum insurance level L. We first perform a sensitivity analysis in the following lemma.
Lemma A.8. Fixing the LERL loss bound $\epsilon$
and the initial capital x, we have
$\epsilon$
and the initial capital x, we have
 \begin{align*} &\frac{\partial\lambda_1}{\partial L}\geq 0\quad\text{and}\quad \frac{\partial(\lambda_1-\lambda_2)}{\partial L}>0&{\text{Case (1)}},\\ &\frac{\partial\lambda_1}{\partial L}= \frac{\partial\lambda_2}{\partial L}>0&{\text{Case (2)}}. \end{align*}
and the sign of $\frac{\partial\lambda_2}{\partial L}$
is undetermined in Case (1).
$\frac{\partial\lambda_2}{\partial L}$
is undetermined in Case (1).
With the aid of Lemma A.8, we then discuss the influence of L on the solution to Problem (4.1) in the sequel. For Case (2), on the one hand, if we keep increasing L, then the optimal terminal wealth $X_T^{LERL}$
will eventually become
$X_T^{LERL}$
will eventually become $X_T^{min}$
, and thus, the LERL constraint is still active. On the other hand, if we keep lowering L, then the optimal terminal wealth
$X_T^{min}$
, and thus, the LERL constraint is still active. On the other hand, if we keep lowering L, then the optimal terminal wealth $X_T^{LERL}$
will eventually become
$X_T^{LERL}$
will eventually become $X_T^{PI(L)}$
; hence, the LERL constraint is not active anymore. It is due to how
$X_T^{PI(L)}$
; hence, the LERL constraint is not active anymore. It is due to how $x_{min}$
and
$x_{min}$
and $x_{max}$
respond to the change of L, namely
$x_{max}$
respond to the change of L, namely
 \begin{equation*} \frac{\partial x_{min}}{\partial L} =\mathbb{E}\left(\xi_T\mathbf{1}_{\xi_T\geq \xi_L}\right) >0 \quad\text{and}\quad \frac{\partial x_{max}}{\partial L} =\mathbb{E}\left(\xi_T\mathbf{1}_{\xi_T\geq \overline{\xi}_L}\right) >0,\end{equation*}
which implies that when L increases, $x_{min}$
reaches x, and
$x_{min}$
reaches x, and $X_T^{LERL}$
becomes
$X_T^{LERL}$
becomes $X_T^{min}$
. Likewise,
$X_T^{min}$
. Likewise, $x_{max}$
reaches x if we decrease L, and hence,
$x_{max}$
reaches x if we decrease L, and hence, $X_T^{LERL}$
becomes
$X_T^{LERL}$
becomes $X_T^{PI(L)}$
.
$X_T^{PI(L)}$
.
All in all, the introduction of PI constraint and the parameter L gives additional flexibility to change the range of $[x_{min},x_{max})$
and
$[x_{min},x_{max})$
and $[\underline{\epsilon},\overline{\epsilon})$
.
$[\underline{\epsilon},\overline{\epsilon})$
.
Remark A.1. One particular scenario for Case (1) is that $f(\xi_T)>L$
a.s. In this situation, we have
$f(\xi_T)>L$
a.s. In this situation, we have $\xi_L=+\infty$
. From the proof of Lemma A.8, we obtain
$\xi_L=+\infty$
. From the proof of Lemma A.8, we obtain
 \begin{equation*} \frac{\partial\lambda_1}{\partial L}= 0 \quad\text{and}\quad \frac{\partial(\lambda_1-\lambda_2)}{\partial L}>0. \end{equation*}
Finally, to complete the sensitivity analysis, we study how two Lagrange multipliers respond to the change of the LERL loss bound $\epsilon$
. The results are depicted in the following lemma.
$\epsilon$
. The results are depicted in the following lemma.
Lemma A.9. Assuming the initial capital x and the PI level L are fixed, we have
 \begin{equation*} \frac{\partial\lambda_1}{\partial\epsilon}<0,\quad \frac{\partial\lambda_2}{\partial\epsilon}<0,\quad \text{and}\quad\frac{\partial(\lambda_1-\lambda_2)}{\partial\epsilon}>0. \end{equation*}
C. Auxiliary technical proofs
C.1. Proof of Lemma A.5
From Lemma A.4, we can observe that if we increase x, then $\lambda_1$
and
$\lambda_1$
and $\lambda_2$
will decline, but
$\lambda_2$
will decline, but $\lambda_1-\lambda_2$
remains unchanged. Therefore, some level of x, we have
$\lambda_1-\lambda_2$
remains unchanged. Therefore, some level of x, we have $\lambda_2=0$
, which implies
$\lambda_2=0$
, which implies $\underline{\xi}=\overline{\xi}$
. Then, the optimal wealth
$\underline{\xi}=\overline{\xi}$
. Then, the optimal wealth $X_T^{LERL-PI}$
changes to
$X_T^{LERL-PI}$
changes to $\max\{I((\lambda_1-\lambda_2)\xi_T),L\}$
, which means the LERL constraint is not active anymore. So the capital level for this case is
$\max\{I((\lambda_1-\lambda_2)\xi_T),L\}$
, which means the LERL constraint is not active anymore. So the capital level for this case is $x_{max}$
defined by (A.2).
$x_{max}$
defined by (A.2).
C.2. Proof of Lemma A.6
Let $X_T$
be any admissible solution to Problem (4.1). Then, from the budget and LERL constraints, we have
$X_T$
be any admissible solution to Problem (4.1). Then, from the budget and LERL constraints, we have
 \begin{align*} x& \geq \mathbb{E}(\xi_TX_T) =\mathbb{E}(\xi_Tf(\xi_T)) - \mathbb{E}\left(\xi_T(f(\xi_T)-X_T)\mathbf{1}_{X_T\leq f(\xi_T)}\right) - \mathbb{E}\left(\xi_T(f(\xi_T)-X_T)\mathbf{1}_{X_T> f(\xi_T)}\right)\\[3pt] & \geq \mathbb{E}(\xi_Tf(\xi_T))-\epsilon + \mathbb{E}\left(\xi_T(X_T-f(\xi_T))\mathbf{1}_{X_T> f(\xi_T)}\right)\\[3pt] & \geq \mathbb{E}(\xi_Tf(\xi_T))-\epsilon + \mathbb{E}\left(\xi_T(L-f(\xi_T))\mathbf{1}_{\xi_T\geq \xi_L}\right)\\[3pt] & = \mathbb{E}(\xi_T\max\{f(\xi_T),L\})-\epsilon =x_{min},\end{align*}
and above inequalities become equalities if two constraints hold with equality and (A.4) is satisfied. Finally, we can infer that $\epsilon=\underline{\epsilon}$
for
$\epsilon=\underline{\epsilon}$
for $x=x_{min}$
according to Lemma 4.1.
$x=x_{min}$
according to Lemma 4.1.
D. On the interchange of expectation and derivative functionals
Throughout the paper, some computations require the interchange of expectation and derivative operators. This section depicts the rationale behind this operation (see similar results in, e.g., (Durrett, Reference Durrett2019, Appendix A.5)). The result can be easily generalized to the version with the conditional expectation.
Lemma A.10. Let X be a random variable defined on a probability space $(\mathbf{\Omega},\mathcal{F},\mathbb{P})$
and
$(\mathbf{\Omega},\mathcal{F},\mathbb{P})$
and $t\mapsto g(t,X)\in\mathbb{R}$
be a random function such that g(t,X) is a smooth function with respect to
$t\mapsto g(t,X)\in\mathbb{R}$
be a random function such that g(t,X) is a smooth function with respect to $t\in (a,b)$
and integrable for all
$t\in (a,b)$
and integrable for all $t\in (a,b)$
, where (a,b) is an open interval in the real line. Assume that there exists a random variable Y such that
$t\in (a,b)$
, where (a,b) is an open interval in the real line. Assume that there exists a random variable Y such that
 \begin{equation*} \forall t\in (a,b)\,:\,\left |\frac{\partial }{\partial t}g(t,X)\right |\leq Y\ a.s.\quad\text{and}\quad\mathbb{E}(Y)<+\infty. \end{equation*}
Then,
 \begin{equation*} \frac{\partial}{\partial t}\mathbb{E}(g(t,X)) =\mathbb{E}\left(\frac{\partial }{\partial t}g(t,X)\right). \end{equation*}
Proof. From the definition of the first derivative and the mean value theorem, we have
 \begin{equation*} \frac{\partial}{\partial t}\mathbb{E}(g(t,X)) =\lim_{h\rightarrow 0}\mathbb{E}\left(\frac{g(t+h,X)-g(t,X)}{h}\right) =\mathbb{E}\left(\lim_{h\rightarrow 0} \frac{\partial}{\partial t}g(\Lambda(h),X)\right)=\mathbb{E}\left(\frac{\partial }{\partial t}g(t,X)\right), \end{equation*}
where $\Lambda(h)\in(t,t+h)$
for each
$\Lambda(h)\in(t,t+h)$
for each $\omega\in\mathbf{\Omega}$
and the interchange of limit and expectation is guaranteed by the dominated convergence theorem since
$\omega\in\mathbf{\Omega}$
and the interchange of limit and expectation is guaranteed by the dominated convergence theorem since $\frac{\partial}{\partial t}g(\Lambda(h),X)\leq Y $
and
$\frac{\partial}{\partial t}g(\Lambda(h),X)\leq Y $
and $\mathbb{E}(Y)<+\infty.$
In this paper, we have to deal with the piecewise function, and the smoothness is not always satisfied. The following lemma allows circumventing this technical difficulty with an extra condition applied on non-differentiable points.
Lemma A.11. Let X be an atomless random variable defined on a probability space $(\mathbf{\Omega},\mathcal{F},\mathbb{P})$
and
$(\mathbf{\Omega},\mathcal{F},\mathbb{P})$
and $t \mapsto g(t,X)\in\mathbb{R}$
be a continuous random function of the form
$t \mapsto g(t,X)\in\mathbb{R}$
be a continuous random function of the form
 \begin{equation*} g(t,X)=\sum_{i=0}^ng_i(t,X)\mathbf{1}_{X\in[f_i(t),f_{i+1}(t))}, \end{equation*}
which satisfies the following properties:
-
(a) For all
$t\in[0,+\infty)$
,
$g_i(t,X)$
are integrable, that is,
$\mathbb{E}(g_i(t,X))<+\infty$
. -
(b) For all
$t\in[0,+\infty)$
,
$f_0(t)\equiv 0$
,
$f_{n+1}(t)=+\infty$
, and
$f_i(t)$
are differentiable functions for all
$i=1,\cdots,n$
. -
(c) For all
$i=0,\cdots,n$
,
$g_i(t,X)$
are continuously differentiable in
$(f_i(t),f_{i+1}(t))$
, and for all
$t\in (0,+\infty)$
, there exists a random variable
$Y_i$
such that
\begin{equation*} \left |\frac{\partial }{\partial t}g_i(t,X)\right |\leq Y_i \quad\text{and}\quad \mathbb{E}(Y_i)<+\infty. \end{equation*}
-
(d) For all
$i=0,\cdots,n-1$
,
$g_i(t,f_i(t))=g_{i+1}(t,f_{i}(t))$
. Then,
$\mathbb{E}(g(t,X))$
is differentiable, and (A.5)
\begin{equation} \frac{\partial}{\partial t}\mathbb{E}(g(t,X)) =\mathbb{E}\left(\sum_{i=1}^n\left(\frac{\partial}{\partial t}g_i(t,X)\right)\mathbf{1}_{X\in(f_i(t),f_{i+1}(t))}\right). \end{equation}


Proof. Since X is atomless, we have $\mathbb{E}(g(t,X)) =\mathbb{E}\left(\sum_{i=1}^ng_i(t,X)\mathbf{1}_{X\in(f_i(t),f_{i+1}(t))}\right),$
and the differentiability of
$\mathbb{E}(g(t,X)) =\mathbb{E}\left(\sum_{i=1}^ng_i(t,X)\mathbf{1}_{X\in(f_i(t),f_{i+1}(t))}\right),$
and the differentiability of $\mathbb{E}(g(t,X))$
follows from the differentiability of
$\mathbb{E}(g(t,X))$
follows from the differentiability of $\mathbb{E}(g_i(t,X)\mathbf{1}_{X\in(f_i(t),f_{i+1}(t))})$
, according to Lemma A.10. Then, we compute the following expression
$\mathbb{E}(g_i(t,X)\mathbf{1}_{X\in(f_i(t),f_{i+1}(t))})$
, according to Lemma A.10. Then, we compute the following expression
 \begin{equation*} \mathbb{E}\left(\sum_{i=0}^ng_i(t,X)\frac{\partial}{\partial t}\mathbf{1}_{X\in(f_i(t),f_{i+1}(t))}\right)= \sum_{i=1}^n\int_{-\infty}^{+\infty} \delta(X-f_{i}(t))f_{i}^{\prime}(t)(g_{i-1}(t,X)-g_i(t,X)) F_X(z)dz =0, \end{equation*}
where $\delta$
is the Dirac delta function,
$\delta$
is the Dirac delta function, $F_X$
is the probability density function of the distribution of X whose existence is guaranteed because X is atomless. The last equality follows from the definition of the Dirac delta function and (d). Then, we get the result (A.5) by applying the product rule to calculate
$F_X$
is the probability density function of the distribution of X whose existence is guaranteed because X is atomless. The last equality follows from the definition of the Dirac delta function and (d). Then, we get the result (A.5) by applying the product rule to calculate $\frac{\partial}{\partial t}\mathbb{E}(g(t,X))$
.
$\frac{\partial}{\partial t}\mathbb{E}(g(t,X))$
.


 Open access