


Loneliness is a psychosocial issue that has only recently become a focus of research. A PubMed search for the term “loneliness” reveals a 19th-century record (Loneliness, 1890); however, at that time the concept carried strong religious connotations. It was not until the mid-20th century that some authors began to approach the term from a mental health perspective (Fromm-Reichmann, Reference Fromm-Reichmann1959), marking the beginning of scientific research on the topic.
According to the World Health Organization (2025), the global prevalence of loneliness is estimated at 16%, affecting approximately 1.2 billion people worldwide. Overall, the lower a country’s income level, the higher the reported rate of loneliness. Low-income countries show the highest prevalence (24.3%), followed by lower-middle-income countries (19.3%), upper-middle-income countries (12.1%), and high-income countries (10.6%). In Spain, the prevalence of loneliness is 20%, with two-thirds of individuals reporting continuous experiences over the past two years; among young people aged 18–24, the rate increases markedly to 34.6% (Observatorio Estatal de la Soledad No Deseada, 2024). These figures highlight the urgent need for continued research to deepen understanding of the phenomenon, enhance early detection, and guide the design of effective interventions.
There is no widespread consensus regarding the definition of loneliness. The oldest definition may be Sullivan’s (Reference Sullivan1953), which states that “(…) for the feeling ordinarily called loneliness, which is the exceedingly unpleasant and driving experience connected with inadequate discharge of the need for human intimacy, for interpersonal intimacy” (p. 290). Other authors have proposed operational definitions, such as Peplau and Perlman (Reference Peplau, Perlman, Peplau and Perlman1982), who defined it as “loneliness is the unpleasant experience that occurs when a person’s network of social relations is deficient in some important way, either quantitatively or qualitatively” (p. 31). Similarly, Hawkley and Cacioppo (Reference Hawkley and Cacioppo2010) describe it as “a distressing feeling that accompanies the perception that a person’s social needs are not being met by the quantity or, especially, the quality of their social relationships” (p. 218). Weiss (Reference Weiss1973) distinguishes two dimensions of loneliness: emotional loneliness, which is caused by a perceived absence of a significant other providing emotional support and mutual assistance (i.e., a partner or close friend); and social loneliness, which refers to the perceived absence of quality relationships with family, friends, and loved ones, or rather, feelings associated with not belonging to a social network or community. Considering both types of loneliness separately is more effective for a deeper understanding of the phenomenon (Dahlberg & McKee, Reference Dahlberg and McKee2014). Factor analysis studies have shown that the experience of loneliness can be divided into separable dimensions (Hawkley et al., Reference Hawkley, Browne and Cacioppo2005; Knight et al., Reference Knight, Chisholm, Marsh and Godfrey1988; McWhirter, Reference McWhirter1990a), although the high correlations observed between these factors have also supported treating loneliness as a unidimensional construct (Hawkley et al., Reference Hawkley, Browne and Cacioppo2005; Russell, Reference Russell1996; Russell et al., Reference Russell, Peplau and Cutrona1980). A critical review of the definitions is provided by De Jong Gierveld (Reference De Jong Gierveld1998). More recently, theoretical formulations emerging from a variety of successive frameworks—psychodynamic, behavioral, cognitive, existential, affective, developmental-generic, sociological, and integrative—have been examined. This body of work concludes that loneliness is a complex problem that demands diverse perspectives, while also calling for an integrative approach that fosters dialogue among different theoretical traditions (Barrio-Formoso, Reference Barrio-Formoso2024). Nevertheless, there are some common elements in all the definitions proposed: (1) emotional isolation or a lack of emotionally significant relationships; (2) the discomfort experienced; and (3) the fact that it is a subjective, not an objective, feeling.
Loneliness has been linked to a wide array of psychological conditions and issues, ranging from low self-esteem, depression, and introversion to deficits in cognitive performance and social skills, among many others (Hawkley & Cacioppo, Reference Hawkley and Cacioppo2010). In fact, various theories have been developed to explain these associations, with the social skills deficit vulnerability model being particularly well known, as it helps clarify the relationship between interpersonal communication factors and mental health. This model posits that people with low levels of social skills struggle to cope with stress and life transitions and experience poorer quality of life—factors directly linked to loneliness (Segrin et al., Reference Segrin, McNelis and Swiatkowski2016). In turn, low levels of social skills are associated with mental health problems due to lower satisfaction of basic psychological needs, specifically autonomy, competence, and relatedness (Vansteenkiste et al., Reference Vansteenkiste, Ryan and Soenens2020). From an individual perspective, skills such as emotion recognition, empathy, and emotional regulation are crucial abilities enabling individuals to understand, share, and regulate their feelings and those of others (Di Tella, Adenzato, et al., Reference Di Tella, Adenzato, Catmur, Miti, Castelli and Ardito2020; Di Tella, Mitti, et al., Reference Di Tella, Miti, Ardito and Adenzato2020).
A recent study with a sample of nearly 50,000 participants found that the risk of depression is five times higher among those experiencing loneliness compared to those who never or almost never report it, with a significantly greater relative risk observed in women (Akinyemi et al., Reference Akinyemi, Abdulrazaq, Fasokun, Ogunyankin, Ikugbayigbe, Nwosu, Michael, Hughes and Ogundare2025). According to Leary’s (Reference Leary1990) theory, individuals who do not feel part of supportive groups, that is, those who experience interpersonal isolation or rejection, tend to exhibit lower self-esteem. In this view, self-esteem serves as an internal indicator of the relational value an individual perceives in their social interactions, suggesting that loneliness can directly influence self-perception (Cacioppo et al., Reference Cacioppo, Hawkley, Ernst, Burleson, Berntson, Nouriani and Spiegel2006; Leary, Reference Leary2005). Indeed, Cacioppo et al. (Reference Cacioppo, Hawkley, Ernst, Burleson, Berntson, Nouriani and Spiegel2006) provided empirical evidence that a greater sense of loneliness predicts lower self-esteem, even when controlling for other personality factors such as impulsivity, emotional stability, agreeableness, conscientiousness, shyness, and sociability. Moreover, several studies across various age groups have shown that loneliness negatively impacts self-esteem, creating a cycle where diminished self-esteem further intensifies loneliness (Geukens et al., Reference Geukens, Maes, Spithoven, Pouwels, Danneel, Cillessen, Van den and Goossens2020; Haines et al., Reference Haines, Scalise and Ginter1993; Szcześniak et al., Reference Szcześniak, Bielecka, Madej, Pieńkowska and Rodzeń2020; Teneva & Lemay, Reference Teneva and Lemay2020). At the same time, loneliness has been consistently associated with perceived stress, defined as the appraisal of life situations as unpredictable, uncontrollable, and overwhelming (Cohen et al., Reference Cohen, Kamarck and Mermelstein1983). Empirical evidence suggests that loneliness not only increases the perception of daily stressors but also heightens physiological stress responses (Doane & Adam, Reference Doane and Adam2010; Pressman et al., Reference Pressman, Cohen, Miller, Barkin, Rabin and Treanor2005), while stress also prospectively predicts increases in loneliness, highlighting a bidirectional relationship (Hawkley & Cacioppo, Reference Hawkley and Cacioppo2010; Zawadzki et al., Reference Zawadzki, Graham and Gerin2013).
Some authors argue that equating loneliness with any single characterization or even with a combination of them is misguided (Cacioppo et al., Reference Cacioppo, Hawkley, Ernst, Burleson, Berntson, Nouriani and Spiegel2006). Loneliness is understood as a unique condition, wherein an individual perceives themselves to be socially isolated, even in the presence of others, with adverse effects that are not due to the peculiarities of those experiencing it but rather to the impact of loneliness on otherwise ordinary individuals (Cacioppo & Cacioppo, Reference Cacioppo and Cacioppo2018). Consequently, the detection of loneliness is proposed as a key action for identifying the characteristics and deficits associated with it in each individual (Hawkley & Cacioppo, Reference Hawkley and Cacioppo2010).
Many studies challenge the widespread belief that loneliness is a common experience exclusively among older people (De Jong Gierveld & Van Tilburg, Reference De Jong Gierveld and Van Tilburg2010; Luhmann & Hawkley, Reference Luhmann and Hawkley2016; Nicolaisen & Thorsen, Reference Nicolaisen and Thorsen2014; Olson & Wong, Reference Olson and Wong2001). In this regard, research has revealed inconsistent findings (Barreto et al., Reference Barreto, Victor, Hammond, Eccles, Richins and Qualter2021; Luhmann & Hawkley, Reference Luhmann and Hawkley2016; Nicolaisen & Thorsen, Reference Nicolaisen and Thorsen2014; Victor & Yang, Reference Victor and Yang2012). Following a systematic review and meta-analysis of studies on the prevalence of loneliness worldwide (all referring to the years 2000 to 2019 and based on representative national samples), the authors found a scarcity of studies addressing loneliness in youth and middle-aged adults (Surkalim et al., Reference Surkalim, Luo, Eres, Gebel, van Buskirk, Bauman and Ding2022). Thus, loneliness should not be regarded solely as a phenomenon of older adults; rather, it has received comparatively less attention among young and middle-aged individuals. Several studies indicate a bimodal distribution with higher prevalence among adolescents and young adults under 30 years old and individuals over 65 (Lasgaard et al., Reference Lasgaard, Friis and Shevlin2016; Luhmann & Hawkley, Reference Luhmann and Hawkley2016; Nicolaisen & Thorsen, Reference Nicolaisen and Thorsen2014; Victor & Yang, Reference Victor and Yang2012). Loneliness can emerge at any stage of a person’s life and fluctuate over time (Barreto et al., Reference Barreto, Victor, Hammond, Eccles, Richins and Qualter2021; Luhmann & Hawkley, Reference Luhmann and Hawkley2016; Martín & González-Rábago, Reference Martín and González-Rábago2021). Loneliness is often associated with young people affected by precarious living situations and social processes of individualization (Barreto et al., Reference Barreto, Victor, Hammond, Eccles, Richins and Qualter2021), poor physical health (Lasgaard et al., Reference Lasgaard, Friis and Shevlin2016), and limited social relationships (Nicolaisen & Thorsen, Reference Nicolaisen and Thorsen2014). Social inequalities play an important role in shaping loneliness among young adults aged 25–44 years (Martín & González-Rábago, Reference Martín and González-Rábago2021).
There has been a notable increase in the prevalence of loneliness in recent decades (Ausín et al., Reference Ausín, González-Sanguino, Castellanos, Saiz, López-Gómez and Ugidos2021; Baarck et al., Reference Baarck, d’Hombres and Tintori2022; Berlingieri et al., Reference Berlingieri, Colagrossi and Mauri2023; Buecker et al., Reference Buecker, Mund, Chwastek, Sostmann and Luhmann2021), sparking interest not only within scientific fields but also gradually transforming it into a sociopolitical issue. Various studies have found prevalence rates ranging from 10% to 30% (Beutel et al., Reference Beutel, Klein, Brähler, Reiner, Jünger, Michal, Wiltink, Wild, Münzel, Lackner and Tibubos2017; Buecker et al., Reference Buecker, Mund, Chwastek, Sostmann and Luhmann2021; Matthews et al., Reference Matthews, Danese, Caspi, Fisher, Goldman-Mellor, Kepa, Moffitt, Odgers and Arseneault2019; Victor & Yang, Reference Victor and Yang2012), considering it a public health problem (Cacioppo & Cacioppo, Reference Cacioppo and Cacioppo2018; Lasgaard et al., Reference Lasgaard, Friis and Shevlin2016; Williams & Braun, Reference Williams and Braun2019) that significantly undermines mental health and psychosocial functioning (Beutel et al., Reference Beutel, Klein, Brähler, Reiner, Jünger, Michal, Wiltink, Wild, Münzel, Lackner and Tibubos2017; McWhirter, Reference McWhirter1990b).
On the other hand, loneliness varies according to social contexts and sociocultural changes over time (i.e., Cacioppo et al., Reference Cacioppo, Grippo, London, Goossens and Cacioppo2015; Díez & Morenos, Reference Díez and Morenos2015; OECD, 2020; Twenge et al., Reference Twenge, Spitzberg and Campbell2019; Tyler, Reference Tyler2002; Vidal & Halty, Reference Vidal, Halty, Blanco, Chueca, López-Ruiz and Mora2020), and this is illustrated by the impact of the COVID-19 pandemic (Ausín et al., Reference Ausín, González-Sanguino, Castellanos, Saiz, López-Gómez and Ugidos2021). In fact, the European Commission report Loneliness in the EU—Insights from surveys and online media data (Baarck et al., Reference Baarck, Balahur, Cassio, d’Hombres, Pásztor and Tintori2021)—indicated that reported loneliness doubled in all age groups during the first few months of the pandemic, with people aged 18–25 being the most affected; in this group, reported loneliness quadrupled. In the case of Spain, the levels of loneliness also significantly increased among young people during the first year of the pandemic (Ausín et al., Reference Ausín, González-Sanguino, Castellanos, Saiz, López-Gómez and Ugidos2021; Clavero & Ausín, Reference Clavero and Ausín2022; Vidal & Halty, Reference Vidal, Halty, Blanco, Chueca, López-Ruiz and Mora2020), with a growing trend in subsequent years, much like what was found by Casal et al. (Reference Casal, Rivera and Rodríguez-Míguez2023), who reported that the youngest members of society experience greater loneliness compared to older adults. Specifically in the city of Madrid, people in the youngest age group (15–29 years) showed the highest prevalence of loneliness at 19.4% (Blasco-Novalbos et al., Reference Blasco-Novalbos, Díaz-Zubiaur, Esteban-Rodríguez, González-Espejito, Infante-Sanz, del Moral-Luque, Díaz-Olalla, del Moral-Luque, Blasco-Novalbos and Lahuerta-Galán2024; Madrid Salud, 2023).
Besides the pandemic, several sociological factors have triggered substantial changes in the ways and frequency with which people in various social groups experience loneliness. Among these factors are the sociological characteristics of emerging adulthood (Paulsen et al., Reference Paulsen, Syed, Trzesniewski, Donnellan and Arnett2014; Settersten, Reference Settersten, Waters, Carr and Holdaway2011), the growing trend of individualism in the Western world (Lykes & Kemmelmeier, Reference Lykes and Kemmelmeier2014), and the instability of romantic relationships due to contemporary social changes and technological transformations (Buecker et al., Reference Buecker, Mund, Chwastek, Sostmann and Luhmann2021). In addition, increasing longevity and population aging (Brandts et al., Reference Brandts, van Tilburg, Bosma, Huisman and van den Brandt2021), along with the impact of certain political decisions (Yan et al., Reference Yan, Yang, Wang, Zhao and Yu2014), contribute to these changes. Particularly relevant is the widespread adoption of Internet use in all age groups and, notably, the emergence and proliferation of social media platforms, which have influenced the experience of loneliness, especially among the youngest (O’Day & Heimberg, Reference O’Day and Heimberg2021).
Several systematic reviews and meta-analyses have highlighted the limited effectiveness of interventions aimed at reducing loneliness across different populations (Cattan et al., Reference Cattan, White, Bond and Learmouth2005; Dickens et al., Reference Dickens, Richards, Greaves and Campbell2011; Findlay, Reference Findlay2003; Massi et al., Reference Massi, Chen, .C. and Cacioppo2011). Overall, these modest outcomes are generally attributed to limited theoretical grounding and the use of activities with little personal relevance for participants.
In view of all the foregoing, evaluating loneliness in all age groups and in different sociocultural contexts is crucial, and this can only be done by asking people, as there is no objective alternative to do so. There is no consensus within the scientific community regarding a single tool for measuring loneliness. However, two main approaches are generally used for its empirical assessment (Casal et al., Reference Casal, Rivera and Rodríguez-Míguez2023; Victor et al., Reference Victor, Grenade and Boldy2005). One approach relies on the direct self-report item “How often have you felt lonely?” with several response categories ranging from “Never or almost never” to “Always or almost always.” It is one of the most widely used methods due to its simplicity (Sancho et al., Reference Sancho, Barrio, Díaz-Veiga, Marsillas and Prieto2020), which enables a quick comparison across populations in epidemiological studies, even though it is not free of problems (De Jong Gierveld et al., Reference De Jong Gierveld, Van Tilburg, Dykstra, Vnagelisti and Perlman2006; Sancho et al., Reference Sancho, Barrio, Díaz-Veiga, Marsillas and Prieto2020). Single-item measures are especially vulnerable to underreporting due to the stigma attached to loneliness and cannot capture its multidimensional nature (Victor et al., Reference Victor, Grenade and Boldy2005). The more common approach involves questionnaires that meet prevailing psychometric standards (i.e., De Jong Gierveld & Kamphuis, Reference De Jong Gierveld and Kamphuis1985; Expósito & Moya, Reference Expósito, Moya, Loscertales and Marín1993; Russell et al., Reference Russell, Peplau and Ferguson1978; Vázquez & Jiménez, Reference Vázquez and Jiménez1994). Two of the most commonly used in research into loneliness are the University of California at Los Angeles (UCLA) Loneliness Scale (Russell et al., Reference Russell, Peplau and Ferguson1978; Russell, Reference Russell1996) and the De Jong Gierveld Loneliness Scale (De Jong Gierveld & Kamphuis, Reference De Jong Gierveld and Kamphuis1985). The UCLA is the most widely used internationally due to its internal consistency, but it was developed in the 1970s among U.S. college students, shows inconsistent factor structures, and has limited validity across ages and cultures (Buecker et al., Reference Buecker, Mund, Chwastek, Sostmann and Luhmann2021). Indeed, evidence suggests that measurement invariance across age groups should not be assumed, leading some scholars to question “whether a new scale altogether would be advantageous” (Panayiotou et al., Reference Panayiotou, Badcock, Lim, Banissy and Qualter2023; p. 1705). Establishing measurement invariance across demographic groups is therefore essential to ensure that differences in loneliness scores reflect true variations rather than artifacts of measurement. In particular, invariance testing across gender and age allows researchers to validly compare latent means, associations, and prevalence estimates, providing the basis for robust cross-group inferences (Meredith, Reference Meredith1993; Millsap, Reference Millsap2011; Putnick & Bornstein, Reference Putnick and Bornstein2016; Vandenberg & Lance, Reference Vandenberg and Lance2000). The De Jong Gierveld scale has the advantage of distinguishing emotional and social loneliness, but its applicability is reduced among young adults and it does not capture newer forms of disconnection linked to digital communication and contemporary precarious conditions (Barreto et al., Reference Barreto, Victor, Hammond, Eccles, Richins and Qualter2021). Brief instruments such as the Three-Item Loneliness Scale (Hughes et al., Reference Hughes, Waite, Hawkley and Cacioppo2004) or the Campaign to End Loneliness Measurement Tool (2022) are useful in applied and large-scale surveys but lack depth and show limited psychometric evidence in diverse cultural settings. However, it should be noted that most of the questionnaires that exist were designed based on a sociocultural context that has already been overcome and psychometric techniques that are now obsolete (Koğar & Yılmaz-Koğar, Reference Koğar and Yılmaz-Koğar2023; Sancho et al., Reference Sancho, Barrio, Díaz-Veiga, Marsillas and Prieto2020; Victor et al., Reference Victor, Grenade and Boldy2005). Some aspects that are crucial nowadays were not even considered in loneliness research at the time, such as the connection between Internet and social media use and loneliness (O’Day & Heimberg, Reference O’Day and Heimberg2021; Pedrero-Pérez et al., Reference Pedrero-Pérez, Haro-León, Marínez-Sevilla and Díaz-Zubiaur2024). In addition, in the Spanish context, the most widely used adaptations (Expósito & Moya, Reference Expósito, Moya, Loscertales and Marín1993; Vázquez & Jiménez, Reference Vázquez and Jiménez1994) were developed decades ago under psychometric standards that have since been surpassed, raising questions about their cultural relevance for contemporary populations. This limitation is particularly relevant given that recent epidemiological studies in Spain have documented a sharp increase in loneliness among younger age groups (Ausín et al., Reference Ausín, González-Sanguino, Castellanos, Saiz, López-Gómez and Ugidos2021; Casal et al., Reference Casal, Rivera and Rodríguez-Míguez2023), a phenomenon closely linked to precarious living conditions and the widespread use of digital technologies (Vidal & Halty, Reference Vidal, Halty, Blanco, Chueca, López-Ruiz and Mora2020).
In response to these limitations, the Madrid Loneliness Questionnaire (MLQ) was specifically designed to fill three critical gaps identified in the literature on loneliness measurement. The first gap concerns the neglect of behavioral and socioemotional competencies. While prior instruments tend to focus on perceived isolation, they rarely capture the role of social efficacy, emotional expressivity, and fear of rejection—factors consistently shown to shape vulnerability to loneliness and its maintenance (Di Tella, Adenzato et al., Reference Di Tella, Adenzato, Catmur, Miti, Castelli and Ardito2020; Di Tella, Mitti, et al., Reference Di Tella, Miti, Ardito and Adenzato2020; Segrin et al., Reference Segrin, McNelis and Swiatkowski2016). By incorporating these elements, the MLQ acknowledges that loneliness is not only a matter of absent ties but also of behavioral processes that constrain access to meaningful connection. The second gap relates to the romantic domain. Although the literature has long identified romantic loneliness as a distinct and impactful form of disconnection (Cacioppo & Patrick, Reference Cacioppo and Patrick2008; DiTommaso & Spinner, Reference DiTommaso and Spinner1993), most general scales either ignore it or reduce it to marital status. The MLQ integrates this domain explicitly, focusing on the quality and adequacy of intimate bonds, thus capturing a critical relational context where intimacy, support, and belonging are negotiated (Mund & Johnson, Reference Mund and Johnson2021). The third gap concerns the affective evaluation of social bonds. Traditional scales often reduce this to perceived support or trust, but emotional isolation encompasses broader experiences of disappointment, lack of comprehension, and the feeling of being let down by significant others. In line with Weiss’s (Reference Weiss1973) conceptualization of emotional loneliness and subsequent evidence linking these appraisals to distress and mental health problems (Bernardon et al., Reference Bernardon, Babb, Hakim-Larson and Gragg2011; Lazuras et al., Reference Lazuras, Ypsilanti and Mullings2024), the MLQ operationalizes emotional isolation as a distinct facet of loneliness itself, rather than a correlate. By addressing these three gaps—behavioral, relational, and affective—the MLQ advances beyond existing instruments, which often remain culturally outdated, conceptually narrow, or psychometrically unstable across age groups, and offers a tool empirically grounded in the contemporary Spanish context while also being potentially applicable to other sociocultural settings with similar relational, political, and technological conditions.
Given the inconsistencies and contextual limitations of existing measures, and in light of the three gaps identified—namely, the neglect of behavioral competencies, the absence of the romantic domain, and the reduction of emotional isolation to narrow constructs such as support or trust—the development of a new instrument requires more than methodological refinement: it demands a clear theoretical foundation. In this regard, our goal is to develop a new measure that, beyond existing instruments, is empirically validated in the contemporary Spanish context and designed to be relevant to other comparable Western sociocultural settings. Our aim is therefore to provide researchers and professionals with a psychometrically sound instrument that responds to current theoretical debates and addresses the practical challenges of assessing loneliness in today’s societies.
Theoretical Framework of the MLQ
Building on classical and contemporary perspectives, loneliness can be understood as a multidimensional phenomenon that arises when individuals perceive a lack of meaningful social connection. As the interactional model suggests, it is not simple social isolation that generates distress but the absence of interactions that are subjectively significant and emotionally valuable (Wigfield et al., Reference Wigfield, Turner, Alden, Green and Karania2022). In line with symbolic interactionism, meanings are generated through interaction and continuously reshaped through interpretation so that individuals act based on the meanings they ascribe to their relationships (Carter & Lamoreaux, Reference Carter, Lamoreaux and Liamputtong2023). From this perspective, loneliness is not only the absence of objective ties but also the product of the symbolic value attributed to them, reflecting both individual appraisals and broader social contexts. Figure 1 summarizes this dynamic process, showing how individual and contextual factors converge within the interactional space and are subjectively evaluated, leading either to well-being or to loneliness. This view suggests that loneliness is not a static state but a behavioral response emerging from the interplay between individual skills, relational contexts, and affective evaluations of support.
Conceptual model of the interaction between individual and contextual factors in shaping loneliness. Note: The MLQ is designed to capture three core pathways within this broader framework: social skills, partner relationships, and emotional isolation.

Figure 1. Long description
At the top of the diagram, two large rectangular boxes represent the primary inputs. On the left is Individual factors, and on the right is Contextual factors.
Below Individual factors is a vertical list of contributing elements: Personality, Self-esteem, Attitudes, Interpersonal skills, Personal Resources, Expectations, Mental and physical health, and Values. An arrow curves from this list into the Individual factors box.
Below Contextual factors is a vertical list of contributing elements: Economic, Support Network, Available Resources, Cultural, Family, Policies, Technological, and Neighborhood. An arrow curves from this list into the Contextual factors box.
Both the Individual factors and Contextual factors boxes have arrows pointing downward into a large central rounded rectangle labeled INTERACTION SPACE.
From the bottom of the INTERACTION SPACE, an arrow points to a box labeled INDIVIDUAL EVALUATION. This box branches into two horizontal paths.
The top path leads through an oval labeled MEANINGFUL EXPERIENCES to a rounded rectangle labeled WELFARE.
The bottom path leads through an oval labeled NON-SIGNIFICANT EXPERIENCES to a dark gray rounded rectangle labeled LONELINESS.
From this integrative standpoint, three interrelated domains are particularly salient for capturing the complexity of loneliness: social skills, partner relationships, and emotional isolation. In the model (Figure 1), social skills are located among the individual factors that shape the interaction context, representing the behavioral competencies required to initiate and sustain rewarding exchanges. Beyond observable interactional abilities, this dimension reflects self-perceptions of social efficacy and expectations of acceptance or rejection, processes that strongly influence the capacity to approach others. Individuals who feel socially insecure, fear rejection, or struggle to express their emotions often perceive themselves as less able to connect with others, which amplifies loneliness (e.g., Moeller & Seehuus, Reference Moeller and Seehuus2019; Segrin, Reference Segrin2000). While many studies have traditionally treated social skills as predictors of loneliness (Segrin et al., Reference Segrin, McNelis and Swiatkowski2016), here we conceptualize them as a facet of the construct itself: they are part of the behavioral dimension through which loneliness manifests and sustains itself. This is consistent with the social skills deficit vulnerability model, which posits that deficits in interpersonal competencies hinder coping with stress, adaptation to transitions, and quality of life. Moreover, such difficulties frustrate basic psychological needs for autonomy, competence, and relatedness (Vansteenkiste et al., Reference Vansteenkiste, Ryan and Soenens2020), reinforcing the cycle of disconnection. Research further highlights the role of socioemotional skills such as emotion recognition, empathy, and emotional regulation, which allow individuals to understand and share feelings with others; their absence is consistently linked to greater loneliness and poorer mental health (Di Tella, Adenzato et al., Reference Di Tella, Adenzato, Catmur, Miti, Castelli and Ardito2020, Di Tella, Mitti, et al., Reference Di Tella, Miti, Ardito and Adenzato2020). These behavioral and socioemotional factors are thus critical entry points in the subjective experience of loneliness.
Yet these behavioral factors do not operate in isolation: their impact is shaped by the relational contexts in which individuals attempt to connect. Within the interaction context of the model (Figure 1), partner relationships represent a critical domain where individual and contextual influences converge. Romantic ties provide a privileged arena for intimacy, support, and validation, and their absence or poor quality has been identified as a distinct source of loneliness—termed romantic loneliness (Cacioppo & Patrick, Reference Cacioppo and Patrick2008; DiTommaso & Spinner, Reference DiTommaso and Spinner1993). Importantly, research shows that loneliness can emerge not only from the absence of a partner but also from the discrepancy between desired and actual levels of intimacy. In this sense, it is the quality and subjective satisfaction with romantic bonds that determine whether they protect against or contribute to loneliness (Adamczyk, Reference Adamczyk2016). While previous work has often approached romantic ties as correlates of loneliness, in the MLQ they are treated as a facet of the construct, capturing the specific way in which unmet needs for intimacy and closeness contribute to the experience of loneliness. Longitudinal findings confirm bidirectional effects: loneliness predicts lower relationship satisfaction, while dissatisfaction intensifies loneliness (Mund & Johnson, Reference Mund and Johnson2021). Thus, this domain reflects both the objective availability of intimate relationships and the subjective evaluation of their adequacy. At the same time, the relational context interacts with individual competencies, since communication problems, inexpressiveness, or lack of empathy may erode satisfaction and reinforce loneliness for both partners. This interplay illustrates how behavioral and relational dimensions converge within a critical social sphere.
Emotional isolation, in turn, is positioned in the model (Figure 1) within the stage of individual appraisal. It reflects the appraisal of whether social experiences are meaningful or non-significant, particularly in relation to support, understanding, and closeness from significant others. This dimension captures not only the perception of limited availability of support but also experiences of disappointment, lack of comprehension, and feelings of being let down by family and friends. Trust emerges as a central element here: perceiving that few people are reliable or genuinely interested in one’s problems exacerbates the sense of isolation. Research confirms that the emotional burden of loneliness, defined by its affective valence and intensity, predicts depression and anxiety beyond the simple occurrence of loneliness (Lazuras et al., Reference Lazuras, Ypsilanti and Mullings2024). Similarly, a lack of perceived support remains a powerful predictor of loneliness even when objective contact is present (Pierce et al., Reference Pierce, Sarason and Sarason1991). While often treated as a correlate of poorer social support, we argue that emotional isolation should be conceptualized as a facet of loneliness itself, reflecting the affective dimension of how individuals evaluate their social bonds. This interpretation distinguishes it from narrower constructs such as perceived social support, rejection sensitivity, or interpersonal trust: whereas these focus on specific external resources or individual dispositions, emotional isolation encompasses the broader subjective judgment that one lacks reliable, supportive, and emotionally significant connections, in line with classical definitions of emotional loneliness (Bernardon et al., Reference Bernardon, Babb, Hakim-Larson and Gragg2011; Weiss, Reference Weiss1973). Network analyses further show that loneliness tends to cluster socially and can spread across ties, marginalizing individuals to the periphery of networks and transmitting across others (Cacioppo et al., Reference Cacioppo, Fowler and Christakis2009). These findings underscore that emotional isolation cannot be disentangled from behavioral and relational factors, as each reinforces the other within broader social structures.
Taken together, the model depicted in Figure 1 provides the backdrop against which the MLQ was developed. This framework clarifies why the three domains included in the MLQ are not heterogeneous or arbitrarily combined but rather interrelated facets of the same overarching construct. Social skills represent the behavioral means through which individuals seek connection; partner relationships provide a central relational context in which intimacy and belonging are negotiated; and emotional isolation captures the affective evaluations that ultimately determine whether such bonds are perceived as supportive or deficient. Consistent with recent evidence, loneliness is best conceptualized as multidimensional but convergent, in which distinct domains interact to produce the subjective experience of disconnection from meaningful social bonds (Adamczyk, Reference Adamczyk2016; Lazuras et al., Reference Lazuras, Ypsilanti and Mullings2024; Wigfield et al., Reference Wigfield, Turner, Alden, Green and Karania2022). The MLQ thus offers a theoretically coherent and empirically grounded model that reflects contemporary advances in the study of loneliness.
Therefore, the main objective of this study is to develop a questionnaire adapted to today’s sociocultural context to reliably and validly detect and measure loneliness, using the most up-to-date psychometric methods of analysis. The specific objectives of the questionnaire are as follows: it should be brief, applicable to a wide age range (initially, 18 years and older), applicable to individuals of all genders, easy to score, and capable of estimating the different dimensions of loneliness. Moreover, the questionnaire aims to be a versatile tool, useful not only in the field of psychology but also across professional contexts such as social work, social intervention, and healthcare. Its primary purpose is to enable early detection and prevention of loneliness, facilitating timely interventions across diverse populations.
Method
Participants
A sample of the general population of 1,606 participants was recruited. Atypical and inconsistent scores (outliers) were excluded (n = 80; 5%), resulting in a final valid sample of 1,526 participants (age range: 18–87; M = 48.47; SD = 14.44) for the study. The estimated precision for this sample, with a 95% confidence level and an expected prevalence of loneliness of 15%, was d = 1.7. Table 1 shows the descriptive data of the sample. The inclusion criteria were: (1) participants had to be of legal age and (2) they had to provide explicit consent for the anonymous use of their responses.
Descriptive statistics of the study sample (n = 1,526)

Table 1. Long description
The table consists of two columns: Sociodemographic data and n (%).
* Gender: Male accounts for 350 (22.94%) and Female accounts for 1,176 (77.06%).
* Age: 18 to 30 years accounts for 229 (15.01%); 31 to 50 years accounts for 533 (34.93%); 51 to 65 years accounts for 617 (40.43%); and Over 65 years old accounts for 147 (9.63%).
* Level of studies: Compulsory accounts for 134 (8.80%); Post-compulsory secondary accounts for 233 (15.27%); and Higher accounts for 1,159 (76.00%).
* How often have you felt lonely in the last year?: Never or almost never accounts for 447 (29.29%); A few times accounts for 577 (37.81%); Rather often accounts for 439 (28.77%); and Always or almost always accounts for 63 (4.13%).
Note: Values are presented as absolute frequencies and percentages.
Note: Values are presented as absolute frequencies and percentages. Loneliness frequency was assessed with the item “How often have you felt lonely in the last year?” with response options: Never or almost never, A few times, Rather often, and Always or almost always.
Instruments
Basic sociodemographic data were collected via closed-ended questions on age, gender, and educational attainment. A single-item measure assessed participants’ subjective perception of loneliness frequency over the past year: “How often have you felt lonely in the last year?” Response options were: “Always or almost always,” “Rather often,” “A few times,” and “Never or almost never.”
Madrid Loneliness Questionnaire
The MLQ was initially designed as a 29-item self-report instrument (Díaz-Zubiaur et al., Reference Díaz-Zubiaur, González-Espejito, Sevilla-Martínez, Haro-León, Pedrero-Pérez, Calatrava-Sánchez, Esteban-Rodríguez, Lillo-López and Blasco-Novalbos2023). Items were rated on a four-point Likert scale ranging from 0 (Strongly disagree) to 3 (Strongly agree), with higher total scores indicating greater severity of loneliness. The three subscales provide complementary insights into its behavioral (Social Skills; SS), relational (Partner Relationships; PR), and affective (Emotional Isolation; EI) dimensions. The questionnaire correction program can be found in a repository (Esteban-Rodríguez et al., Reference Esteban-Rodríguez, González-Espejito, Haro-León, Sevilla-Martínez, Díaz-Zubiaur, Lillo-López, Blasco-Novalvos and Pedrero-Pérez2025).
Self-Esteem Scale
Additionally, the Self-Esteem Scale from the Psychosocial Interaction Variables Questionnaire (VIP; Spanish: Cuestionario de Variables de Interacción Psicosocial) (Pedrero-Pérez et al., Reference Pedrero-Pérez, Pérez-López, Ena-de la Cuesta and Garrido-Caballero2005; Pedrero-Pérez, Reference Pedrero-Pérez2016) was administered to evaluate convergent validity. This instrument was developed based on previously validated measures and consolidated into a single instrument. The VIP consists of 84 items grouped into seven scales: Self-Esteem, Perceived Self-Efficacy, Optimism, Locus of Control, Social Skills, Self-Control, and Coping Styles for Stressful Situations. Each scale follows a four-option Likert response format (Strongly disagree, Disagree, Agree, and Strongly agree), with scores ranging from −2 to 2. In the present study, only the 12-item Self-Esteem Scale was used to assess the convergent validity of the MLQ. In our sample, the Self-Esteem Scale demonstrated internal consistency values (α s = .93 [SE = 0.02; SEM = 3.23] and ω = .94).
Perceived Stress Scale
The Spanish version of the Perceived Stress Scale (PSS; Cohen et al., Reference Cohen, Kamarck and Mermelstein1983), known as the Escala de Estrés Percibido (EEP; Remor & Carrobles, Reference Remor and Carrobles2001), was included. The full EEP consists of 14 items that assess the extent to which individuals have felt upset or worried, or conversely, confident in their ability to manage personal problems during the past month. It uses a five-point Likert-type response format ranging from 0 (Never) to 4 (Very often), with total scores ranging from 0 to 56, such that higher scores reflect greater perceived stress. However, several studies have shown that the 10-item version improves the scale’s psychometric properties (Pedrero-Pérez et al., Reference Pedrero-Pérez, Ruiz-Sánchez de León, Lozoya-Delgado, Rojo-Mota, Llanero-Luque and Puerta-García2015). This shorter version was used in the present study, with item scores also ranging from 0 to 4. In our sample, the scale demonstrated good internal consistency (ω = .85; α s = .81).
Procedure
Early phase
The study began with a bibliographic search for questionnaires to measure loneliness, which revealed that most of those available focus primarily on loneliness in older adults and were developed in socio-historical contexts different from the current one. Thus, the decision was made to perform a qualitative study to better understand the experience of loneliness among people aged 16–30 by conducting 10 interviews with men and women, which informed the development of a preliminary pool of items.
Ten interviews were conducted by two authors of this article with people between 16 and 30 years of age, including two psychologists (who were not part of the study) specializing in the subject, with expertise in working with youth. These experts provided valuable insights into the unique aspects of loneliness in this demographic. Free platforms were used for the development of interviews (Zoom and Google Meet). The sample was divided into two age groups: 16–25 and 26–30 years old, with each group comprising two males and two females. Additionally, one male and one female mental health expert, both aged 30, were interviewed. Participant recruitment was facilitated by the snowball method, ensuring no prior relationship existed between interviewers and interviewees. Anonymous and voluntary participation was requested from all participants. The semi-structured interviews were conducted online, and only the audio tracks were recorded for later analysis. These interviews covered various topics related to loneliness in youth, such as perceptions of loneliness, underlying causes, protective factors, and the implications of social media. A predefined guide was provided (see Appendices V and VI), addressing issues like the normalization of loneliness among youth, the roles of family and friends, the impact of current social circumstances, and explanations of youth loneliness to adults (e.g., “What do you think is most important regarding young people’s loneliness: family, friends, romantic relationships…?”/ “Older people find it hard to believe that a young person can feel lonely. How would you explain to an adult that this is happening? What factors do you think have led to this situation?”). A thematic analysis was conducted, attempting to identify, analyze, and interpret patterns or themes in the recordings obtained. This flexible approach allowed for exploration of additional emerging themes during the conversations.
The team noted a significant difference between how loneliness is experienced in youth compared to adults. Adolescents tend to describe loneliness as momentary, linked to specific conflicts or setbacks (e.g., a breakup or feeling excluded), while older adults view it as a more persistent state. This suggests that loneliness in youth is more transitory and tied to specific frustrations, complicating its assessment with traditional tools developed for older populations, who tend to experience more enduring forms of loneliness. The team also observed that adolescents often equate loneliness with isolation and incomprehension, especially when they feel unsupported by peers or family. Additionally, excessive demands from adults, combined with young people’s limited coping resources, significantly contribute to loneliness. In conclusion, youth loneliness appears to be a transient feeling, often arising from specific conflicts or transitions, rather than a long-lasting emotional state, highlighting the need to differentiate between momentary loneliness in youth and persistent loneliness in adults for accurate measurement and conceptualization.
This qualitative phase provided the theoretical foundation for the subsequent development of the MLQ, ensuring that its dimensions were grounded in the lived and socially mediated experience of loneliness rather than imposed a priori. Participants’ narratives highlighted the interplay between individual, relational, and contextual factors in the emergence of loneliness, aligning with contemporary psychosocial models that frame it as a multidimensional phenomenon shaped by social interaction, emotional needs, and perceived belonging. Difficulties in emotional expression and fear of rejection supported the inclusion of the social skills domain, reflecting the behavioral and affective barriers to connection frequently described by younger participants. The salience of romantic ties and breakups justified the partner relationships domain, consistent with evidence that intimate relationships are central sources of both connection and vulnerability. Finally, recurrent references to lack of support and incomprehension by peers and family informed the emotional isolation domain, capturing the perceived absence of understanding and emotional reciprocity. Notably, these domains were later corroborated by the quantitative analyses, confirming the conceptual continuity between the qualitative findings and the MLQ’s factor structure.
A literature review of available loneliness scales was conducted, resulting in the selection of six instruments based on specific criteria: frequency of use in the literature, inclusion of a target population (including at least one scale designed specifically for young people), and representation from diverse sociocultural contexts. An expert panel was convened to examine the content of each item and assign it to predefined categories identified in previous studies (e.g., loneliness, sense of belonging, social competence, social support, social isolation/social network, lack of understanding, mistrust, self-esteem, pessimism, love/friendship, use of ICT, social resources). Discrepancies among judges were resolved through group discussion. The six instruments selected were the UCLA Loneliness Scale-Revised (UCLA-R; Russell, Reference Russell1996; Russell et al., Reference Russell, Peplau and Cutrona1980), the Psychological Well-Being Scale for Older Adults (de León-Ricardi et al., Reference De León-Ricardi, García-Méndez and Rivera-Aragón2018), the Social and Emotional Loneliness Scale for Adults-Short Form (SELSA-S; DiTommaso & Spinner, Reference DiTommaso and Spinner1993), the De Jong Gierveld Loneliness Scale (De Jong Gierveld & Van Tilburg, Reference De Jong Gierveld and Van Tilburg2010), the Scale of Loneliness and Isolation (CAS; Casullo, Reference Casullo1996), and the ESTE-II Scale (Pinel-Zafra et al., Reference Pinel-Zafra, Rubio-Rubio and Rubio-Herrera2009).
Based on the agreed-upon solution, an initial bank of 150 items was generated, addressing all related aspects and aligned with the proposed conceptual framework. This approach allowed us to preserve the essence of previous measurement instruments used widely with older adults, while identifying aspects relevant to younger individuals, which were then integrated into the items. These 150 items were assessed by three experts from the same department (a psychologist, a pediatrician, and a nurse) outside the study, who were asked to rate each item in three aspects: relevance, non-redundancy, and clarity, on a scale of 0–4 points. The 100 items with the highest score were selected. Subsequently, these items were categorized into different theoretical domains using expert criteria. The expert review process followed established guidelines for content validation, including those outlined by recent studies (e.g., Barría-González et al., Reference Barría-González, Postigo, Pérez-Luco, Henríquez-Mesa and García-Cueto2023; Sireci & Faulkner-Bond, Reference Sireci and Faulkner-Bond2014). Experts were asked to assess the relevance and clarity of the items, ensuring that they accurately represented the theoretical dimensions of loneliness (e.g., emotional and social loneliness, the role of social media). In line with best practices for instrument validation, the Content Validity Index (CVI) was calculated for each item, and items with a CVI lower than 0.45 were removed to ensure high relevance and strong representation of the theoretical domains. Finally, these 100 items were selected to configure the preliminary version. This process not only ensured the content validity of the items but also aligned them with contemporary theoretical models of loneliness and its dimensions, as outlined in the most recent literature.
The authors considered that the inclusion of ICT as a pervasive element in interviews with young people could act as a confounding factor if applied to older adults. Although there is evidence of technology use within this population segment, its use is neither widespread nor consistently supported by facilitating resources, which are not always accessible (Murciano-Hueso et al., Reference Murciano-Hueso, Martín García-García and Torrijos-Fincias2022). Since the initial goal was to create a questionnaire capable of assessing loneliness across all ages, genders, and other conditions, an additional instrument was developed to specifically explore the relationship between loneliness and ICT use (Pedrero-Pérez et al., Reference Pedrero-Pérez, Haro-León, Marínez-Sevilla and Díaz-Zubiaur2024).
The overall development of the MLQ, from the initial qualitative study and expert review to pilot testing and large-scale validation, is summarized in Figure 2.
Development and validation process of the MLQ. Note: The sequential phases followed to construct and validate the MLQ are illustrated, including literature review, interviews, item pool generation and reduction, expert judgment, pilot testing, psychometric analyses, and the final validation study that led to the 23-item version.

Figure 2. Long description
The flowchart is organized into three vertical sections labeled on the left.
1. E A R L Y P H A S E:
* Literature review at the top leads to two parallel boxes: Available instruments and Interviews with young people.
* These converge into Item pool (n = 150).
* This leads to Expert opinion.
2. S E C O N D P H A S E:
* Expert opinion splits into two paths. The main path leads to Reduced item pool (n = 100). A side path leads to Exclusion of items related to loneliness and social networks, which then leads to Study submitted for publication.
* From the Reduced item pool, the process moves to Pilot study (n = 500).
* This leads to Psychometric study and expert opinion.
* This results in the Preliminary Madrid Loneliness Questionnaire (M L Q; 29 items).
3. P R E S E N T:
* The preliminary questionnaire leads to Current Study (n = 1,606).
* The final box at the bottom is the Madrid Loneliness Questionnaire (M L Q; 23 items).
Second phase
A pilot study was conducted with these 100 items, with a subject-to-item ratio of 5 (n = 500), which was considered sufficient. After administering this bank of items to a non-clinical sample of 500 individuals and conducting the pertinent psychometric analyses in combination with expert criteria, the Preliminary MLQ was created, initially comprising 29 items.
Current study
Non-probability sampling was employed with the 29-item version of the questionnaire. The online survey was disseminated through the official website of the City Council of Madrid, from December 2020 to December 2021. This website receives nearly 2,000,000 visits from unique users annually, who access it to carry out bureaucratic procedures, request information, consult open data, use the transparency portal, and more. On its main page, it invites users to voluntarily participate in surveys of general interest. Prior to survey commencement, information regarding the study’s purpose and data collection objectives was provided, and informed consent was obtained through a specific question. Madrid Salud Autonomous Agency was responsible for the acquisition, processing, and custody of anonymous data. A priori, the analysis was estimated to require a minimum of 1,000 participants, following Nunnally’s (Reference Nunnally1967) most stringent recommendation of a ratio of 10 participants per item. Finally, a sample of the general population (n = 1,606) was achieved.
The 29 items comprising the MLQ were back-translated by three social science experts. The experts chosen for this task had extensive experience translating from English to Spanish and vice versa, with several being native English speakers.
Prior to data collection, the researchers consulted the Ethics Committee regarding the necessity of official approval. The Committee indicated that it was unnecessary given the study’s nature, provided that participant anonymity was ensured and data were appropriately managed by Madrid Salud Autonomous Agency, a public entity under the Municipal Government of Madrid.
Written ratification was obtained from the Research Ethics Committee, which exempted the project from ethical certification requirements due to the absence of identified ethical conflicts (registration number: 150220241172024).
Statistical Analysis
An analysis was initially carried out to identify multivariate outliers using the Mahalanobis distance (Mahalanobis, Reference Mahalanobis1930). Mahalanobis distances were compared with the chi-square distribution, and cases with a probability of less than .001 were eliminated. This resulted in the exclusion of 5.63% of the cases. The definitive sample (n = 1,526) was randomly divided into two subsamples to conduct an exploratory factor analysis (EFA, n = 623) and a confirmatory factor analysis (CFA, n = 903). The participant-to-item ratios were 27:1 and 39:1, well above the maximums required (Memon et al., Reference Memon, Ting, Cheah, Thurasamy, Chuah and Cham2020), ensuring robust estimation for the planned analysis.
A preliminary analysis of the items was conducted to detect any inadequate or ineffective elements. Gulliksen’s Pool, with nonlinear parametrization, was applied following the recommendations of Ferrando et al. (Reference Ferrando, Lorenzo-Seva and Bargalló-Escrivà2023) and Lorenzo-Seva and Ferrando (Reference Lorenzo-Seva and Ferrando2021). The suggested items were reviewed checking for the existence of Heywood cases, and then those that had not been admitted by the Pool based on the Overall Item Threshold (OIT) and Overall Item Slope (OIS) were compared with those detected as duplicates by Expected Residual Correlation Direct Change (EREC) index in order to reduce redundancy. The item correlation matrix was explored, detecting correlations over .80. With these results, four items were immediately eliminated. The procedure was repeated under the criterion that the elimination of the item would not involve any loss in the factor structure. In the end, six items were eliminated (Table 2). This strategy follows best practices in scale construction, as OIT and OIS help detect items with poor discrimination or extreme thresholds, while EREC and high inter-item correlations flag redundancy and local dependence. Removing such items improves factor recovery, reduces artificial inflation or reliability, and ensures that the retained set adequately represents the targeted domains (DeVellis & Thorpe, Reference DeVellis and Thorpe2021; Ferrando & Lorenzo-Seva, Reference Ferrando and Lorenzo-Seva2018).
Items excluded from the preliminary MLQ

Table 2. Long description
The table consists of three columns: Starting position, Item content Spanish version, and Item content English version. There are six rows of data:
* Row 1: Position 3. Spanish: La gente está a mi alrededor, pero no conmigo. English: People are around me, but not with me.
* Row 2: Position 4. Spanish: Me siento abandonado/a frecuentemente. English: I feel abandoned frequently.
* Row 3: Position 16. Spanish: Siento que no soy importante para nadie. English: I feel that I am not important to anyone.
* Row 4: Position 18. Spanish: Mi familia realmente se preocupa por mí. English: My family really cares about me.
* Row 5: Position 21. Spanish: Me siento parte de mi familia. English: I feel part of my family.
* Row 6: Position 27. Spanish: Me gusta estar en sitios donde hay poca gente. English: I like to be in places where there are few people.
Note: The original initial position of the excluded items, their wording in Spanish, and the corresponding English translation are presented. These items were removed during the refinement process to improve the psychometric quality and conceptual clarity of the instrument.
The EFA was conducted using the program FACTOR 12.04.05 (Lorenzo-Seva & Ferrando, Reference Lorenzo-Seva and Ferrando2023b). Descriptive tests were performed at the item level. The adequacy of the data for structure detection was ensured through standard measures: the Kaiser–Meyer–Olkin (KMO) measure of sampling adequacy (MSA) and Bartlett’s test of sphericity. The polychoric correlation matrix was used since multivariate normality criteria were not met according to the Mardia (Reference Mardia1970), and the items used a Likert scale following the recommendations by Lloret-Segura et al. (Reference Lloret-Segura, Ferreres-Traver, Hernández-Baeza and Tomás-Marco2014). Polychoric correlations provide more accurate estimates of associations between latent variables than Pearson correlations when working with ordinal indicators, particularly when the assumption of multivariate normality is violated (Holgado-Tello et al., Reference Holgado-Tello, Chacón-Moscoso, Barbero-García and Vila-Abad2010). This decision is also consistent with simulation evidence showing that treating categorical data as continuous can bias factor loadings and fit indices, whereas categorical approaches such as polychoric-based methods yield more reliable estimates under these conditions (Rhemtulla et al., Reference Rhemtulla, Brosseau-Liard and Savalei2012).
To determine the number of dimensions to retain, optimized parallel analysis (PA) was performed (Timmerman & Lorenzo-Seva, Reference Timmerman and Lorenzo-Seva2011), alongside parametric bootstrap exploratory graph analysis (EGA). The EGA utilized 1000 replicates with graphical LASSO regularization and the Louvain algorithm (Golino & Epskamp, Reference Golino and Epskamp2017), providing additional insight into the dimensionality structure of the data, implemented in R version 4.4.1 and the EGAnet package version 1.1.0 (Golino & Christensen, Reference Golino and Christensen2022). Additionally, the Hull method (Lorenzo-Seva et al., Reference Lorenzo-Seva, Timmerman and Kiers2011) was applied to further assess the optimal number of dimensions, offering a complementary perspective to the PA and EGA results. The reliance on PA, EGA, and Hull follows methodological recommendations showing that these procedures are more accurate and less biased than traditional criteria such as the eigenvalue >1 rule or scree plot (Ferrando & Lorenzo-Seva, Reference Ferrando and Lorenzo-Seva2018; Horn, Reference Horn1965; Velicer, Reference Velicer1976). Recent evidence also highlights EGA as a robust approach for detecting complex structures with higher replicability (Christensen et al., Reference Christensen, Garrido and Golino2023) and particularly when factors are moderately correlated (Golino & Epskamp, Reference Golino and Epskamp2017). Using multiple, complementary procedures thus ensured a rigorous and reliable evaluation of dimensionality.
The robust unweighted least square (RULS) method was used to estimate parameters with LOSEFER Empirical Correction (Lorenzo-Seva & Ferrando, Reference Lorenzo-Seva and Ferrando2023a) for the robust Chi-square, applying Simplimax as a mixed method (orthogonal-oblique) for factor rotation. RULS was preferred over maximum likelihood because it is robust to violations of normality and has been shown to yield more accurate parameter estimates in the analysis of ordinal data (Ferrando & Lorenzo-Seva, Reference Ferrando and Lorenzo-Seva2018). The use of Simplimax, which combines features of orthogonal and oblique rotations, is justified by its capacity to produce simple and interpretable factor structures in psychological data (Lorenzo-Seva, Reference Lorenzo-Seva1999).
The adequacy of the factor analysis process was evaluated following the recommendations of Kaiser (Reference Kaiser1970). To ensure a rigorous evaluation, several complementary fit indices were employed, as recommended by recent guidelines that emphasize a multifaceted approach to model assessment (Hu & Bentler, Reference Hu and Bentler1999; Rogers, Reference Rogers2024; Ximénez et al., Reference Ximénez, Maydeu-Olivares, Shi and Revuelta2022). Incremental indices such as the Comparative Fit Index (CFI) and Non-Normalized Fit Index/Tucker–Lewis Index (NNFI/TLI) were included because they compare the hypothesized model to a null model and are relatively robust to sample size, with values ≥.90 indicating acceptable fit and ≥.95 excellent fit (Bentler & Bonett, Reference Bentler and Bonett1980; Brown, Reference Brown2015; Byrne, Reference Byrne1994; Escobedo-Portillo et al., Reference Escobedo-Portillo, Hernández-Gómez, Estebané-Ortega and Martínez-Moreno2016; Hu & Bentler, Reference Hu and Bentler1999; Kline, Reference Kline2011). Absolute indices such as the Goodness-of-Fit Index (GFI) and Adjusted GFI (AGFI) provide information about the proportion of variance explained by the model, thus serving as intuitive global indicators. Following common recommendations, values ≥.89 for GFI (Cho et al., Reference Cho, Hwang, Sarstedt and Ringle, Ch.2020) and >.80 for AGFI (Gaskin, Reference Gaskin2012) were considered indicative of acceptable fit. Residual-based indices were also reported, with the RMSR compared to Kelley’s (Reference Kelley1935) expected value, given its sensitivity to model misspecification and ease of interpretation. In line with best practices, residual indices like SRMR and approximate fit indices such as RMSEA are considered particularly robust to violations of normality and estimation method (Shi et al., Reference Shi, Maydeu-Olivares and DiStefano2018). Each index has known limitations: CFI and TLI may underestimate fit with low communalities or inflate misfit in large samples (Marsh et al., Reference Marsh, Hau and Wen2004; McNeish & Wolf, Reference McNeish and Wolf2023); RMSEA can over-reject models with few degrees of freedom (Kenny et al., Reference Kenny, Kaniskan and McCoach2015); SRMR is less sensitive to misspecification in factor covariances when factors are highly correlated (Hu & Bentler, Reference Hu and Bentler1999; Shi et al., Reference Shi, Maydeu-Olivares and DiStefano2018); and GFI/AGFI are sample-size dependent and not recommended as standalone criteria (Baumgartner & Homburg, Reference Baumgartner and Homburg1996; Sharma et al., Reference Sharma, Mukherjee, Kumar and Dillon2005). The quality of the factors obtained was evaluated using (1) the H index (>0.80) as an indicator of construct replicability (Ferrando & Lorenzo-Seva, Reference Ferrando and Lorenzo-Seva2018); (2) the quality indicators and effectiveness of the factor score estimates (Ferrando & Lorenzo-Seva, Reference Ferrando and Lorenzo-Seva2018), including Factorial Factor Determinacy Index (FDI) (>0.90), the Overall Reliability of Fully Informative Prior Oblique N-EAP (ORION) marginal reliability (>0.80), the Sensitivity Ratio (SR) (>2), and the Expected Percentage of True Differences (EPTD) (>90%); and (3) the precision and reliability of the factors were assessed with Expected A Posteriori (EAP) scores. These provide critical evidence of the stability, reliability, and interpretability of latent dimensions across samples. This combination of incremental, absolute, residual, and construct-replicability indices reflects current recommendations for factorial analyses in applied social sciences, ensuring that no single criterion drives conclusions about model adequacy (McNeish & Wolf, Reference McNeish and Wolf2023; Rogers, Reference Rogers2024).
The CFA was carried out using AMOS version 26 (Arbuckle, Reference Arbuckle2019). The structure was established based on the results of the preliminary EFA. ULS was used as the method for estimating parameters for the same reasons as the EFA, maintaining the same criteria for the fit indicators. Given the high correlation between factors, a model with the three correlated factors identified by the EFA was tested. In addition to the correlated three-factor CFA, alternative models were estimated in R version 4.4.1 to examine whether the three domains reflected a broader latent construct of loneliness. Specifically, a bifactor model and a second-order CFA were tested using the lavaan package version 0.6–17 (Rosseel, Reference Rosseel2012), together with the BifactorIndicesCalculator package version 0.4.2 (Dueber, Reference Dueber2017) for computing bifactor-specific indices. Bifactor modeling allows the simultaneous estimation of a general factor and domain-specific residual factors, providing direct evidence for the interpretability of both total and subscale scores (Reise, Reference Reise2012; Rodriguez et al., Reference Rodriguez, Reise and Haviland2016). Indices such as explained common variance (ECV) and hierarchical omega (ωH) were calculated to quantify the relative contribution of the general factor and assess the added value of the specific dimensions (Dueber, Reference Dueber2017; Reise et al., Reference Reise, Scheines, Widaman and Haviland2013). The second-order model, in contrast, specifies that the correlations among the three first-order domains are explained by a higher-order latent construct, thus testing whether a more parsimonious hierarchical structure adequately represents the data (Chen et al., Reference Chen, West and Sousa2006). Testing both models follows best practices in applied psychometrics, as it avoids relying on a single conceptualization of dimensionality and provides stronger evidence for the validity of reporting total and subscale scores (Morin et al., Reference Morin, Arens and Marsh2016).
Next, scalar invariance across gender and age groups (18–30 years, 31–50 years, 51–65 years, and over 65 years) was evaluated by testing for equivalence of factor loadings and intercepts to ensure comparability of scores across these groups, using R version 4.4.1 and the lavaan package version 0.6–15 (Rosseel, Reference Rosseel2012). Scaled chi-square difference tests and changes in fit indices were examined to assess whether the equality constraints imposed across groups produced a significant deterioration in model fit. This approach follows the classical procedure for invariance testing in multigroup CFA (Byrne et al., Reference Byrne, Shavelson and Muthén1989; Meredith, Reference Meredith1993; Millsap, Reference Millsap2011) which remains the standard in many applied studies using Likert-type indicators. Although alternative approaches for ordinal data have been proposed (e.g., Wu & Estabrook, Reference Wu and Estabrook2016), the traditional framework was adopted here to align with commonly used methodological practice in loneliness research and to facilitate comparability with previous studies.
Descriptive analyses of factors and total scores were performed. Convergent validity was assessed by calculating Spearman’s correlation coefficients between MLQ scores and scores on the Self-Esteem Scale and the PSS. Non-parametric correlations were used given the non-normality of the distributions, as Spearman’s ρ provides a more robust and reliable estimate of associations than Pearson’s r when data are ordinal and do not meet distributional assumptions (Bishara & Hittner, Reference Bishara and Hittner2012; Conover, Reference Conover1999; Hauke & Kossowski, Reference Hauke and Kossowski2011). Correlation coefficients were interpreted according to Cohen’s (Reference Cohen1988) conventional thresholds, which distinguish between small (≈ .10), medium (≈ .30), and large (≈ .50) effects, as these continue to be widely used in the international literature. Criterion validity was assessed through binary logistic regression and receiver operating characteristic (ROC) curve analysis, using the dichotomized response to the single-item loneliness frequency question as the criterion (“Have felt lonely”: rather often + always or almost always/ “Have not felt lonely”: a few times + never or almost never). Logistic regression was employed as the most suitable method when the criterion variable is binary, providing estimates of the probability of being classified as lonely based on MLQ scores (Hosmer et al., Reference Hosmer, Lemeshow and Sturdivant2013). ROC analysis complemented this by evaluating the discriminative ability of the MLQ, quantifying its sensitivity and specificity, with the area under the curve (AUC) serving as a robust indicator of predictive validity (Hajian-Tilaki, Reference Hajian-Tilaki2013; Zweig & Campbell, Reference Zweig and Campbell1993).
Finally, the internal consistency of the scale and each subscale was evaluated using two reliability indicators: Cronbach’s alpha (Reference Cronbach1951) and McDonald’s omega (Reference McDonald1999), calculated using SPSS version 27 (IBM Corp, 2020). Despite not fulfilling tau-equivalence (congeneric), α was included to enable comparison with other studies given its widespread use in the literature published (Trizano-Hermosilla & Alvarado, Reference Trizano-Hermosilla and Alvarado2016; Ventura-León, Reference Ventura-León2019). Omega was included as it is increasingly considered a more accurate index under multidimensional structures, as it does not assume tau-equivalence and provides a better estimate of the proportion of variance attributable to common factors (Dunn et al., Reference Dunn, Baguley and Brunsden2014; Trizano-Hermosilla & Alvarado, Reference Trizano-Hermosilla and Alvarado2016). The recommendation of a minimum of .80 for omega (Kalkbrenner, Reference Kalkbrenner2023) was followed for the interpretation. For alpha, the value α > .70 was considered acceptable, and it was decided that values over .90 could indicate a certain degree of redundancy; nonetheless, a slight increase in this value can be expected with scales of more than 20 items (Campo-Arias & Oviedo, Reference Campo-Arias and Oviedo2008). Alfa and omega were calculated for each of the subscales following established guidelines for reliability assessment (Campo-Arias & Oviedo, Reference Campo-Arias and Oviedo2008; McDonald, Reference McDonald1999; Nunnally & Bersntein, Reference Nunnally and Bersntein1994).
Results
Descriptive Data of the Items
Table 3 shows the descriptive data of the items. Skewness and kurtosis values were within the ±1.5 range for all items. The item-total correlation ranged from .35 to .72.
Item-level descriptive statistics for the MLQ

Table 3. Long description
The table contains seven columns: Item, Mean, 95 percent C I, Variance, Skewness, Kurtosis zero centered, and r sub i t (corrected item-test correlation). There are 23 rows corresponding to items 1 through 23.
Key data points include:
* Item 1: Mean 1.15, 95 percent C I 1.04 to 1.25, Variance 1.03, Skewness .64, Kurtosis minus .65, r sub i t .46.
* Item 5: Mean .76, 95 percent C I .69 to .83, Variance .47, Skewness .71, Kurtosis .73, r sub i t .57.
* Item 10: Mean 1.49, 95 percent C I 1.39 to 1.58, Variance .86, Skewness minus .06, Kurtosis minus .86, r sub i t .50.
* Item 16: Mean .57, 95 percent C I .50 to .63, Variance .38, Skewness .82, Kurtosis .68, r sub i t .55.
* Item 21: Mean 1.13, 95 percent C I 1.05 to 1.20, Variance 5.44, Skewness .30, Kurtosis minus .12, r sub i t .67.
* Item 23: Mean 1.32, 95 percent C I 1.24 to 1.40, Variance .67, Skewness .13, Kurtosis minus .51, r sub i t .41.
Response scales for all items ranged from 0 (strongly disagree) to 3 (strongly agree).
Note: rit: corrected item-test correlation. Response scales ranged from 0 (strongly disagree) to 3 (strongly agree).
Exploratory Factor Analysis
The polychoric correlation matrix proved adequate with a matrix determinant of <.001. The KMO was excellent with a value of .911, and the Bartlett test of sphericity was significant at 7,063.2 (df = 253; p < .001). The MSA values were over .50 for all items, ranging between .81 and .96.
The PA based on the minimum range for factor analysis (Timmerman & Lorenzo-Seva, Reference Timmerman and Lorenzo-Seva2011) and the Hull method (Lorenzo-Seva et al., Reference Lorenzo-Seva, Timmerman and Kiers2011) indicated the existence of three factors explaining 63.8% of the variance. Moreover, the bootstrap EGA suggested the existence of four dimensions in more than 95% of replicas. However, one of these dimensions consisted of only two items (items 6 and 23), which exhibited high correlations, suggesting that they were more likely to reflect a moderate correlation with existing factors rather than forming an independent dimension. As such, these two items were incorporated into one of the other three dimensions, aligning with the theoretical structure of the instrument. This decision is supported by the literature, as EGA performs well when factors are moderately correlated (Golino & Epskamp, Reference Golino and Epskamp2017), and previous studies (e.g., Kline, Reference Kline2015) emphasize that when factors are formed by few items, they should be integrated into larger factors if empirical correlations and theoretical coherence justify such a decision. Thus, despite the four-factor solution suggested by EGA, the three-factor structure was retained as the most coherent and theoretically consistent solution.
The communalities ranged between .21 and .94 while the factor loadings were between .35 and .99 (Table 4). The H index showed values above .8 for all factors, suggesting the existence of a well-defined latent variable and, therefore, construct replicability (Ferrando & Lorenzo-Seva, Reference Ferrando and Lorenzo-Seva2018). Likewise, the quality indicators and effectiveness of the factor score estimates were adequate for the three factors (FDI > .90; ORION marginal reliability > .80; SR > 2; EPTD > 90%). The estimated EAP scores (Fully Informative Prior Oblique EAP scores) and the ORION reliability scores for the three factors exceeded values of .9, indicating high precision and reliability in the measurement of the three factors evaluated.
Three-dimensional EFA model for the MLQ

Table 4. Long description
The table consists of five columns: Items, F 1, F 2, F 3, and Communality.
Items loading primarily on Factor 1 (Social/Relational Difficulty):
- Item 15: .96
- Item 14: .86
- Item 7: .82
- Item 9: .72
- Item 5: .57
- Item 18: .54
- Item 23: .45
- Item 6: .35
Items loading primarily on Factor 2 (Loneliness and Lack of Support):
- Item 19: .83
- Item 17: .83
- Item 21: .82
- Item 13: .80
- Item 12: .76
- Item 22: .76
- Item 3: .76
- Item 16: .74
- Item 2: .73
- Item 11: .67
- Item 4: .63
Items loading primarily on Factor 3 (Romantic/Partner Relationships):
- Item 20: .99
- Item 8: .90
- Item 1: .86
- Item 10: .52
Communality values range from .21 (Item 6) to .94 (Item 20).
At the bottom, a Factor Correlations matrix shows:
- Correlation between F 1 and F 2 is .63.
- Correlation between F 1 and F 3 is .50.
- Correlation between F 2 and F 3 is .33.
Note: Parameters were estimated with the RULS method. A Simplimax rotation was applied to improve interpretability. Factor loadings are presented in ascending order within each factor. Reported communalities correspond to values after factor extraction.
The robust goodness-of-fit statistics following LOSEFER correction resulted in NNFI = .981 (>.95); CFI = .986 (>.95) (Lorenzo-Seva & Ferrando, Reference Lorenzo-Seva and Ferrando2023a); GFI = .992; AGFI = .986. The RMSR value was .0439, close to the reference value of .0401 according to Kelley’s criterion (Reference Kelley1935).
Confirmatory Factor Analysis and Measurement Invariance
Figure 3 shows the CFA model with the three correlated factors. The GFIs were excellent (df = 227; CFI = .998; TLI = .997; RMSEA = .019; GFI = .986; AGFI = .983; RMR = .034; SRMR = .05). The communalities showed values of between .845 and .174, whereas the factor loadings ranged between .919 and .427. The Social Skills (SS) factor comprises eight items that reflect difficulties in initiating and maintaining social interactions, self-perceived social efficacy, and fear of rejection (e.g., “I find it difficult to relate to others”). These indicators capture behavioral and socioemotional competencies that have been consistently associated with loneliness in prior research. The Partner Relationships (PR) factor is composed of four items referring to the quality, intimacy, and support provided by romantic partnerships (e.g., “I have sentimental companionship that gives me the support and encouragement I need”). This factor highlights the unique contribution of intimate bonds to the experience of loneliness, beyond the mere presence or absence of a partner. The Emotional Isolation (EI) factor consists of 11 items reflecting the perception of being misunderstood, disappointed, or abandoned by significant others (e.g., “I feel lonely most of the time”). These items capture the affective dimension of loneliness, characterized by negative appraisals of social support and closeness. All items achieved substantial loadings on their main indicators (ranging from .46 to .95), and the three factors were moderately correlated (.39–.70), supporting their convergent but distinct contribution to the construct.
Correlated three-factor CFA model for the MLQ. Note: Circles represent uniqueness, rectangles represent items, and ellipses represent common factors. Unidirectional arrows between common factors and items denote loadings, while bidirectional arrows indicate correlations between factors. Values within circles correspond to residuals.

Figure 3. Long description
A structural equation model diagram featuring three central ellipses representing latent factors arranged in a triangular formation.
* Central Factors and Correlations:
- Partner Relationships is at the top center.
- Social Skills is at the bottom left.
- Emotional Isolation is at the bottom right.
- Bidirectional arrows connect the factors with correlation values: 0.37 between Partner Relationships and Social Skills, 0.57 between Partner Relationships and Emotional Isolation, and 0.70 between Social Skills and Emotional Isolation.
* Factor Loadings and Items:
- Partner Relationships points to four items above it: Item 1 (0.74), Item 8 (0.92), Item 10 (0.68), and Item 20 (0.88).
- Social Skills points to eight items on the left: Item 5 (0.75), Item 6 (0.49), Item 7 (0.75), Item 9 (0.63), Item 14 (0.81), Item 15 (0.68), Item 18 (0.43), and Item 23 (0.49).
- Emotional Isolation points to eleven items on the right: Item 2 (0.62), Item 3 (0.75), Item 4 (0.80), Item 11 (0.61), Item 12 (0.77), Item 13 (0.74), Item 16 (0.63), Item 17 (0.75), Item 19 (0.76), Item 21 (0.72), and Item 22 (0.72).
* Uniqueness Residuals:
- Each item rectangle has a small circle pointing into it containing a residual value. For Partner Relationships items, values are 0.50, 0.17, 0.53, and 0.29. For Social Skills items, values range from 0.20 to 0.59. For Emotional Isolation items, values range from 0.21 to 0.41.
The moderate-to-high correlations among the three dimensions suggested that they might reflect a broader latent construct of loneliness. To evaluate this possibility, we subsequently tested alternative models incorporating a general factor, including bifactor and second-order solutions. A bifactor model (see Supplementary Material S1), with all items loading on a general loneliness factor and simultaneously on their specific domain (SS, PR, and EI), showed acceptable fit (df = 207; CFI = .969, TLI = .962, RMSEA = .073, 95% CI [.069, .077], SRMR = .047). Bifactor indices supported the presence of a substantial general factor (ECV = .68; ωH = .84; PUC = .65), indicating that most common variance was accounted for by the general dimension, although the specific factors—particularly SS (H = .79; Ω = .85; ωH = .41) and PR (H = .81; Ω = .88; ωH = .56)—retained meaningful residual variance. Additional bifactor indices reported in Supplementary Material S1 (including item-level IECV values) further indicated that several EI items were largely saturated by the general factor, whereas a number of SS and PR items preserved stronger domain-specific variance. Taken together, these findings suggest that, although the general loneliness factor captures a substantial proportion of the shared variance, the SS and PR dimensions retain interpretable variance beyond the general factor.
A second-order CFA (see Supplementary Material S2), specifying a higher-order loneliness factor explaining the three first-order domains, showed somewhat less satisfactory fit than the bifactor model (df = 227; CFI = .957, TLI = .952, RMSEA = .082, 95% CI [.078, .086], SRMR = .058). Although the RMSEA slightly exceeded conventional cut-offs, the remaining fit indices (CFI, TLI, and SRMR) were within acceptable range, suggesting that the model was broadly compatible with a hierarchical structure (Kenny et al., Reference Kenny, Kaniskan and McCoach2015). However, some parameter estimates warrant caution, particularly the loading of EI on the higher-order factor, which reached a boundary value in the standardized supplementary solution. This pattern is consistent with a Heywood-type artifact and indicates that the second-order model is better interpreted as a complementary hierarchical representation rather than as a preferred structural solution. Taken together, these findings—particularly those from the bifactor solution—support the computation of both total and subscale scores. Accordingly, the correlated three-factor solution remains the primary representation of the MLQ, whereas the bifactor and second-order models are best understood as complementary analyses of its hierarchical structure.
Scalar invariance across gender and age was evaluated using multigroup CFA, considering the CFA described above. Table 5 summarizes model fit for the original model as well as configural, metric, and scalar models. Overall, scalar invariance obtained an acceptable fit for both gender (CFI = .982; TLI = .981; RMSEA = .036) and age (CFI = .980; TLI = .980; RMSEA = .037). In addition, scaled chi-square difference tests indicated that constraining factor loadings and intercepts did not significantly worsen model fit either for gender, Δχ2(20) = 15.86, p = .725, or for age, Δχ2(60) = 57.16, p = .580. Likewise, the scalar model did not show a significant deterioration relative to the metric model for gender, Δχ2(6) = 10.44, p = .107, or for age, Δχ2(18) = 24.37, p = .143. Specifically, the differences in CFI, TLI, and RMSEA between the configural, metric, and scalar models remained within the recommended thresholds for acceptable fit (ΔCFI < .010, ΔTLI < .010, and ΔRMSEA < .015), indicating that scalar invariance held. This supports the use of observed scores for comparing means across gender and age groups, reinforcing the robustness of the MLQ as a tool for intergroup analysis.
Measurement invariance across gender and age for the CFA

Table 5. Long description
The table is divided into two primary sections: Gender and Age. Each section includes columns for Model, chi-squared, d f, p, C F I, T L I, and R M S E A.
Gender Section:
* One-group: chi-squared 1,371.32, d f 227, C F I .984, T L I .983, R M S E A .034.
* Configural: chi-squared 1,656.02, d f 454, C F I .984, T L I .982, R M S E A .035.
* Metric: chi-squared 1,321.30, d f 474, p .725, C F I .985, T L I .984, R M S E A .033.
* Scalar: chi-squared 1,176.67, d f 480, p .107, C F I .982, T L I .981, R M S E A .036.
Age Section:
* One-group: chi-squared 1,371.32, d f 227, C F I .984, T L I .983, R M S E A .034.
* Configural: chi-squared 2,207.27, d f 908, C F I .983, T L I .981, R M S E A .036.
* Metric: chi-squared 1,834.15, d f 968, p .580, C F I .984, T L I .983, R M S E A .034.
* Scalar: chi-squared 1,692.50, d f 986, p .143, C F I .980, T L I .980, R M S E A .037.
Note: chi-squared refers to scaled-chi-square, d f is degrees of freedom, C F I is Comparative Fit Index, p is the significance level, R M S E A is Root Mean Square Error of Approximation, and T L I is the Tucker-Lewis Index.
Note: χ2 = scaled-chi-square; df = degrees of freedom; CFI = Comparative Fit Index; p = significance level of the scaled chi-square difference test; RMSEA = Root Mean Square Error of Approximation; TLI = Tucker–Lewis Index.
Based on the aforementioned results, t-tests were conducted to evaluate gender differences in the sum scores of each subscale. The results revealed a significant difference in SS (t = 3.07, p = .002), with men (M = 10.02) scoring higher than women (M = 9.24). A significant difference was also found in PR (t = −2.21, p = .027), with women (M = 5.24) scoring higher than men (M = 4.77). However, no significant difference was observed in EI (t = .18, p = .860), with both genders showing similar mean scores (men: M = 11.38; women: M = 11.31). Following these analyses, ANOVA tests were conducted to examine potential differences in observed scores for the subscales across age groups. The results indicated that there were no significant differences in the SS (p = .388) and EI (p = .803) subscales across age groups. However, the analysis for the PR subscale yielded a marginally significant result (p = .052), suggesting some variation across age groups. Table 6 summarizes the results of gender and age comparisons across the subscales of SS, PR, and EI.
MLQ scale mean comparison across gender and age

Table 6. Long description
The table is divided into two horizontal sections.
Section 1: Gender.
Columns include Factor, Male, Female, t, p, d, and 95% C I.
- S S: Male 10.02, Female 9.24, t 3.07, p .002, d .18, C I [.063, .302].
- P R: Male 4.77, Female 5.24, t minus 2.21, p .027, d minus .13, C I [minus .254, minus .015].
- E I: Male 11.38, Female 11.31, t .18, p .860, d .01, C I [minus .108, .130].
Section 2: Age.
Columns include Factor, 18 to 30, 31 to 50, 51 to 65, greater than 65, F, p, and omega sub p super 2.
- S S: 18 to 30 is 9.83, 31 to 50 is 9.44, 51 to 65 is 9.28, greater than 65 is 9.26, F 1.01, p .388, omega sub p super 2 .000.
- P R: 18 to 30 is 4.95, 31 to 50 is 4.96, 51 to 65 is 5.19, greater than 65 is 5.82, F 2.58, p .052, omega sub p super 2 .003.
- E I: 18 to 30 is 11.4, 31 to 50 is 11.5, 51 to 65 is 11.1, greater than 65 is 11.3, F .331, p .803, omega sub p super 2 minus .001.
Initialisms: S S is Social Skills, P R is Partner Relationships, and E I is Emotional Isolation.
Note: Female = Mean for females; Male = mean for males; 18–30: mean for participants aged 18 to 30 years; 31–50 = mean for participants aged 31 to 50 years; 51–65 = mean for participants aged 51 to 65 years; >65 = mean for participants over 65; d = Cohen’s d; SS = Social Skills; PR = Partner Relationships; EI = Emotional Isolation. *p-value lower than .05; **p-value lower than .01.
Given that the assumption of equal variances was not met, as indicated by Levene’s test, post hoc comparisons were conducted specifically for the PR subscale using the Games-Howell test (Games & Howell, Reference Games and Howell1976). This revealed significant differences between the oldest age group (over 65 years) and the other age groups. Specifically, the oldest group showed distinct differences in their scores compared to those in the 18–30 (p = .018), 31–50 (p = .009), and 51–65 (p = .049) age ranges. These findings suggest that although the overall ANOVA test did not reach statistical significance, there are noteworthy differences between the oldest age group and the younger groups.
Descriptive Data of the Factors Obtained
The descriptive statistics for the factors obtained can be seen in Table 7. The total loneliness score (range = 0–69) showed a mean of 25.88 (SD = 11.48). Among the subscales, SS (0–24) had a mean of 9.42 (SD = 4.26), PR (0–12) had a mean of 5.13 (SD = 3.52), and EI (0–33) had a mean of 11.32 (SD = 6.19).
Descriptive statistics for total MLQ score and subscales

Table 7. Long description
The table consists of four columns: Scales, Mean, S D (standard deviation), and Range.
* Loneliness total score: Mean 25.88, S D 11.48, Range 0 to 69.
* Social skills: Mean 9.42, S D 4.26, Range 0 to 24.
* Partner relationships: Mean 5.13, S D 3.52, Range 0 to 12.
* Emotional isolation: Mean 11.32, S D 6.19, Range 0 to 33.
A note below the table specifies that n equals 1,526 and that higher scores indicate greater loneliness.
Note: SD = standard deviation; SS = Social Skills; PR = Partner Relationships; EI = Emotional Isolation; n = 1,526. Higher scores indicate greater loneliness.
Convergent Validity
Statistically significant negative correlations were observed between self-esteem scores and both the loneliness subscale scores and the overall loneliness score (Table 8). The correlation coefficients ranged from moderate to strong (rho: −.36 to −.66). Additionally, statistically significant positive correlations were identified between the PSS scores and the loneliness scores in their dimensions and in the total score (Table 8), with moderate coefficients (p = .25 to .49).
Correlation analysis of loneliness scores with self-esteem and perceived stress scores

Table 8. Long description
The table consists of four columns: Variable Pair, Spearman’s rho, p, and 95% C I. All p-values are listed as three asterisks, indicating a p-value lower than .001.
* Self-esteem and Loneliness: Spearman’s rho is minus .66; 95% C I is [minus .70, minus .62].
* Self-esteem and Social skills: Spearman’s rho is minus .56; 95% C I is [minus .60, minus .51].
* Self-esteem and Partner relationships: Spearman’s rho is minus .36; 95% C I is [minus .42, minus .31].
* Self-esteem and Emotional isolation: Spearman’s rho is minus .63; 95% C I is [minus .67, minus .59].
* P S S and Loneliness: Spearman’s rho is .47; 95% C I is [.43, .51].
* P S S and Social skills: Spearman’s rho is .34; 95% C I is [.29, .38].
* P S S and Partner relationships: Spearman’s rho is .25; 95% C I is [.20, .30].
* P S S and Emotional isolation: Spearman’s rho is .49; 95% C I is [.45, .53].
Note: P S S stands for Perceived Stress Scale. Negative correlations are observed for self-esteem, while positive correlations are observed for P S S.
Note: P = significance level; Loneliness = Loneliness Total Score; SS = Social Skills; PR = Partner Relationships; EI = Emotional Isolation. Self-esteem was measured with the Rosenberg Self-Esteem Scale, and perceived stress with the Perceived Stress Scale (PSS). *** = p-value lower than .001.
Criterion Validity
The total Loneliness score explained 50.3% (R2 = .503) of the variance in the frequency of loneliness (omnibus p < .001). The risk of feeling lonely increased by 18% for every point on the loneliness scale (Exp(B) 95% CI [1.16, 1.20]) (Table 9). The area under the ROC curve was .868 (95% CI [.85, .89]; p < .001) (see Figure 4). The optimal cut-off point, determined by the maximum Youden Index (J = .605), was identified at a score of 29.5. At this threshold, sensitivity was .769 and specificity was .836, with a corresponding distance index of d = .28, supporting the adequacy of this cut-off.
Binary logistic regression predicting frequent loneliness from sex, age, and total MLQ score

Table 9. Long description
The table contains eight columns: Variables, B, S E, Wald, d f, p, Exp(B), and 95% C I.
* Sex: B is .42, S E is .18, Wald is 5.65, d f is 1, p is .017, Exp(B) is 1.52, and 95% C I is [1.08, 2.15].
* Age: B is minus .04, S E is .01, Wald is 52.13, d f is 1, p is less than .001, Exp(B) is .96, and 95% C I is [.96, .97].
* Loneliness: B is .17, S E is .01, Wald is 344.07, d f is 1, p is less than .001, Exp(B) is 1.18, and 95% C I is [1.16, 1.20].
* Constant: B is minus 4.10, S E is .36, Wald is 127.63, d f is 1, p is less than .001, Exp(B) is .02.
Note: B equals unstandardized regression coefficient; S E equals standard error; Wald equals Wald chi-square statistic; d f equals degrees of freedom; p equals significance level; Exp(B) equals odds ratio. Higher M L Q total scores were associated with a greater likelihood of reporting frequent loneliness.
Note: B = unstandardized regression coefficient; SE = standard error; Wald = Wald chi-square statistic; df = degrees of freedom; p = significance level; Exp(B) = odds ratio. The dependent variable was dichotomized as frequent loneliness (“Rather often” or “Always/almost always” vs. “A few times” or “Never/almost never”). Higher MLQ total scores were associated with a greater likelihood of reporting frequent loneliness. **p-value lower than .05; ***p-value lower than .001.
ROC curve for the total MLQ score in identifying frequent loneliness. Note: The ROC curve illustrates the sensitivity and specificity of the MLQ total score for discriminating between participants who reported frequent loneliness (“Rather often” or “Always/almost always”) and those who did not (“A few times” or “Never/almost never”). The area under the curve (AUC) was .868, indicating excellent discrimination accuracy.

Internal Consistency Analysis
The MLQ showed internal consistency values of (αs = .93 [SE = .02; SEM = 3.23] and ω = .92). The internal consistency of each subscale also showed adequate values: (i) SS: (αs = .84 [SE = .06; SEM = 1.73]; ω = .83); (ii) PR: (αs = .87 [SE = .08; SEM = 1.26]; ω = .89); and (iii) EI: (αs = .92 [SE = .03; SEM = 1.76]; ω = .92).
Discussion
A specific instrument was developed and validated in this study to detect and measure loneliness in all age groups considering the current sociocultural context. The scale proved to be robust from a psychometric perspective, thanks to the use of updated statistical techniques. Its factorial structure comprised three interrelated factors: Social Skills (SS), Partner Relationships (PR), and Emotional Isolation (EI). The factors demonstrated solid internal consistency indices and other quality indicators backing the validity of the scale proposed.
The 23-item version retained the three-factor structure of the original 29-item version. The initial EFA revealed a three-factor structure representing the dimensions of SS, PR, and EI with adequate fit indices. The factors showed good construct replicability, as well as quality and effectiveness of the factor score estimates indicators in addition to good precision and reliability indicators when measuring the three factors evaluated. Subsequently, the CFA corroborated this structure as it also showed adequate fit indices further supporting the validity of the three-factor structure.
The first factor, SS, is comprised of eight items reflecting the abilities required to relate to others, as well as personality traits which have been associated with loneliness. These items include aspects such as perceiving oneself as boring, emotional openness, difficulty establishing new ties or making friends, and a tendency to seek out new relationships (“I think I’m boring and that’s why people reject me,” for example). This factor is highly relevant, as personality characteristics and other psychological factors shape both the experience and individual perception of the world and reactions to it and the capacity and need to build social relationships and evaluate them (Barjaková & Garnero, Reference Barjaková and Garnero2022).
Various studies, including a meta-analysis by Buecker et al. (Reference Buecker, Mund, Chwastek, Sostmann and Luhmann2021) covering 113 studies in 26 countries, have demonstrated that certain personality characteristics are associated with experiencing loneliness. Specifically, extraversion, agreeableness, and conscientiousness are negatively associated with loneliness, while neuroticism is positively associated. Based on these findings, Buecker et al. (Reference Buecker, Mund, Chwastek, Sostmann and Luhmann2021) argued that the average person experiencing loneliness is more likely to display higher levels of introversion and neuroticism, as well as lower levels of efficiency, organization, and friendliness or compassion. However, it should be noted that individuals who feel lonely may differ considerably from one another, with intragroup differences (among lonely individuals) potentially being greater than intergroup differences (between those who feel lonely and those who do not). What is more, the relationship between extraversion and loneliness was found to decrease with age. As suggested by the authors, having an extroverted personality characterized by more frequent behaviors of approaching and interacting with known and unknown people seems to be important for not feeling lonely, especially at a younger age (Buecker et al., Reference Buecker, Mund, Chwastek, Sostmann and Luhmann2021).
To this end, the characteristic of extraversion was found to be more strongly related to social loneliness—defined as the perceived absence of a satisfying network of social relationships and associated with the number of one’s friends or social relationships—than emotional loneliness, whereas neuroticism was positively associated with all types of loneliness (Buecker et al., Reference Buecker, Mund, Chwastek, Sostmann and Luhmann2021). In this context, the lack of a satisfying network of social relationships may be due, among other reasons, to insufficient social skills needed to relate to others (Weiss, Reference Weiss1973). For example, the item “I find it difficult to relate to others” shows a strong association with this factor; in other words, this difficulty relating to others would be explained by common factors. Therefore, fostering and training social skills may be crucial to those who report frequent loneliness. Such interventions may positively impact both the reduction of loneliness and the enhancement of social interaction quality.
The second factor of this instrument, PR, is comprised of four items and evaluates aspects associated with the availability, value, and satisfaction of partner relationships and sentimental support, as well as the degree of intimacy shared with one’s partner (i.e., “I have a sentimental partner and I contribute to his/her happiness”). This matter is important as the factor focuses on the quality and emotional support received from partner relationships more than just the presence of a relationship. A number of studies have indicated that having a close and significant relationship can be a protective factor against loneliness (López-Doblas & Díaz-Conde, Reference López-Doblas and Díaz-Conde2018; Nicolaisen & Thorsen, Reference Nicolaisen and Thorsen2014; Olson & Wong, Reference Olson and Wong2001; Yaben, Reference Yaben2008). Nonetheless, the lack of a partner does not necessarily lead to increased loneliness, despite this assumption being common in the literature (Barjaková & Garnero, Reference Barjaková and Garnero2022; von Soest et al., Reference von Soest, Luhmann and Gerstorf2020; Yaben, Reference Yaben2008). In fact, having a partner may be protective or harmful depending on the quality of the relationship and the emotional support received (Barjaková & Garnero, Reference Barjaková and Garnero2022; Berlingieri et al., Reference Berlingieri, Colagrossi and Mauri2023; Qualter et al., Reference Qualter, Petersen, Barreto, Victor, Hammond and Arshad2021). Hence, the quality and emotional support received from such a relationship had to be considered in this study, much like with the instrument developed by DiTommaso et al. (Reference DiTommaso, Brannen and Best2004). The Social and Emotional Loneliness Scale for Adults (SELSA-S, DiTommaso et al., Reference DiTommaso, Brannen and Best2004) also includes a factor related to “Romantic Loneliness” which focuses on the lack of an intimate affective relationship as a risk for increased loneliness. More recently, the development of the Romantic Loneliness Scale (RomLon, Husain et al., Reference Husain, Husain, Ijaz, Farrukh, Batool, Tahir, Trabelsi, Ammar and Jahrami2025) has underscored that romantic loneliness is a unique and pressing dimension of contemporary disconnection, with distinct psychological correlates and health implications. The fact that independent research has begun to conceptualize and measure romantic loneliness as a standalone construct reinforces the contemporary relevance of including a partner-relationship domain in the MLQ. Our findings thus converge with this emerging body of work by highlighting that romantic ties cannot be reduced to mere marital status but must be evaluated in terms of intimacy, reciprocity, and emotional fulfillment, which are increasingly recognized as critical determinants of loneliness in modern societies. These findings support the importance of evaluating partner relationships in the context of loneliness.
The third factor of the scale, EI, is comprised of 11 items and focuses directly on the experience of loneliness. It evaluates the negative perception of personal relations, feelings of insufficient support or availability of assistance from others, a perceived lack of understanding by others, the support network provided by family members or loved ones and how adverse situations are faced (i.e., “Many people have disappointed me and left me alone”). This factor reflects external elements associated with isolation in social relations, which is closely related to loneliness in accordance with the scientific literature. Risk factors such as poor social integration, deficits in the quality of social contacts, and low perceived social support have been identified as central to the experience of loneliness (Pinquart & Sörensen, Reference Pinquart and Sörensen2001).
The fact that a lack of social support has been on the rise in recent years, especially in developing countries, must be acknowledged (McPherson et al., Reference McPherson, Brashears and Smith-Lovin2006). This trend is perhaps attributable to increasing individualism (Bauman, Reference Bauman, Beck and Beck-Gernsheim2002; Lipovetsky, Reference Lipovetsky1998; Sarlo, Reference Sarlo2001), changes in lifestyle, the impact of new technologies, and the transformation of social values (Pinel-Zafra et al., Reference Pinel-Zafra, Rubio-Rubio and Rubio-Herrera2009; Putnam, Reference Putnam2000). However, as argued in relation to the second factor on partner relationships, it should be emphasized that having few relationships does not necessarily mean that a person will feel lonely, as there are reports of individuals experiencing high levels of loneliness even when surrounded by others (Cacioppo et al., Reference Cacioppo, Grippo, London, Goossens and Cacioppo2015; De Jong Gierveld et al., Reference De Jong Gierveld, Van Tilburg, Dykstra, Vnagelisti and Perlman2006; De Jong Gierveld & Van Tilburg, Reference De Jong Gierveld and Van Tilburg2010; Perlman & Peplau, Reference Perlman, Peplau, Duck and Gilmour1981). Thus, the importance of quality and satisfaction in one’s daily relationships must again be underlined.
In spite of the distinction between loneliness and isolation, the link between them has consistently been documented in the literature (Pinel-Zafra et al., Reference Pinel-Zafra, Rubio-Rubio and Rubio-Herrera2009; Steptoe et al., Reference Steptoe, Shankar, Demakakos and Wardle2013). Such isolation stands out as one of the negative dimensions of loneliness, increasing vulnerability to illnesses and psychopathological disorders associated with stress (Barrón-López Barrón-López de Roda, Reference Barrón-López de Roda, Luque, Torregrosa and Estramiana1992; Heller & Swindle, Reference Heller, Swindle, Felner, Jason, Moritsugu and Farber1983). However, it is true that the factor of isolation has been immensely covered in studies focusing on the elderly, particularly emphasizing physical isolation resulting from architectural barriers (Gené-Badia et al., Reference Gené-Badia, Ruiz-Sánchez, Obiols-Masó, Oliveras-Puig and Lagarda-Jiménez2016) or widowhood (López-Doblas & Díaz-Conde, Reference López-Doblas and Díaz-Conde2018). In these cases, loneliness is heavily associated with living alone (Rubio & Aleixandre, Reference Rubio and Aleixandre2001; Savikko et al., Reference Savikko, Routasalo, Tilvis, Strandberg and Pitkälä2005). By contrast, among younger individuals, emotional isolation is more often linked to precarious living conditions (Barreto et al., Reference Barreto, Victor, Hammond, Eccles, Richins and Qualter2021; Bauman, Reference Bauman, Beck and Beck-Gernsheim2002).
As concerns the validity of the structure, it is important to highlight the interrelation between the three factors used for the scale, even though each one covers aspects corresponding to different theoretical domains. These factors converge around the common core of loneliness, providing a multidimensional representation of this complex phenomenon. In particular, a high correlation was observed between the EI factor and the other two factors. This aligns with classical definitions that identify emotional loneliness as the core affective nucleus of the construct (Weiss, Reference Weiss1973; Peplau & Perlman, Reference Peplau, Perlman, Peplau and Perlman1982). Empirical research has shown that this dimension is a key predictor of psychological distress and health risks (Cacioppo & Cacioppo, Reference Cacioppo and Cacioppo2018; Hawkley & Cacioppo, Reference Hawkley and Cacioppo2010), and its strong links with both social competencies and romantic ties highlight the role of emotional closeness as the integrative foundation of loneliness (Büyükşahin et al., Reference Büyükşahin, Hasta and Hovardaoğlu2005; Heinrich & Gullone, Reference Heinrich and Gullone2006). Taken together, this correlation reflects the intrinsic complexity of loneliness and the need to approach it from multiple perspectives; in other words, the scale structure captures a holistic and multidimensional understanding of loneliness, which is essential to developing effective strategies for coping with this social issue.
In addition to the correlated three-factor solution, other analyses supported the presence of a strong general factor that explained most of the common variance, while revealing that SS and PR retained significant residual variance. This indicates that the MLQ can be interpreted both as a global indicator of loneliness severity and as a multidimensional tool that captures behavioral, relational, and affective components. More specifically, supplementary bifactor indices (including PUC and item-level IECV values) suggested that the general factor was particularly dominant for the EI domain, whereas SS and PR retained more substantial domain-specific variance. Similarly, the second-order model was broadly consistent with the presence of a higher-order loneliness construct, albeit with slightly less optimal fit indices compared to the bifactor model and some parameter estimates that warrant cautious interpretation. Taken together, these results provide a solid psychometric justification for reporting both total scores and subscales, although they do not support privileging the general factor at the expense of the domain-specific dimensions, thereby offering flexibility for research and clinical applications depending on whether a comprehensive or domain-specific assessment of loneliness is required. Accordingly, the total MLQ score may be useful as an overall indicator of loneliness severity, whereas subscale scores may be especially informative when the aim is to identify the specific behavioral, relational, or affective pathways through which loneliness is experienced.
Beyond supporting the existence of a general factor of loneliness, our findings particularly highlight the specificity of the domains of SS and PR. This is consistent with broader evidence showing that interpersonal competencies and romantic ties constitute unique pathways through which loneliness emerges and is maintained. Deficits in socioemotional and behavioral competencies, such as low self-efficacy in social interaction, poor emotion regulation, and difficulties in social cognition, have repeatedly been identified as longitudinal predictors of loneliness (Qualter et al., Reference Qualter, Pool, Gardner, Ashley-Kot, Wise and Wols2015; Spithoven et al., Reference Spithoven, Bijttebier and Goossens2017). Likewise, the persistence of the PR factor aligns with theoretical and empirical distinctions between social and emotional loneliness (Heinrich & Gullone, Reference Heinrich and Gullone2006), with romantic bonds providing a unique arena for intimacy, validation, and emotional fulfillment (Laursen & Hartl, Reference Laursen and Hartl2013). In contrast, the EI factor did not retain substantial residual variance beyond the general factor, which is consistent with its conceptualization as the core affective experience of loneliness (Peplau & Perlman, Reference Peplau, Perlman, Peplau and Perlman1982; Weiss, Reference Weiss1973).
Taken together, these results indicate that the MLQ converges with and expands upon existing measures. EI parallels the emotional loneliness dimension captured by the De Jong Gierveld Scale (De Jong Gierveld & Kamphuis, Reference De Jong Gierveld and Kamphuis1985) but extends it by addressing experiences of disappointment and lack of understanding. PR resonates with the Romantic Loneliness domain of the SELSA-S (DiTommaso & Spinner, Reference DiTommaso and Spinner1993) and the recent Romantic Loneliness Scale (Husain et al., Reference Husain, Husain, Ijaz, Farrukh, Batool, Tahir, Trabelsi, Ammar and Jahrami2025), moving beyond marital status to emphasize the quality of intimacy and support—an aspect underrepresented in widely used scales such as the UCLA (Russell, Reference Russell1996). Most distinctively, the SS factor incorporates behavioral and socioemotional competencies (e.g., fear of rejection, difficulties initiating relationships) as intrinsic components of loneliness, in contrast with brief or traditional instruments that primarily assess perceived isolation (Hughes et al., Reference Hughes, Waite, Hawkley and Cacioppo2004; Pinel-Zafra et al., Reference Pinel-Zafra, Rubio-Rubio and Rubio-Herrera2009). These findings indicate that the MLQ captures (a) a broad, general propensity to feel lonely and (b) domain-specific processes with incremental interpretive value for behavioral intervention (e.g., social skills training, emotion-expression work), relational contexts (e.g., screening and counseling focused on intimacy, reciprocity, and dyadic communication), and affective vulnerability (e.g., emotional support and coping resources). For example, individuals with high scores on social skills deficits may benefit from cognitive-behavioral or group-based interventions aimed at strengthening social efficacy and reducing sensitivity to rejection; those with elevated emotional isolation may require programs centered on fostering meaningful connections and community belonging; and individuals scoring high in partner-related loneliness may benefit from interventions targeting dyadic processes such as intimacy, reciprocity, and communication.
By enabling these tailored approaches, the MLQ offers a psychometrically robust assessment and a practical tool for designing interventions that meaningfully address individual needs, with particular cultural relevance in the Spanish context, where transformations such as increased job and housing insecurity, changes in family structures, and the widespread influence of digital communication have reshaped relational ties. Therefore, by integrating dimensions such as socioemotional competencies, relationship intimacy, and emotional isolation, the MLQ captures the contemporary psychosocial dynamics of loneliness that are insufficiently addressed by traditional measures, thereby enhancing its applicability both in Spain and in comparable Western contexts.
Furthermore, it is worth noting that this tailored approach also responds to evidence from systematic reviews and meta-analyses showing that generic, institutionally designed programs for loneliness typically produce modest effects (Cattan et al., Reference Cattan, White, Bond and Learmouth2005; Massi et al., Reference Massi, Chen, .C. and Cacioppo2011). Therefore, the MLQ aims to help overcome these limitations by providing domain-specific insights that align interventions with individuals’ subjective priorities. Although the MLQ was developed and validated in Spain, its theoretical grounding and multidimensional structure suggest potential utility beyond this national setting, particularly in societies undergoing similar transformations in social ties, family structures, precarity, and digital communication. Future research should therefore examine its performance in cross-cultural and transnational studies. This study found a consistent factor structure for both gender and age groups, demonstrating scalar invariance, which indicates that the MLQ measures loneliness equivalently across these groups and that observed differences can be meaningfully interpreted as substantive rather than artifactual. This strengthens the generalizability of the instrument and supports its use for valid cross-group comparisons in both research and applied contexts. Gender differences were mainly observed in SS and PR. Men reported greater loneliness related to SS, likely due to socialization processes that often provide less emotional and social support for men (Carstensen, Reference Carstensen1995). Women, on the other hand, experienced greater loneliness in PR, possibly due to their tendency to prioritize intimate, romantic relationships as a central source of emotional support (Rokach et al., Reference Rokach, Matalon, Rokach and Safarov2007).
Few significant differences were observed across age groups, with individuals over 65 showing the most pronounced loneliness in PR. This is consistent with previous research showing that older adults are more prone to loneliness due to partner loss (De Jong Gierveld & Van Tilburg, Reference De Jong Gierveld and Van Tilburg2010; Luhmann & Hawkley, Reference Luhmann and Hawkley2016), especially considering the context generated by the COVID-19 pandemic (Surkalim et al., Reference Surkalim, Luo, Eres, Gebel, van Buskirk, Bauman and Ding2022), which in this population led to the loss of close others, such as friends and partners—factors identified as key contributors to loneliness in older people (Weiss, Reference Weiss1973).
These results highlight the need for psychological interventions. For women, interventions should encourage diverse emotional coping strategies and the expansion of social networks to reduce dependency on romantic relationships for emotional fulfillment (Diener & Seligman, Reference Diener and Seligman2002). For men, enhancing social skills and emotional expression through targeted interventions can help address loneliness related to difficulties in social interaction (Mahalik et al., Reference Mahalik, Burns and Syzdek2007). For older adults, promoting social engagement and relationship quality—rather than merely the presence of a partner—is key to alleviating loneliness, especially following partner loss (De Jong Gierveld & Van Tilburg, Reference De Jong Gierveld and Van Tilburg2010).
In relation to convergent validity, the results obtained reinforce the content validity of the MLQ as an instrument for the multidimensional assessment of loneliness. On the one hand, a strong inverse association (p < −0.60) between loneliness and self-esteem, measured using the scale developed by Pedrero-Pérez et al. (Reference Pedrero-Pérez, Pérez-López, Ena-de la Cuesta and Garrido-Caballero2005), was confirmed, consistent with literature identifying self-esteem as a robust marker of psychosocial adjustment in the context of loneliness (Cacioppo et al., Reference Cacioppo, Hawkley, Ernst, Burleson, Berntson, Nouriani and Spiegel2006; Geukens et al., Reference Geukens, Maes, Spithoven, Pouwels, Danneel, Cillessen, Van den and Goossens2020; Haines et al., Reference Haines, Scalise and Ginter1993; Leary, Reference Leary2005; Szcześniak et al., Reference Szcześniak, Bielecka, Madej, Pieńkowska and Rodzeń2020; Teneva & Lemay, Reference Teneva and Lemay2020). This pattern supports the contemporary conceptualization of loneliness as a phenomenon related to deficits in perceived support, social valuation, and self-concept, beyond the mere absence of formal relationships. On the other hand, the MLQ showed positive and statistically significant correlations with perceived stress (PSS), which is consistent with evidence on the bidirectional associations between loneliness and levels of psychological distress and stress (Gifford et al., Reference Gifford, Fouche and Beadle2021; Laustsen et al., Reference Laustsen, Christiansen, Maindal, Plana-Ripoll and Lasgaard2024; Wang et al., Reference Wang, Cao, Yu, Jin, Li, Chen, Liu, Ge and Lu2024).
Similarly, the criterion validity results also indicate that the properties of the instrument are adequate. The findings show that the total loneliness scale score significantly explains 50.3% of the variance in the frequency of feeling lonely (R 2 = 0.503), measured by a question that has been considered a gold standard in various studies on loneliness (Kotwal et al., Reference Kotwal, Cenzer, Waite, Smith, Perissinotto and Hawkley2022). In addition, the discriminative accuracy of the MLQ in identifying individuals who frequently experience loneliness was corroborated by ROC analysis, which yielded an AUC of 0.868. The AUC value quantifies the instrument’s classificatory ability, that is, its accuracy in distinguishing between cases and non-cases, regardless of prevalence or threshold selection. AUC values above 0.80 are considered robust in epidemiology and clinical research (Hajian-Tilaki, Reference Hajian-Tilaki2013; Metz, Reference Metz1978). The optimal cut-off point, determined by the maximum Youden Index (J = 0.605), was identified at a score of 29.5, with sensitivity of 0.769 and specificity of 0.836. The corresponding distance index (d = 0.28), calculated as the Euclidean distance to the ideal ROC point (0,1), further supported the adequacy of this threshold. From an applied perspective, these findings suggest that scores of approximately 30 or higher on the MLQ may indicate an elevated level of loneliness and may serve as a useful screening reference in research and preventive contexts, although this threshold should not be interpreted as a diagnostic criterion per se but rather as a guide for identifying individuals who may benefit from further assessment or intervention. This result supports the use of the MLQ not only in research but also as a valid tool for detecting and monitoring loneliness in the general adult population, facilitating the early identification of relevant cases and the implementation of specific interventions. It should be noted that this level of discrimination broadens the potential utility of the MLQ for longitudinal follow-up, risk assessment, and monitoring of preventive programs in public health, where the ability to differentiate groups is critical for resource allocation (Hajian-Tilaki, Reference Hajian-Tilaki2013; Kotwal et al., Reference Kotwal, Cenzer, Waite, Smith, Perissinotto and Hawkley2022).
The internal consistency of the scale, assessed using Cronbach’s alpha and McDonald’s omega, demonstrated high reliability for both the subscales and the total score. The Cronbach’s alpha coefficients range between .84 and .92, exceeding the acceptable threshold of .70. The McDonald’s omega values, which offer a precise estimate of consistency, vary between .83 and .92, indicating reliable subscale measurement. The full scale yielded a Cronbach’s alpha of .93 and McDonald’s omega of .92, indicating the instrument’s reliability. These results confirm that the scale measures loneliness in a precise and stable manner, underscoring its potential value for future research and clinical applications.
In summary, a questionnaire has been developed to measure loneliness in all age groups aged 18 years and older which reflects adequate internal consistency and factorial validity indicators. Given that there are very few studies focusing on loneliness in young people and middle-aged adults (Surkalim et al., Reference Surkalim, Luo, Eres, Gebel, van Buskirk, Bauman and Ding2022), this questionnaire can help identify and fill a gap in research concerning these population groups. Therefore, it is also highly useful for the prevention and intervention efforts required by people in these age intervals. This is of immense importance, especially when it has been proven that the impact of loneliness on health can be greater among young and middle-aged adults than among those over 60 years old (Lasgaard et al., Reference Lasgaard, Friis and Shevlin2016; Richard et al., Reference Richard, Rohrmann, Vandeleur, Schmid, Barth and Eichholzer2017). Thus, the MLQ not only contributes to the international literature on loneliness but also provides a culturally grounded and multidimensional tool that can support both research and applied initiatives in Spanish-speaking contexts, as well as in other comparable sociocultural settings. Future cross-cultural studies should test its applicability and invariance across different national contexts.
Taken together, these findings position the MLQ as a valuable instrument for both scientific and applied contexts. By integrating behavioral, relational, and affective components, the scale enables a more precise understanding of loneliness and its determinants. Beyond its theoretical contribution, the MLQ offers practical implications for tailoring interventions, monitoring preventive programs, and informing public health policies aimed at reducing the burden of loneliness in contemporary societies.
Limitations
Despite its psychometric soundness and the use of advanced analyses to maximize consistency and validity, several limitations should be acknowledged. First, the cross-sectional design precludes causal inferences about the mechanisms underlying loneliness, underscoring the need for longitudinal studies to clarify temporal dynamics. Second, the exclusive reliance on self-report data may introduce biases such as social desirability or recall effects, although these are common in loneliness research. Third, the online sampling method, while facilitating outreach and administration, can generate sampling biases beyond the researchers’ control (Ball, Reference Ball2019; Evans & Mathur, Reference Evans and Mathur2018). In this study, an outlier analysis was conducted to preserve consistency, resulting in the exclusion of 5.63% of cases; however, issues of sample imbalance remained. As is typical in research on social and emotional topics, women and individuals with higher education were overrepresented (Kirwan et al., Reference Kirwan, Burns, O’Súilleabháin, Summerville, McGeehan, McMahon, Gowda and Creaven2025), whereas very elderly participants and those with limited digital access were likely underrepresented.
Although the main objective was to provide evidence of reliability and validity rather than representativeness, these imbalances warrant caution when generalizing findings, particularly to men and other underrepresented groups. Measurement invariance across gender supports the comparability of results, but further validation in more diverse and representative samples is needed. Moreover, the factorial structure was tested through EFA and CFA in two subsamples drawn from the same dataset. While this provides internal cross-validation, it may also inflate model fit indices due to shared sample characteristics (Brown, Reference Brown2015; Kline, Reference Kline2011). Replication in fully independent samples is therefore required to confirm the stability and generalizability of the proposed structure. Finally, future research should extend validation to adolescents, older adults, and clinical populations, and employ longitudinal and multimethod approaches (e.g., informant reports, behavioral indicators) to strengthen construct validity and elucidate the pathways linking loneliness to psychosocial and health outcomes.
Research Implications
The MLQ provides a psychometrically robust instrument for advancing research on loneliness within the contemporary sociocultural context. Its multidimensional structure allows for a more precise analysis of the behavioral, relational, and affective pathways through which loneliness emerges and is maintained. This facilitates the examination of both risk and protective factors across populations and developmental stages, as well as longitudinal analyses of how loneliness interacts with psychological distress, social resources, and health outcomes. Moreover, the availability of subscale scores offers researchers flexibility to focus either on a global indicator of loneliness severity or on domain-specific processes, depending on the aims of their studies.
Beyond these methodological contributions, the MLQ is grounded in a psychosocial framework that conceptualizes loneliness as more than merely the absence of social ties. Building on classical definitions and subsequent developments emphasizing subjective appraisal and relational quality, the MLQ operationalizes loneliness as an interplay of behavioral competencies, affective evaluations, and intimate relational contexts. This theoretical anchoring differentiates the MLQ from earlier measures such as the UCLA Loneliness Scale or the De Jong Gierveld Loneliness Scale, which—while widely used—tend to privilege either global severity or the emotional/social dichotomy, often neglecting behavioral deficits and the specificity of romantic relationships.
By explicitly incorporating the domains of social skills, partner relationships, and emotional isolation, the MLQ not only provides a refined measurement tool but also generates new hypotheses for psychosocial research. For instance, it enables investigations into how difficulties in social self-efficacy and fear of rejection constrain access to meaningful social ties, how the quality of romantic partnerships uniquely contributes to the experience of belonging, and how negative affective appraisals of social bonds exacerbate vulnerability to distress. These dimensions open new avenues for testing integrative models of loneliness that bridge individual competencies, relational dynamics, and broader sociocultural shifts—an approach particularly relevant in contexts such as Spain, where rapid social transformations and changing family and community structures have reshaped the ways in which loneliness is experienced and reported.
In this sense, the MLQ not only addresses a measurement gap but also represents a conceptual advance, positioning loneliness as a multidimensional psychosocial construct that requires equally nuanced tools for its study. This orientation promotes a research agenda that moves beyond mere prevalence estimates to examine mechanisms, trajectories, and interventions, ultimately strengthening the theoretical and empirical foundations of loneliness research across cultural contexts.
Clinical and Policy Implications
The MLQ also holds significant applied value in clinical and public health settings. In clinical practice, it provides a rapid and reliable assessment of patients’ subjective experiences of loneliness, enabling practitioners to identify specific domains—such as deficits in social skills, partner-related loneliness, or emotional isolation—that can guide tailored interventions. In public health contexts, the instrument can facilitate early detection of vulnerable groups, the monitoring of preventive initiatives, and the evaluation of community-based programs aimed at promoting social and emotional well-being. Importantly, the MLQ’s multidimensional design also enhances the evaluation of interventions: it captures changes across social, relational, and affective domains before and after treatment, thereby enabling a more precise determination of program effectiveness. This is particularly relevant given that systematic reviews and meta-analyses have highlighted the modest effectiveness of general interventions against loneliness, often due to their lack of personalization. In contrast, the MLQ supports the development of tailored strategies—for instance, social skills training for individuals with behavioral deficits, relational counseling for those with high partner-related loneliness, or community programs for individuals experiencing emotional isolation. In doing so, the MLQ bridges the gap between psychometric assessment and evidence-based practice, offering a person-centered tool to inform both clinical treatment and public health policy. Moreover, the growing recognition of loneliness as a public health priority at governmental and supranational levels further underscores the instrument’s relevance. Initiatives such as the appointment of a “Minister for Loneliness” in the UK or the European Union’s large-scale surveys on social connectedness illustrate the increasing policy attention devoted to this issue. Within this framework, the MLQ can provide policymakers with a sensitive and multidimensional tool for surveillance and evaluation, allowing them to identify vulnerable groups more precisely and to assess the impact of programs that aim at strengthening social infrastructure and community cohesion.
Conclusions
This study provides evidence of the validity of the MLQ (see details in Appendices I–IV), a new instrument specifically developed to assess the subjective experience of loneliness. The MLQ comprises 23 items structured into three factors: Social Skills (SS), Partner Relationships (PR), and Emotional Isolation (EI). The scale demonstrated strong psychometric properties, with its three-factor structure supported by both exploratory and confirmatory factor analyses, and fit indices indicating an excellent model fit (CFI = 0.986; GFI = 0.992; RMSR = 0.044 for EFA, and CFI = 0.998; TLI = 0.997; GFI = 0.986; RMSEA = 0,019; SRMR = 0.05 for CFA). Importantly, the MLQ showed scalar invariance across gender and age groups, supporting its use for meaningful comparisons between these demographic categories (CFI = 0.982; TLI = 0.981; RMSEA = 0.036 for gender; CFI = 0.980; TLI = 0.980; RMSEA = 0.037 for age). The negative association observed between loneliness and self-esteem, together with the positive correlations with perceived stress, further supports the convergent validity of the instrument. It also showed excellent indicators of internal consistency (αs = .93 and ω = .92). By integrating social, relational, and emotional dimensions, the MLQ offers a comprehensive tool for capturing the complexity of loneliness, applicable to all adult age groups in contemporary sociocultural contexts. Given the growing recognition of loneliness as an important public health problem in Madrid and other regions of Spain, the MLQ represents a valuable resource not only for academic research but also for monitoring public health and clinical interventions aimed at preventing and mitigating loneliness. Future studies should replicate these findings in age-specific and clinical samples, and examine the MLQ’s sensitivity to change in intervention studies targeting loneliness reduction. Such research will solidify the utility of the MLQ for monitoring, understanding, and ultimately formulating public policies and interventions aimed at improving well-being.
Supplementary material
The supplementary material for this article can be found at http://doi.org/10.1017/SJP.2026.10043.
Data availability statement
Madrid Salud is solely responsible for the collection, processing, and storage of the anonymous data. Existence of one preprint work published by the authors of this study in which different aspects of how the study began and its development up to the time of this publication can be delved into in more detail (Díaz-Zubiaur et al., Reference Díaz-Zubiaur, González-Espejito, Sevilla-Martínez, Haro-León, Pedrero-Pérez, Calatrava-Sánchez, Esteban-Rodríguez, Lillo-López and Blasco-Novalbos2023). The official scoring and correction program for the Madrid Loneliness Questionnaire (MLQ) is also available in a repository (Esteban-Rodríguez et al., Reference Esteban-Rodríguez, González-Espejito, Haro-León, Sevilla-Martínez, Díaz-Zubiaur, Lillo-López, Blasco-Novalvos and Pedrero-Pérez2025), designed to automatically process responses and calculate total scores and subscale scores.
Acknowledgements
We would like to thank all participants who took the time to complete the online survey, as well as those who took part in the interviews during the preliminary phase of the project. Their contributions have been essential to advancing our understanding of loneliness in contemporary society. We also acknowledge the financial support provided by the Ministry of Universities of Spain through the predoctoral contracts awarded to L. Esteban-Rodríguez and F. González-Espejito under the University Teacher Training Program (FPU21/998758 and FPU23/03224, respectively).
Authorship contribution
Conceptualization: L.E.R., F.G.E., E.D.Z., J.V.S.M., A.H.L., E.L.L., G.B.N., E.P.P.; data curation: L.E.R., F.G.E., E.J.P.P.; formal analysis: L.E.R., F.G.E.; investigation: L.E.R., F.G.E., E.D.Z., J.V.S.M., A.H.L., G.B.N., E.J.P.P.; methodology: L.E.R., F.G.E., J.V.S.M., A.H.L., E.J.P.P.; project administration: G.B.N.; resources: G.B.N.; supervision: L.E.R., F.G.E., E.L.L., E.J.P.P.; validation: L.E.R., F.G.E.; visualization: L.E.R., F.G.E., E.D.Z., E.L.L.; writing – original draft: L.E.R., F.G.E., E.D.Z., J.V.S.M., A.H.L., E.L.L., G.B.N., E.J.P.P.; writing – review & editing: L.E.R., F.G.E., E.D.Z., J.V.S.M., A.H.L., E.L.L., G.B.N., E.J.P.P.
Funding statement
This research was supported by Madrid Salud, an autonomous body of the Madrid City Council. During part of the period in which the present study was initiated, L. Esteban-Rodríguez, F. González-Espejito, E. Díaz-Zubiaur, J. V. Sevilla-Martínez, and A. Haro-León received training and research grants from this institution.
Competing interests
The authors declare none.
Appendix
Cuestionario Madrid de Sentimiento de Soledad (CMSS) (Spanish version)

Appendix I. Long description
The table consists of six columns. The first column lists item numbers from 1 to 23. The second column contains statements in Spanish regarding personal relationships and feelings. The remaining four columns are Likert scale options: Strongly disagree, Disagree, Agree, and Strongly agree.
Items include:
1. I have a romantic partner and contribute to their happiness.
2. Many people have disappointed me and left me alone.
3. I feel as if no one really understands me.
4. I feel alone most of the time.
5. I think I am boring and that is why people reject me.
6. I frequently talk about my feelings with other people.
7. It is difficult for me to make friends.
8. I have a romantic partner who gives me the support and encouragement I need.
9. When I arrive at new places I feel good and sure of myself.
10. I wish I had a more satisfying romantic relationship.
11. I feel close to my family.
12. When I have problems I feel alone in facing them.
13. When I tell my problems, I do not feel support or understanding.
14. I find it hard to relate to others.
15. I find it difficult to meet people in places where I haven’t been before.
16. No family member cares about me.
17. The people around me do not care about my problems.
18. When there are many people in a place I try not to go.
19. When I need it, there is always someone who helps me.
20. I have a partner with whom I share my most intimate feelings.
21. I can count on my friends whenever I need it.
22. I miss people I can trust.
23. I find it hard to talk about my emotions.
Por favor, marque con una X en la opción que mejor se ajuste a su situación.
Madrid Loneliness Questionnaire (MLQ) (English version – not validated)

Appendix II. Long description
A survey table with six columns. The first column lists item numbers from 1 to 23. The second column contains statements about personal feelings and social situations. The remaining four columns are Likert scale options for the respondent to mark with an X, labeled from left to right as: Strongly disagree, Disagree, Agree, and Strongly agree.
The 23 statements are:
1. I have a sentimental partner and I contribute to his/her happiness.
2. Many people have disappointed me and left me alone.
3. I feel as if no one really understands me.
4. I feel lonely most of the time.
5. I think I’m boring and that’s why people reject me.
6. I often talk about my feelings with other people.
7. It is difficult for me to make friends.
8. I have sentimental companionship that gives me the support and encouragement I need.
9. When I go to new places, I feel good and confident.
10. I wish I had a more satisfying romantic relationship.
11. I feel close to my family.
12. When I have problems I feel alone to face them.
13. When I tell my problems, I feel no support or understanding.
14. I find it difficult to relate to others.
15. I find it difficult to meet people in places I have never been before.
16. No family member cares about me.
17. The people around me do not care about my problems.
18. When there are a lot of people in a place I try not to go.
19. When I need it, there is always someone to help me.
20. I have a partner with whom I share my innermost feelings.
21. I can count on my friends whenever I need to.
22. I miss people I can trust.
23. I find it hard to talk about my emotions.
Please mark with an X in the option that best fits your situation.
Cuestionario Madrid de Sentimiento de Soledad (CMSS) grouped by factors (Spanish version)

Appendix III. Long description
The table outlines the Madrid Loneliness Scale (C M S S). At the top, it defines the response categories: 0 equals Strongly Disagree, 1 equals Disagree, 2 equals Agree, and 3 equals Strongly Agree. The table is divided into three primary sections:
1. Social Skills (H S): Focuses on behavioral and socio-emotional competencies. It includes 8 items (Items 5, 6, 7, 9, 14, 15, 18, and 23) such as ‘It is difficult for me to make friends’ and ‘I find it hard to talk about my emotions’. The total score range is 0 to 24 points with an alpha of .84.
2. Partner Relationships (R P): Focuses on the quality and intimacy of romantic bonds. It includes 4 items (Items 1, 8, 10, and 20) such as ‘I have a romantic partner and contribute to their happiness’. The total score range is 0 to 12 points with an alpha of .87.
3. Emotional Isolation (A E): Focuses on the perception of being misunderstood or abandoned. It includes 11 items (Items 2, 3, 4, 11, 12, 13, 16, 17, 19, 21, and 22) such as ‘I feel like nobody really understands me’ and ‘I feel lonely most of the time’. The total score range is 0 to 33 points with an alpha of .92.
Items marked with an asterisk (6, 9, 1, 8, 20, 11, 19, and 21) use inverse scoring.
Nota: *Los ítems tienen puntuación inversa.
Madrid Loneliness Questionnaire (MLQ) grouped by factors (English version – not validated)

Appendix IV. Long description
The table is structured into three main sections based on factors of the M L Q.
At the top, the response categories are defined as 0 equals Strongly disagree, 1 equals Disagree, 2 equals Agree, and 3 equals Strongly agree.
1. Social Skills S S: Defined as behavioral and socioemotional competencies needed to initiate and maintain social interactions. It includes 8 items: Item 5 (boring/rejected), Item 6 asterisk (talk about feelings), Item 7 (difficult to make friends), Item 9 asterisk (feel good/confident), Item 14 (difficult to relate), Item 15 (difficult to meet people), Item 18 (avoiding crowds), and Item 23 (hard to talk about emotions). Total score range is 0 to 24 points with an alpha of .84.
2. Partner Relationships P R: Defined as quality, intimacy, and emotional support provided by romantic ties. It includes 4 items: Item 1 asterisk (contribute to partner’s happiness), Item 8 (support/encouragement from partner), Item 10 asterisk (wish for more satisfying relationship), and Item 20 asterisk (share innermost feelings). Total score range is 0 to 12 points with an alpha of .87.
3. Emotional Isolation E I: Defined as an affective dimension focused on perceptions of being misunderstood, disappointed, or abandoned. It includes 11 items: Item 2 (disappointed/left alone), Item 3 (no one understands), Item 4 (feel lonely), Item 11 asterisk (close to family), Item 12 (alone with problems), Item 13 (no support/understanding), Item 16 (no family cares), Item 17 (people do not care), Item 19 asterisk (someone to help), Item 21 asterisk (count on friends), and Item 22 (miss people to trust). Total score range is 0 to 33 points with an alpha of .92.
Note: Asterisks indicate items that are reverse scored.
Note: *The items are reversed score.
Semi-structured interview script (Spanish)

Appendix V. Long description
The table is divided into three main sections.
1. Participants: Targets individuals aged 18 to 24, categorized into those who have started university, those who have not yet started, and non-university individuals in various employment or vocational training (F P) situations. It notes a focus on social class, as lower-income and unemployed individuals report higher levels of loneliness.
2. Dynamics: Describes an open interview format lasting a maximum of one hour, designed to generate new items related to loneliness. The interviewer allows the subject to guide the conversation from general topics to personal experiences.
3. Interview Script (Guión de la Entrevista): Broken into five chronological parts:
• Part 1, Introduction: Covers voluntary participation, anonymity, and audio recording consent.
• Part 2, Initial Questions: Focuses on the transition to university or new life stages, exploring insecurity, isolation, and group acceptance.
• Part 3, Exploration of Loneliness: Investigates specific moments of loneliness, the role of family and social media, and the feeling of being misunderstood.
• Part 4, Personal Examples: Requests specific anecdotes of loneliness and what helped alleviate those feelings, emphasizing the distinction between loneliness and lack of understanding.
• Part 5, Conclusion: Final thanks and reiteration of data anonymity.
Semi-structured interview script (English)

Appendix VI. Long description
The table is divided into three main vertical sections.
1. Participants: Targets young people aged 18 to 24 years, categorized into those who have started university, those who have not, and non-university students in vocational training or employment. A note emphasizes selecting participants from lower social classes and unemployed backgrounds due to higher loneliness risks.
2. Dynamics: Describes an open-ended interview style aimed at generating new items related to loneliness. It specifies a duration of no more than one hour, starting with general questions about others before moving to personal experiences.
3. Interview Script: Organized into five chronological phases:
• Introduction: Covers gratitude, anonymity, and audio recording consent.
• Initial Questions: Focuses on the transition to university or current life stages, addressing insecurity, isolation, and social media’s role. It includes topics like uncertainty about the future and self-esteem.
• Exploration of Loneliness: Probes the causes of loneliness, the importance of family versus peers, and the impact of social media and youth unemployment.
• Personal Examples: Requests specific anecdotes of feeling lonely or misunderstood and identifies what helped alleviate those feelings. It notes a key distinction must be made between loneliness and misunderstanding.
• Conclusion: Final thanks and re-confirmation of data anonymity.
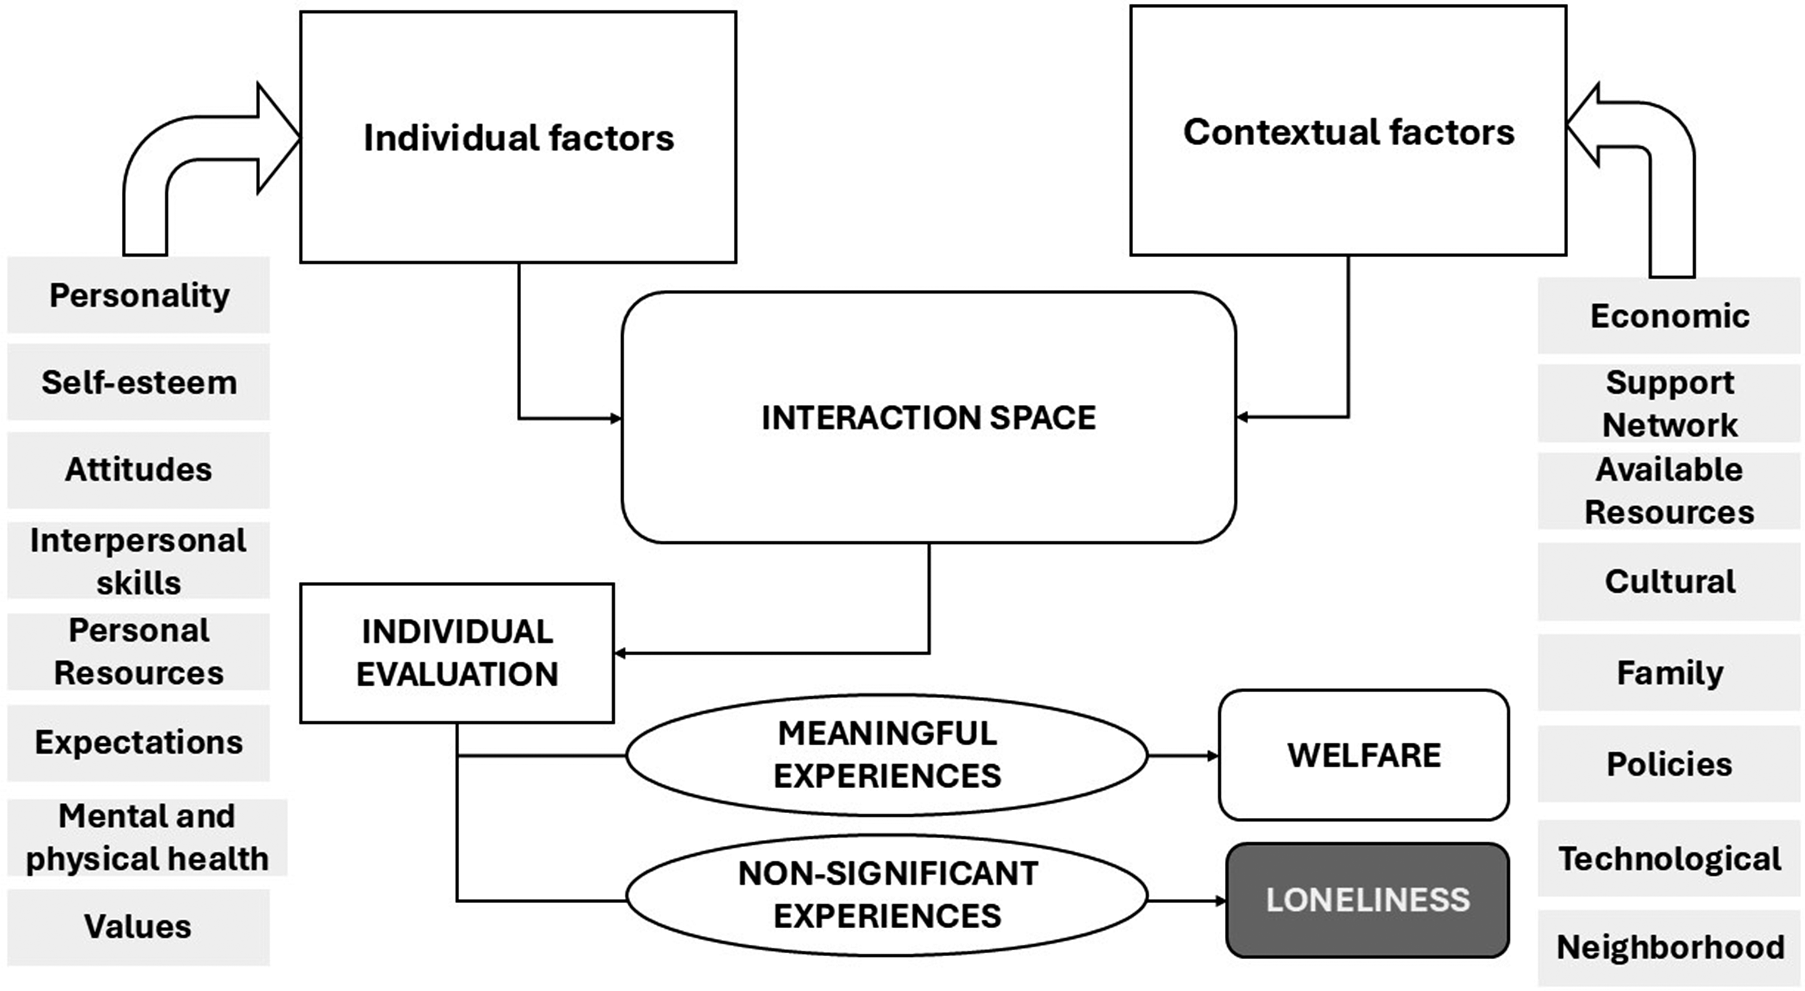
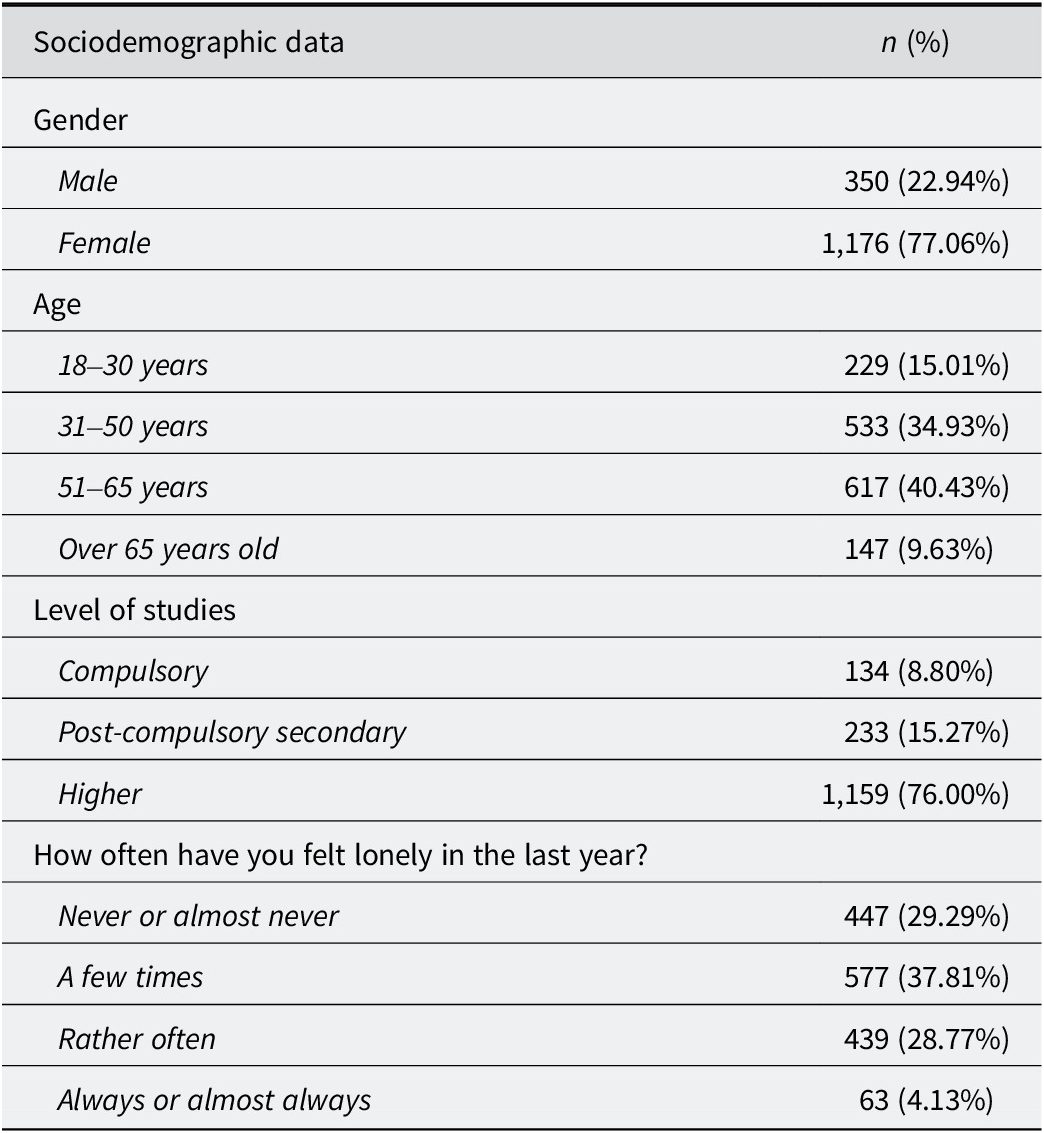
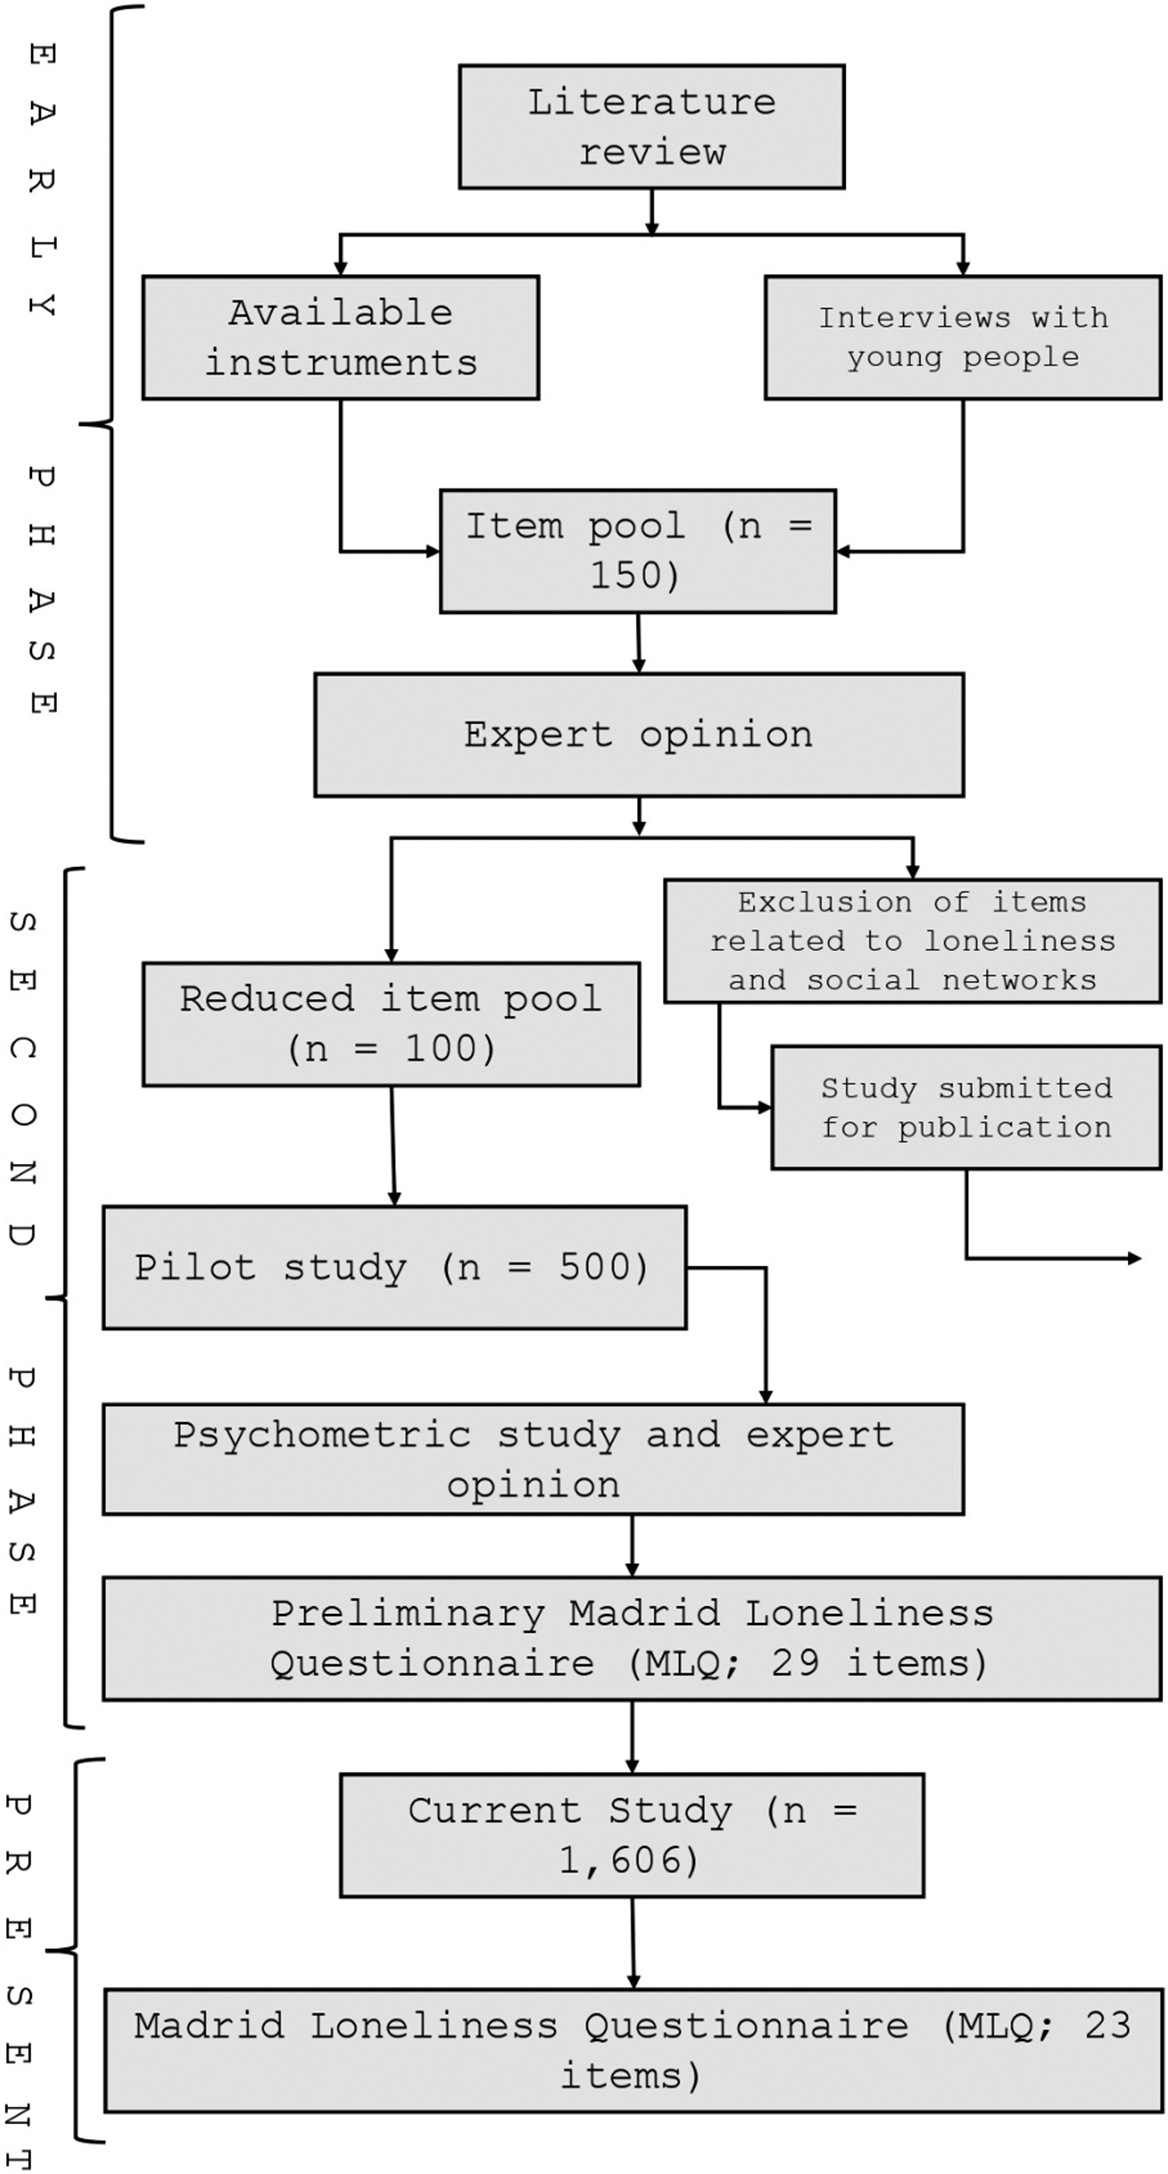
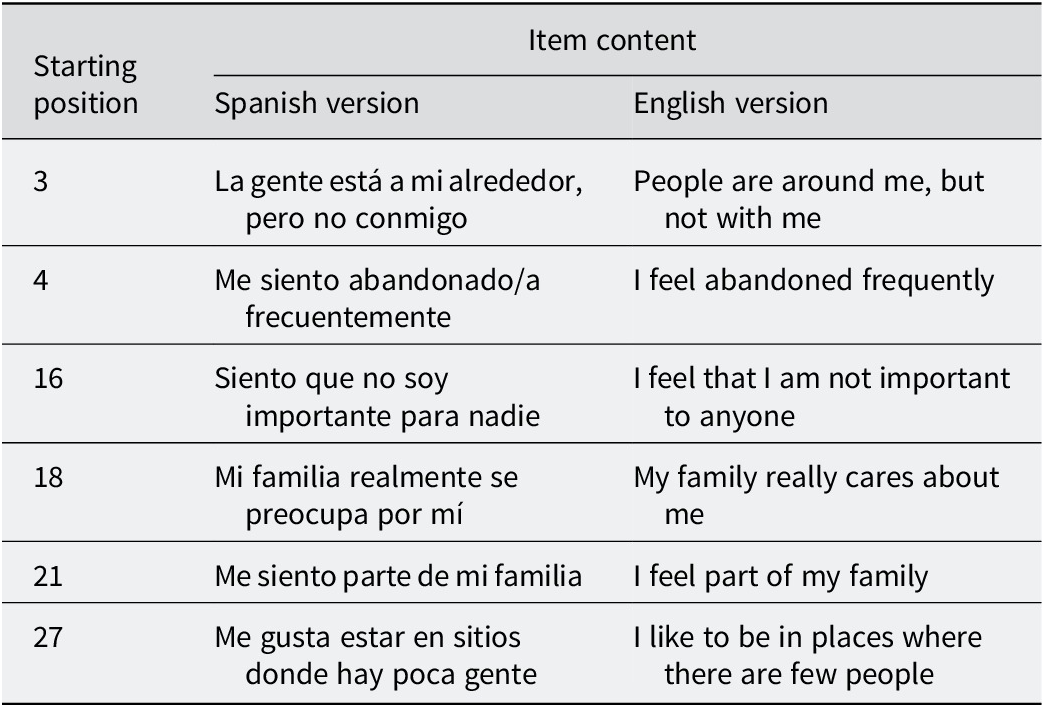
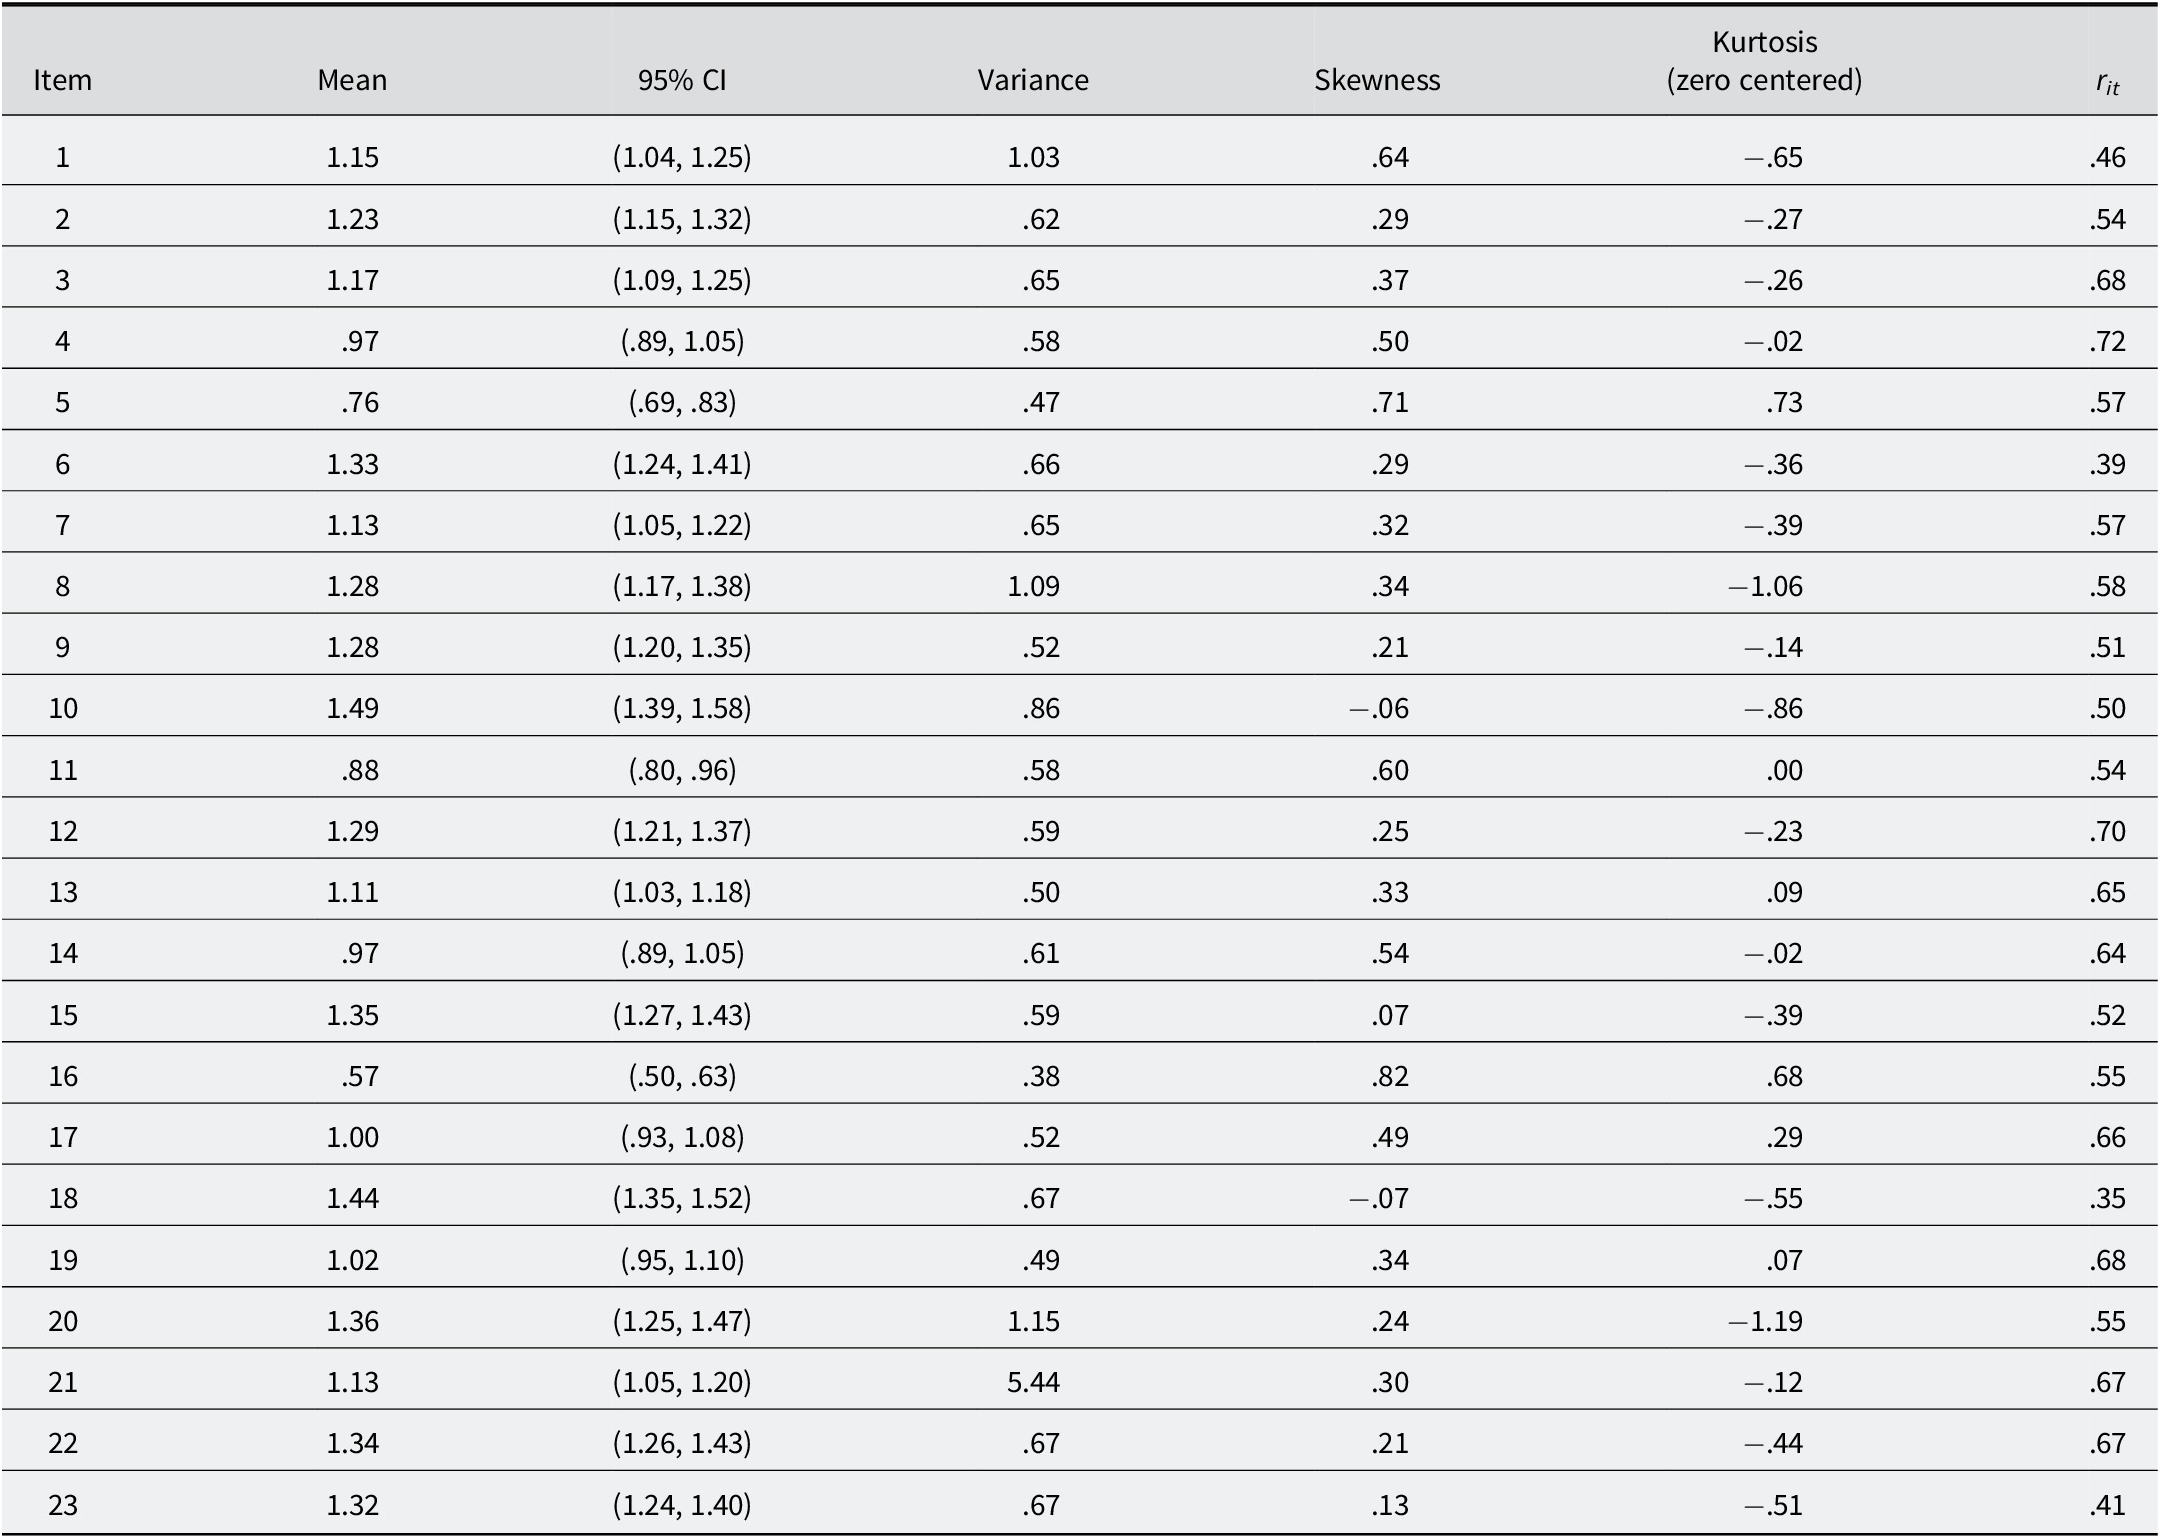
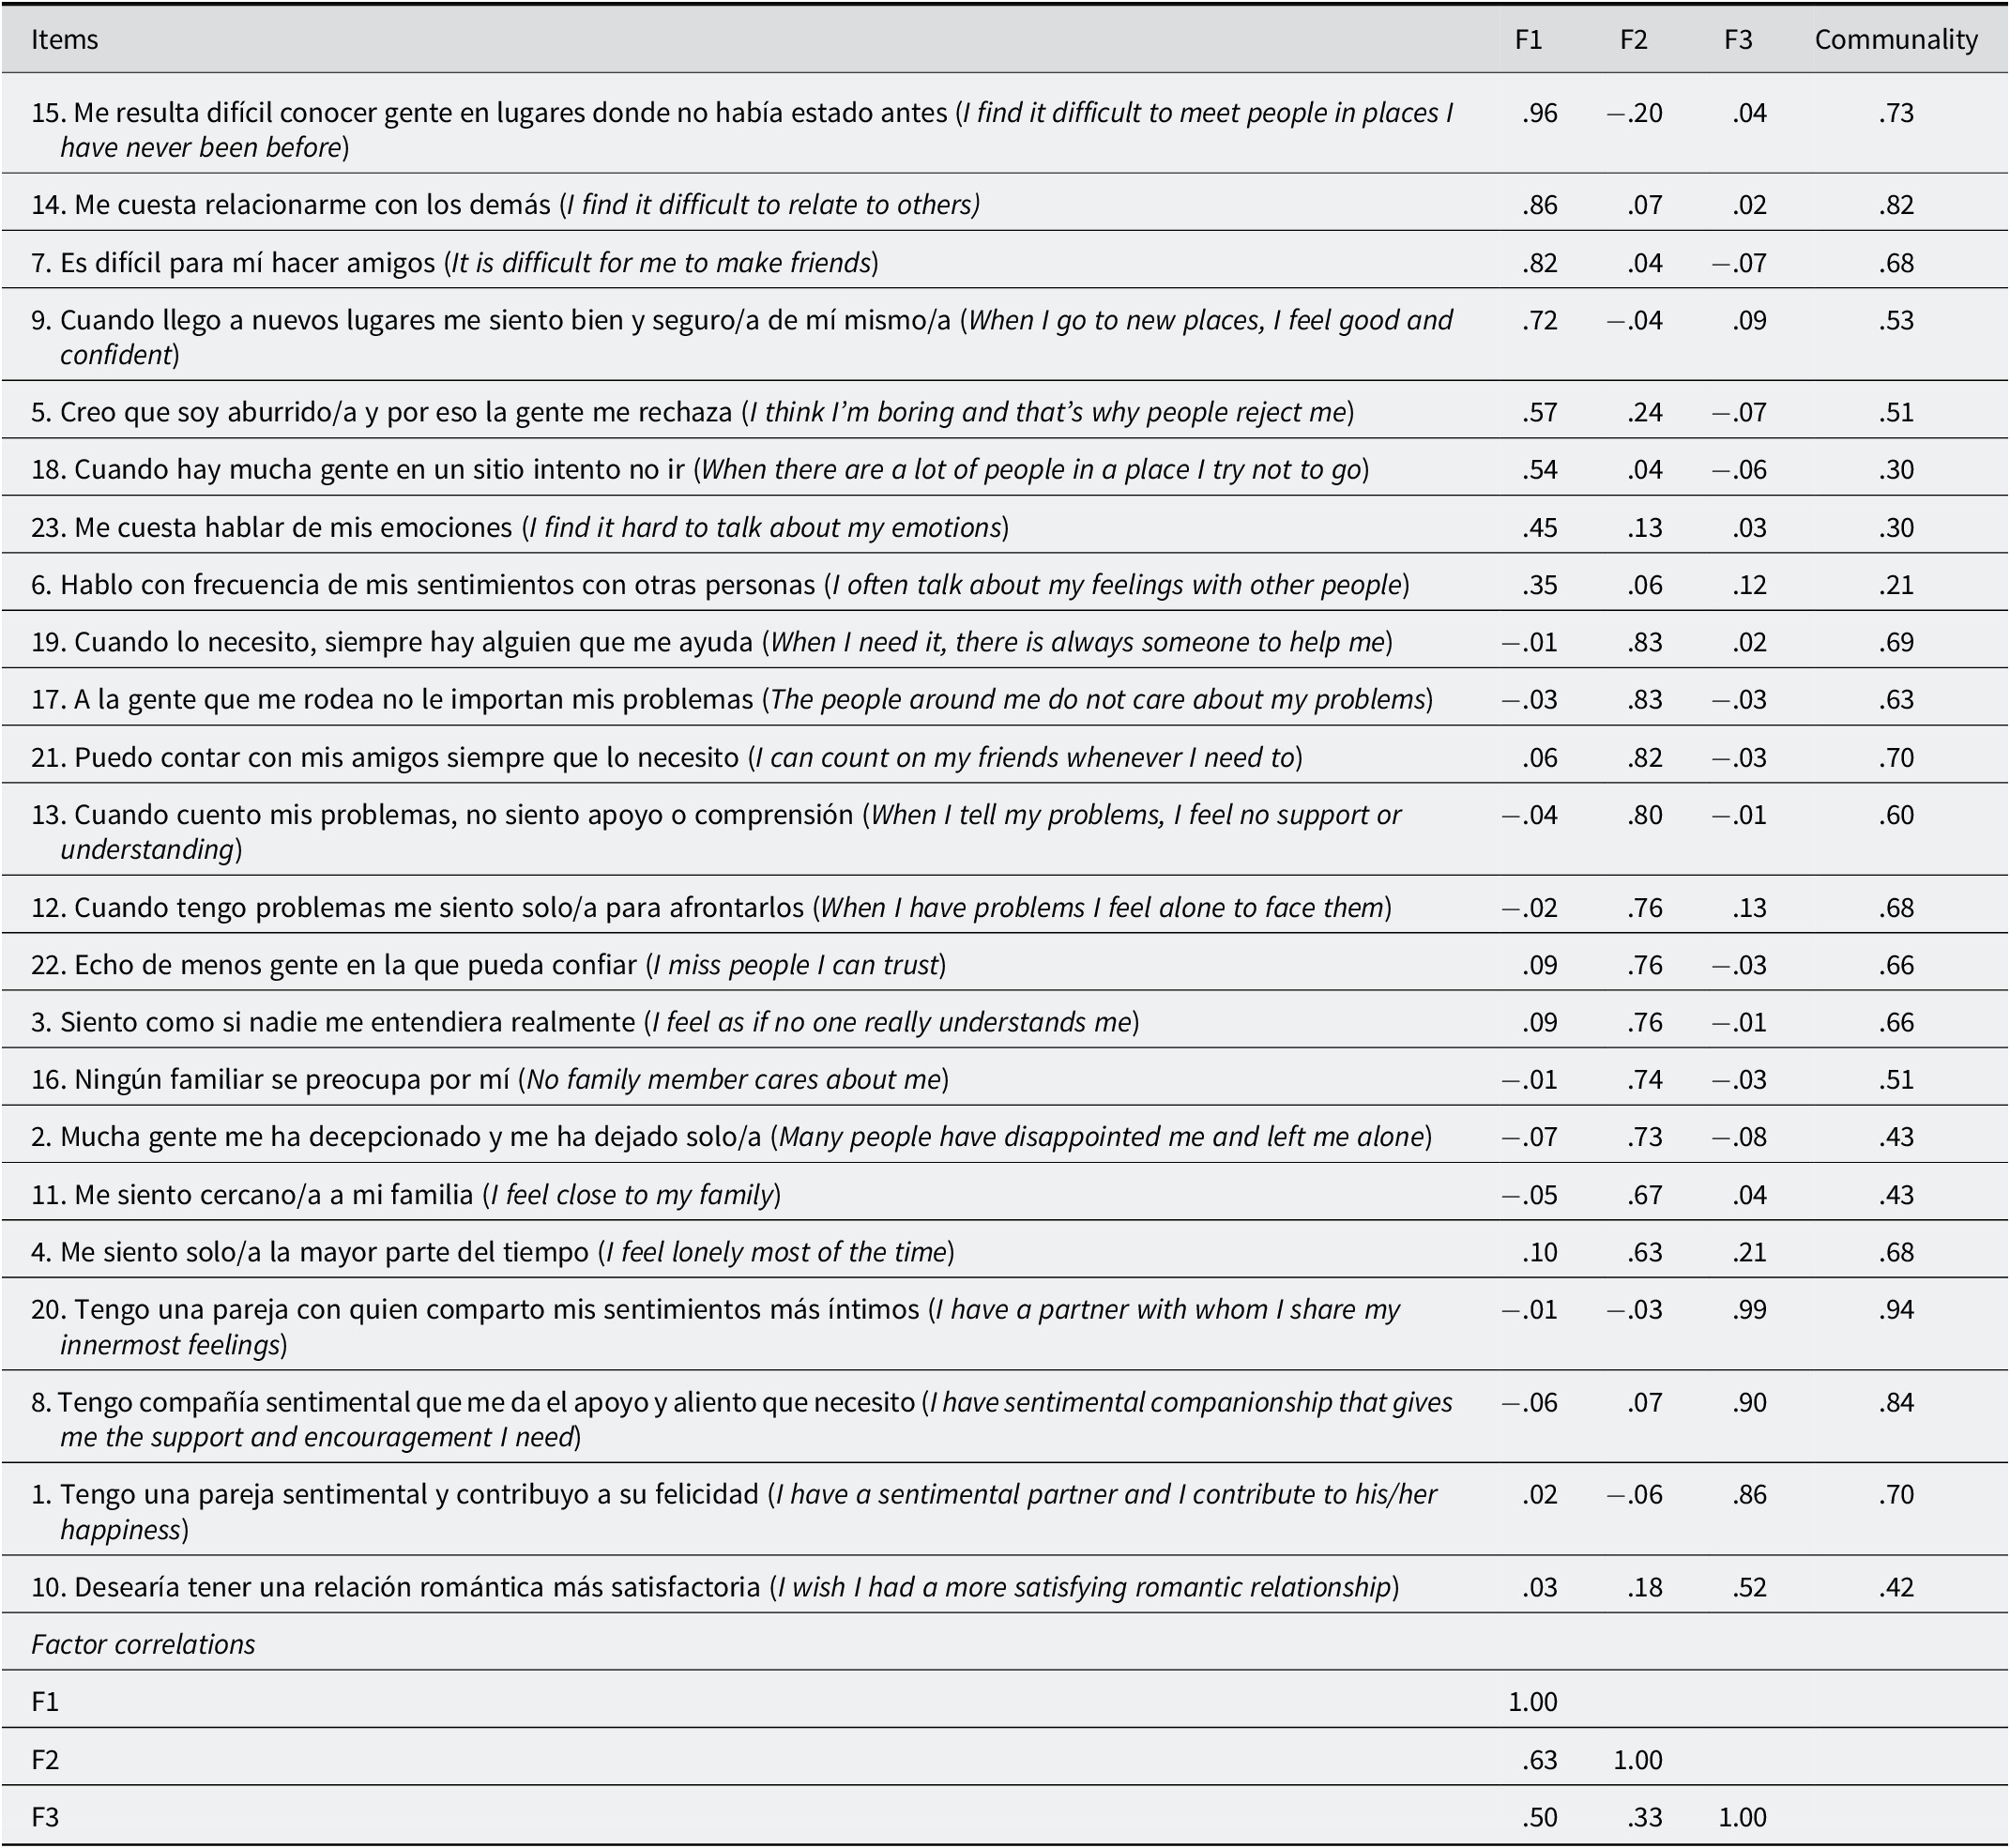
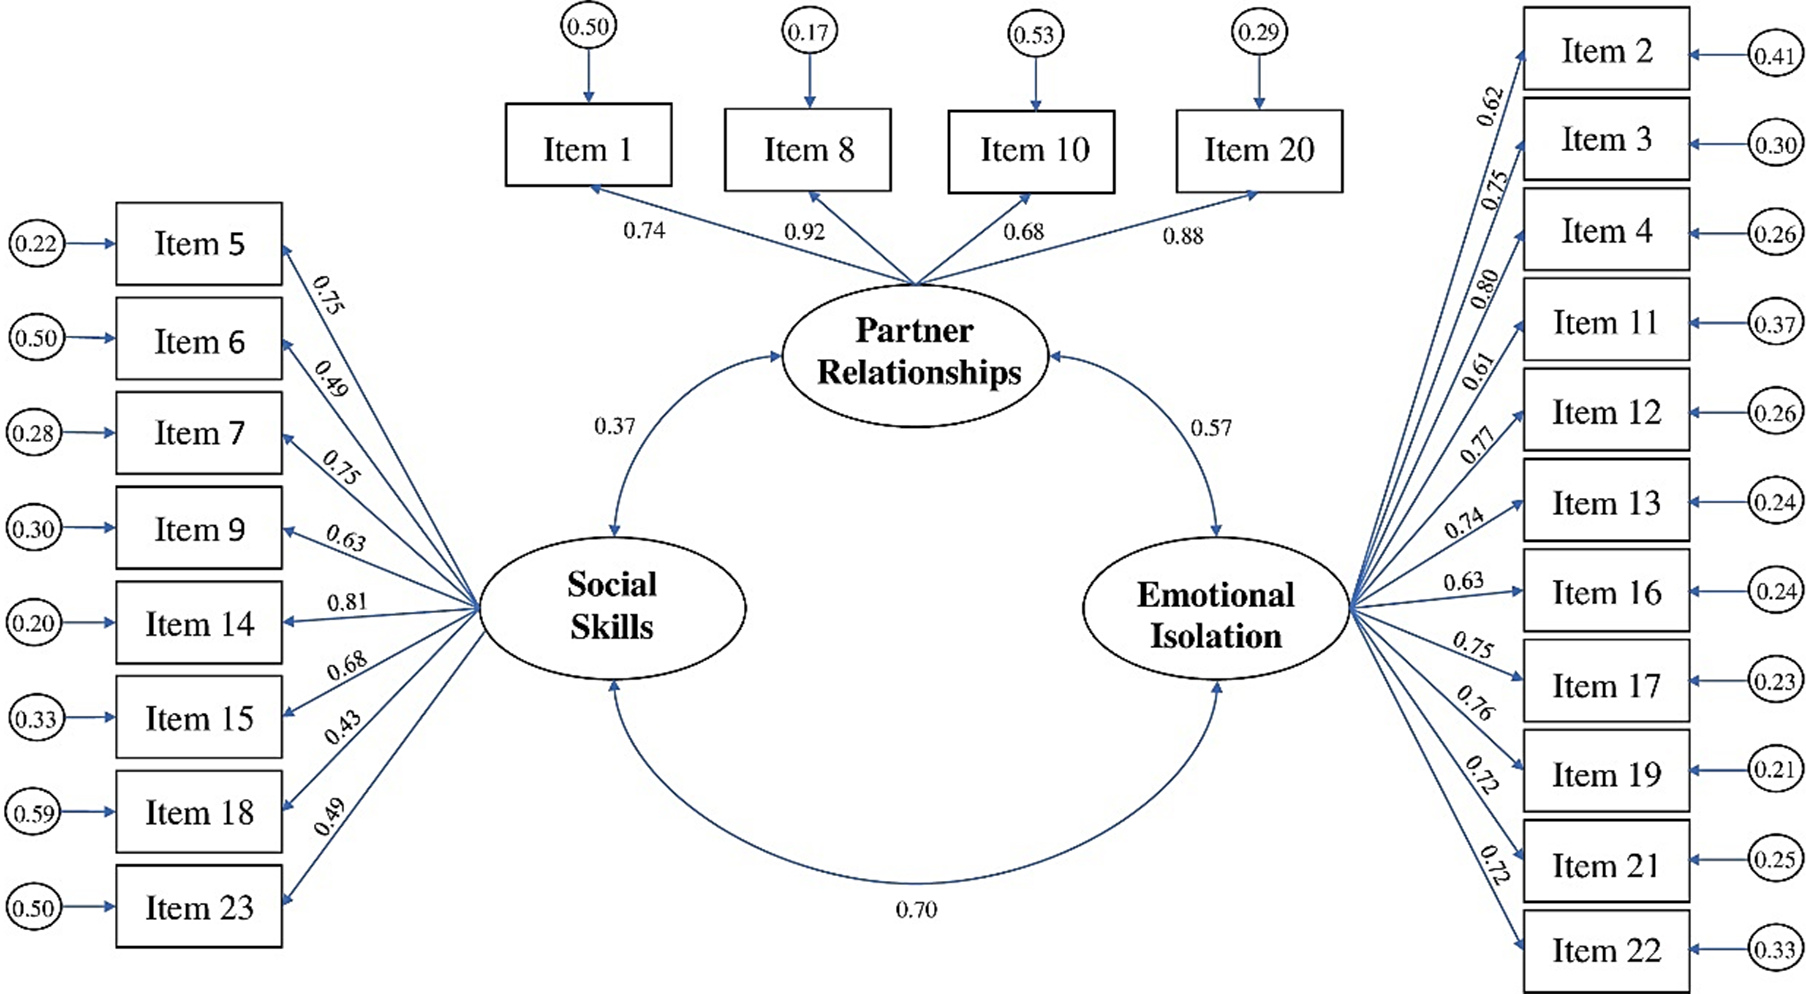
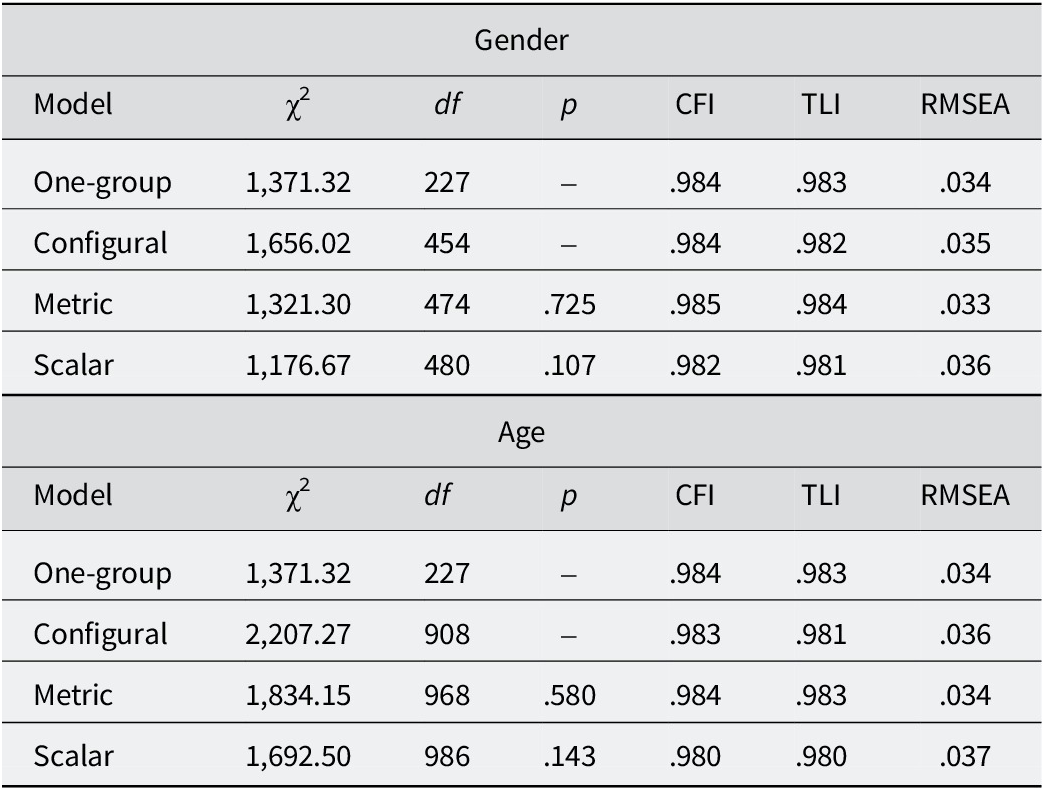
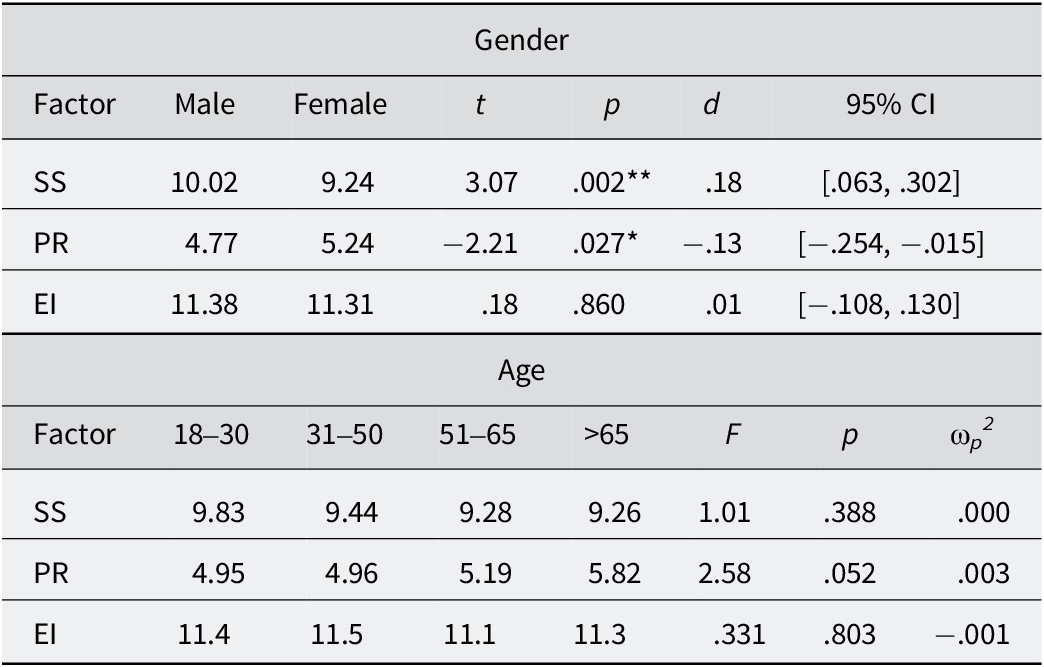
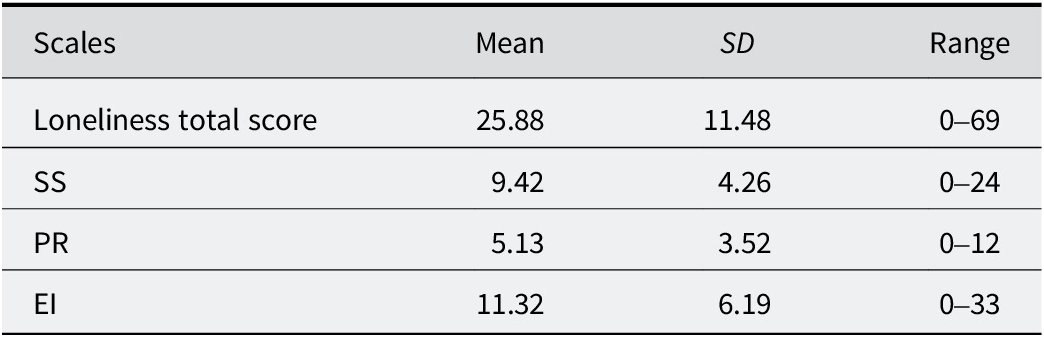
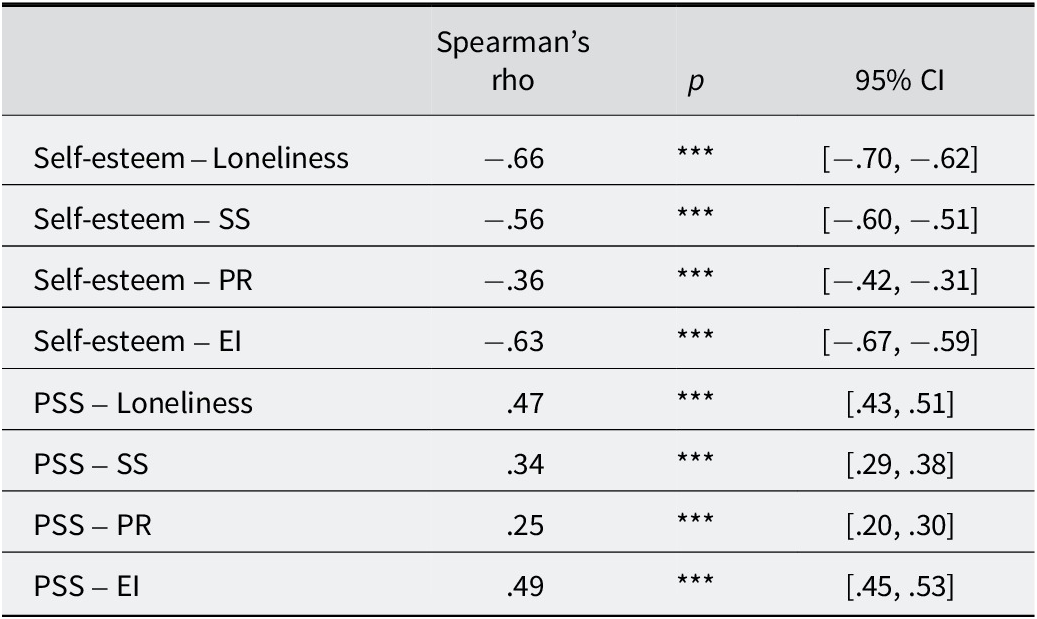
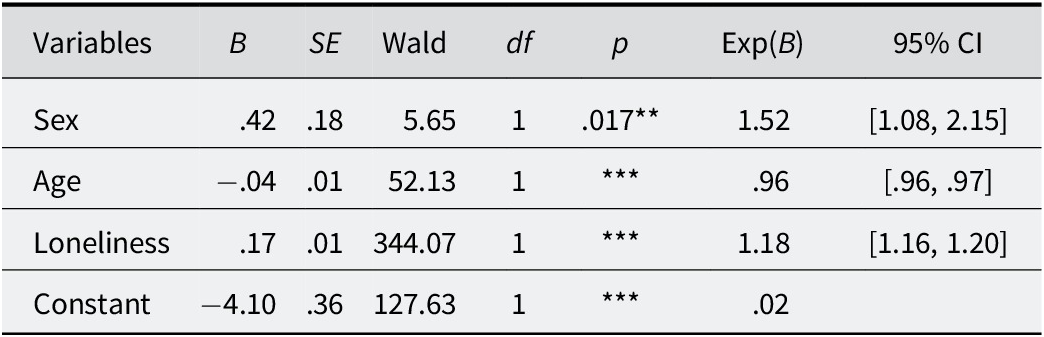
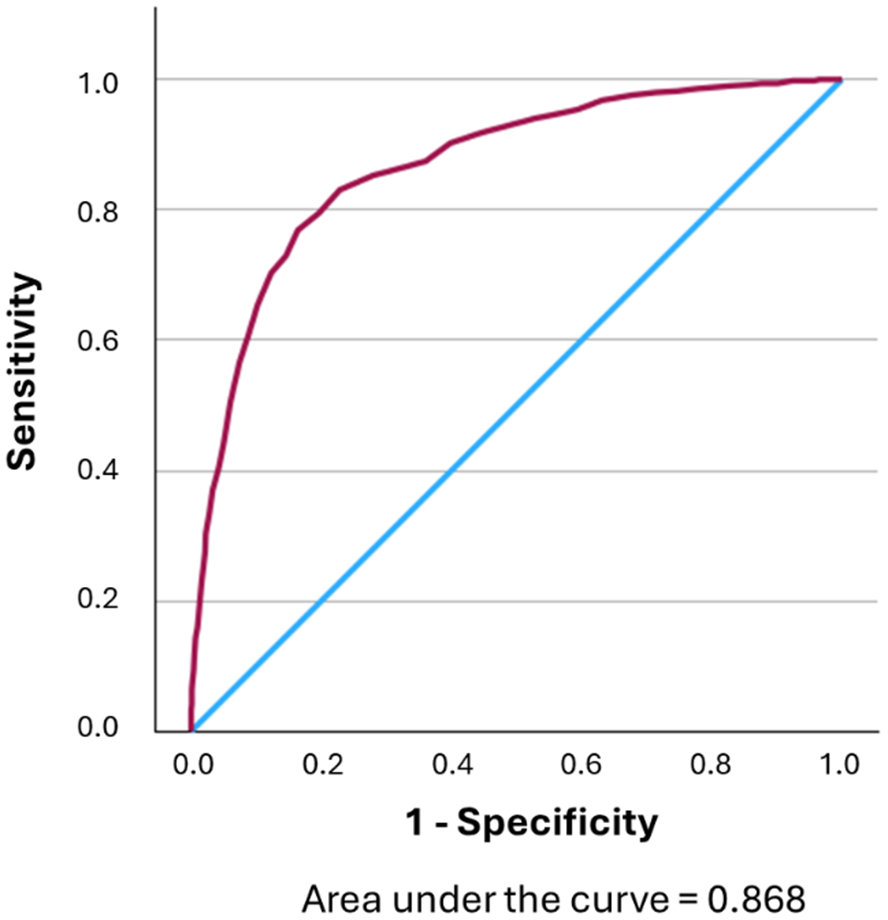
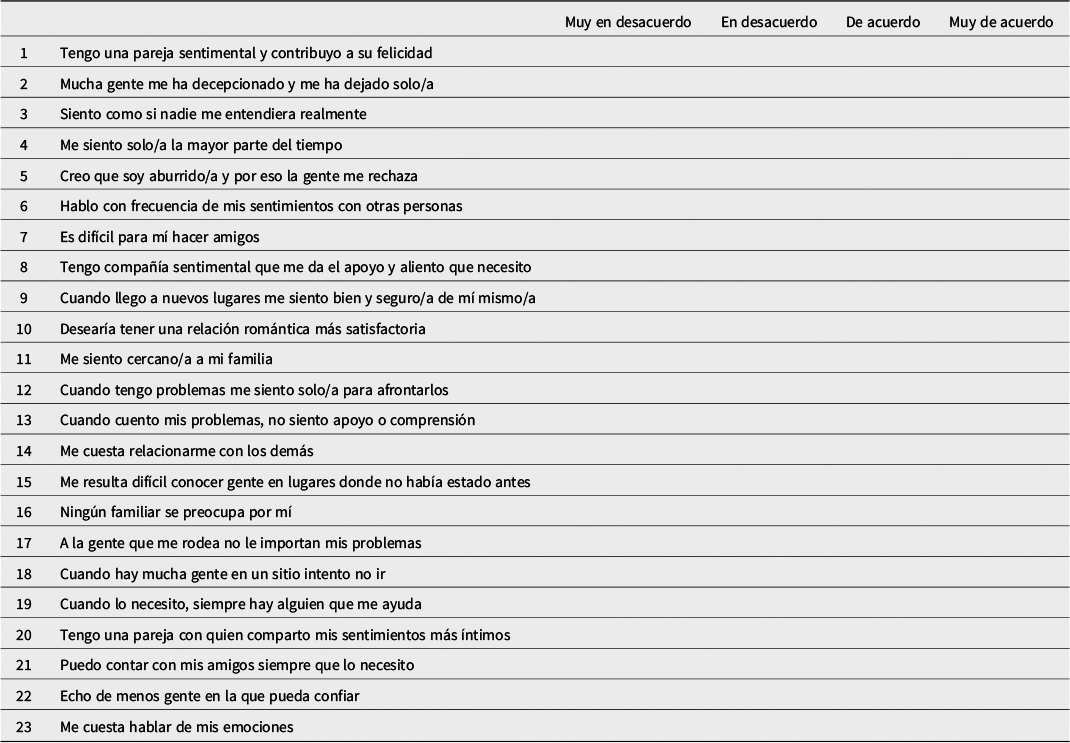
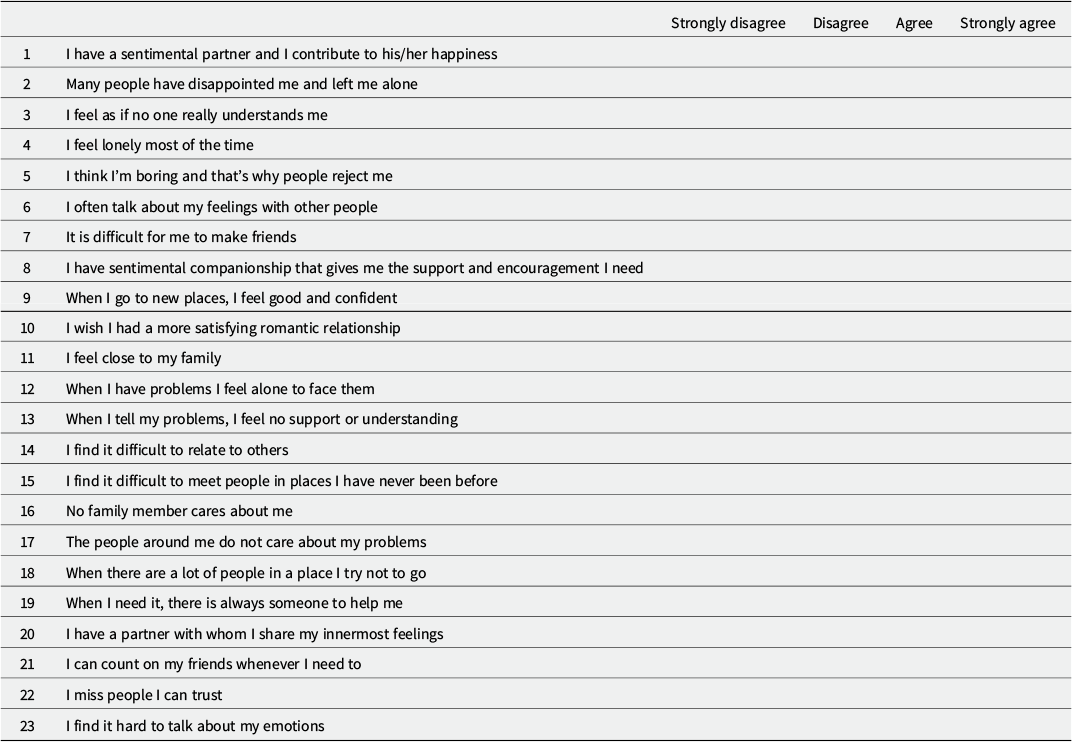
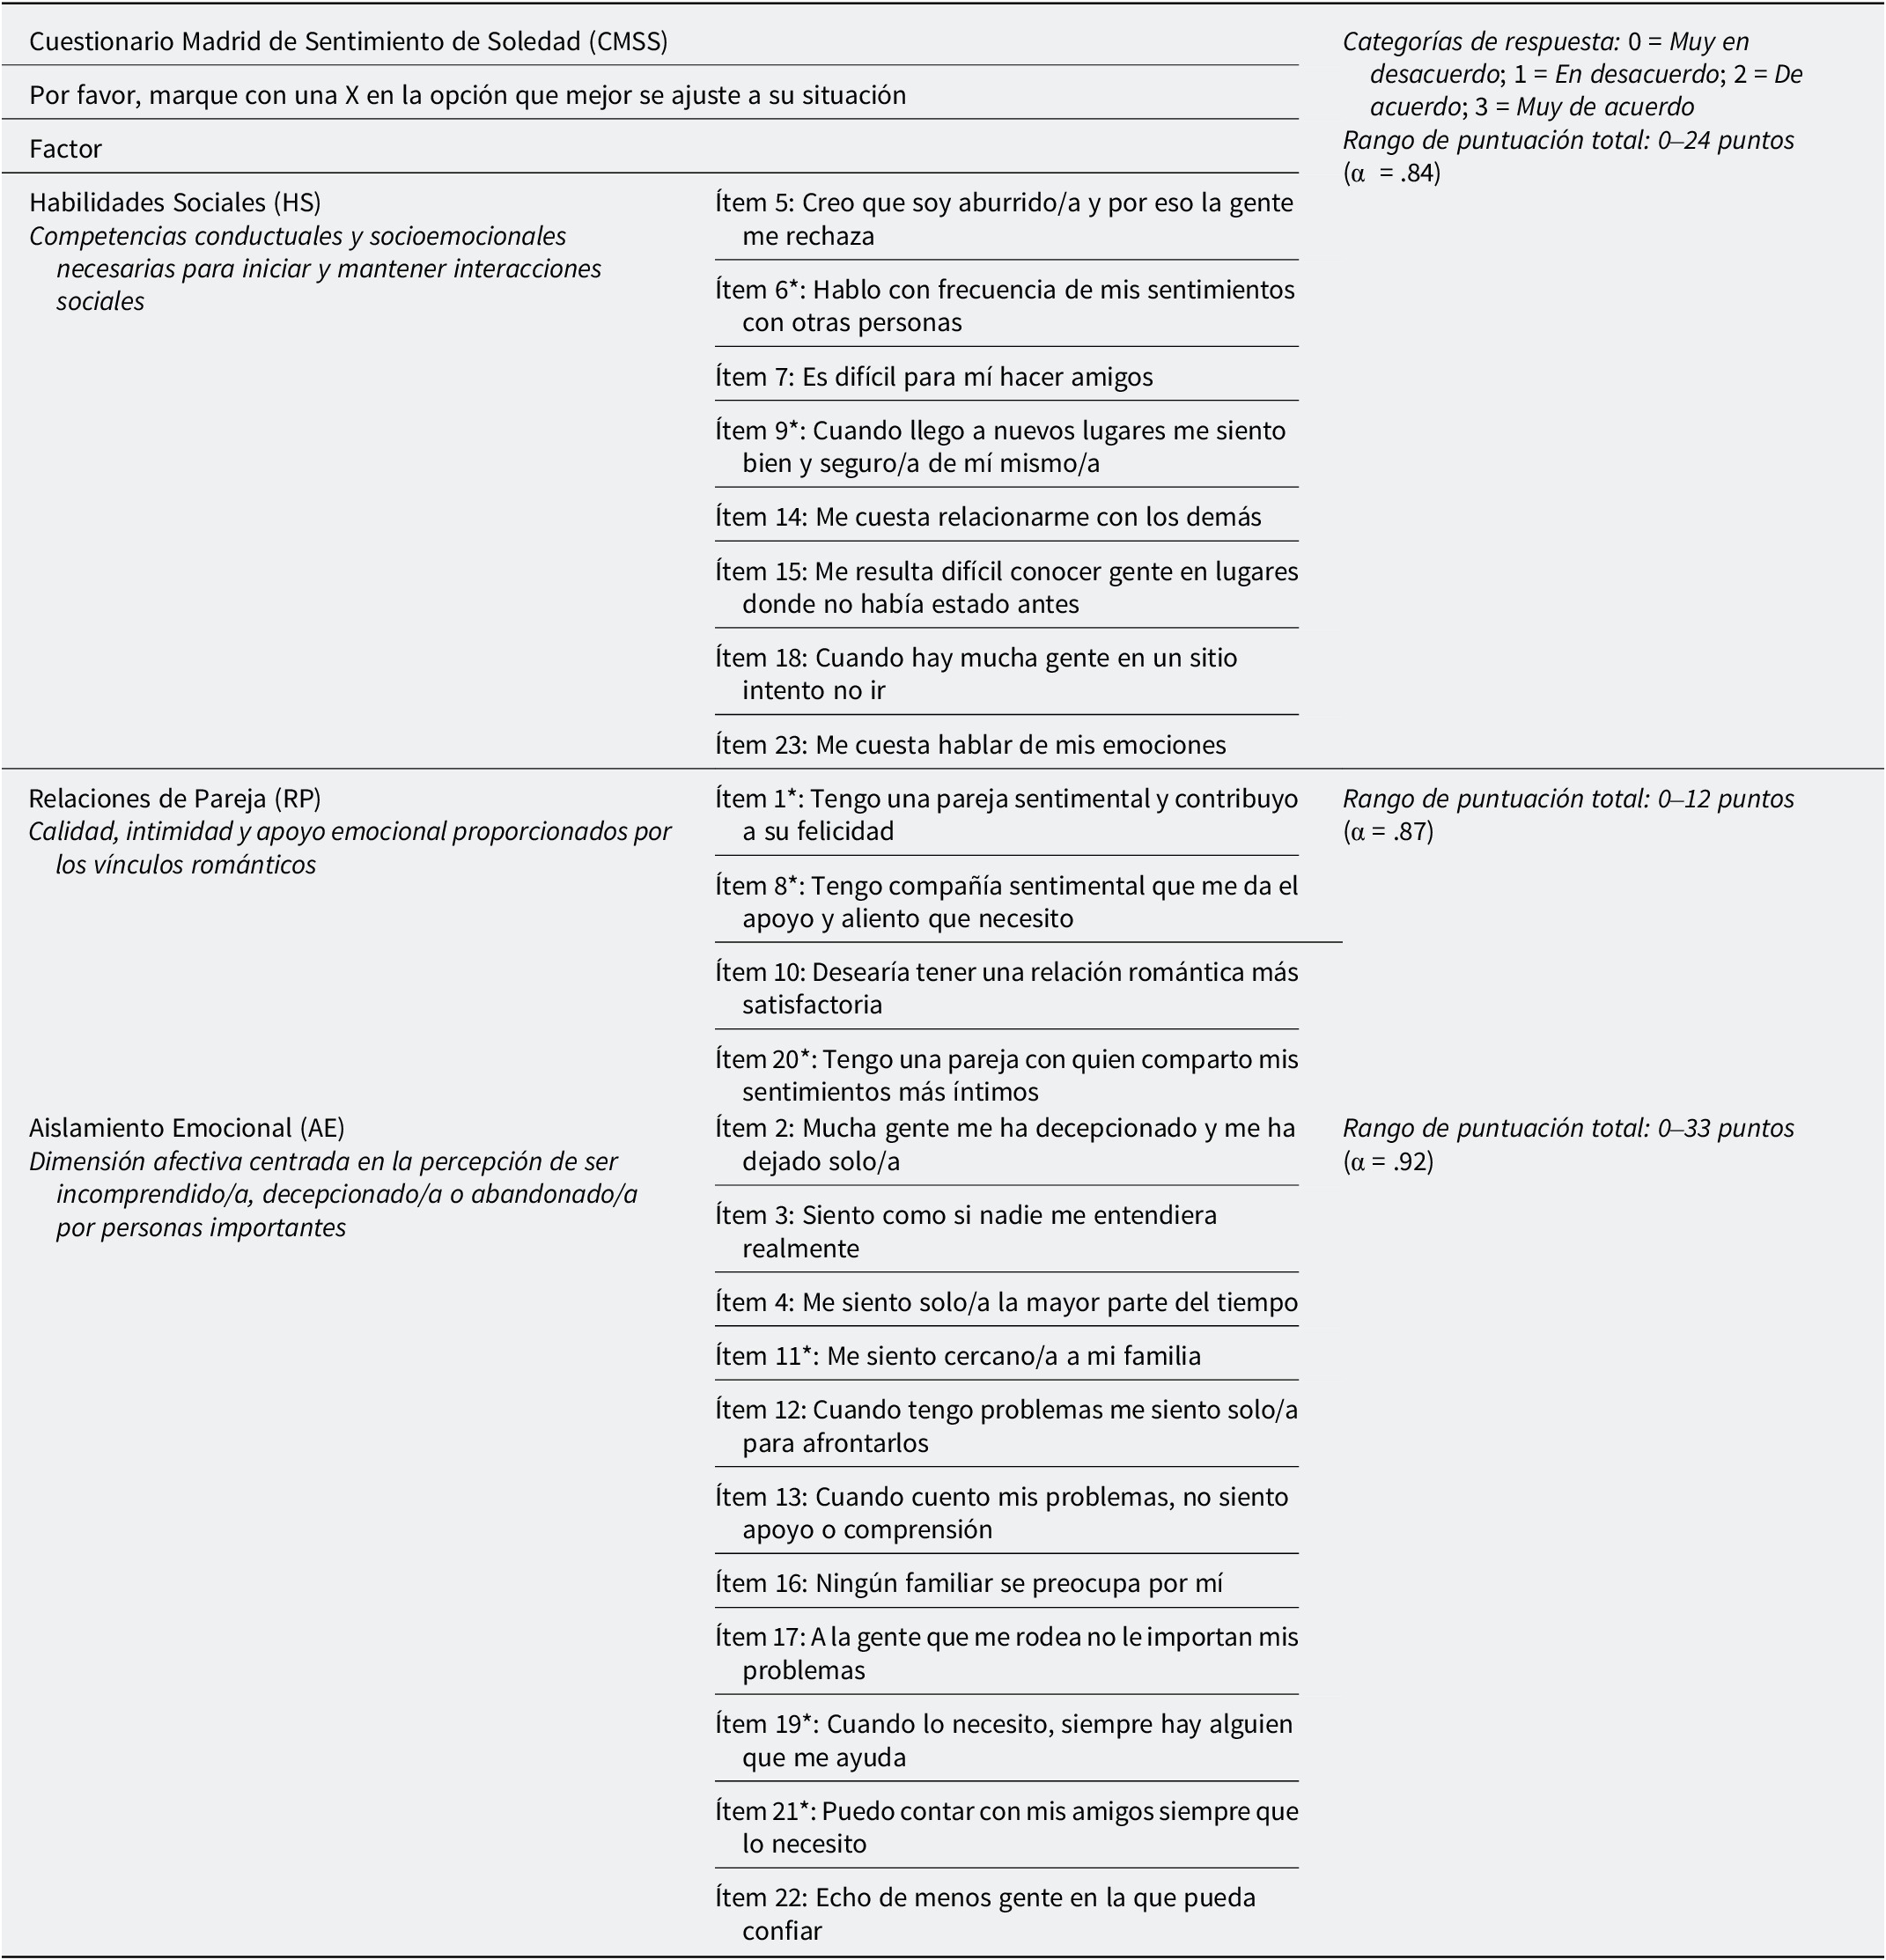
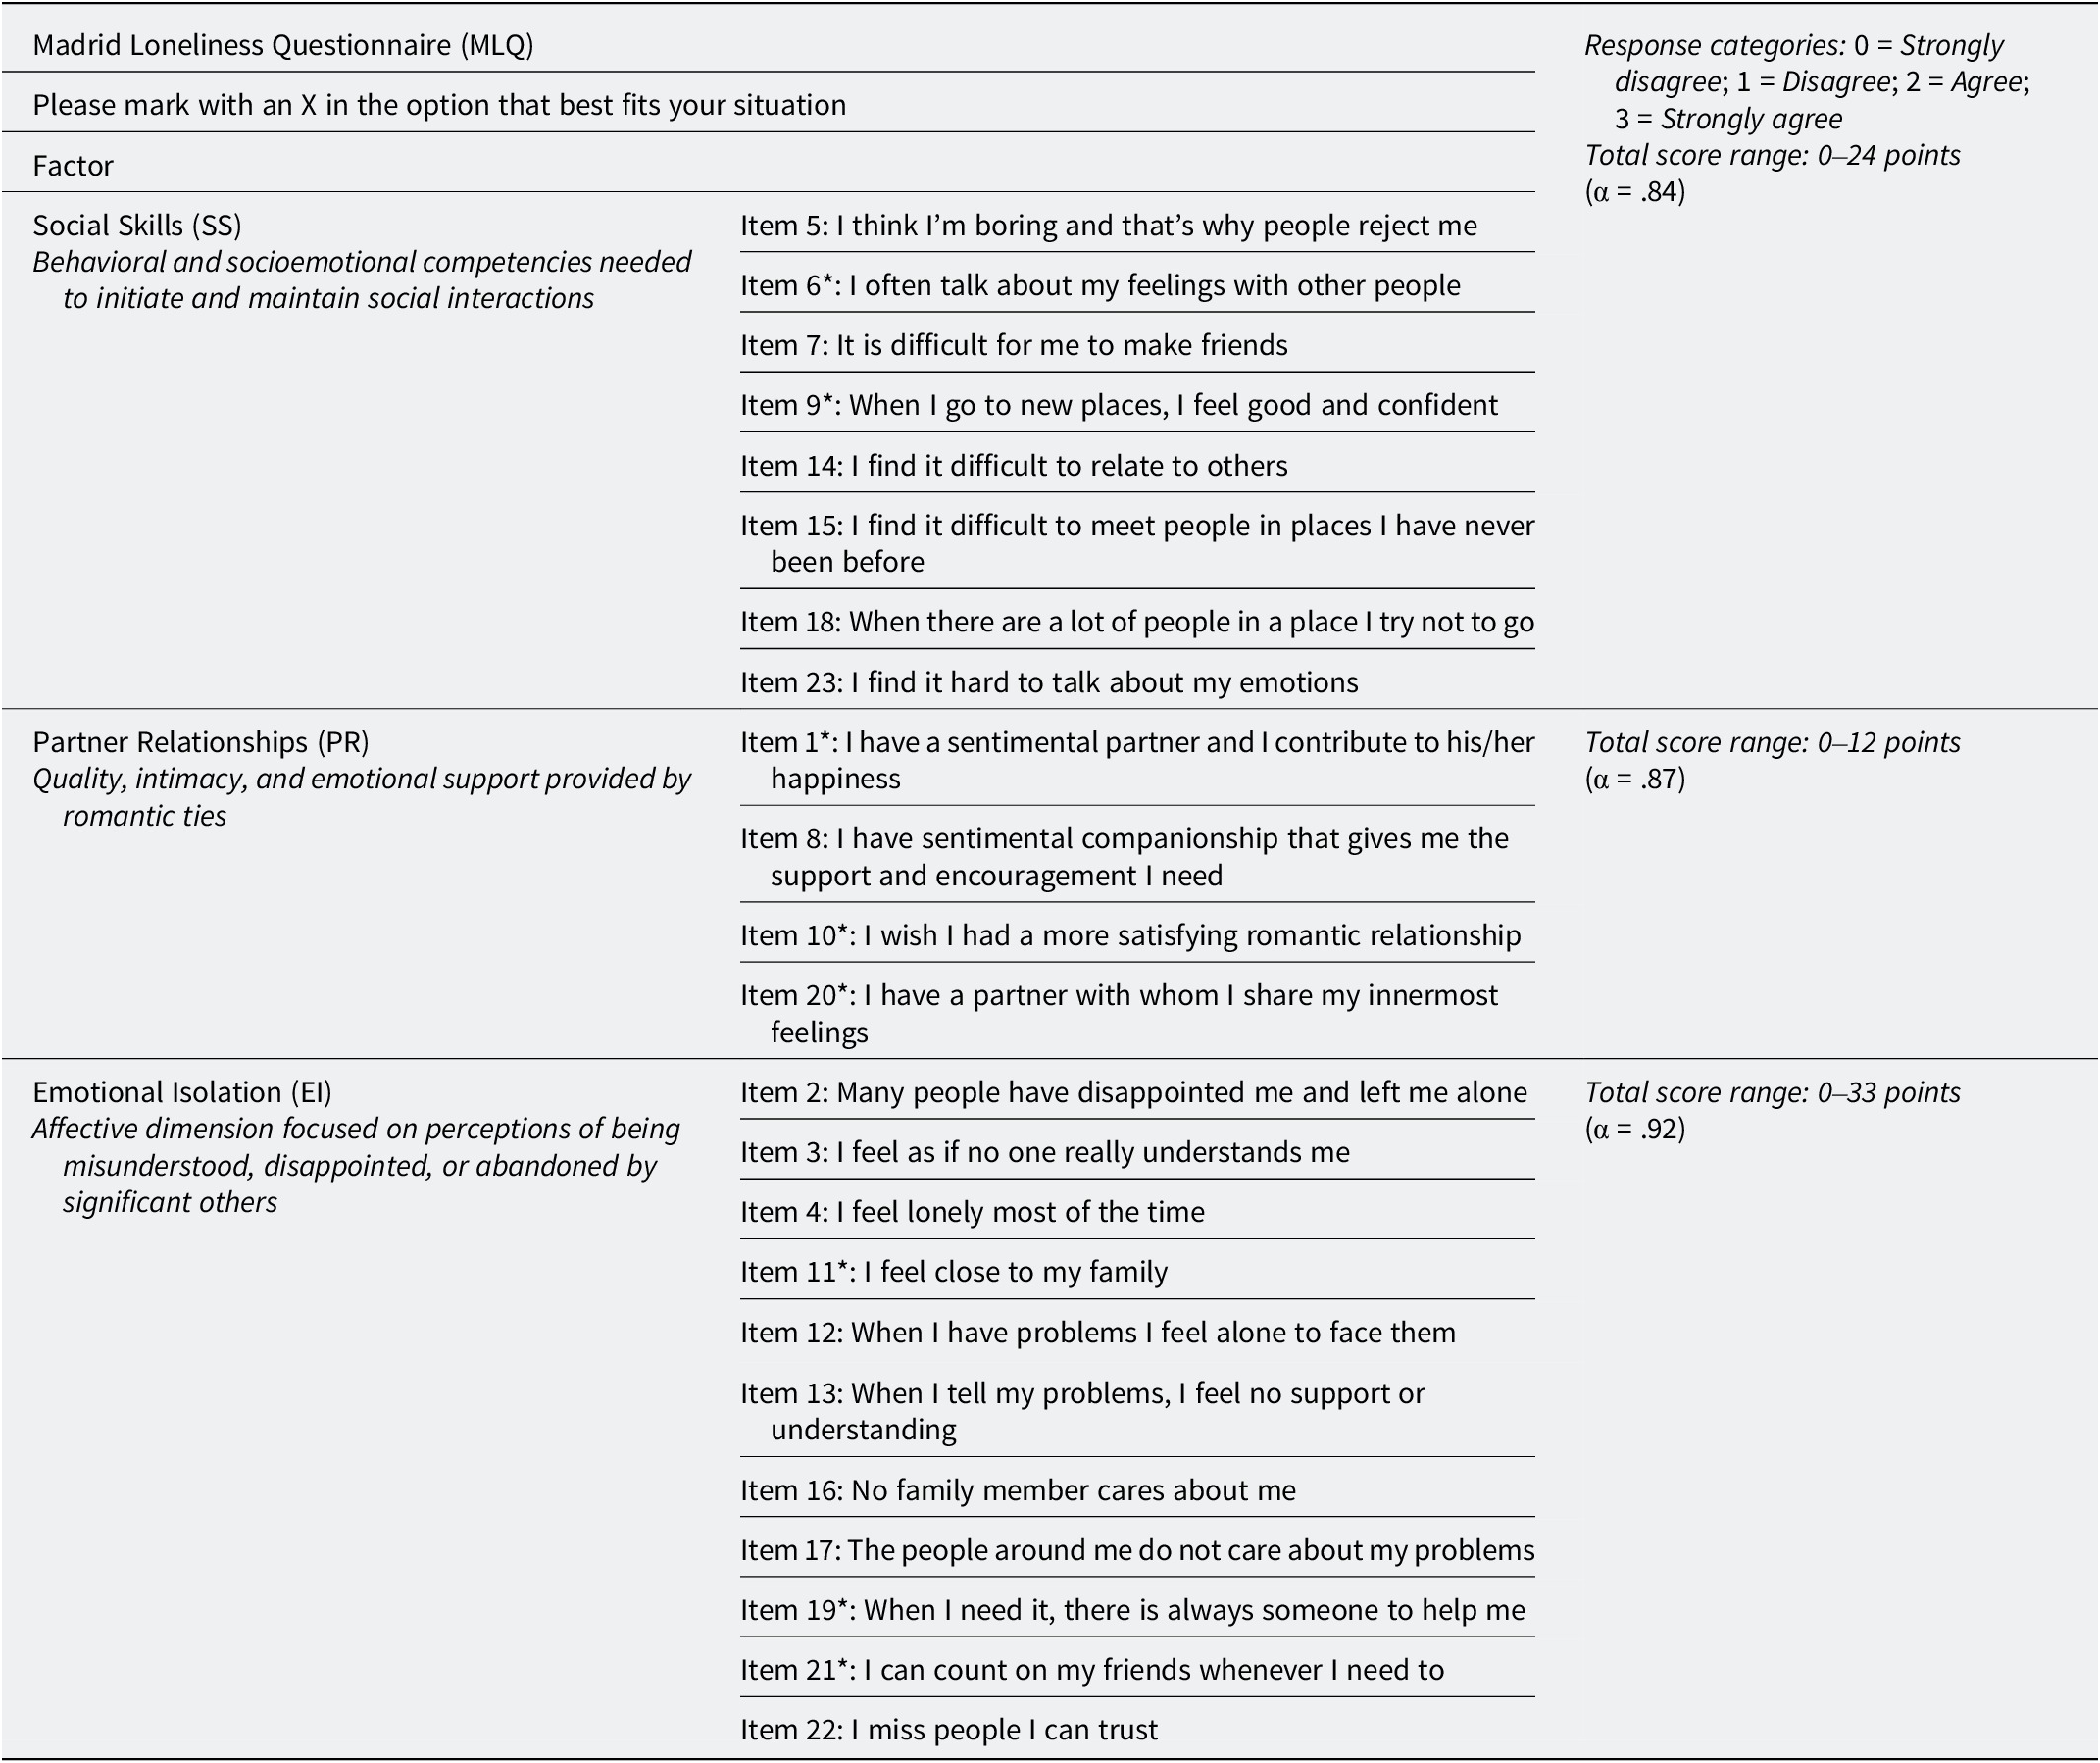
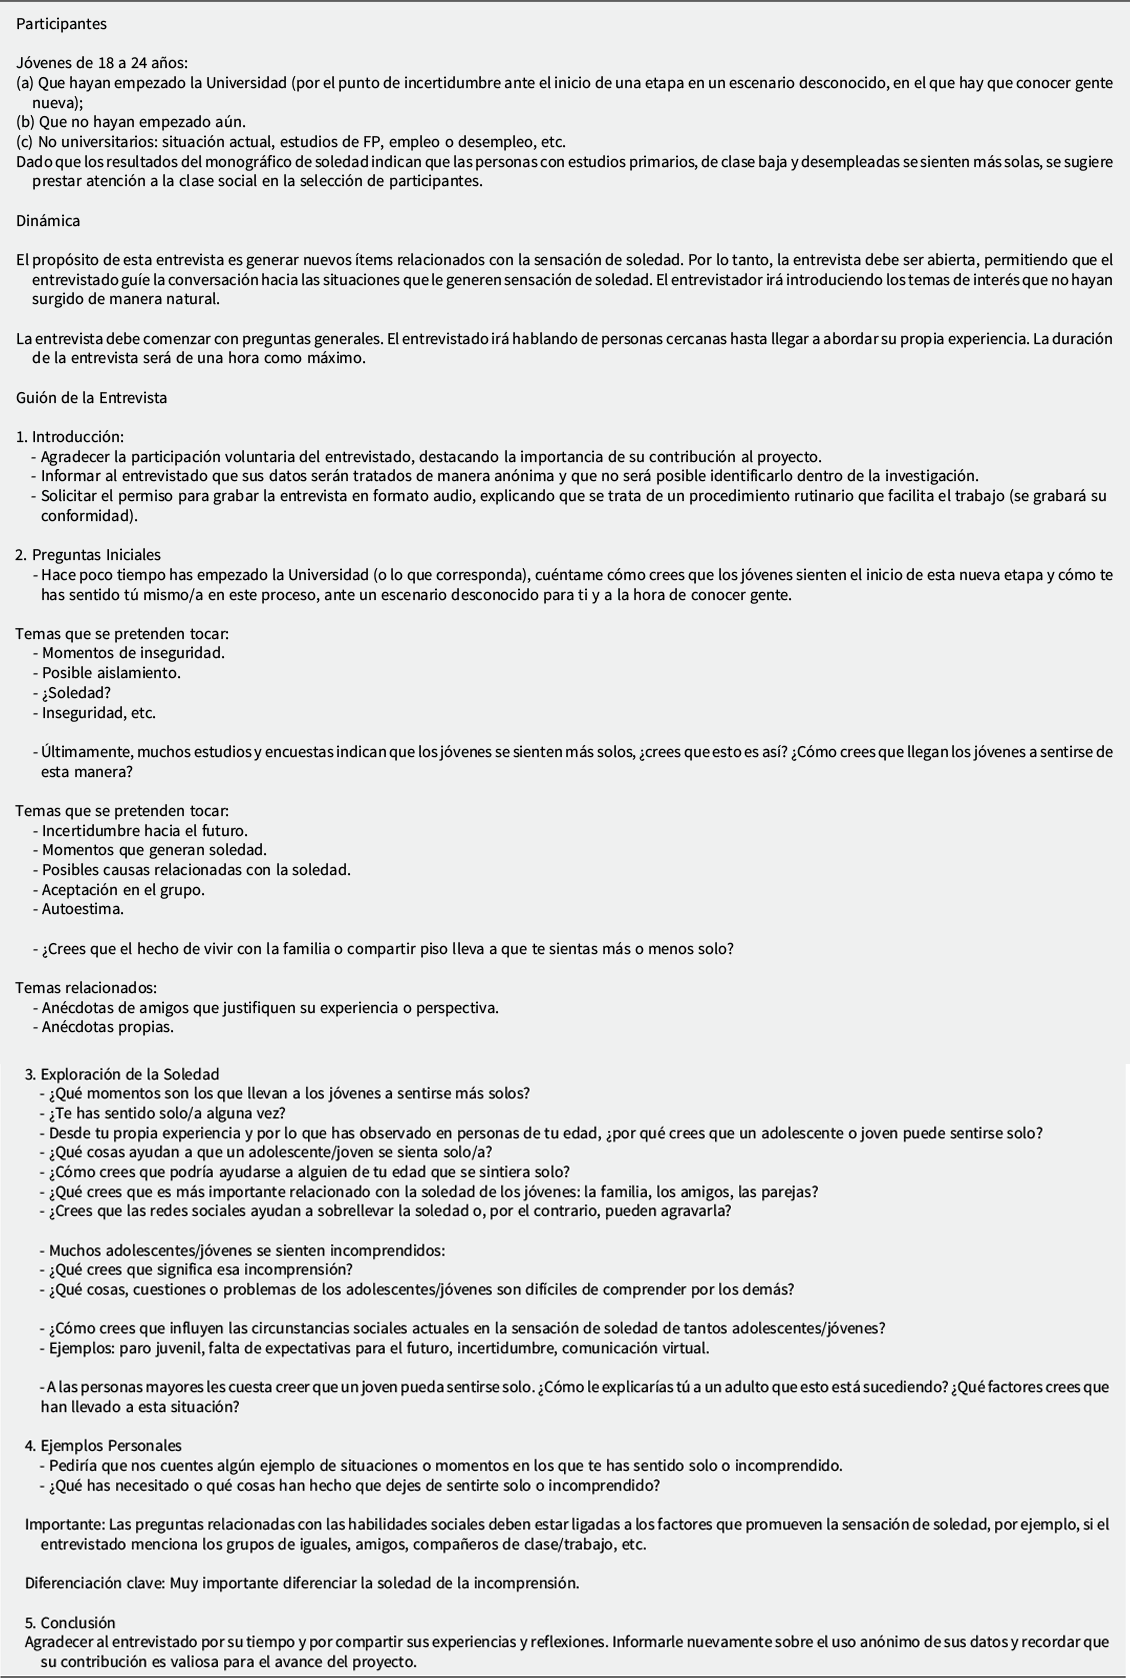
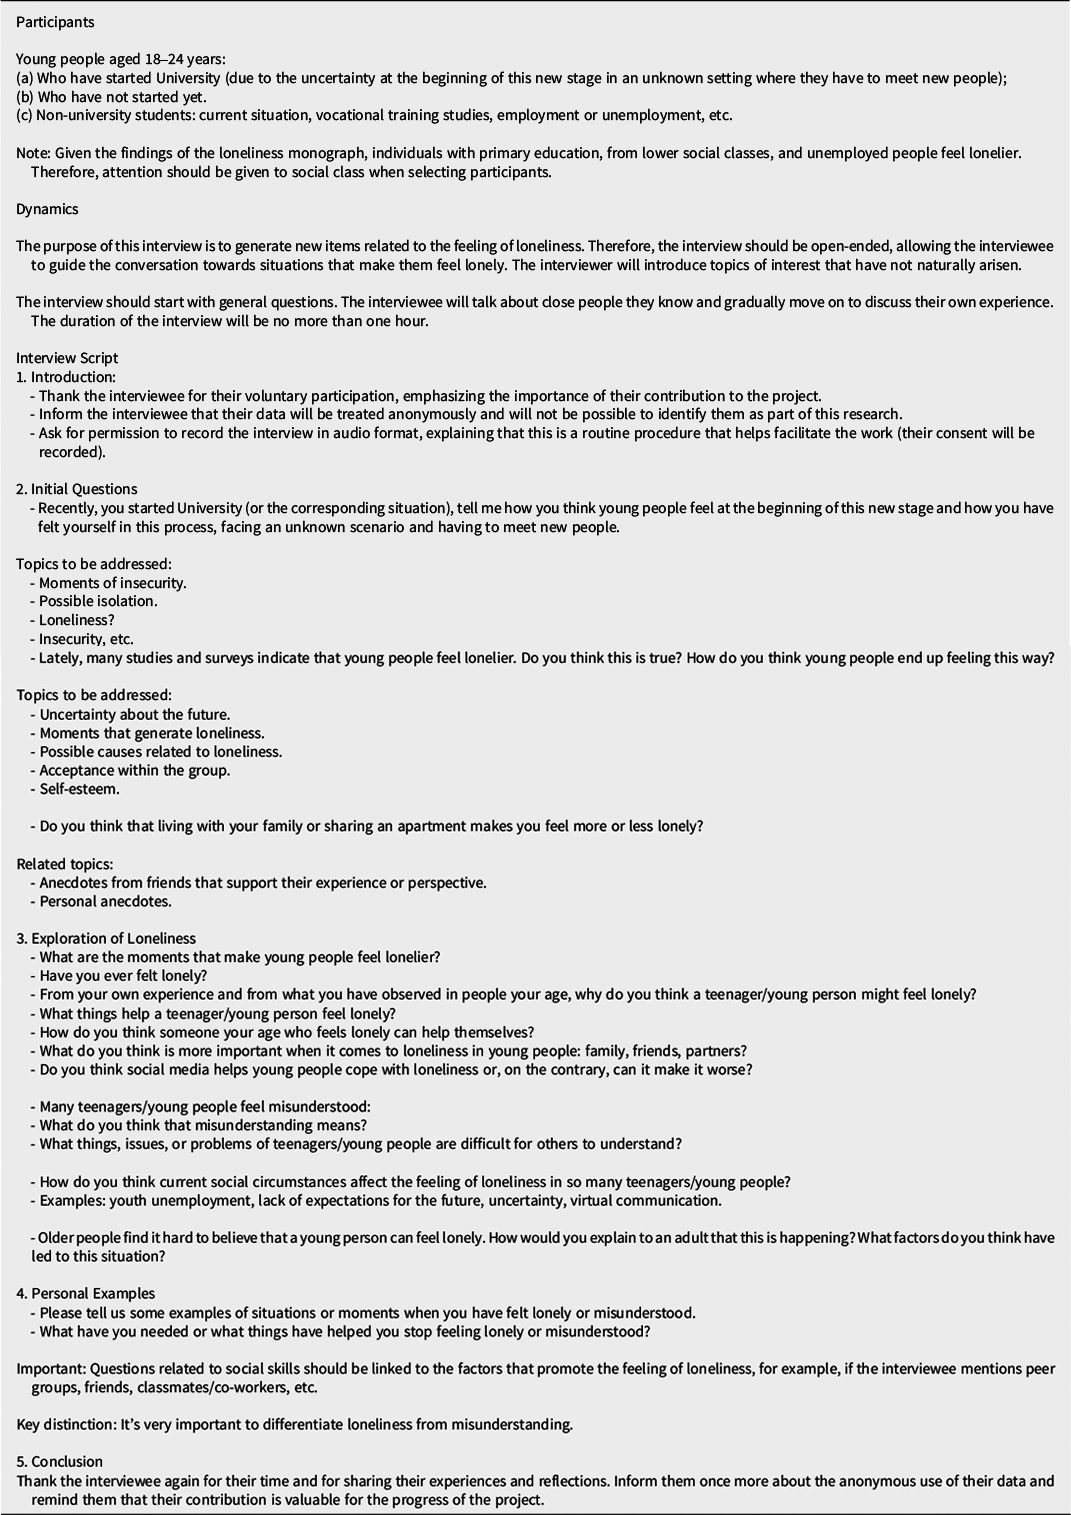


 Open access

