


Several decades of research demonstrate the importance of social capital across a variety of different questions relevant to public policy including the structure of public programs, how citizens engage with the policy process, policy outputs and outcomes, and the distribution of burdens and benefits within society. While the topic of social capital has received several different treatments in its theoretical construction and empirical operationalization, the most widely known definition comes from Putnam’s (Reference Putnam2000) Bowling Alone which defines social capital as “social networks and the norms of reciprocity and trustworthiness that arise from them” (19). Social capital, the argument goes, is developed, reinforced, and facilitated through citizens’ interactions with community and organizational life, engagement in public affairs, community volunteerism, informal sociability, and social trust – with each factor serving an essential role in effective public policy, and democracy, more broadly. As argued by Anderson and Jack (Reference Anderson and Jack2002), social capital serves as “society’s lubricant,” holding communities together and allowing society to function more smoothly. Towards this end, social capital can reinforce notions of social compliance, civic participation, and coproduction, which are all necessary prerequisites for translating policy preferences into tangible policy outcomes (Hawes and McCrea Reference Hawes and McCrea2018).
Under this perspective, social capital improves the interface between civic participation and government institutions, which can allow for more effective transmission of community issues into the design of bureaucratic structures and implementation of policy processes (e.g. Boix and Posner Reference Boix and Posner1998; Compton and Meier Reference Compton and Meier2016; Fukuyama Reference Fukuyama2000; Knack Reference Knack2002; Ostrom Reference Ostrom1994; Ostrom and Ahn Reference Ostrom and Ahn2009; Putnam Reference Putnam2000). In short, social capital is a key mechanism in understanding effective governance and the pursuit of public policies that improve social outcomes.
Our research links this perspective on social capital to the American opioid epidemic. While a large literature links social capital to many individual, organizational, and community outcomes, features of the opioid epidemic push social capital to its limits as an effective policy tool. Indeed, the opioid crisis is a “wicked problem” (McCrea Reference McCrea2020). Wicked problems are unstructured and generate little consensus on problem definition, implementation, and policy solution (Roberts Reference Roberts2000). They involve “complex systems with components that interact in complicated, poorly understood and unpredictable ways” (Lee Reference Lee2018, 51). However, one way to better manage these wicked problems is through investments in government capacity that can allow for comprehensive and exhaustive approaches to policy problems (see McCrea Reference McCrea2020). As Boix and Posner (Reference Boix and Posner1998) argue, social capital can foster cooperation between relevant bureaucratic organizations, policy leaders, and the public, which can be leveraged to enhance the capacity of public agencies. Thus, social capital can enhance formal institutions, promote institutional cooperation, and facilitate coproduction between citizens and the government. With a problem as expansive, multifaceted, and challenging as the opioid crisis, we theorize that social capital can serve as a positive mechanism in building public institutional support toward addressing the opioid crisis.
Our analysis uses county-level data from the American states to explore the linkages between social capital and opioid-related outcomes. Specifically, we examine how social capital is linked to opioid prescription rates, healthcare-related resources, and drug-related deaths and deaths of despair. We theorize that social capital may directly reduce the demand for opioid use by highlighting the risks and dangers of opioid abuse and encouraging engagement with community-based civic organizations that may serve as a substitute for using painkillers to address social needs such as social isolation and depression. We argue that one mechanism through which social capital reduces drug dependency is that it can enhance a community’s sense of social empathy and lead to an embrace of policies that assist fellow citizens (Hawes Reference Hawes2017, Reference Hawes2019; Hawes and McCrea Reference Hawes and McCrea2018). This suggests that social capital will be associated with greater investment in, and access to, government institutions designed to address public problems that affect a community. We find that social capital is linked to greater availability and access to facilities that treat substance abuse disorders, federally qualified health centers, and substance abuse facilities that accept Medicaid. It is through these investments that we, in turn, see a reduction in harm in the form of lower rates of drug-related deaths. That is, the effects of social capital on deaths are indirect and mediated through appropriate healthcare resources.
Literature review
Social capital: a tool for better governance
Social capital is a perennial mainstay in contemporary social science research. Amongst the numerous theoretical constructs (Bourdieu Reference Bourdieu and Richardson1986, Coleman Reference Coleman1988; Putnam Reference Putnam2000), empirical conceptualizations (Compton and Meier Reference Compton and Meier2016; Hawes, Rocha, and Meier Reference Hawes, Rocha and Meier2013; Rupasingha, Goetz, and Freshwater Reference Rupasingha, Goetz and Freshwater2006), and critiques in the literature (Hero Reference Hero2003, Reference Hero2007) – arguably the classic and most widely cited definition comes from Putnam’s (Reference Putnam2000) Bowling Alone, which defines social capital as “connections among individuals” and the “social networks and the norms of reciprocity and trustworthiness that arise from them” (19).
The theoretical literature on social capital is vast and expansive, but its contributions to more effective democratic governance can be succinctly distinguished between its effects at the individual and collective levels with both facilitating important mechanisms in building a stronger interface between the public and government. At the individual level, social capital increases one’s sense of belonging in their community, serves as a force that influences behavior towards collectivism (i.e. “we” over “me”) and facilitates engagement and participation in government.
When these forces aggregate at the community level, social capital can help reduce burdensome transaction costs such as monitoring, sanctioning, and moral hazards that prevent governments from working effectively (Fukuyama Reference Fukuyama2000; Millo et al. Reference Millo and Pasini2010; Ostrom Reference Ostrom1990; Stiglitz Reference Stiglitz2000). This process develops through repeated practices and the creation of common expectations within society between governing elites, civic organizations, and the community (Lubell et al. Reference Lubell, Scholz, Berardo and Robins2012). Social capital, as society’s lubricant, binds these institutions and processes together, building cultures of trust, reciprocity, consensus, and collectivism. In turn, community issues are transmitted to governments in a way that provides prescriptive solutions to policy problems and presents public policy issues in ways that are more comprehensive given the breadth and availability of political information that can be leveraged toward community problems (Tavits Reference Tavits2006; also see McCrea Reference McCrea2020). As Boix and Posner (Reference Boix and Posner1998) contend, social capital fosters cooperation between relevant bureaucratic organizations, policy leaders, local nonprofits, and the public – a process essential to virtually all domains of public policy and policy implementation.
Put succinctly, social capital allows for disparate institutions and individuals with varying policy preferences and goals to perceive the sum of their efforts together as greater than those achieved independently. If effective cooperation requires the acceptance, support, and reinforcement of such disparate institutions, then it follows that social capital is necessary for a range of public or common goods (Compton and Meier Reference Compton and Meier2016).
Social capital and public outcomes
Social capital’s positive reception in the social sciences is largely due to its link to a wide range of public and social outcomes that are desirable across any society. Empirical research links social capital to better educational outcomes (Plagens Reference Plagens2011), better employment opportunities and performance (Leana and van Buren III Reference Leana and Van Buren1999), greater performance and effectiveness of public programs (Andrews Reference Andrews2012; Tavits Reference Tavits2006), reductions in crime (Buonanno, Montolio, and Vanin Reference Buonanno, Montolio and Vanin2009), and political engagement (Krishna Reference Krishna2002), amongst other outcomes across domains of civil society. Chief among these other domains, and the focus of our research, is the relationship between social capital and health. Putnam (Reference Putnam2000) speculated about the linkages between social capital and health in Bowling Alone, where he suggested that “if you belong to no group but decide to join one, you cut your risk of dying over the next year in half. If you smoke and belong to no group, it’s a toss-up statistically whether you should stop smoking or start joining” (331). Reflecting the wider significance of social capital amongst scholars at the time, concurrent insights within public health were framing health determinants through an institutional, rather than biological or behavioral lens (Choi et al. Reference Choi, Marco Mesa-Frias, James Hargreaves, Bowling, Davey Snith, Ebrahim, Dale and Casas2014; Kawachi, Subramanian, and Kim Reference Kawachi, Subramanian and Kim2008; Rodgers et al. Reference Rodgers, Valuev, Hswen and Subramanian2019).
In the subsequent decades since these initial theorizations, social capital has been linked to many important health outcomes such as one’s self-reported health (Panagopoulos et al. Reference Panagopoulos, Fraser, Aldrich, Kim and Hummel2022), mortality rates (Aldrich Reference Aldrich2019), cardiovascular health (Adeola and Picou Reference Adeola and Picou2012; Czajkowski, Arteaga, and Burg Reference Czajkowski, Arteaga and Burg2022), obesity (Carrillo-Alvarez, Kawachi, and Riera-Romani Reference Carrillo-Álvarez, Kawachi and Riera-Romaní2019; Zhu and Thomas Reference Zhu and Thomas2013), diabetes (Hill-Briggs et al. Reference Hill-Briggs, Adler, Berkowitz, Chin, Gary-Webb, Navas-Acien, Thornton and Haire-Joshu2021), infectious disease (Makridis and Wu Reference Makridis and Wu2021), and cancer (Hamano et al. Reference Hamano, Li, Sundquist and Sundquist2021). While not a panacea for solving societal health ills, a recent review of the social capital literature by Rodgers et al. (Reference Rodgers, Valuev, Hswen and Subramanian2019) reflects positively on the important role of social capital in shaping better health outcomes. The meta-analysis revealed that 88% of studies found partial support, 28% found positive support, and 59% were mixed. Despite this, certain areas of health are underexplored in the literature and require more systematic attention from scholars. One of these areas, and perhaps one of the most challenging from a public policy perspective, is that of the American opioid crisis – one of the most complex, challenging, and devastating problems in contemporary American society.
The interested reader can find myriad news articles across every American state detailing tragic ways in which the crisis has hollowed out communities, taken lives, and affected many regardless of race, gender, and socioeconomic status. Between 2001 and 2015, over 530,000 Americans died from drug overdoses. The number of deaths in 2015 alone exceeded the number of deaths during the peak year of the HIV/AIDS epidemic (Humphreys Reference Humphreys2017) and the number of deaths in both Iraq and Afghanistan (Pacula and Powell Reference Pacula and Powell2018). Moreover, the magnitude of the drug overdose death rate has contributed to the first decline in White life expectancy in decades (Case and Deaton Reference Case and Deaton2017). Besides the unprecedented rise in deaths, other public health issues such as poisonings (Warner, Hedegaard, and Chen Reference Warner, Hedegaard and Chen2014), emergency room visits (CDC 2012), and opioid disorder and addiction (Han et al. Reference Han, Compton, Jones and Cai2015) have also increased.
While the public salience of opioid addiction is a recent development, the beginnings of the problem can be traced back to over 40 years of poor regulatory policy. During the 1980s, American politicians started to view the pharmaceutical industry more favorably and patients began to engage more actively in the decision-making process with their healthcare providers. These changing views towards prescription medication led to a significant increase in Direct-to-Consumer Pharmaceutical Advertising (DTCPA). DTCPA is a process whereby pharmaceutical companies, through television, radio, and the internet, promote their prescription products directly to patients. This process is mired with controversy and is only legal within the USA and New Zealand (Ventola Reference Ventola2011).
DTCPA is regulated by the Federal Food and Drug Administration (FDA), but decisions made in the late 1990s significantly weakened its oversight of pernicious and misleading advertisements from the pharmaceutical industry. By 1999, drug advertisers only had to include major risks of the medication in “simple language” and would direct consumers elsewhere to receive further information (e.g. toll-free numbers, websites, print ads, etc.). Since it was far simpler for drug companies to market their products to consumers, budgets for drug advertising increased from $1.2 billion to $4.4 billion between 1998 and 2008. During this time of rapid expansion, the number of FDA staff tasked with reviewing drug ads remained constant. Estimates from 2009 suggest that there were only 59 full-time employees to review 71,759 submissions (Ventola Reference Ventola2011).
Around this time of massive advertisement expansion, pain was framed as the “Fifth Vital Sign” (Kolodny et al. Reference Kolodny, Courtwright, Hwang, Kreiner, Eadie, Clark and Alexander2015; Pacula and Powell Reference Pacula and Powell2018). During this time, the pharmaceutical industry disseminated misleading evidence on the effectiveness and risks of opioids and took advantage of general medical practitioners who lacked training on the addictive characteristics of opioids and preventative strategies (Kolodny et al. Reference Kolodny, Courtwright, Hwang, Kreiner, Eadie, Clark and Alexander2015; Pacula and Powell Reference Pacula and Powell2018). These information asymmetries between health providers and pharmaceutical companies impacted the supply-side dynamics of opioid prescriptions. Since there was no clear professional check for physicians, pharmaceutical companies effectively lobbied for the proliferation of addictive painkillers into the market. Policymakers then had to address the saturation in the market and reformulated OxyContin and implemented prescription drug monitoring programs in the early 2010s (Meinhofer Reference Meinhofer2016). These interventions had the unintended consequence of shifting addiction to the black market (McCrea Reference McCrea2020), with overdoses involving heroin and synthetic opioids quadrupling from 2010 to 2015 (Pacula and Powell Reference Pacula and Powell2018).
Taken together, these dynamics suggest that the opioid crisis presents an interesting theoretical case due to its status as a “wicked problem” (McCrea Reference McCrea2020). These types of problems fall outside the simple “stove-piped” system of problem definition, policy implementation, and resolution that characterizes traditional problem solving (Rittel and Webber Reference Rittel and Webber1973). Wicked problems are unstructured and generate little consensus on the problem and its solution (Roberts Reference Roberts2000). These characteristics mean that wicked problems engage conflicting values and generate uncertainty (Weber and Khademian Reference Weber and Khademian2008).
Through this lens, the opioid crisis clearly qualifies as a wicked problem since it involves “complex systems with components that interact in complicated, poorly understood and unpredictable ways” (Lee Reference Lee2018, 51). Lee’s (Reference Lee2018) brief article summarizes these wicked problem dynamics in the following way: changes in opioid prescription rates pose the risk of shifting users to illegal black markets. A failure to change prescribing patterns, meanwhile, does not address the legal pathways through which individuals access addictive and harmful drugs. Over 50 percent of legal opioids in the USA are prescribed to individuals with mental health conditions (Davis et al. Reference Davis, Lin, Liu and Sites2017), meaning that other therapeutic services need to proliferate if prescription opioid rates do not change. While increased investments in medication-assisted treatments help mitigate these problems, many patients in recovery programs do not continue them in perpetuity and may relapse into opioid abuse – a reality of any addiction. The drugs used to treat opioid abuse, such as buprenorphine, can be an effective tool in recovery but must be coupled with efforts that engage patients and treat the psychological dimensions of addiction. Otherwise, these policies are a mere “bandage solution to an open wound.”
This complex, interrelated labyrinth of different policy domains, professional identities, and political authority demonstrates a need for a comprehensive and integrative approach to the opioid crisis that engages community members, local leaders, and a web of government institutions. Social capital, we theorize, can thread a common approach that unifies disparate institutions and leverages public life toward a comprehensive and multifaceted public policy approach to addressing the opioid crisis. The National Academy of Sciences (2017) affirms this perspective in a report which states:
“overprescribing was not the sole cause of the problem. While increased opioid prescribing for chronic pain has been a vector of the opioid epidemic, researchers agree that such structural factors as lack of economic opportunity, poor working conditions, and eroded social capital in depressed communities, accompanied by hopelessness and despair, are root causes of the misuse of opioids and other substances.”
The question worth exploring then becomes, what role does social capital play in shaping the development and persistence of the opioid crisis within the USA?
The opioid crisis: a social capital approach
Based on the arguments above, social capital can help facilitate the transmission of policy issues and community concerns through public institutions. In the case of the opioid crisis, we posit several pathways through which social capital may reduce citizens’ demand for, and use of, opioids. First, communities with higher levels of social capital may be implementing better monitoring programs, distributing more consumer-oriented information outlining the risks of opioid dependence, filing lawsuits against responsible parties, and disseminating information on the dangers and risks of addiction and substance abuse. This process can help reduce information asymmetries between citizens and health professionals relating to the risks associated with opioid use and abuse. Second, informal types of social capital (e.g. family, community, social trust, civic organization) may reduce the need for opioids since they address social needs, provide feelings of belonging, and mitigate sentiments of social isolation and depression.
Evidence of these processes can be found in local governments across the USA. For example, King County, Washington developed a program called “Golden Thread” that employs caseworkers to “weave” services and care across multiple city and county agencies, healthcare providers, and city services to provide a coordinated approach in dealing with non-violent repeat offenders who suffer from substance use disorders (“Local Responses to the Opioid Epidemic” 2017). Similarly, Howard County, Maryland recently created an Opioid Collaborative Community Council (OCCC)Footnote 1 that consists of 17 members from a wide range of professional, governmental, nonprofit, and even religious organizations. It is tasked with making recommendations for how funds awarded from recent lawsuits against pharmaceutical companies should be prioritized. Programs such as Golden Thread and OCCC require significant coordination between a range of stakeholders and higher levels of social capital are theorized to make these connections and interactions operate more smoothly and efficiently. Increasingly, citizens, communities, and governments view the problem as a multifaceted social and public problem rather than simply a private one. Indeed, thanks to public information campaigns, the dangers of addiction are certainly more transparent to the public – including public institutions – today than they have been in the past. In total, these institutions reduce information asymmetries between the average citizen and the dangers of abuse.
A large literature provides evidence consistent with these effects and finds that social capital helps create a buffer between individuals and drug use. These effects are quite potent and have been found to shape feelings towards drug use amongst adolescents and continue to predict healthy behaviors that extend into adulthood (Ford, Sacra, and Yohros Reference Ford, Sacra and Yohros2017; Jesmin and Amin Reference Jesmin and Amin2020; Sørensen and Hansen Reference Sørensen and Hansen2023; Wistanley et al. Reference Winstanley, Steinwachs, Ensminger, Latkin, Stitzer and Olsen2008). Besides these effects largely dealing with individuals at risk of initiating drug usage, social capital also impacts the behavior and drug use of addicts. For example, work from China suggests that individuals seeking rehabilitative treatment are less likely to use heroin covertly (Yang et al. Reference Yang, Yang, Liu and London2020). Similarly, social capital links to less risky behavior and is associated with reductions in needle sharing (Kumar, McNeely, and Latkin Reference Kumar, McNeely and Latkin2016), and by consequence, the incidence of overdose, HIV, hepatitis, and the spread of addiction. Despite some mixed evidence pointing towards a context-dependent link between social capital and opioid prescription rates (see Sun Reference Sun2022), the literature generally suggests that social capital is predictive of behavioral changes associated with more healthy choices and appropriate utilization of opioid-related drugs (Dew et al. Reference Dew, Elifson and Dozier2007; Zoorob and Salemi Reference Zoorob and Salemi2017). Thus,
Hypothesis 1: Communities with higher levels of social capital will have lower opioid prescription drug rates.
Since the opioid crisis exists in a multidimensional policy space, policy implementation is most effective when it is comprehensive. Just because we observe changes in the prescription rate, does not mean that we observe the intended changes in outcomes. Indeed, viewing the opioid crisis as a wicked problem suggests that policy action in one area can generate negative externalities in another unless the actions are taken comprehensively. Addressing the opioid prescription rate may nudge users to heroin, fentanyl, and other illegal, more dangerous substances. In this sense, other outcomes such as death rates are valuable to explore as second-order consequences beyond prescription rates.
Addressing this spillover into other types of drugs requires cooperation across many public institutions including the local community, hospitals, public health agencies, the police force, fire departments, and mental health networks. Social capital should bind these institutions together while also achieving support from the citizenry through initiatives that encourage them to carry opioid reversal drugs such as naloxone, value rehabilitative rather than punitive solutions to addiction (Sylvester, Haeder, and Callaghan Reference Sylvester, Haeder and Callaghan2022), and other community initiatives. Communities high in social capital can help develop a government infrastructure that recognizes the complexity and idiosyncratic nature of drug addiction that allows for communities to address specific pathways that generate different types of addiction (see McCrea Reference McCrea2020). As a result, deaths attributed to opioid-related abuse should be lower due to increased investments in a coordinated public response.
As alluded to earlier within this section (see literature on hypothesis 1), scholars have amassed a sizable inventory of the linkages between social capital and decreased drug use amongst adolescents and adults, addicts or otherwise. Literature linking social capital to drug-related deaths, however, are fewer in number. Yet, the little work within this area shows a promising connection between social capital and opioid-related deaths. A state-level analysis by Heyman, McVicar, and Brownell (Reference Heyman, McVicar and Brownell2019) shows that states with higher levels of social capital have lower opioid-related deaths, but this effect is only significant for non-Hispanic Whites. This finding can be understood as a reflection of systematic bias against racial and ethnic minorities who are wrongly assumed to be more susceptible to drug misuse and abuse.
Besides work documenting a link between social capital and drug deaths at the state level, there is work at more granular units of analysis such as the county level. This approach is appropriate for such an inquiry into the consequences of social capital due to the significant variation across USA counties with respect to social capital, conceptualizations of community, government capacity, and other dimensions relevant to studying social capital. Towards that end, Zoorob and Salemi (Reference Zoorob and Salemi2017) show that counties high in social capital observe significantly lower opioid-related deaths. Similarly, a path analysis by Yang, Kim, and Matthews (Reference Yang, Kim and Matthews2021) demonstrates that high unemployment rates lead to lower levels of social capital which, in turn, contributes to high levels of opioid-related deaths. Such an analysis underpins the complex, “wicked,” and interrelated nature of socioeconomic conditions, social capital, and risky behavior.
As such, another second-order outcome of the opioid epidemic is “deaths from despair.” Deaths from despair are deaths that are attributed to behavior-related medical conditions that are a function of communities that experience despair due to a sense of bleak long-term social and economic conditions (Case and Deaton Reference Anne and Angus2015). These include drug and alcohol overdoses, suicide, and alcoholic liver disease. It is no coincidence that these deaths are higher in the Appalachian region, where opioid-related deaths are rampant. Like opioid-related outcomes, these other types of death from despair predominately affect middle-aged and older working-class White Americans. These outcomes reflect the interrelated nature of drug use, where individuals who experience a bleak outlook on life engage in polydrug use, combining opioids (which are already in terribly high supply) with alcohol and other illicit substances. Consistent with the logic of wicked problems, communities must contend with these multiple pathways for abuse. Otherwise, policy solutions will be stunted and ineffective.
There are limited empirical applications that explicitly link social capital to deaths from despair (see Jesmin and Amin Reference Jesmin and Amin2020) but looking at the broader literature on suicide and alcohol use reveals a potential link between social capital and deaths from despair, more broadly. For example, Smith and Kawachi’s (Reference Smith and Kawachi2014) state-level analysis from 1999 to 2002 finds that social capital predicts lower suicide-related deaths, but this effect was only significant for Whites – making this an interesting, and consistent, finding insofar as the racial dynamics of despair are concerned. More recently, Steelesmith et al. (Reference Steelesmith, Fontanella, Campo, Bridge, Warren and Root2019) examined all suicides within the USA from 1999 to 2016 and found that counties with high social capital were associated with lower suicide deaths. The link between social capital and suicide generally holds despite studies making different ecological inferences. With respect to alcohol use, literature from addiction and community health scholars show that social capital decreases patterns of alcohol consumption and misuse amongst adolescents and early adults (Aslund and Nilsson Reference Åslund and Nilsson2013; Weitzman and Chen Reference Weitzman and Chen2005; Winstanley et al. Reference Winstanley, Steinwachs, Ensminger, Latkin, Stitzer and Olsen2008), but broader inferences regarding alcohol-related deaths are understudied to our knowledge. Nonetheless, if social capital reduces alcohol use it should mitigate risky behavior and decrease the odds of alcoholic liver disease, cirrhosis, and other deaths.
While past work presents a compelling story on the role of social capital in ameliorating the damage from the opioid crisis, empirical applications tend to treat outcomes as piecemeal, with inferences about one type of outcome made in isolation of other, interrelated outcomes. Our approach seeks to remedy this shortcoming by examining how social capital influences two distinct, but related features of the modern American opioid epidemic – one driven by a supply/culture mechanism and one driven by a demand/despair mechanism (King, Scheiring, and Nosrati Reference King, Scheiring and Nosrati2022). The culture/supply mechanism focuses on the influence of poor regulatory decisions which lead to the penetration of harmful, addictive substances into local communities (Hypothesis 1). The demand/despair mechanism emphasizes how Americans’ relationship with drug use connects to the larger economic, political, and social erosion that many try to cope with, and escape from, by using addictive and illicit substances (Hypothesis 2). Both, however, if past theory is correct, may be addressed through social capital which provides an infrastructure and network of support to help curtail addiction and cope with personal and societal hardships.
Hypothesis 2: Communities with higher levels of social capital will have lower drug-related deaths and deaths due to social despair.
Concerning how social capital works to reduce drug dependence, we can consider its effects in enhancing formal systems and infrastructure designed to address the causes of addiction. Kawachi (Reference Kawachi2006) finds that higher levels of social capital are associated with better community and individual health outcomes. He theorizes this is due to both political and social institutions including civic participation/engagement and social control levers. Hawes (Reference Hawes2017, Reference Hawes2019) and Hawes and McCrea (Reference Hawes and McCrea2018) argue that social capital can enhance a community’s sense of social empathy.Footnote 2 They argue that communities with high social capital may be more likely to embrace policies that assist fellow citizens. Social capital’s reinforcement of “norms of reciprocity” may increase empathy for those who are less fortunate. Indeed, Putnam argues that “moralistic” forms of government (i.e. Elazar Reference Elazar1966) are more likely where “government is ‘we,’ not ‘they’” (Putnam Reference Putnam2000, 347). This suggests that social capital will be associated with greater investment in and access to institutions designed to address public problems that affect a community, such as the opioid crisis. Hence,
Hypothesis 3: Communities with higher levels of social capital will allocate more resources to formal institutions that enhance access to substance abuse treatment.
A causal model
The preceding three hypotheses posit that social capital will (1) decrease opioid prescription rates, (2) decrease drug-related deaths and deaths of despair and (3) increase the supply of healthcare resources targeted at addressing substance abuse. The causal connections between these factors, however, are not necessarily independent or even direct relationships. That is, while we theorize that social capital is important in explaining the variation for these three outcomes (opioid use, healthcare resources, and deaths), the causal paths may be more complex and interconnected than simple direct, independent, and unidirectional relationships.
Figure 1 presents a theoretical causal model for the relationship between social capital, opioid use, healthcare resources, and deaths. Here we treat social capital as an exogenous variable that has both direct and indirect effects on drug-related outcomes. Arguably, social capital itself may be affected by such outcomes as well as drug usage within a community. While social capital within a community can change over time, this change tends to occur slowly like political culture (Putnam Reference Putnam2000). Indeed, the greatest differences in social capital in the USA are spatial rather than temporal (Hawes, Rocha and Meier Reference Hawes, Rocha and Meier2013). Given that the opioid crisis is a relatively recent phenomenon, it likely would not have an immediate effect on social capital; however, social capital – being a more stable cultural phenomenon – will likely have an impact on the opioid crisis. Furthermore, our measure of social capital temporally pre-dates our outcomes by 1–3 years (2014 vs. 2015–17). Thus, for model simplicity (both theoretically and empirically), we model it as exogenous.Footnote 3
Theoretical relationship between social capital, healthcare resources and outcomes.
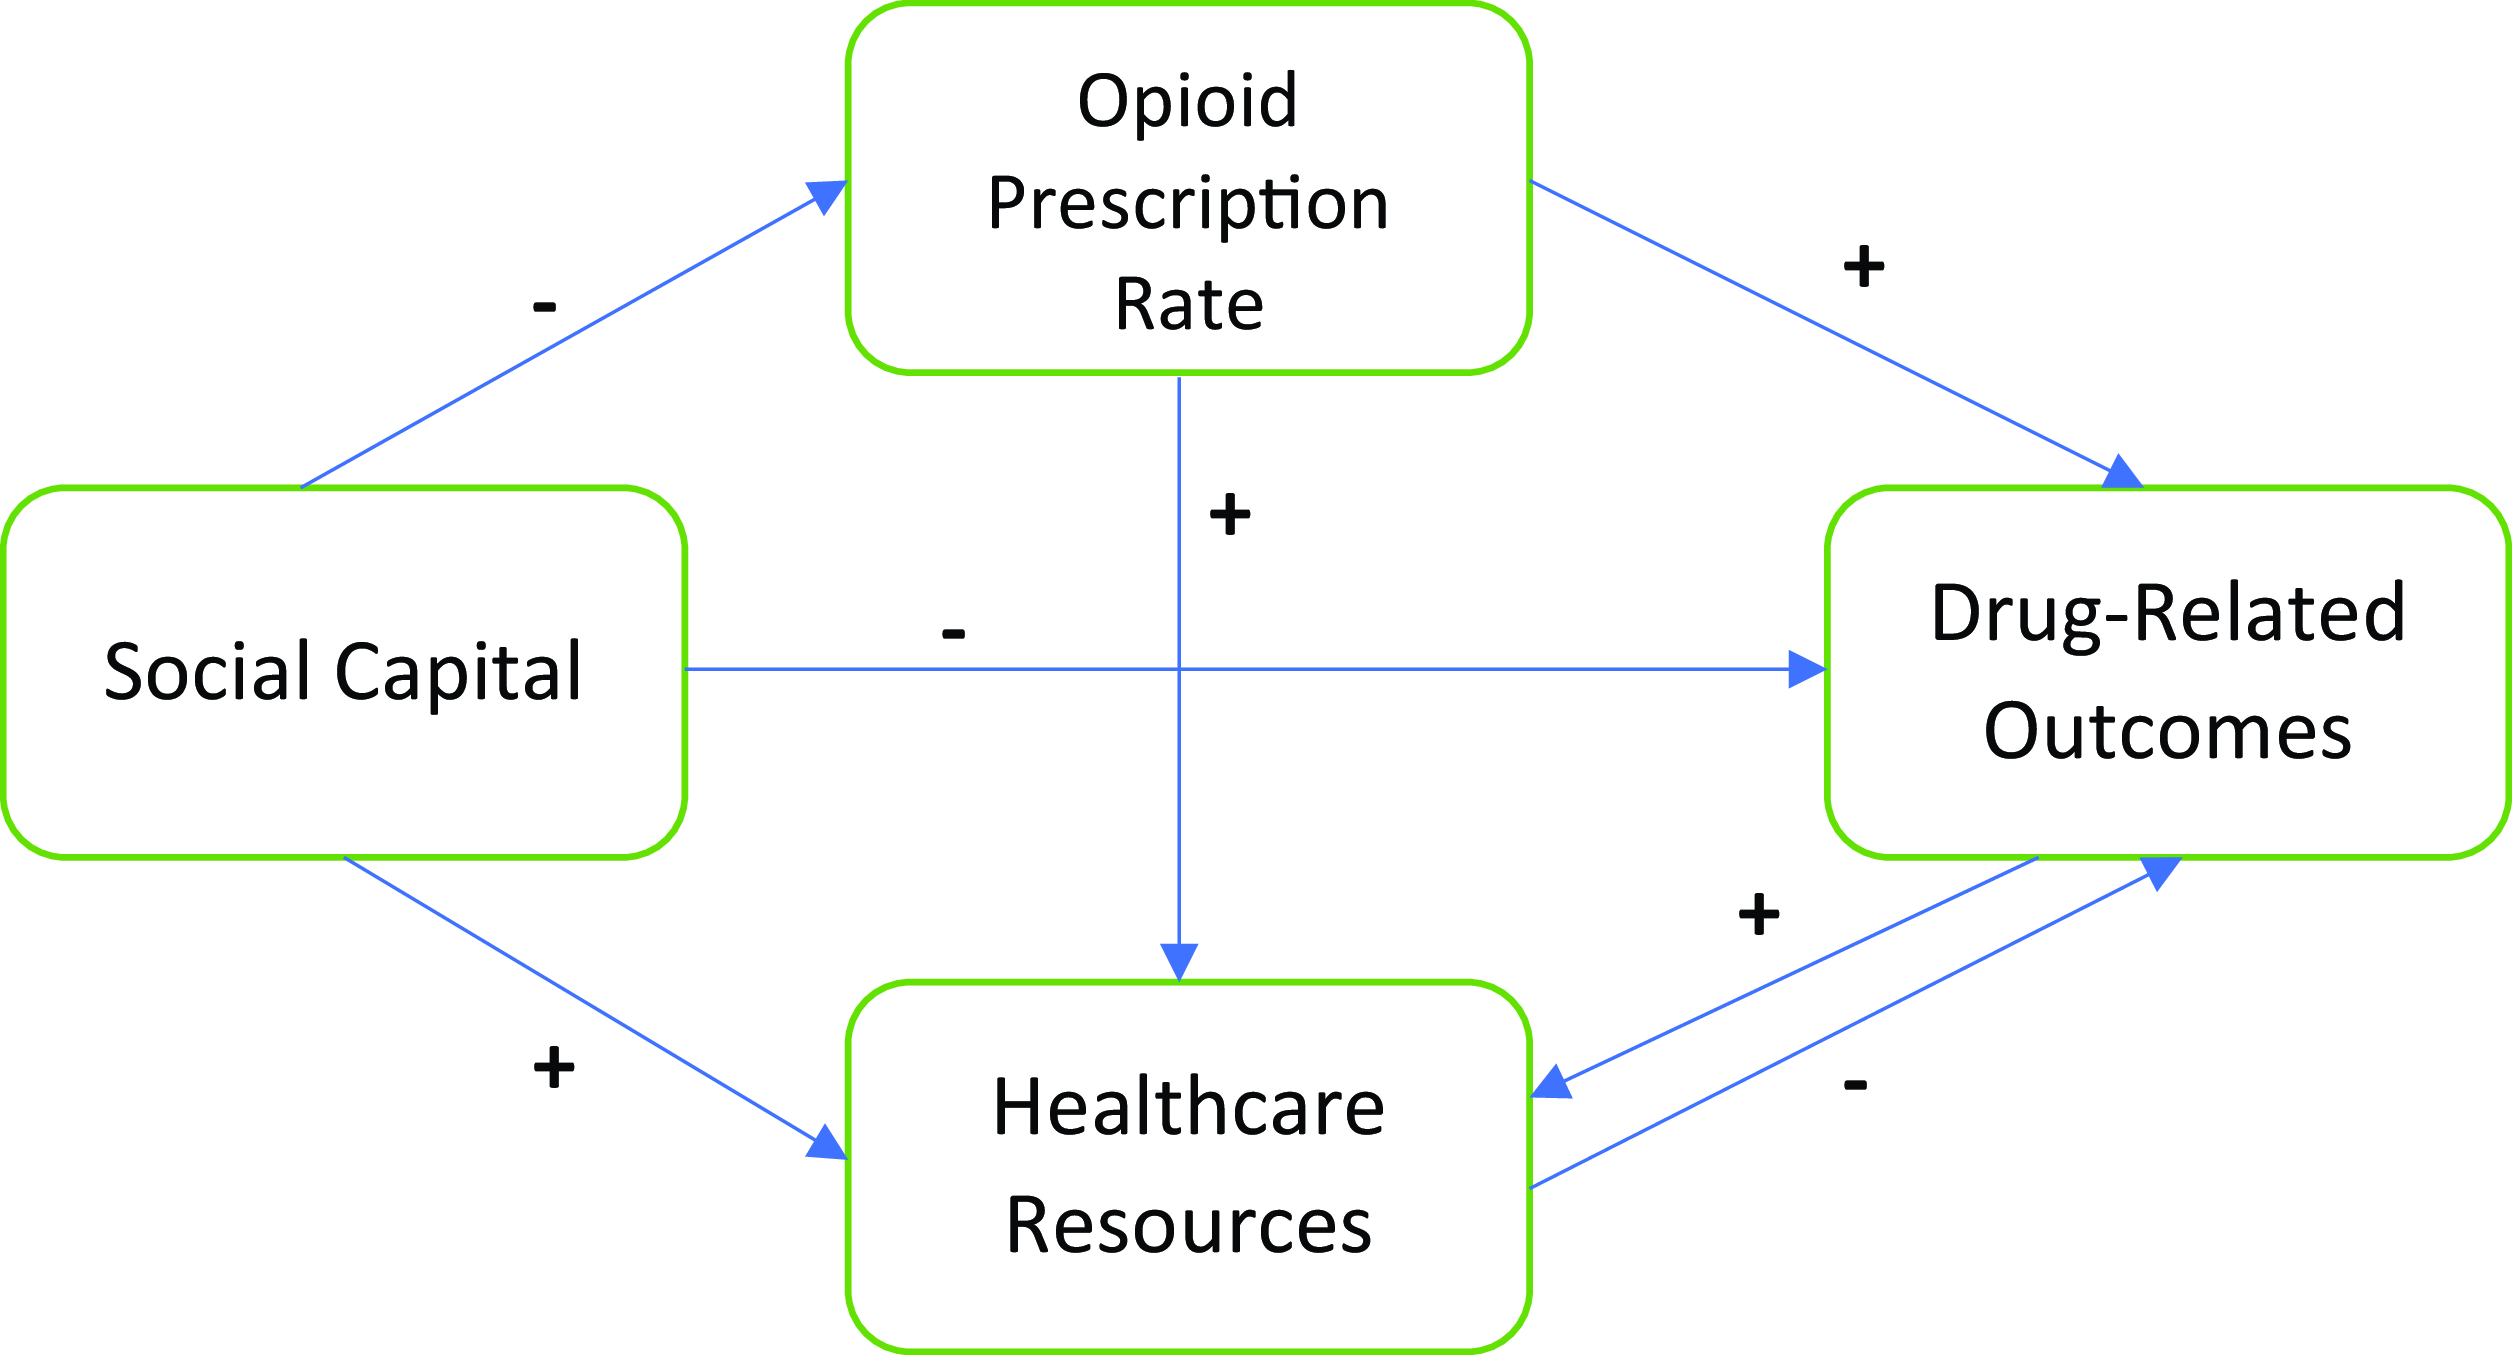
Based on the literature cited above, we theorize that social capital will have a direct negative effect on opioid prescription rates as well as drug-related deaths and deaths of despair (Hypotheses 1 and 2). We posit that social capital will be associated with increased healthcare resources that target the opioid crisis (Hypothesis 3). However, we also argue that there are indirect and reciprocal relationships at play. Specifically, the effect of social capital on drug-related outcomes will be mediated by opioid use rates and healthcare resources. Social capital will be associated with lower levels of opioid use and this, in turn, will lead to fewer drug-related deaths and deaths of despair. Similarly, we hypothesize that social capital will be associated with increased investments in healthcare resources targeting substance abuse, and these resources will, in turn, reduce deaths. This is particularly salient in the USA where healthcare costs can be prohibitively expensive, especially for residential substance abuse treatment programs. Thus, communities that have greater public investment in treatment resources should have lower death rates. We also hypothesize that both opioid use and deaths will impact healthcare resources, with higher drug use and deaths resulting in increased resources dedicated to treatment.
Taken together, this offers USA fourth hypothesis where the effects of social capital are mediated by drug use and healthcare resources, respectively (see Fig. 1).
Hypothesis 4a: The effect of social capital on deaths is mediated by the prescription drug rate.
Hypothesis 4b: The effect of social capital on deaths is mediated by healthcare resources.
Data and methods
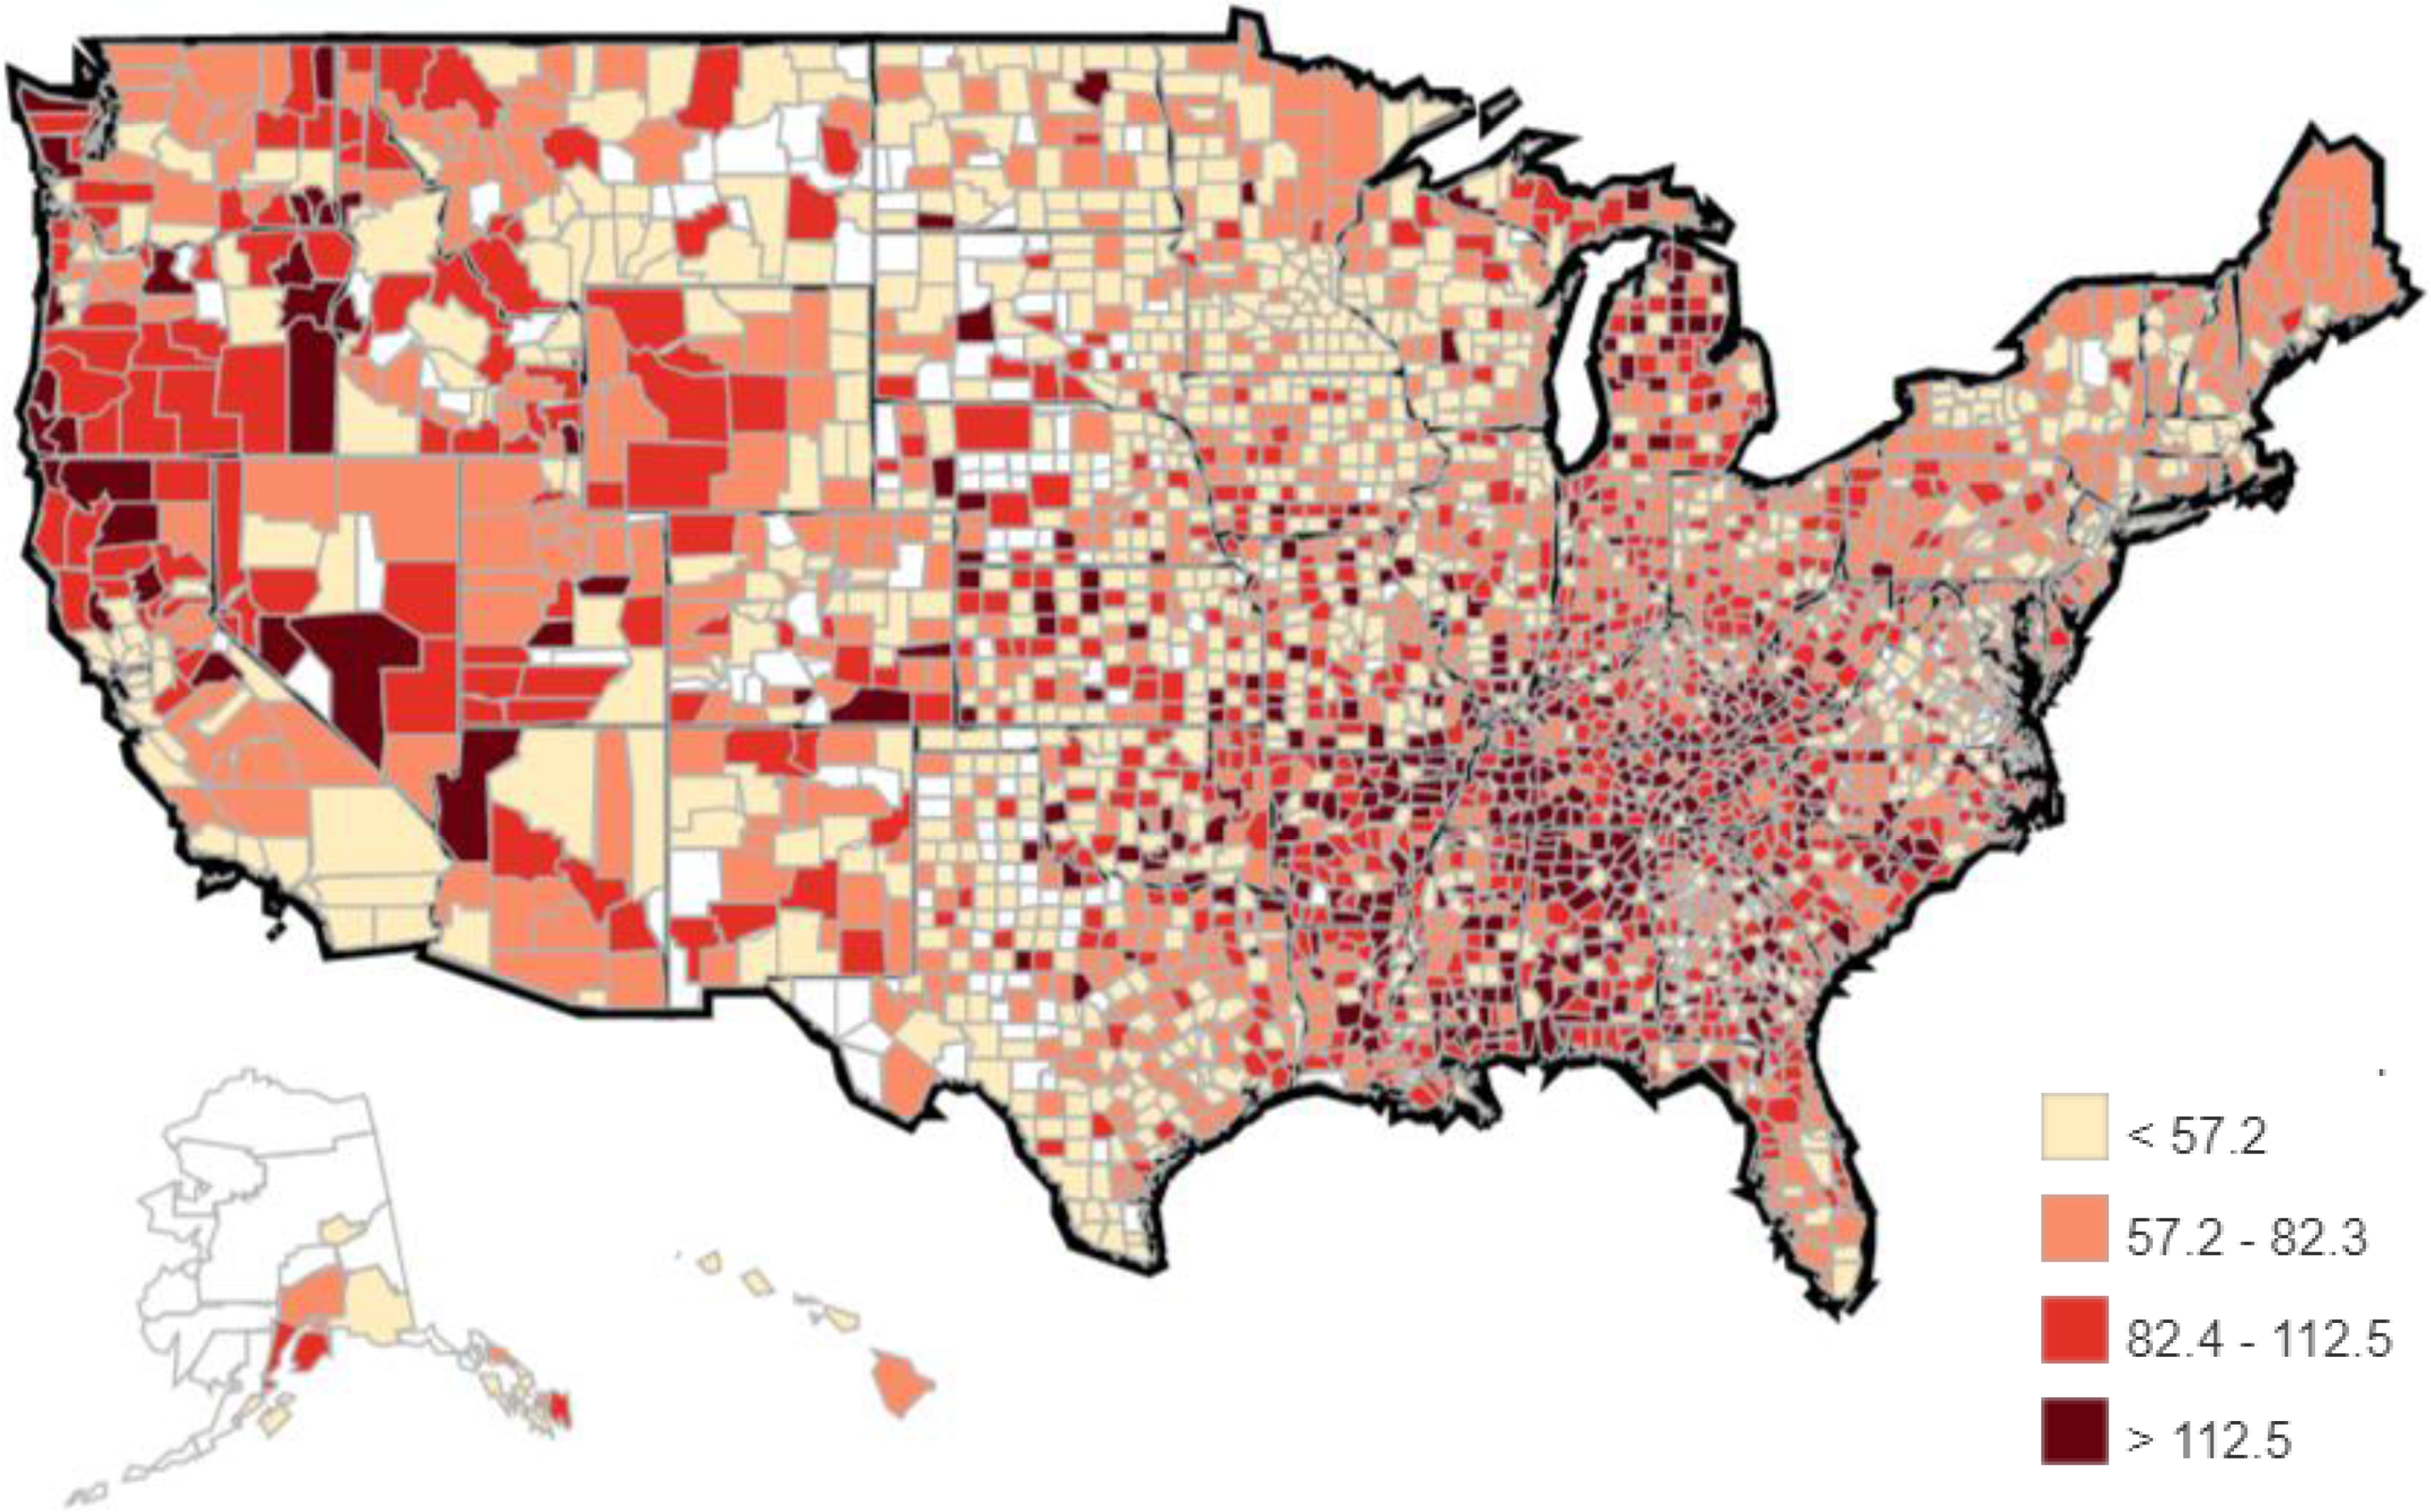
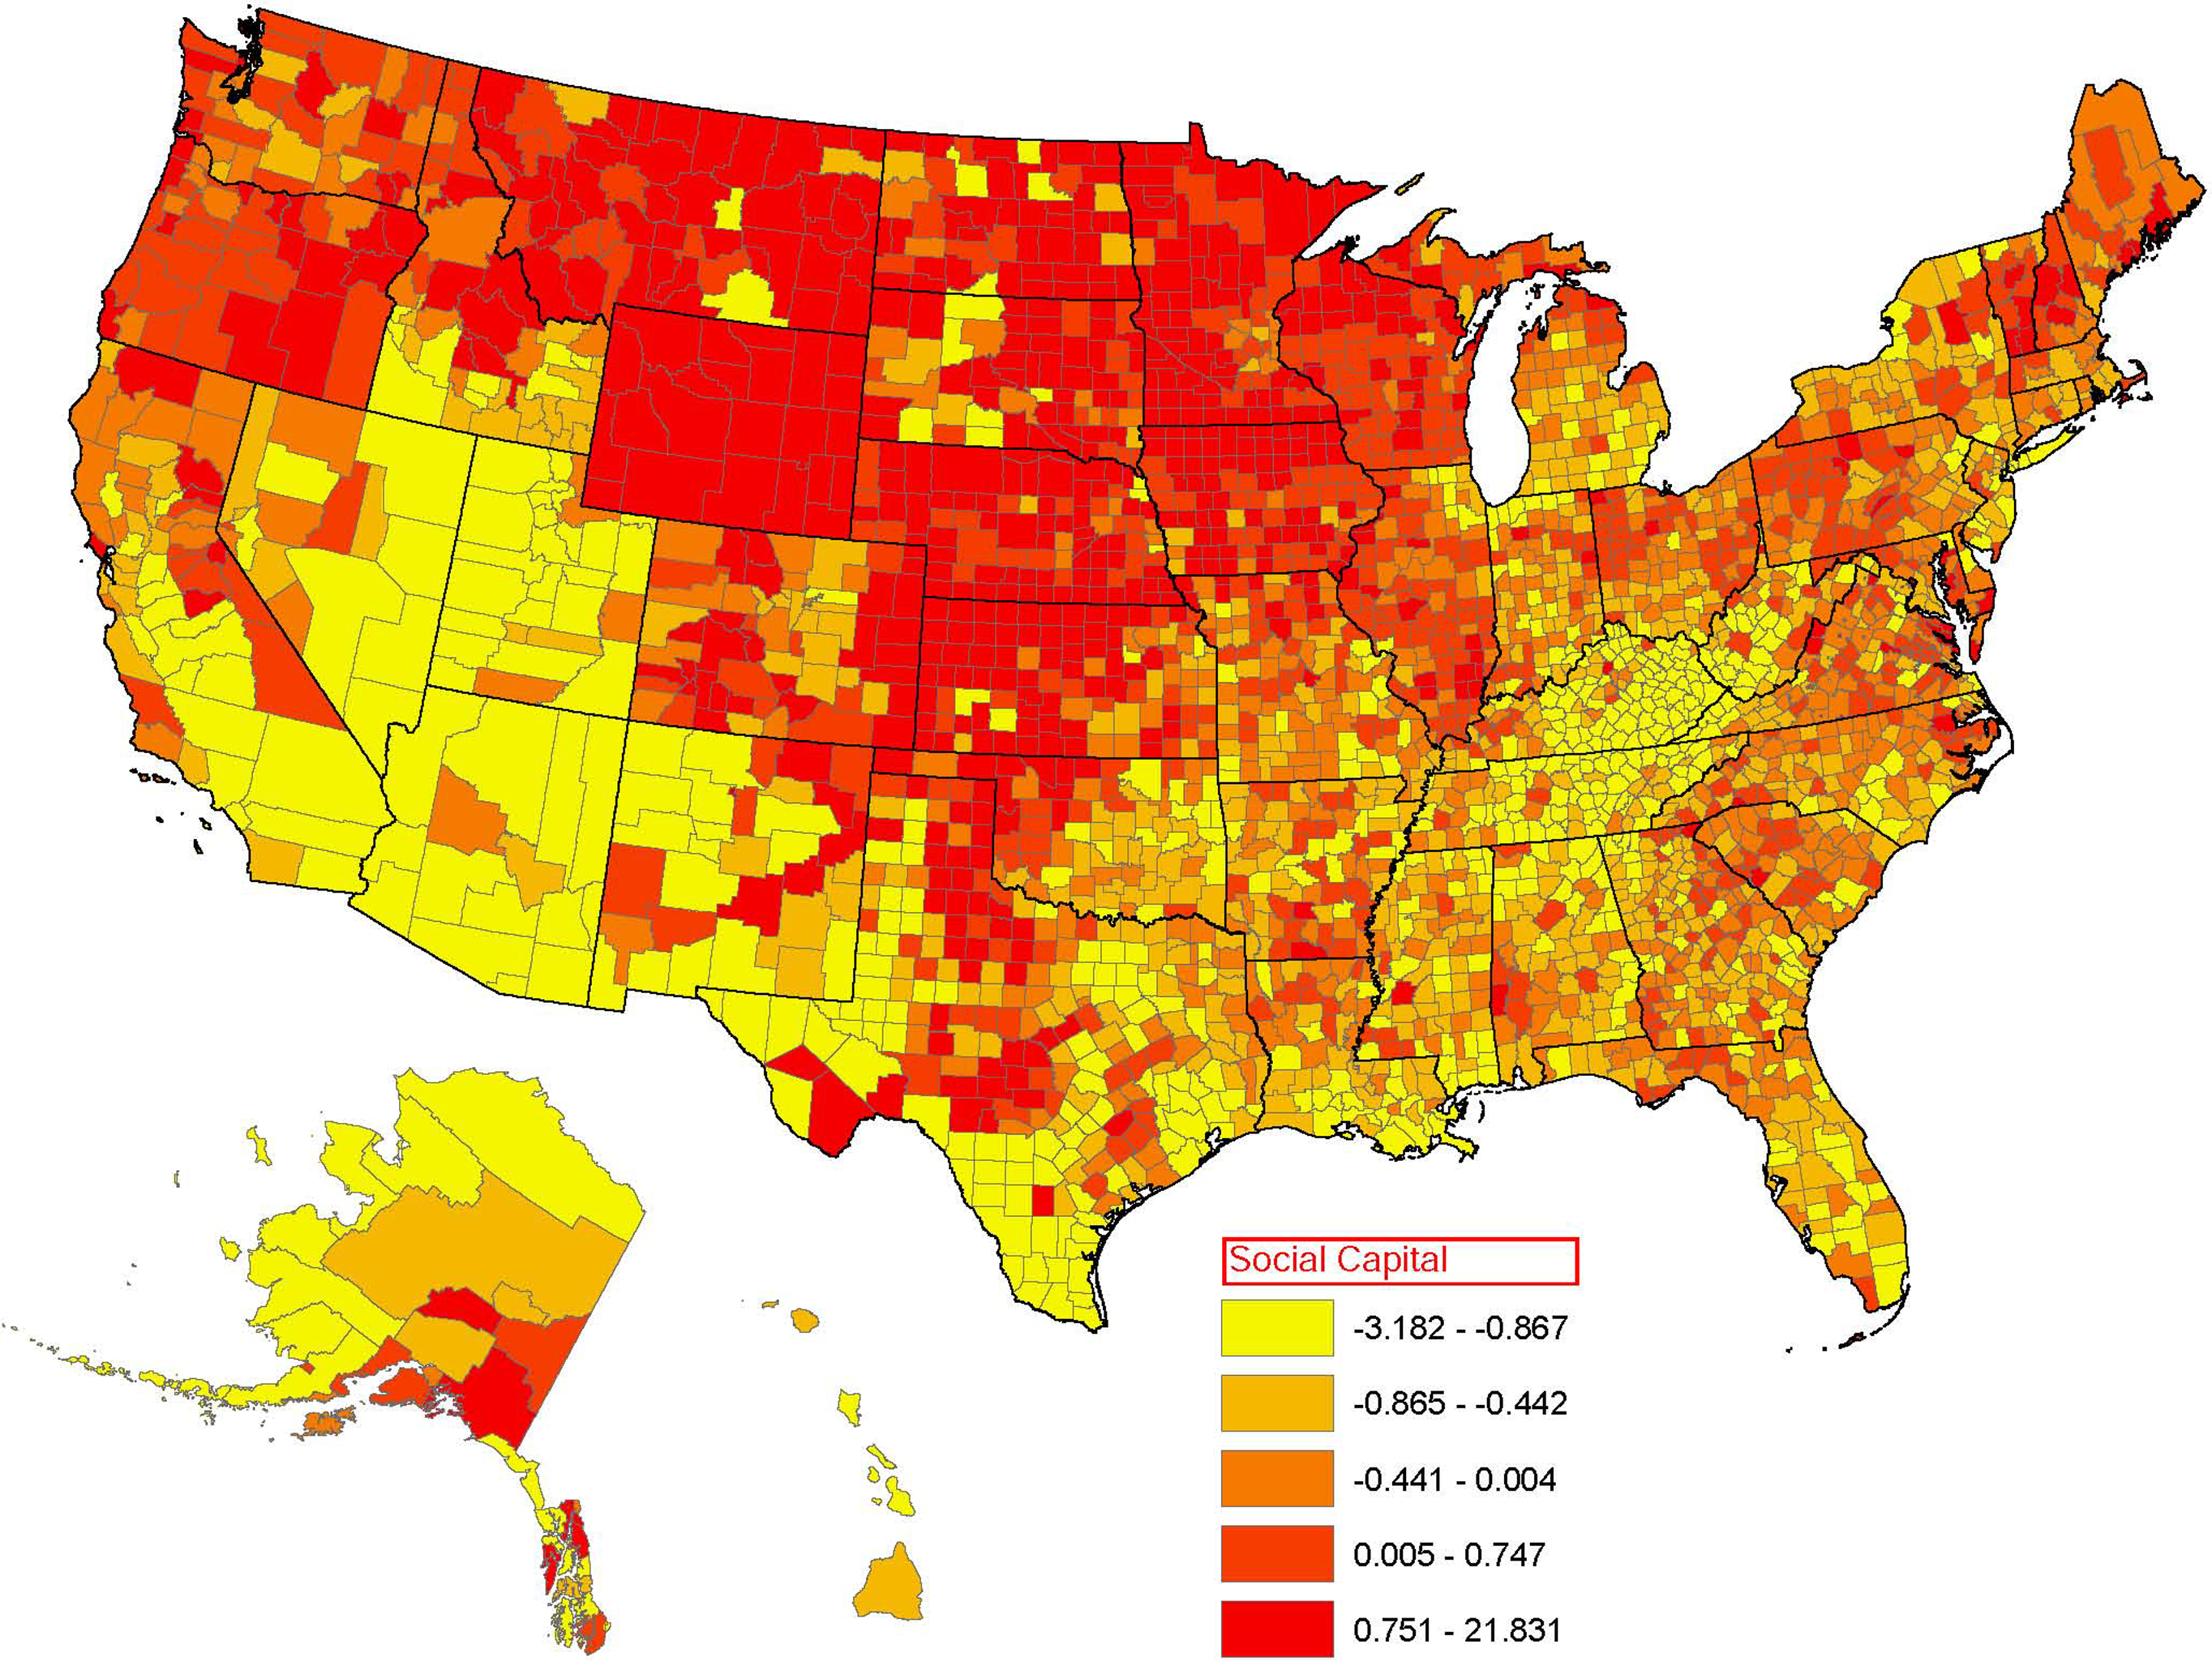
Earlier research on social capital often relied upon state-level analysis to draw inferences between social capital and social outcomes (e.g. Hawes and McCrea Reference Hawes and McCrea2018; Hawes, Rocha and Meier Reference Hawes, Rocha and Meier2009; Knack Reference Knack2000; Putnam Reference Putnam2000). Despite the benefits of these studies in developing an empirical body of work, much of the rich social, political, and economic variation relevant to an understanding of American social outcomes is masked when conducting research at the state level. With no exception, the opioid crisis exhibits a significant degree of cross-county variation. Both Figs. 2 and 3 illustrate this point clearly and powerfully. Figure 2 maps the opioid rate per 100 persons and Figure 3 maps the social capital index. Two trends are obvious from these figures. First, both show a considerable degree of variation, making this unit of analysis particularly powerful in identifying relevant effects. Second, social capital and opioid-related deaths appear, at least graphically, to be related to one another. Looking at our dataset, in Texas, for example, social capital ranges from −2.95 to 7.16 (nearly 8 standard deviations of the overall index), opioid prescriptions range from 0.33 to 169 per 100 persons, and drug-related deaths range from 28 to 552 per 100,000 persons. State-level measures would not capture this significant within-state variation. Thus, we use cross-sectional, county-level data.Footnote 4 We believe the county level is the appropriate level of analysis since county-level health departments are most closely tied to implementing health policies and act as first responders to local public health issues. While state-level health departments set state-wide policy directives and provide some support, resources, and services, county and local health departments are more closely linked to street-level implementation of healthcare policies.
Opioid prescription rates per 100 persons, 2016.
Source: https://www.cdc.gov/drugoverdose/maps/rxcounty2016.html.
Social capital index by county (2014).
Source: Penn State University, Northwest Regional Center for Rural Development. https://aese.psu.edu/nercrd/community/social-capital-resources/social-capital-variables-for-2014.
To test the model presented in Fig. 1, we use a structural equation model (SEM) that simultaneously estimates multiple equations. This allows us to simultaneously test the multiple paths that social capital can affect opioid use, healthcare resources, and deaths as well as how these variables may affect one another. The model includes three simultaneous models that incorporate three paths in which social capital impacts deaths: direct, mediated through opioid prescription rates, and mediated through healthcare resources. Specifically, the models are as follows:
Mediated model for health care resources (SC → HCR)
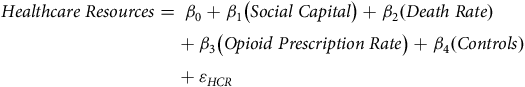 $$Healthcare{\rm{\;}}Resources = {\rm{\;}}{\beta _0} + {\beta _1}\left( {Social{\rm{\;}}Capital} \right) + {\beta _2}\left( {Death{\rm{\;}}Rate} \right) + {\beta _3}\left( {Opioid{\rm{\;}}Prescription{\rm{\;}}Rate} \right) + {\beta _4}\left( {Controls} \right) + {\varepsilon _{HCR}}$$
Mediated model for opioid prescription rates (SC → OPR)
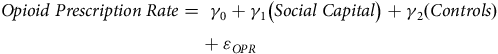 $$Opioid{\rm{\;}}Prescription{\rm{\;}}Rate = {\rm{\;}}{\gamma _0} + {\gamma _1}\left( {Social{\rm{\;}}Capital} \right) + {\gamma _2}\left( {Controls} \right) + {\varepsilon _{OPR}}$$
Full SEM model
 $$Death{\rm{\;}}Rate = {\rm{\;}}{\delta _0} + {\delta _1}\left( {Social{\rm{\;}}Capital} \right) + {\delta _2}\left( {Healthcare{\rm{\;}}Resources} \right) + {\delta _3}\left( {Opioid{\rm{\;}}Prescription{\rm{\;}}Rate} \right) + {\delta _4}\left( {Controls} \right) + {\varepsilon _{DD}}$$
Dependent variables
We use several dependent variables in our SEM models. To test Hypothesis 1, we use a measure from the Center for Disease Control and Prevention’s (CDC) IQVIA XponentFootnote 5 database that captures the number of retail opioid prescriptions dispensed per 100 persons per year. IQVIA Xponent provides a sample of nearly 90% of the retail prescriptions in the USA. Any initial or refill prescription that is dispensed at a pharmacy and paid by commercial insurance, Medicaid, Medicare, or cash is included in the dataset. For this dependent variable, we created an average from these data for 2015, 2016, and 2017. The descriptive statistics on this measure reveal that there is considerable variation across the states. The opioid prescription rate ranges from 0 per 100 people (Park County, Colorado) to 457 per 100 people (Norton City, Virginia) and has a mean value of approximately 76. Figure 2 presents the distribution of prescriptions by county for 2016.
To test Hypothesis 2, we use two variables that capture death rates. In line with existing work in economics and public health (Compton, Boyle and Wargo Reference Compton, Boyle and Wargo2015; Florence et al. Reference Florence, Luo, Xu and Zhou2016), we utilize data from the CDC Wonder database on any death related to drug poisonings. For this study, we calculate the 2015–2017 average drug-related death rates per 100,000. Counties with fewer than 20 deaths in a year are marked as missing data. Data are based on death certificates for USA residents. Each death certificate contains a single underlying cause of death and up to twenty additional multiple causes. We include all underlying causes of death where drugs are listed as a contributing cause. A second dependent variable related to death rates captures mortality rates from “deaths of despair.” These data also originate from the CDC WONDER data for 2015 and include fatalities from alcohol abuse, drug overdose, and suicide (see Case and Deaton Reference Case and Deaton2017).Footnote 6 These “deaths of despair” are attributed to behavior-related factors that are, in part, caused by a breakdown in social supports in individuals’ communities. As a result, individuals “give up” on life. Thus, we have two dependent variables that capture death rates caused by drugs, addiction, or suicide.
We capture the availability and access to treatment services and facilities using an index based on four factors. Hypothesis 3 posits that social capital will contribute to social support systems, including public supports that are meant to address the wicked problem the opioid crisis presents. We use four variables from the amfAR Opioid and Health Indicators Database (https://opioid.amfar.org/), which are based on data collected by the Substance Abuse and Mental Health Services Administration’s (SAMHSA) National Survey of Substance Abuse Treatment Facilities (N-SSATS) – an annual survey of USA facilities offering treatment services for alcohol and drug abuse. The first of these variables is the number of facilities providing some medication-assisted treatment per 10,000 population. This measure includes treatment programs that offer at least one medication used in the treatment of substance abuse disorders (methadone, buprenorphine, or naltrexone). The second variable is the number of Federally Qualified Health Centers (FQHCs) per 10,000 population. FQHCs are community-based health service providers funded under the Health Resources and Services Administration’s (HRSA) Health Center Program. The program sets requirements for providing comprehensive health care services including primary, preventative, mental health, and substance abuse services regardless of an individual’s ability to pay or their health insurance status. We also include a variable for the number of substance abuse services facilities that accept Medicaid per 10,000 population. This provides a measure of access to substance abuse treatment for low-income populations. Finally, we include the number of medical providers (per capita) who are licensed to administer buprenorphine, an FDA-approved medication used in the treatment of opioid dependence. All four items load positively on a single factor (eigenvalue = 2.41). We expect that social capital will be positively associated with this index (Hypotheses 3) and it, in turn, will lead to a reduction in deaths (Hypothesis 4b).
Social capital
While multiple measures of social capital exist in the literature (e.g. Hawes, Rocha, and Meier Reference Hawes, Rocha and Meier2013; Knack Reference Knack2000; Putnam Reference Putnam2000), we are interested in a county-level measure that is available for the time period close to the recent increase in opioid use. We rely on a measure developed by researchers at the Northeast Regional Center for Rural Development at Penn State University (Rupasingha, Goetz, and Freshwater Reference Rupasingha, Goetz and Freshwater2006).Footnote 7 The Penn State researchers use USA Census data to create a county-level index of social capital for several years, the most recent of which is 2014, which corresponds to the beginning of the third wave of the opioid crisis in the USA. Based on work by Knack and Keefer (Reference Knack and Keefer1997), their measure distinguishes membership in “Olson-type” rent-seeking (O-Groups) versus “Putnam-type” non-rent-seeking organizations (P-Groups). O-Groups form for the purpose of financial gain (e.g. a trade organization) while P-Groups form with the goal of increasing trust and cooperation in society (e.g. a fraternal order). As such, their measure includes data on associational membership for a wide range of associations including members in civic, religious, political, sports, and business organizations. Additionally, the measure includes measures for voter turnout, census response rates, and the number of nonprofit organizations. Figure 3 presents the distribution of the composite social capital index across USA counties.
Control variables
Since we employ maximum likelihood SEM models to model multiple outcomes simultaneously, we control for several county-level characteristicsFootnote 8 that may be associated with each respective outcome (i.e. drug prescription rates, deaths, and healthcare resources targeting substance abuse).Footnote 9 First, we control for several economic factors; these include the county unemployment rate, the prime-age male labor force participation rate, median household income, the percent of households with debt that is in collection, and the poverty rate. We also control for social context by including the percentage of the adult population who graduated high school, population density, mean commute time, racial diversity,Footnote 10 religious congregations per 1,000, and the percent of the population that is foreign-born. Finally, we control for whether each state allows the medicinal use of marijuana, which may mitigate the need for opioid-based painkillers (Livingston et al. Reference Livingston, Barnett, Delcher and Wagenaar2017). We expect poorer economic conditions to be associated with greater opioid drug use.
We model the level of investment in healthcare resources as a function of social capital and demand factors (i.e. opioid prescription rates and drug-related deaths). We also control for economic conditions (median household income), social context (% high school graduates, % needing but not receiving addiction treatment, and population density). Given the political nature of funding healthcare, and particularly healthcare related to substance abuse, we also control for the percentage of Democratic legislators within the state legislature. We expect legislatures with more Democrats will be more likely to fund healthcare resources targeting substance abuse.
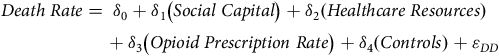
As noted in Fig. 1, we posit that drug-related deaths will be a function of social capital, opioid prescription rates, and addiction-related healthcare resources in the community. We also include all of the control variables used in the other models for the drug-related deaths model.Footnote 11 Table 1 presents the summary statistics for all the variables.
Summary Statistics
Findings
We run two SEM models using maximum likelihood with robust standard errors clustered by state as recommended by Cameron and Miller (Reference Cameron and Miller2015). Each SEM model includes three dependent variables (1) opioid prescription rate, (2) healthcare resources, and (3) drug-related deaths or deaths of despair, respectively. All coefficients are standardized for ease of comparison. The models perform fairly well (overall R2 = 0.477 for Model 1 and 0.279 for Model 2).
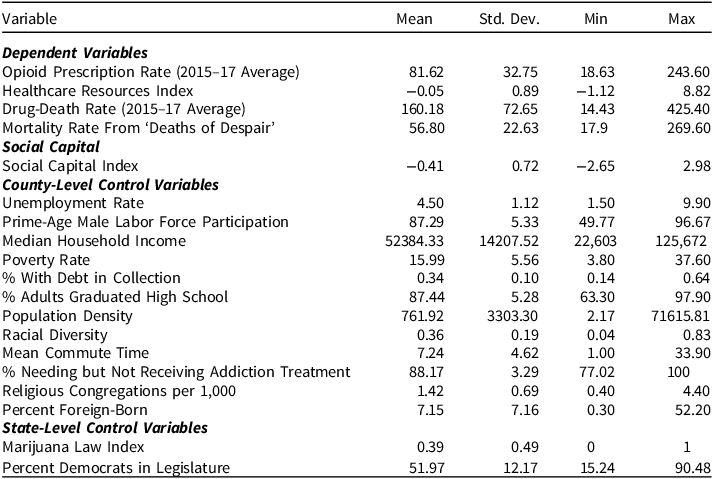
Figure 4 presents a summary of the core findings for drug-related deaths (Appendix A presents the full results and Appendix B presents alternative IV-SEM models). Before discussing the key findings, there are several noteworthy relationships. Economic conditions, specifically male labor force participation, and the percentage in debt collection, appear to be strong predictors of opioid prescription rates. Worse economic conditions for these variables are associated with higher prescription rates. Interestingly, religious congregations per capita are positively associated with opioid rates. It could be that this is a response to drug use (i.e. more congregations are formed in response to social problems), or it could signal social/religious fractionalization within a community (i.e. many different denominations). No other variables are statistically significant. This includes our key variable of interest, social capital. This suggests that social capital may not have a direct effect on opioid use, at least not as measured in our analysis. Thus, we do not find support for Hypothesis 1 (or, by extension, Hypothesis 4a).
SEM results for drug-related deaths.
If we turn to the determinants of healthcare resources, however, we find that social capital has a strong and statistically significant positive effect (std. coeff. = 0.192). The only other variables with larger effects on healthcare resources are drug-related deaths (0.919) and the percentage of Democrats in the state legislature (0.265). The effect of social capital is stronger than the opioid prescription rate (−0.167) and the percent needing but not receiving addiction treatment (0.164). This supports Hypothesis 3 wherein we posit that higher levels of social capital will result in greater investments in healthcare resources aimed at addressing the opioid crisis. This is in line with the expectations from the social empathy hypotheses wherein social capital increases social trust and empathy for those less fortunate (e.g. Hawes and McCrea 2019).
Finally, Fig. 4 suggests that social capital has a positive effect on drug-related deaths (0.216), while healthcare resources are associated with a negative (and much stronger) effect on deaths (−0.519). It seems, then, that any association between social capital and reduced deaths is an indirect (mediated) effect via healthcare resources rather than a direct effect (Hypothesis 4b). Indeed, we can assess this by estimating the indirect effects of this mediated relationship by examining the non-linear combinations of estimates and their standard error (Kline Reference Kline2015).Footnote 12 For Model 1, the indirect effect of social capital on drug deaths as mediated through healthcare resources is negative and statistically significant. The standardized indirect effect of social capital as mediated through healthcare resources is −0.10 (p = 0.033), which equates to about 10.15 fewer drug-related deaths per 100,000. Interestingly, however, the total effect of social capital is insignificant.
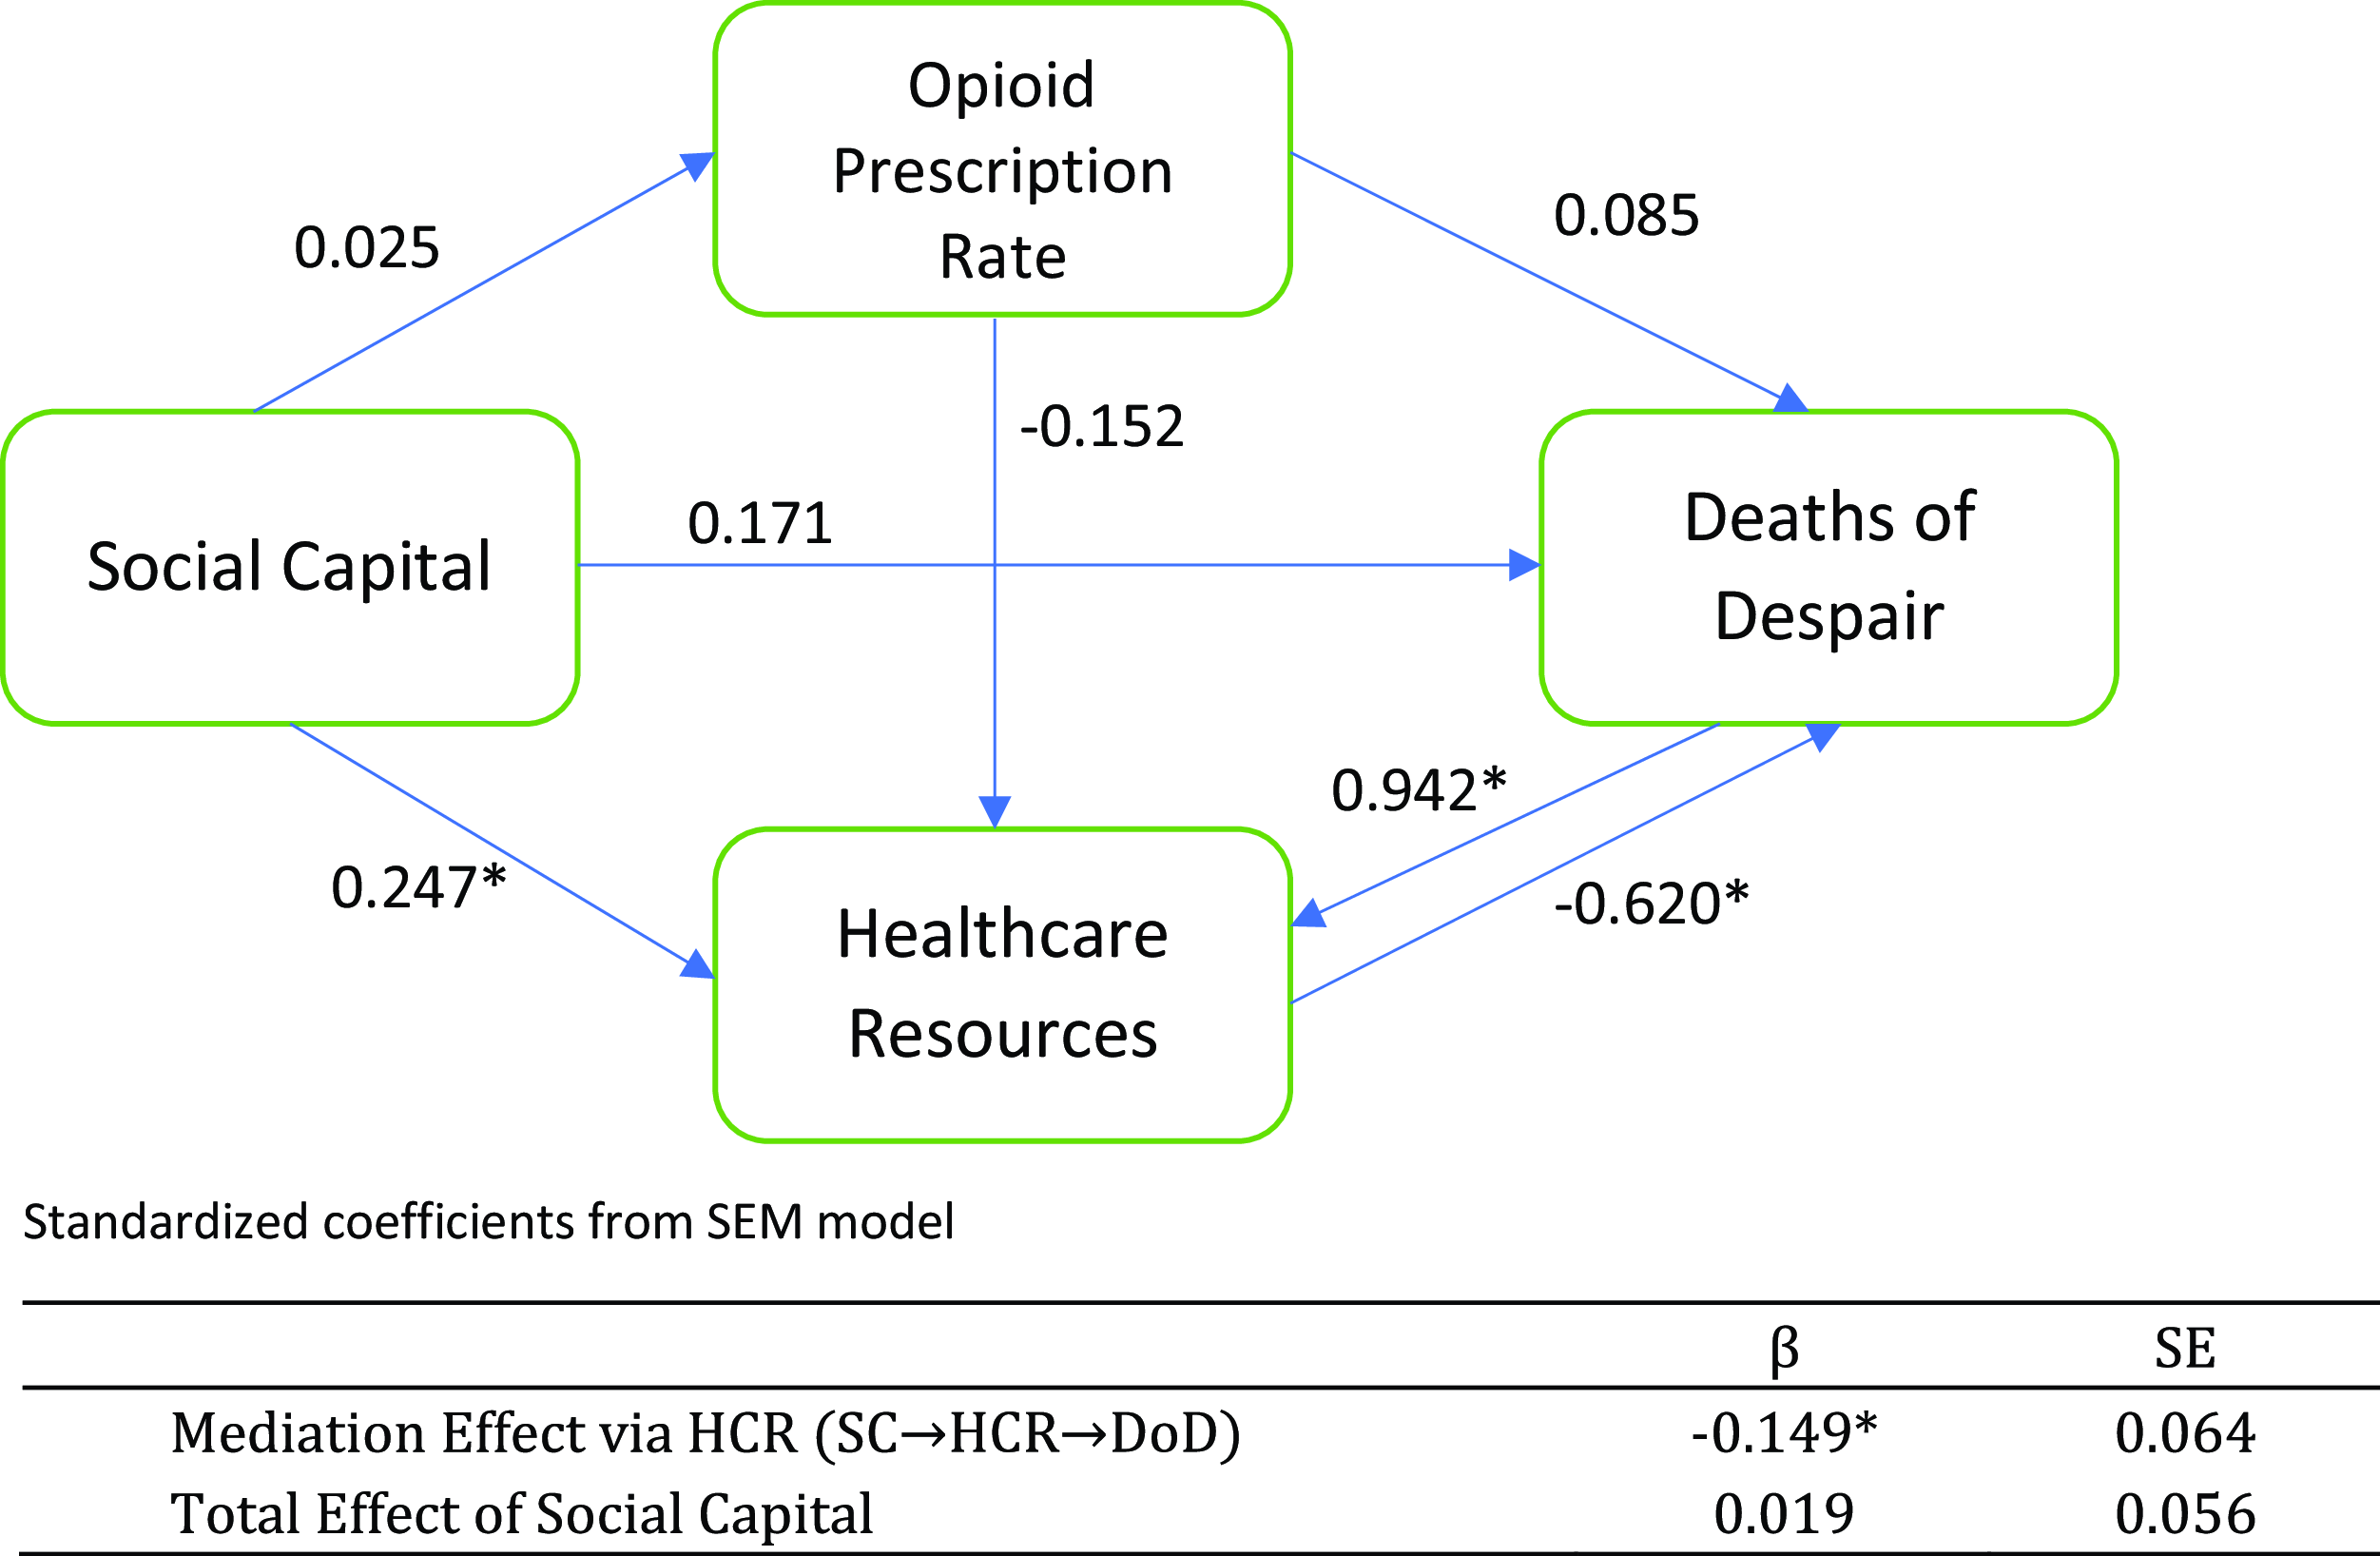
Figure 5 presents a summary of the core findings for deaths of despair. The results are similar to that of drug-related deaths. Opioid use is driven by economic factors – specifically male labor force participation and debt in collections – as well as the presence of more religious congregations. Social capital does not appear to have a direct effect on opioid prescription rates or deaths of despair; however, it does have a strong and positive effect on healthcare resources aimed at addressing substance abuse. Healthcare resources, in turn, have a large and significant effect on reducing deaths of despair. The standardized indirect effect of social capital mediated through healthcare resources is −0.149 (p = 0.02) which equates to 12.3 fewer deaths of despair per 100,000. The total standardized effect of social capital is 0.019 and is statistically insignificant.
SEM results for deaths of despair.
Discussion
The findings present a complex and nuanced explanation for the connection between social capital and the opioid crisis. First, we do not find evidence for a direct link between social capital and prescription drug use (Hypothesis 1). It could be that the two are not related or, more likely, that they are related in more complex ways. For example, Putnam (Reference Putnam2000) distinguishes between bridging and bonding social capital. Bonding social capital intensifies existing in-group bonds and is linked to ascribed trust while bridging social capital creates linkages across groups and is linked to generalized trust (van Staveren and Knorringa Reference van Staveren and Knorringa2007). Others have proposed a third type – linking social capital (Woolcock Reference Woolcock2001) – that creates bonds across different social strata. Still others have argued that social capital can operate in either primarily private or public ways (Compton and Meier Reference Compton and Meier2016). Thus, it could be that the type of social capital matters in terms of whether and how it would affect drug use. Future research should explore the potential for how different forms of social capital can affect substance abuse.
Second, one perplexing finding is that the direct relationship between social capital and drug-related deaths is positive (although this relationship is not statistically significant for deaths of despair). This finding runs counter to Hypothesis 2, which posits that the direct effect of social capital should be negative. Instead, we find that social capital has a positive effect on drug-related deaths and no effect on deaths of despair. Rather, any negative effect social capital has on deaths seems to be mediated by healthcare resources (Hypothesis 4b), as confirmed in the model and the test for indirect effects. Thus, while the positive direct relationship is surprising, it is not entirely inconsistent with our argument, which contends that social capital works through institutions (also see Compton and Meier Reference Compton and Meier2016). This is particularly true when considering wicked problems. That is, the presence of social capital itself may not directly or independently ameliorate public problems. Indeed, the total effect of social capital on deaths is insignificant. Rather, the effects of social capital operate by building and connecting social and public resources to address such problems and it is through these institutions that we see the impact on policy outcomes. In the absence of these institutions, the effects of social capital alone may be ineffectual. Efforts to bolster social capital should then also focus on bolstering public institutions. Much of the research on the effects of social capital primarily examines the direct association between social capital and policy outcomes. However, this approach may not fully capture the complexity of these relationships, including how institutions mediate social capital.
Furthermore, as others have argued (e.g. Hawes and McCrea Reference Hawes and McCrea2018; Putnam Reference Putnam2000; van Staveren and Knorringa Reference van Staveren and Knorringa2007; Woolcock Reference Woolcock2001), social capital can take different forms and, accordingly, produce different effects depending on the form. Hawes (Reference Hawes2019), for example, finds that the effects of social capital on drug policy are not constant or unidirectional. Rather, racial context determines whether social capital will lead to more stringent or less stringent drug policies. In the context of drug use and abuse, the role of bonding versus bridging social capital may be crucially important. Elevated levels of bonding social capital among those who are not sympathetic to the plight of the addicted may result in actions or policies that harm drug users, which could lead to higher deaths. Indeed, among the largest barriers to the use and distribution of naloxone, a life-saving opioid antagonist, is the stigma associated with drug use as well as communities and community organizers who resist its use out of fear that such use will encourage drug use (Bessen et al. Reference Bessen, Metcalf, Saunders, Moore, Meier, McLeman, Walsh and Marsch2019). Higher levels of social capital in such communities or groups could result in more effective lobbying against harm-reduction policies, which, in turn, could limit the availability of such measures and could ultimately result in higher death rates. Our findings comport with the idea that it is not the mere presence of social capital but rather how it works through institutions that matters for addressing wicked problems. The “direct” effect of social capital we find in our models may represent forms of social capital (e.g. social controls) that are not likely to engage in efforts to support public harm-reduction initiatives, thus explaining the positive coefficient. Forms of social capital that are sympathetic to such efforts may be better captured in the positive relationship between social capital and addiction-related healthcare resources, which, in turn, has a negative effect on drug deaths. A key takeaway from this research is that, when considering how social capital affects policy outcomes, we should explicitly account for the role of institutions and how they may mediate social capital. Additional work should examine the role of racial context and how different forms of social capital may produce different results.
There are several caveats to our research. First, due to data limitations, we have a measure of social capital that is single-dimensional. As noted above, social capital may take several different forms, each of which may have differing impacts on drug use and deaths. Furthermore, prescription drug use may differ from illicit drug use, and the effects of social capital may affect these differently. Here, we only examine opioid prescription rates rather than illicit drug use, which is a significant contributor to drug-related deaths. Our analysis is only cross-sectional. While social capital itself tends to be relatively stable, our theoretical model between these variables is dynamic and changes may compound over time. Testing these effects of time could add more insight into these dynamics. Furthermore, this analysis focuses solely on a USA context. Social capital may have differing effects in differing contexts, particularly in countries where patterns of drug use and abuse differ from the USA.
Conclusion
A wealth of research has found empirical support for the claim that social capital is associated with positive social, economic, and health benefits for society. In this article, we examine the link between social capital, opioid prescription rates, drug-related deaths, and drug treatment access. We argue that social capital can enhance formal institutions with the capacity to address wicked problems like the opioid crisis by reducing information asymmetries, acting as a substitute for lapses in social systems, and enhancing empathy and support for fellow citizens’ needs. We test these hypotheses using SEM models on cross-sectional county-level data in the USA. We find support for our hypothesis between social capital and investments in healthcare resources. We find that for death rates, social capital works through formal institutions, particularly healthcare resources aimed at addressing substance abuse disorders rather than directly. Indeed, the direct effects alone may actually be associated with increased death rates as was the case in Model 1.
Opioid use/abuse is indisputably a significant public health crisis. Traditional views of drug addiction as a private problem fail to appreciate the complexity and systemic nature of access to drugs, information asymmetries, and the importance of coordinated public and community responses to these seemingly “private” problems. As a significant public health issue, a public response is needed. Communities with greater social capital that is channeled into formal institutions (e.g. healthcare resources) are arguably better able to leverage public resources to combat and address such public problems with information, oversight, and coordinated responses.
Our findings suggest that social capital is primarily linked to bolstering formal institutions rather than necessarily impacting private choice. For example, we do not find a direct link between social capital and lower prescription drug use; however, we do find that communities with higher levels of social capital are more likely to support institutional healthcare choices that target care for those suffering from substance abuse disorder. The decision to publicly invest in harm-reduction measures – such as administering medication-assisted treatments like methadone or buprenorphine – can be a politically fraught one where opponents emphasize personal accountability over collective action. The result is that many policymakers may shy away from politically controversial policies related to substance abuse. Our research suggests, however, that social capital may play an important role in garnering public support for such policies. Social capital emphasizes “we” versus “me” (Putnam Reference Putnam2000) and may increase social empathy toward the recipients of redistributive policies such as welfare if the conceptualization of “we” is expansive (Hawes and McCrea 2019). This may also be the case concerning harm-reduction policies aimed at addressing the opioid crisis.
Supplementary material
The supplementary material for this article can be found at https://doi.org/10.1017/S0143814X24000308
Data availability statement
Replication materials are available in the Journal of Public Policy Dataverse at https://doi.org/10.7910/DVN/T4ZEMD
Acknowledgements
We would like to thank the anonymous reviewers for helpful comments and suggestions for earlier versions of the manuscript.
Full SEM models
Full Results from SEM for Drug-Related Deaths
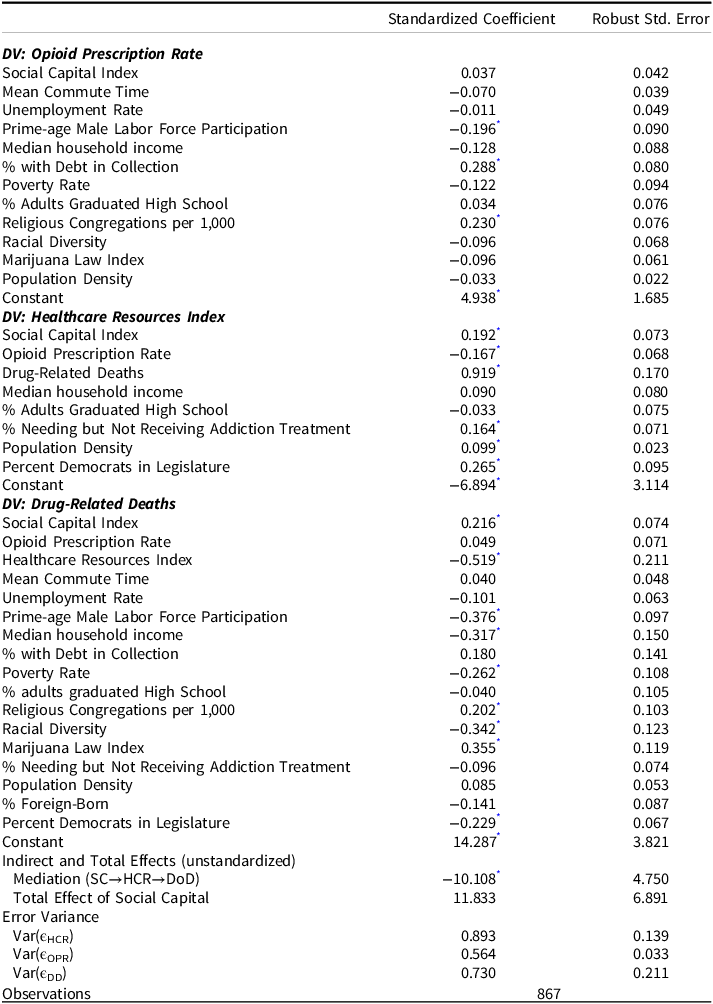
Results based on SEM with standardized coefficients with robust standard errors clustered by state.
Equation-level goodness of fit statistics
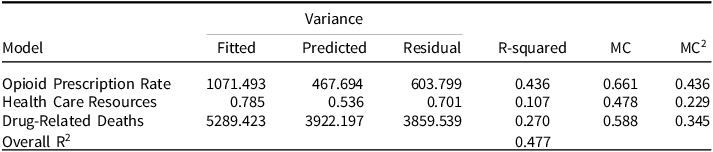
MC = correlation between DV and its prediction.
MC2 = the Bentler-Raykov squared multiple correlation coefficient.
Full Results from SEM for Deaths of Despair
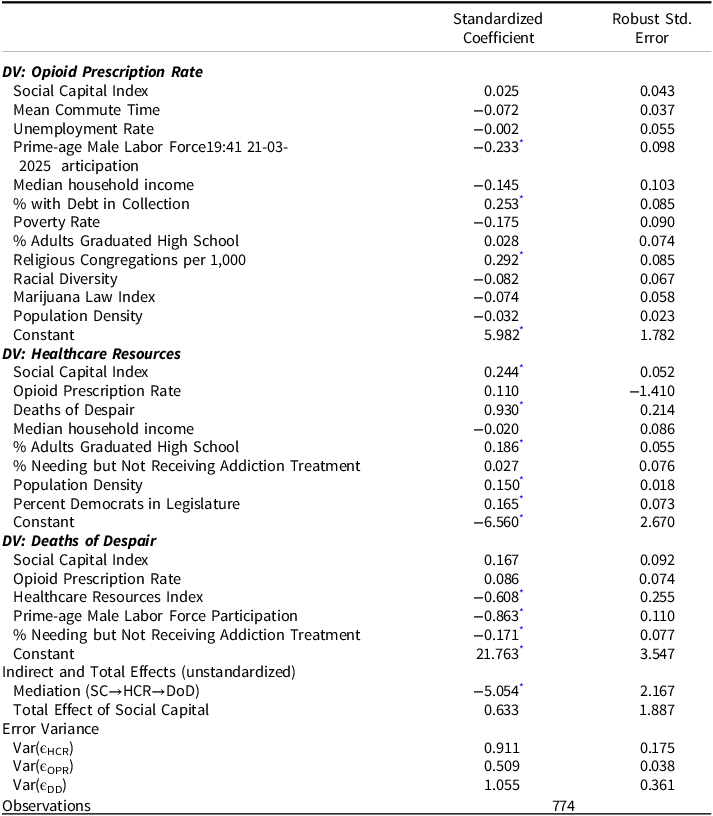
Results based on SEM with standardized coefficients with robust standard errors clustered by state.
Equation-level goodness of fit statistics
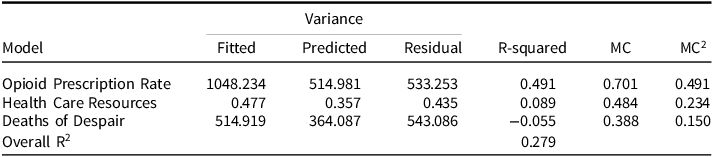
MC = correlation between DV and its prediction.
MC2 = the Bentler-Raykov squared multiple correlation coefficient.


 Open access