

Brain structure and function are affected in persons with psychiatric and neurodegenerative diseases (Mosconi et al., Reference Mosconi, Brys, Glodzik-Sobanska, De Santi, Rusinek and de Leon2007; Sacher et al., Reference Sacher, Neumann, Funfstuck, Soliman, Villringer and Schroeter2011; Shenton et al., Reference Shenton, Dickey, Frumin and McCarley2001), and in healthy family members at increased genetic risk for those diseases (Winterer et al., Reference Winterer, Coppola, Egan, Goldberg and Weinberger2003). The challenge of linking specific genetic or environmental risk factors to behaviors and brain disorders has led to interest in using neuroimaging measures of brain structural and functional features as intermediate phenotypes (Boomsma et al., Reference Boomsma, Busjahn and Peltonen2002; Glahn et al., Reference Glahn, Thompson and Blangero2007). The closer we place our measurements to the level of the neuronal circuitry, the less heterogeneous the phenotype. The less heterogeneous the phenotype, the fewer genes are likely to influence the phenotype, and the larger the effect of a single gene may be, making contributing genes easier to identify (de Geus et al., Reference de Geus, Goldberg, Boomsma and Posthuma2008; Gottesman & Gould, Reference Gottesman and Gould2003). Brain structure and function as assessed by magnetic resonance imaging (MRI) can be measured on a continuous quantitative scale independent of disease state, increasing statistical power to detect genetic effects. Further, these measures are presumably stable over time (Bonekamp et al., Reference Bonekamp, Nagae, Degaonkar, Matson, Abdalla, Barker, Mori and Horska2007; Dickerson et al., Reference Dickerson, Fenstermacher, Salat, Wolk, Maguire, Desikan, Pacheco, Quinn, Van der Kouwe, Greve, Blacker, Albert, Killiany and Fischl2008), and may require smaller sample sizes to detect association (Rasch et al., Reference Rasch, Papassotiropoulos and de Quervain2010).
Twin imaging studies of discordant patient–control samples have revealed significant additive genetic influences on the correlations between schizophrenia liability and total brain volume (TBV) (Rijsdijk et al., Reference Rijsdijk, van Haren, Picchioni, McDonald, Toulopoulou, Hulshoff Pol, Kahn, Murray and Sham2005), progressive whole brain (66%), frontal lobe (76%), and temporal lobe (79%) volume change (Brans et al., Reference Brans, van Haren, van Baal, Schnack, Kahn and Hulshoff Pol2008). Rijsdijk et al. (Reference Rijsdijk, Viding, De Brito, Forgiarini, Mechelli, Jones and McCrory2010) furthermore showed that a common genetic factor explains the phenotypic relationship between left posterior cingulate and right dorsal anterior cingulate gray matter (GM) concentrations and psychopathic traits. Decreases in white matter (WM) were related to the genetic risk of developing bipolar disorder (bivariate heritability, 77%), with up to 45% of this relationship explained by common genetic factors; significant environmental correlations were found for cortical GM (van der Schot et al., Reference van der Schot, Vonk, Brans, van Haren, Koolschijn, Nuboer, Schnack, van Baal, Boomsma, Nolen, Hulshoff Pol and Kahn2009).
In the past 15 years there have been a few dozen twin studies of neuroimaging measures in healthy population-based samples. However, due to considerable variation in the methodologies employed, it is difficult to draw clear conclusions regarding the relative magnitude of genetic and environmental influences. Estimates of the proportion of variance in neuroimaging measures accounted for by genetic influences (i.e., heritability) range from 0% to almost 100% (e.g. Chiang et al., Reference Chiang, Barysheva, Shattuck, Lee, Madsen, Avedissian, Klunder, Toga, McMahon, de Zubicaray, Wright, Srivastava, Balov and Thompson2009; Kremen et al., Reference Kremen, Prom-Wormley, Panizzon, Eyler, Fischl, Neale, Franz, Lyons, Pacheco, Perry, Stevens, Schmitt, Grant, Seidman, Thermenos, Tsuang, Eisen, Dale and Fennema-Notestine2010b). Similarly, estimates of the proportion of variance accounted for by shared environmental factors range from 0% to ~70% (e.g. Chiang et al., Reference Chiang, Barysheva, Shattuck, Lee, Madsen, Avedissian, Klunder, Toga, McMahon, de Zubicaray, Wright, Srivastava, Balov and Thompson2009; Wright et al., Reference Wright, Sham, Murray, Weinberger and Bullmore2002). This may be due to differences in methodology and demographics (age, sex, socio-economic status). It may also reflect the manner in which heritability is assessed, that is, Falconer's heritability versus structural equation modeling. Smaller structures may not reach significant heritability, because these structures are difficult to measure accurately. With voxel-based analyses, strict multiple comparisons applied to minimize false-positive results across the whole brain may also prevent smaller areas from reaching significant heritability, possibly giving an underrepresentation of actual genetic influences on brain areas. Most of all, the generalizability of some of the earlier findings may be limited because of small (twin) sample sizes: many studies have had low power to statistically distinguish between genetic and shared environmental influences, with wide confidence intervals (CIs) around variance estimates. The non-generalizability of the twin method due to differences in the intra-uterine and family environment of twins, compared with singletons (Doyle, Reference Doyle1996; Fowler et al., Reference Fowler, Kleinman, Kiely and Kessel1991), has been tested for brain volume in two independent twin–sibling cohorts (Hulshoff Pol et al., Reference Hulshoff Pol, Posthuma, Baaré, De Geus, Schnack, van Haren, van Oel, Kahn and Boomsma2002; Ordaz et al., Reference Ordaz, Lenroot, Wallace, Clasen, Blumenthal, Schmitt and Giedd2010). Both studies concluded that twin designs can provide reliable estimates of heritabilities of global brain volume measures, and that these can be generalized to the singleton population.
Here we carried out a meta-analysis of existing twin studies in order to provide more robust estimates of the magnitude of genetic and environmental influences on neuroimaging measures. Furthermore, the goal was to summarize the available data on the sources of variance in MRI phenotypes, to see if more recent findings challenge those of older studies. As sample sizes in imaging genetics studies, until recently, were small, individual studies may not have had sufficient statistical power to accurately estimate the relative importance of genetic and environmental sources of variance. By combining results from individual studies, and weighting them by their respective sample sizes, we can improve the estimates and, potentially, detect patterns obscured due to small sample sizes. Phenotypes which cannot be meta-analyzed are reviewed.
Methods
The studies we examined in this meta-analysis utilized the twin design and genetic modeling to determine the additive genetic (A), shared environmental (C), and unshared environmental (E) sources of variance in neuroimaging measures. All A, C, and E estimates reported in this paper refer to standardized variance components obtained by employing maximum-likelihood modeling procedures that determine the combination of genetic and environmental parameters that best fit the covariance structure of the observed data. Most reports used in our analyses employed maximum-likelihood modeling procedures using the statistical package Mx (Neale et al., Reference Neale, Baker, Xie and Maes2002).
Selection of relevant twin studies on brain imaging phenotypes for this study started with a search of the electronic database PubMed (http://www.ncbi.nlm.nih.gov/entrez) using the following keywords: heritability - twin - brain - imaging - MRI - genetic. The cut-off date for inclusion was 31 December 2011. Abstracts of these search results were examined and relevant articles retrieved for review. One doctoral thesis, one study identified from the abstract list from the Annual Meeting of the American Society of Human Genetics, and three studies identified from the abstract lists from the Annual Meeting of the Organization for Human Brain Mapping, were also added. Studies were excluded from the analysis based on two main criteria. First, only studies that used monozygotic (MZ)/dizygotic (DZ) twin samples and applied genetic modeling to investigate the genetics of brain structure were included. This procedure identified 62 structural twin imaging studies — 52 studies on macrostructure and 10 on WM microstructure — and seven functional twin imaging studies. The majority of the samples were from the US, Australia, and The Netherlands; for the purposes of the meta-analysis, only studies using independent samples were included. Some authors used a subsample of the same cohort. In these cases only one of the reports was included in the meta-analysis, with a preference for: reports with the largest sample; the best balance between number of MZ and number of DZ pairs; availability of 95% CIs; the most suitable measure of brain structure; reporting estimates for the full ACE model (reporting A, C, and E); and (for consistency) estimates based on univariate models as opposed to multivariate models.
The literature search also identified six pedigree studies (five on macrostructure and one on WM microstructure). Although pedigree studies were not included in the meta-analysis, as they are not able to estimate C influences, they do provide important information. Therefore, they are summarized in the overview tables.
Any given structural phenotype was meta-analyzed when at least two independent studies estimated variance components for that phenotype. We meta-analyzed the standardized variance components for the phenotypes by calculating the weighted average A, C, and E estimates as outlined in Li et al. (Reference Li, Cheng, Ma and Swan2003) and Verweij et al. (Reference Verweij, Zietsch, Lynskey, Medland, Neale, Martin, Boomsma and Vink2010). Briefly, to estimate the weighted mean, the parameter estimates for each cohort were weighted by the number of participants from complete twin pairs in the sample. Calculations were conducted in Microsoft Office Excel 2010. Estimates were made separately for each phenotype. We also calculated the 95% CIs around each estimate, calculated from the variance in the sample of source studies.
As gyral GM volumes, surface area measures, and amygdala volume were investigated in only one independent sample, these measures were not meta-analyzed. Furthermore, we were not able to meta-analyze voxel-based studies.
Results
Genetic and Environmental Effects on Brain Structure
To date 62 neuroimaging studies, including adults and children, have investigated and compared brain structure in healthy MZ and DZ twins through structural equation modeling. These studies have consistently found that global measures of brain structure are under strong genetic control, including intracranial volume (ICV), TBV, total cerebral volume (TCV), hemispheric volumes, cerebral lobe volumes, and total and regional GM and WM volumes. However, estimates are highly variable across studies for volumes of the cerebellum, subcortical structures, and ventricles; and for area measures of the corpus callosum, regional cortical surface area, and regional cortical thickness (CT), particularly for frontal and temporal GM areas.
Voxel-based approaches find high levels of genetic influence on GM density in frontal and both Broca's and Wernicke's areas, Heschl's gyrus, left occipital and left posterior cingulate, the amygdala, and middle temporal cortices (up to 83%) (Cannon et al., Reference Cannon, Thompson, van Erp, Huttunen, Lonnqvist, Kaprio and Toga2006; Hulshoff Pol et al., Reference Hulshoff Pol, Schnack, Posthuma, Mandl, Baaré, van Oel, van Haren, Collins, Evans, Amunts, Burgel, Zilles, de Geus, Boomsma and Kahn2006; Peper et al., Reference Peper, Schnack, Brouwer, Van Baal, Pjetri, Szekely, van Leeuwen, van den Berg, Collins, Evans, Boomsma, Kahn and Hulshoff Pol2009; Thompson et al., Reference Thompson, Cannon, Narr, van Erp, Poutanen, Huttunen, Lonnqvist, Standertskjold-Nordenstam, Kaprio, Khaledy, Dail, Zoumalan and Toga2001). High heritability is found for WM density of the corpus callosum, corticospinal tract, superior occipital-frontal and longitudinal fasciculi, and optic radiation (up to 93%) (Hulshoff Pol et al., Reference Hulshoff Pol, Schnack, Posthuma, Mandl, Baaré, van Oel, van Haren, Collins, Evans, Amunts, Burgel, Zilles, de Geus, Boomsma and Kahn2006; Peper et al., Reference Peper, Schnack, Brouwer, Van Baal, Pjetri, Szekely, van Leeuwen, van den Berg, Collins, Evans, Boomsma, Kahn and Hulshoff Pol2009). CT has been shown to be most highly heritable in frontal and parietal areas, and to a lesser extent the posterior cingulate, medial, and superior temporal cortices (Joshi et al., Reference Joshi, Leporé, Joshi, Lee, Barysheva, Stein, McMahon, Johnson, Zubicaray, Martin, Wright, Toga and Thompson2011; Lenroot et al., Reference Lenroot, Schmitt, Ordaz, Wallace, Neale, Lerch, Kendler, Evans and Giedd2009; Rimol et al., Reference Rimol, Panizzon, Fennema-Notestine, Eyler, Fischl, Franz, Hagler, Lyons, Neale, Pacheco, Perry, Schmitt, Grant, Seidman, Thermenos, Tsuang, Eisen, Kremen and Dale2010; Yoon et al., Reference Yoon, Fahim, Perusse and Evans2010). Heritability of changes in CT is highest in superior and middle frontal areas, superior temporal areas, cingulate, sensorimotor cortices, primary visual and lateral occipital cortices in preadolescence (van Soelen et al., Reference van Soelen, Brouwer, van Baal, Schnack, Peper, Collins, Evans, Kahn, Boomsma and Hulshoff Pol2012), and in the left orbitofrontal, left and right superior temporal, left superior frontal, left and right lateral parietal, and right lateral and right medial occipital cortices in adulthood (Brans et al., Reference Brans, Kahn, Schnack, van Baal, Posthuma, van Haren, Lepage, Lerch, Collins, Evans, Boomsma and Hulshoff Pol2010). Studies using deformation-based/tensor-based morphometry found strong genetic influences in the corpus callosum (Brun et al., Reference Brun, Leporé, Pennec, Lee, Barysheva, Madsen, Avedissian, Chou, Zubicaray, McMahon, Wright, Toga and Thompson2009; Yoon et al., Reference Yoon, Perusse, Lee and Evans2011), in early-maturing brain regions such as the occipital lobes (Brun et al., Reference Brun, Leporé, Pennec, Lee, Barysheva, Madsen, Avedissian, Chou, Zubicaray, McMahon, Wright, Toga and Thompson2009), and bilaterally in the lateral fronto-orbital gyrus, cerebellum, several subcortical structures, brain stem, in the left frontal WM, inferior temporal gyrus and uncus, the right temporal WM, and superior frontal gyrus (Yoon et al., Reference Yoon, Perusse, Lee and Evans2011). These voxel-based studies show that areas of strong heritability cross anatomical boundaries.
More recently, studies have started investigating measures of WM microstructure and have found high regional heritability of measures of WM fiber integrity derived from diffusion tensor imaging (DTI), such as fractional anisotropy (FA) or geodesic anisotropy (GA), and mean, longitudinal, or radial diffusivity (Brouwer et al., Reference Brouwer, Mandl, Peper, van Baal, Kahn, Boomsma and Hulshoff Pol2010; Chiang et al., Reference Chiang, Barysheva, Lee, Madsen, Klunder, Toga, McMahon, de Zubicaray, Meredith, Wright, Srivastava, Balov and Thompson2008; Chiang et al., Reference Chiang, Barysheva, Shattuck, Lee, Madsen, Avedissian, Klunder, Toga, McMahon, de Zubicaray, Wright, Srivastava, Balov and Thompson2009; Jahanshad et al., Reference Jahanshad, Lee, Barysheva, McMahon, de Zubicaray, Martin, Wright, Toga and Thompson2010; Pfefferbaum et al., Reference Pfefferbaum, Sullivan and Carmelli2001). Brouwer and colleagues, furthermore, found significant heritability for magnetization transfer ratio, a proposed marker for myelination level, in the corpus callosum and superior longitudinal fasciculus. Imaging phenotypes with low heritability, such as gyral patterning of the cortex (Bartley et al., Reference Bartley, Jones and Weinberger1997; Eckert et al., Reference Eckert, Leonard, Molloy, Blumenthal, Zijdenbos and Giedd2002; Hasan et al., Reference Hasan, McIntosh, Droese, Schneider-Axmann, Lawrie, Moorhead, Tepest, Maier, Falkai and Wobrock2011) may be markers of both shared and non-shared environmental events that influence brain development.
For each of the studies, information about the cohort, age range, sample size, and phenotypes are presented in Table 1 (structural MRI) and Table 2 (DTI). Supplementary tables report exact variance component estimates.
Structural MRI Twin and Family Studies

Abbreviations: 3rdV, third ventricle; 4thV, fourth ventricle; A, additive genetic; AC, anterior cingulate; ACC, anterior cingulate cortex; AG, angular gyrus; AMYG, amygdala; ant, anterior; BG, basal ganglia; C, common environment; CAUD, caudate nucleus; cau, caudal; CB, cerebellum; CC, corpus callosum; cGM, cerebral gray matter; CING, cingulate cortex; CS, central sulcus; CSF, cerebrospinal fluid; CST, corticospinal tract; CT, cortical thickness; CUN, cuneus; cWM, cerebral white matter; DBM, deformation-based morphometry; DLPFC, dorsolateral prefrontal cortex; DZ, dizygotic; E, unique environment; ERC, entorhinal cortex; F, female; FG, fusiform gyrus; FR, frontal; GM, grey matter; GMd, grey matter density; GP, globus pallidus; HG, Heschl's gyrus; HIP, hippocampus; ICV, intracranial volume; IFG, inferior frontal gyrus; indiv, individuals; inf, inferior; IOG, inferior occipital gyrus; IPC, inferior parietal cortex; ITG, inferior temporal gyrus; lat, lateral; LG, lingual gyrus; LH, left hemisphere; LV, lateral ventricle(s); M, male; med, medial; MedFG, medial frontal gyrus; MFG, middle frontal gyrus; MFL, medial frontal lobe; MOG, middle occipital gyrus; msa, midsagittal area; MTG, middle temporal gyrus; MZ, monozygotic; NA, not available; NAcc, nucleus accumbens; OCC, occipital, occipito; OFC, orbitofrontal cortex; OFG, orbitofrontal gyrus; OpIFG, pars opercularis; ORB, orbital, orbito; OrbIFG, pars orbitalis; OTG, occipito-temporal gyrus; PAR, parietal; PC, posterior cingulate; PCC, posterior cingulate cortex; PCAL, pericalcarine cortex; PCL, paracentral lobule; PCUN, precuneus; PF, prefrontal; PHG, parahippocampal gyrus; PMC, premotor cortex; post, posterior; PostCG, postcentral gyrus; PreCG, precentral gyrus; PS, peristriate; PUT, putamen; RH, right hemisphere; rostral, ros; RSC, retrosplenial cortex; SA, surface area; s-b, surface-based; SFG, superior frontal gyrus; SFL, superior frontal lobe; SMG, supramarginal gyrus; SOF, superior orbitofrontal; SOG, superior occipital gyrus; SPC, superior parietal cortex; SPG, superior parietal gyrus; SPL, superior parietal lobule; STG, superior temporal gyrus; STL, superior temporal lobe; STS, superior temporal sulcus; sup, superior; T1, T2, time 1, time 2; TBM, tensor-based morphometry; TBV, total brain volume; TCV, total cerebral volume; TEMP, temporal; THAL, thalamus; TriIFG, pars triangularis; uWM: unmyelinated white matter; V1, V2, V3, primary, secondary, tertiary visual cortex; v-b, volume-based; VLPFC, ventrolateral prefrontal cortex; V-W, voxel-wise; WM, white matter; WMd, white matter density; Δ, change.
Cohort/Study Abbreviations: CLDRC, Colorado Learning Disabilities Research Center; FHS, Framingham Heart Study; FNTR, Finnish National Twin Registry; NHLBI, National Heart, Lung, and Blood Institute Twin Study; NIMH, National Institute of Mental Health; NTR, Netherlands Twin Registry; QNTS, Quebec Newborn Twin Study; QTIMS, Queensland Twin Imaging Study; PTS, Pediatric Twin Study; SAFHS, San Antonio Family Heart Study; TEDS, Twins Early Development Study; UMCTS, Utrecht Medical Centre Twin Sample; UNC, University of North Carolina; VETSA, Vietnam Era Twin Study of Aging.
a Phenotypes are volumes unless otherwise specified; b These studies reported on a patient sample and a healthy control sample. Only the estimates for the healthy controls sample are included here; c No age range reported, only mean (standard deviation); # Estimate included in meta-analysis for that phenotype.
Diffusion Tensor Imaging Twin and Family Studies

Abbreviations: aTR, anterior thalamic radiation; CC, corpus callosum; CING, cingulate; CR, corona radiata; CST, corticospinal tract; DZ, dizygotic; EC, external capsule; FA, fractional anisotropy; FR, frontal; GA, geodesic anisotropy; GM, grey matter; IC, internal capsule; ILF, inferior longitudinal fasciculus; indiv, individuals; inf, inferior; JSD, Jensen-Shannon divergence; L, left; LD, longitudinal diffusivity; MD, mean diffusivity; med, medial; MTR, magnetization transfer ratio; MZ, monozygotic; NA, not available; OCC, occipital, occipito; OFF, occipito-frontal fasciculus; OR, optic radiation; PAR, parietal; R, right; RD, radial diffusivity; SLF, superior longitudinal fasciculus; SS, sagittal stratum; sup, superior; T1, T2, time 1, time 2; TEMP, temporal; tGA, tangent of geodesic anisotropy; UF, uncinate fasciculus; V-W, voxel-wise; WM, white matter; Δ, change.
Cohort/Study Abbreviations: NHLBI, National Heart, Lung, and Blood Institute Twin Study; NTR, Netherlands Twin Registry; QTIMS, Queensland Twin Imaging Study; SAFHS, San Antonio Family Heart Study; UMCTS, Utrecht Medical Centre Twin Sample; UNC, University of North Carolina.
# Estimate included in meta-analysis for that phenotype.
The large majority of the studies employed structural MRI, measuring a total of 489 phenotypes (including eight voxel-wise phenotypes) across studies. Here we meta-analyzed 102 (~21%) of those phenotypes. A smaller number of studies employed DTI, measuring a total of 137 phenotypes (including seven voxel-wise phenotypes) across studies. Here we meta-analyzed four (~3%) of those phenotypes.
The largest published twin study on structural MRI included 121 MZ pairs and 162 DZ pairs (Quiggle et al., Reference Quiggle, Hansell, Johnson, Blokland, McMahon, Montgomery, Thompson, Martin, de Zubicaray and Wright2011). Generally, structural MRI phenotypes have been studied in very different age groups, with 1 study in newborns (~2%); 13 studies in children and adolescents (~28%); 9 studies in young adults (~20%); 15 studies in adults (~33%); and 8 studies in elderly twins (~17%). For example, lobar CT was assessed in only two independent samples, an adult and a child sample. Likewise, regional CT was assessed in up to three independent samples, a children/adolescents sample, a young adult sample, and an adult sample. The large majority of DTI studies (~60%) have been carried out in a young adult sample, and the four meta-analyzed DTI phenotypes were based on samples that differed greatly in age: children, young adults, and elderly cohorts. The largest published twin study on DTI included 129 MZ pairs and 170 DZ pairs (Chiang et al., Reference Chiang, McMahon, de Zubicaray, Martin, Hickie, Toga, Wright and Thompson2011).
Table 3 shows the results of the meta-analysis for genetic contributions to brain structural phenotypes. Overall, only 62 phenotypes were examined in three or more studies, and only 35 phenotypes were studied in more than 1,000 individuals. The largest number of independent studies has been carried out for lateral ventricular volume, with eight studies and 1,466 individuals from twin pairs, but the CIs are still wide. Only four phenotypes — ICV, TBV, lateral ventricle, and midsagittal area of the corpus callosum — included five or more cohorts, and only three of those phenotypes include over 1,000 twins. Other volumetric measures include two to four cohorts with an average N = 641 (range: 274–956). CT was limited to two or three cohorts with an average N = 1,045 (range: 588–1,278). For DTI, only four phenotypes were available for meta-analysis, including two cohorts each.
Variance Component Estimates for Imaging Phenotypes According to the Meta-Analysis

Abbreviations: A, additive genetic; C, common environment; CI, confidence interval; E, unique environment; FA, fractional anisotropy; GM, grey matter; lat, lateral; L, left; LH, left hemisphere; L-R, bilateral; med, medial; msa, midsagittal area; n samples, n independent samples included in meta-estimate; n indiv, n individuals from complete twin pairs; R, right; RH, right hemisphere; WM, white matter.
a Phenotypes are volumes unless otherwise specified.
b Included variance component estimates are estimates under the full ACE model where available.
c References in this table are only those of the studies included in the meta-estimate. For a complete list of references for each phenotype, please refer to Tables 1 and 2.
d,e,f,g,hVariance component estimates for one study included in meta-estimate were average of d LH and RH estimates (Brouwer, et al., 2010); e estimates for rostral and caudal middle frontal gyrus (Kremen, et al., 2010b); f estimates for pars orbitalis, pars opercularis, and pars triangularis of inferior frontal gyrus (Kremen, et al., 2010b); g estimates for rostral and caudal anterior cingulate, rostral posterior cingulate, and retrosplenial cortex (Kremen, et al., 2010b); h LH and RH estimates (Yoon, et al., 2011).
Additive genetic estimates were significantly different from zero for all meta-analyzed phenotypes, except FA of the callosal splenium and CT of the uncus, left parahippocampal gyrus, and left insula. The highest heritability was found for total WM volume (based on four cohorts and a total of 900 twins), and frontal WM volume (based on three cohorts and a total of 686 twins). The lowest heritability was found for uncus CT, which was based on only two cohorts, with a total of 874 twins.
Figure 1 depicts the relative influences of A, C, and E. What is apparent from these meta-analyses is that, although individual studies often found the common environmental component to be insignificant or zero, when combining the samples, most phenotypes appear to have a common environmental variance component, although this component is often much smaller than the additive genetic and unique environmental components.
Relative influences of variance components A, C, and E on neuroimaging measures according to the meta-analysis.

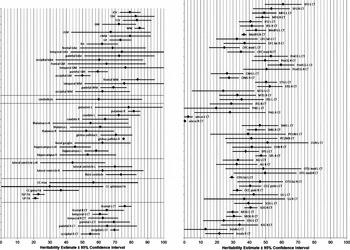
Figure 2 shows CIs around the meta-heritability estimates. CIs are tight for ICV, TBV, TCV, total GM and WM volumes, hemispheric volumes, three of the four regional FA measures, most of the average lobar CT measures, and about half of the regional CT measures; but CIs are wide for most lobar volumes, cerebellum, subcortical structures, lateral ventricle volumes, midsagittal area of the corpus callosum, splenium FA, and about half of the regional CT measures.
Heritability estimates with corresponding 95% confidence intervals according to the meta-analysis.
Our meta-analyses clearly confirm brain structure is under strong genetic control, including ICV, TBV, TCV, hemispheric volumes, cerebral lobe volumes, total and regional GM and WM volumes (heritabilities for WM volumes tend to be higher than for GM volumes), cerebellar volumes, and subcortical structures, as well as area measures of the corpus callosum.
Plotting the average size of meta-analyzed structures against the meta-estimate of heritability (Figure 3) shows that smaller structures tend to have lower heritability values than global-based and lobar-based measures. Also, while the global- and lobar-based measures consistently show high heritability, smaller structures show great variability across regions.
Meta-estimates of heritability plotted against the respective average sizes of structures (volumetric measures) obtained from the avg152T1 MNI template. Volumes were automatically segmented using the IBASPM Toolbox (Individual Brain Atlases using Statistical Parametric Mapping), authored by Lester Melie Garcia and Yasser Aleman-Gomez. Volumes are measured in milliliters (cm3), and displayed on a base 10 logarithmic scale for the purposes of separating data points representing smaller volumes (<15 ml). This graph includes all global volumes, cerebellar volume, subcortical volumes, all gyral cortical thickness regions of interest, and total lateral ventricle volume. This graph demonstrates that smaller structures tend to have lower heritability values than global-based and lobar-based measures. Smaller structures also show considerable variability in their heritability estimates.

Genetic and Environmental Effects on Brain Function
Compared to brain structure, there is still relatively little known about the heritability of task-related blood-oxygenation-level-dependent (BOLD) signal phenotypes as measured with functional MRI (fMRI), but evidence is now emerging that task-related brain activity as measured with fMRI might be significantly heritable, although results are mixed, ranging from no genetic effect to strong genetic influences (Blokland et al., Reference Blokland, McMahon, Hoffman, Zhu, Meredith, Martin, Thompson, Zubicaray and Wright2008; Blokland et al., Reference Blokland, McMahon, Thompson, Martin, Zubicaray and Wright2011; Côté et al., Reference Côté, Beauregard, Girard, Mensour, Mancini-Marie and Perusse2007; Koten et al., Reference Koten, Wood, Hagoort, Goebel, Propping, Willmes and Boomsma2009; Matthews et al., Reference Matthews, Simmons, Strigo, Jang, Stein and Paulus2007; Park et al., Reference Park, Shedden and Polk2012; Polk et al., Reference Polk, Park, Smith and Park2007). Sample descriptions and variance component estimates for fMRI studies are summarized in Table 4. For fMRI studies it was impossible to calculate meta-estimates, since only seven twin studies and one family study have been carried out thus far, with great variability in the designs used and phenotypes investigated. Studies are reviewed below.
Functional MRI Twin and Family Studies

Abbreviations: A, additive genetic; ACC, anterior cingulate cortex; AG, angular gyrus; C, common environment; CB, cerebellum; CI, confidence interval; DZ, dizygotic; E, unique environment; F, female; FC, functional connectivity; indiv, individuals; L, left; M, male; med, medial; MFG, middle frontal gyrus; MZ, monozygotic; NA, not available; PAR, parietal; PCC, posterior cingulate cortex; PCUN, precuneus; PFC, prefrontal cortex; PHG, parahippocampal gyrus; R, right; SE, standard error; SIBS, siblings; SMG, supramarginal gyrus; SR, spatial range; TEMP, temporal; VLPFC, ventrolateral prefrontal cortex; V-W, voxel-wise; Δ, change.
Cohort/Study Abbreviations: NTR, Netherlands Twin Registry; QNTS, Quebec Newborn Twin Study; QTIMS, Queensland Twin Imaging Study; SAFHS, San Antonio Family Heart Study; UCSD, University of California San Diego; UMICH, University of Michigan.
a No age range reported; only mean (standard deviation); b h2 (standard error).
In a preliminary study we attempted to quantify the heritability of brain activation during performance of an n-back working memory task as measured with BOLD fMRI in several frontal and parietal cortical regions of interest (ROIs) (Blokland et al., Reference Blokland, McMahon, Hoffman, Zhu, Meredith, Martin, Thompson, Zubicaray and Wright2008). Our results suggested that individual variation in working-memory-related brain activation is, to some extent, influenced by genes, although non-genetic factors also play a large role. More recently, we extended this study to include a larger sample of twins, estimating heritability at the voxel level rather than on an ROI basis (Blokland et al., Reference Blokland, McMahon, Thompson, Martin, Zubicaray and Wright2011). In this voxel-wise study, we found considerable influence of genetic factors on working-memory task-related brain activation, with genes accounting for up to 65% of the variance, particularly in inferior, middle, and superior frontal gyri, left supplementary motor area, pre-central and post-central gyri, middle cingulate cortex, superior medial gyrus, angular gyrus, superior parietal lobule (including precuneus), and superior occipital gyri. Functional MRI provides us with the potential to investigate whether heritable individual differences in cognition (Deary et al., Reference Deary, Spinath and Bates2006) are related to brain activation patterns that differ qualitatively among individuals. Interestingly, we found that task-related brain activation is not strongly associated with task performance or full-scale intelligence quotient (FIQ) (phenotypic correlations did not exceed .35), suggesting that there may be genetic and environmental influences on task-related brain activity that are independent of how well the task is actually being performed. Koten et al. (Reference Koten, Wood, Hagoort, Goebel, Propping, Willmes and Boomsma2009) also investigated genetic influences on n-back working memory brain activation voxel-wise, in a small sample of 10 male MZ twin pairs with one extra non-twin brother each. They found significant genetic influences on brain activation in visual cortex, temporo-parietal and frontal areas, and anterior cingulate cortex. However, this heritable activation was not task-related per se, as it occurred during the distraction phase of the task rather than during the encoding and retrieval phases, that is, the task components of interest in a working memory task. Matthews et al. (Reference Matthews, Simmons, Strigo, Jang, Stein and Paulus2007) also used a cognitive task and found that genetic influences accounted for 38% of the variance in activation of the dorsal anterior cingulate cortex during an interference task.
Furthermore, Polk and co-workers (2007) showed that neural activity patterns in ventral visual cortex were significantly more similar in MZ twins than in DZ twins for face and place stimuli (although not for orthographic stimuli), suggesting that genetics plays a significant role in determining the cortical response to faces and places. Park et al. (Reference Park, Shedden and Polk2012) found heritable activation in the left visual and motor cortices in response to a simple visuo-motor checkerboard task.
Côté et al. (Reference Côté, Beauregard, Girard, Mensour, Mancini-Marie and Perusse2007) found no indication of a genetic (or shared environmental) influence on the neural correlates of sadness, with both MZ and DZ twin correlations nonsignificant for two areas of the brain previously correlated with the subjective experience of sadness. It is important to note that in our fMRI study (Blokland et al., Reference Blokland, McMahon, Hoffman, Zhu, Meredith, Martin, Thompson, Zubicaray and Wright2008) we found that the method employed by Côté and colleagues, that is, using voxel counts and peak Z-scores within ROIs, suffers from restriction of range issues that may partly account for their negative findings.
Recently, in a large pedigree study, Glahn et al. (Reference Glahn, Winkler, Kochunov, Almasy, Duggirala, Carless, Curran, Olvera, Laird, Smith, Beckmann, Fox and Blangero2010) investigated the genetic control over the default-mode network (DMN), a coherent resting-state brain network thought to characterize basal neural activity. Heritability for DMN functional connectivity was 42%. Genetic correlations between DMN regions indicate the same genetic factors contribute to variation in functional connectivity throughout the DMN. Left parahippocampal gyrus was genetically correlated with all other DMN regions. The posterior cingulate/precuneus, medial prefrontal cortex, and right cerebellum appeared to form a sub-network.
Discussion
Results of twin studies investigating the extent to which individual differences in brain structure and function are due to genetic and environmental influences have tended to be inconsistent. We carried out the first meta-analysis of twin studies of neuroimaging measures.
Overall, by aggregating the results of a number of previous twin studies, our meta-analyses provided more robust estimates of the relative magnitudes of genetic and environmental influences on neuroimaging measures. Because our analyses average estimates over samples of different sizes and demographic make-up, our findings are likely to be more generalizable than the source studies. Whereas older, smaller studies did not have sufficient power to detect the influence of shared environment, more recent, larger studies have reported significant shared environmental influences. When combining studies, we found a significant shared environmental variance component for many phenotypes. Our results indicate that A, C, and E factors each contribute significantly to brain structure, with CIs for these estimates considerably narrower than those in the source studies. This confirms that brain structure does not have a single or simple cause, and suggests that both genetic and environmental factors are potential targets for early detection and treatment of brain disorders.
According to the meta-analysis, global volumes, cerebellar volumes, subcortical volumes, ventricular volumes, corpus callosum area, and lobar CT measurements are all highly heritable; regional CT measurements are moderately to highly heritable; and regional FA measurements are moderately heritable. When looking at the CIs, we now have good heritability estimates for about half of the lobar and regional CT measures, in addition to the large volumetric measures. Even with only two or three studies carried out in samples that vary widely in age, many of the regional CT measures have tight CIs. The regional CT measures with wide CIs show the importance of replication across independent samples and demographic groups. Although the largest number of studies has investigated total lateral ventricle volume, the genetic influence is moderate, and CIs for this measure are still wide, suggesting that this may not be a good phenotype for genetic analysis. Investigating lateral ventricular volume for the left and right hemispheres separately may prove preferable. Corpus callosum midsagittal area seems to be a problematic phenotype as well. This phenotype was studied in five independent samples, but CIs remain wide. Subcortical volumes appear to have high heritability, but because the number of samples/individuals is small, CIs are still wide. Although CIs for FA measures were tight, these are based on only two studies and a small number of twin pairs, so the meta-analyses for these measures are limited in the conclusions we can draw from them, and more DTI studies are needed to know what the actual heritability is.
Because almost all global and regional brain measures analyzed were heritable to some extent, it might appear that any of such measures could serve as endophenotypes, or as targets for genetic linkage and association studies. However, the validity of the conclusions that can be drawn from neuroimaging genetics studies depends largely on the accuracy of the trait measurement. Given the large estimate for non-shared environmental variance found here, it is important to ascertain how much of the variance can be attributed to measurement error; this error places an upper limit on heritability estimates because the variance that is measurement-specific is removed from the pool of variance that can be explained by genotype. Smaller structures tend to have lower heritability values than global-based and lobar-based measures and show considerable variability across regions and studies, perhaps because of a greater proportion of measurement error, (i.e., bias in regional partitioning). There is actually relatively little known about reliability of structural MRI within healthy individuals, even for frequently used measures such as lateral ventricular volume and corpus callosum area. A few studies have shown that reproducibility for structural and DTI measures appears to be quite good (e.g. Bonekamp et al., Reference Bonekamp, Nagae, Degaonkar, Matson, Abdalla, Barker, Mori and Horska2007; Dickerson et al., Reference Dickerson, Fenstermacher, Salat, Wolk, Maguire, Desikan, Pacheco, Quinn, Van der Kouwe, Greve, Blacker, Albert, Killiany and Fischl2008; Jovicich et al., Reference Jovicich, Czanner, Han, Salat, van der Kouwe, Quinn, Pacheco, Albert, Killiany, Blacker, Maguire, Rosas, Makris, Gollub, Dale, Dickerson and Fischl2009); but Quiggle et al. (Reference Quiggle, Hansell, Johnson, Blokland, McMahon, Montgomery, Thompson, Martin, de Zubicaray and Wright2011), for example, report a wide range of test-retest reliabilities for CT. Reliability is likely to vary with sample composition (e.g., age, gender, patients versus controls), magnetic field strength, scan interval, and processing and analysis methods, including the algorithm used by software, measure of reproducibility (e.g., intra-class correlation, coefficient of variation, or repeated measures ANOVA), ROI definition, and measure of structure (e.g., CT, surface area [SA], or GM volume). For example, in analyses of heritability of global brain structure, the functional units of the brain (the neurons that generate active electrical signals — GM) have often not been separated from the fibers that connect them (myelinated and unmyelinated axons — WM), possibly obscuring the genetic architecture. Especially important in this context is the finding that, although cortical surface area and CT are both highly heritable, they are essentially unrelated genetically at the global, lobar, and regional levels of analysis (Panizzon et al., Reference Panizzon, Fennema-Notestine, Eyler, Jernigan, Prom-Wormley, Neale, Jacobson, Lyons, Grant, Franz, Xian, Tsuang, Fischl, Seidman, Dale and Kremen2009; Winkler et al., Reference Winkler, Kochunov, Blangero, Almasy, Zilles, Fox, Duggirala and Glahn2010). These results demonstrate that cortical volume, which is a composite of surface area and CT, combines at least two distinct sources of genetic influences. They also suggest that using volume in a genetically informative study, or as an endophenotype for a disorder, may confound the underlying genetic architecture of brain structure, and that SA and CT (driven by distinct cellular mechanisms) should be considered separately in imaging genetics studies. In order to ensure optimum sensitivity to detect the relative influences of genes and environment, refinement of image acquisition, processing, and analysis methods are some of the major challenges in the field of neuroimaging genetics (de Zubicaray et al., Reference de Zubicaray, Chiang, McMahon, Shattuck, Toga, Martin, Wright and Thompson2008).
Several twin studies have concluded that most of the genetic variance in global brain structure is determined by genes that are shared between the major neural subdivisions (Pfefferbaum et al., Reference Pfefferbaum, Sullivan and Carmelli2004; Pfefferbaum et al., Reference Pfefferbaum, Sullivan, Swan and Carmelli2000; Schmitt et al., Reference Schmitt, Lenroot, Ordaz, Wallace, Lerch, Evans, Prom, Kendler, Neale and Giedd2009; Schmitt et al., Reference Schmitt, Lenroot, Wallace, Ordaz, Taylor, Kabani, Greenstein, Lerch, Kendler, Neale and Giedd2008; Schmitt et al., Reference Schmitt, Wallace, Rosenthal, Molloy, Ordaz, Lenroot, Clasen, Blumenthal, Kendler, Neale and Giedd2007). Multivariate genetic modeling has revealed that the majority of variation in the volume of the cerebrum, cerebellum, thalamus, and basal ganglia is due to a single genetic factor (Schmitt et al., Reference Schmitt, Wallace, Rosenthal, Molloy, Ordaz, Lenroot, Clasen, Blumenthal, Kendler, Neale and Giedd2007); that the strong correlation between ICV and corpus callosum is entirely due to shared genetic effects (Pfefferbaum et al., Reference Pfefferbaum, Sullivan, Swan and Carmelli2000); that the genetic variance in the absolute change in corpus callosum height is entirely due to genes involved in the expansion of ventricles (Pfefferbaum et al., Reference Pfefferbaum, Sullivan and Carmelli2004); that strong genetic (r g = .68) and environmental (r e = .58) correlations explain the relationship between corpus callosum height and lateral ventricle size (Pfefferbaum et al., Reference Pfefferbaum, Sullivan, Swan and Carmelli2000); and that a single genetic factor accounts for 60% of the genetic variability in regional CT (Schmitt et al., Reference Schmitt, Lenroot, Wallace, Ordaz, Taylor, Kabani, Greenstein, Lerch, Kendler, Neale and Giedd2008). However, Rimol and colleagues (2010) found strong evidence of regionally specific patterns, rather than a single, global genetic factor, by mapping correlations between three selected seed points and all other points on the cortical surface. The primary visual (V1) seed point had strong genetic correlations with posterior sensory and motor areas, the anterior temporal seed point with anterior frontal regions, and the middle frontal seed point with inferior parietal regions. The patterns do not conform to traditionally defined brain structure boundaries, and are largely consistent with a division between primary and association cortex, as well as broadly defined patterns of brain gene expression, neuroanatomical connectivity, and brain maturation trajectories. No single explanation appears to be sufficient, suggesting the need for further investigation to identify genetic and environmental relationships between brain structures.
It should be mentioned that, because of the small number of independent samples, in this meta-analysis we combined samples regardless of age and gender. However, twin studies during childhood and adolescence have shown that genetic and environmental factors may contribute to the development of the cortex in a regional and age-specific manner; that is, the heritability of different brain areas changes over the course of development in a regionally specific fashion (Lenroot & Giedd, Reference Lenroot and Giedd2008; Lenroot et al., Reference Lenroot, Schmitt, Ordaz, Wallace, Neale, Lerch, Kendler, Evans and Giedd2009; Wallace et al., Reference Wallace, Schmitt, Lenroot, Viding, Ordaz, Rosenthal, Molloy, Clasen, Kendler, Neale and Giedd2006). Variance components analysis of cortical thickness revealed that primary and sensory cortex show greater heritability early in development, while in later-maturing areas that underlie complex cognitive processes — the dorsal prefrontal cortex and temporal lobes — heritability increases with maturation (Lenroot et al., Reference Lenroot, Schmitt, Ordaz, Wallace, Neale, Lerch, Kendler, Evans and Giedd2009). This phenomenon may be linked to the timing of gene expression and may be related to cognitive development and to the age of onset of various neuropsychiatric disorders. It could also have important educational and/or therapeutic implications. Studies by Peper, van Soelen and colleagues (Peper et al., Reference Peper, Schnack, Brouwer, Van Baal, Pjetri, Szekely, van Leeuwen, van den Berg, Collins, Evans, Boomsma, Kahn and Hulshoff Pol2009; van Soelen et al., 2011b) show that pubertal development may be directly involved in the decreases in GM areas that accompany the transition of our brains from childhood into adulthood. Whether other brain measures, such as global GM and WM volumes, show a reduction or an increase in heritability with increasing age is not quite clear yet, as findings are mixed (Gilmore et al., Reference Gilmore, Schmitt, Knickmeyer, Smith, Lin, Styner, Gerig and Neale2010; Wallace et al., Reference Wallace, Schmitt, Lenroot, Viding, Ordaz, Rosenthal, Molloy, Clasen, Kendler, Neale and Giedd2006). In studies of elderly twins, heritability estimates for TBV are similar to those described in studies of younger adult twins (Geschwind et al., Reference Geschwind, Miller, DeCarli and Carmelli2002; Pfefferbaum et al., Reference Pfefferbaum, Sullivan, Swan and Carmelli2000). Thus, both the specific brain region and the age of the population should be taken into account when using neuroimaging measures as an intermediate phenotype to link genes, environment, and behavior, as neuroimaging measures may be suitable at one developmental stage and not another (Lenroot & Giedd, 2008; Lenroot et al., Reference Lenroot, Schmitt, Ordaz, Wallace, Neale, Lerch, Kendler, Evans and Giedd2009).
Until recently, twin imaging samples were not large enough to estimate the relative influences of genes and environment on neuroimaging measures in males and females separately, so little is known about sex differences in heritability. Gender differences are known to exist for both brain structure and function (Lenroot & Giedd, Reference Lenroot and Giedd2010), and it is not inconceivable that these differences are not merely limited to mean effects. The relative importance of genes and environment may be different for males compared to females, and different sets of genes may be responsible for phenotypic differences. Chiang et al. (Reference Chiang, McMahon, de Zubicaray, Martin, Hickie, Toga, Wright and Thompson2011) were the first to investigate sex limitation for brain measures. Using DTI in 705 adolescent and young-adult twins and their siblings, and by fitting voxel-wise gene–environment interaction models, Chiang and colleagues determined that genetic influences on WM fiber integrity (indexed by FA) were greater in males than in females, greater in adolescence versus adulthood, greater in those with higher socioeconomic status, and in those with above-average FIQ compared to those with below-average FIQ.
A genetic correlation between brain structure and cognition has been reported repeatedly. Multivariate analyses have revealed moderate to high genetic correlations between WM fiber integrity, total brain, GM, WM, lobar, and lateral ventricular volumes and FIQ, performance IQ, verbal IQ, working memory, verbal memory, executive function, reading ability, and processing speed (Betjemann et al., Reference Betjemann, Johnson, Barnard, Boada, Filley, Filipek, Willcutt, DeFries and Pennington2010; Carmelli et al., Reference Carmelli, Reed and DeCarli2002a; Carmelli et al., Reference Carmelli, Swan, DeCarli and Reed2002b; Chiang et al., Reference Chiang, Barysheva, Shattuck, Lee, Madsen, Avedissian, Klunder, Toga, McMahon, de Zubicaray, Wright, Srivastava, Balov and Thompson2009; Hulshoff Pol et al., Reference Hulshoff Pol, Schnack, Posthuma, Mandl, Baaré, van Oel, van Haren, Collins, Evans, Amunts, Burgel, Zilles, de Geus, Boomsma and Kahn2006; Posthuma et al., Reference Posthuma, de Geus, Baaré, Hulshoff Pol, Kahn and Boomsma2002; van Leeuwen et al., Reference van Leeuwen, Peper, van den Berg, Brouwer, Hulshoff Pol, Kahn and Boomsma2009; Wallace et al., Reference Wallace, Lee, Prom-Wormley, Medland, Lenroot, Clasen, Schmitt, Neale and Giedd2010). Differential findings for verbal versus nonverbal skills suggest that distinct mechanisms contribute to the phenotypic relationships between brain volumes and these skills (Wallace et al., Reference Wallace, Lee, Prom-Wormley, Medland, Lenroot, Clasen, Schmitt, Neale and Giedd2010). In a longitudinal twin study, van Soelen et al. (Reference van Soelen, Brouwer, Schnack, Kahn, Hulshoff Pol and Boomsma2011b) demonstrated that cortical thinning on the brink of puberty (9–12 years) is accompanied by an increasing association with FIQ, which is driven by genetic factors. Although these findings point to a neural network that shares a common genetic origin with intelligence, suggesting that volumetric measures can serve as intermediate phenotypes for general cognitive ability, it is important to note that not all structures throughout the brain share that common genetic origin with cognition. Further studies are warranted to resolve the direction of causation between these two domains of measures.
The observation of a high degree of heritability of normal brain structure is reinforced by findings regarding the effects of genetic polymorphisms on brain structure. Several a priori selected candidate genes show reproducible effects on brain structure and task-related as well as resting-state brain activation (Thompson et al., Reference Thompson, Martin and Wright2010). These include genes that are involved in neurotransmission (e.g., genes coding for common variants in neurotransmitter receptors and transporters), brain morphogenesis, and neurodevelopment (de Geus et al., Reference de Geus, Goldberg, Boomsma and Posthuma2008). With the improvement of high-density genotyping techniques, the candidate gene approach is now being partially replaced by genome-wide association (GWA) analyses that have the potential to identify novel polymorphisms that might be associated with variability in normal brain structure and function. Furthermore, as genetic sequencing becomes less expensive, the relative contribution of rare versus common variants to imaging phenotypes and GWA scanning signals is likely to be better understood (Choi et al., Reference Choi, Scholl, Ji, Liu, Tikhonova, Zumbo, Nayir, Bakkaloglu, Ozen, Sanjad, Nelson-Williams, Farhi, Mane and Lifton2009; Dickson et al., Reference Dickson, Wang, Krantz, Hakonarson and Goldstein2010). Thompson et al. (Reference Thompson, Martin and Wright2010) recently reviewed the status of imaging genomics. In an attempt to address one of the major issues in imaging genomics (McCarthy et al., Reference McCarthy, Abecasis, Cardon, Goldstein, Little, Ioannidis and Hirschhorn2008), namely the large samples needed to discover genetic polymorphisms and replicate hits associated with individual variance in brain structure and function, several imaging genomics groups are now working collaboratively as part of the ENIGMA Consortium (Enhancing Neuroimaging Genetics through Meta-Analysis; http://enigma.loni.ucla.edu). Encouragingly, meta-analysis of the GWA data from 16 studies (>6,400 subjects), with association conducted at ~1.3 million autosomal SNPs, yielded significant hits for both hippocampal volume and TBV (ENIGMA Consortium, 2011). This collaboration has great potential for many new discoveries, providing valuable information about the physiological mechanisms underlying brain and behavior, and about factors that affect the expression of neurological and psychiatric illnesses.
Although imaging genetics is slowly transforming into imaging genomics, given the expense and resource-intensive nature of the latter, twin modeling should still be the first step to determine whether it is worthwhile to perform gene-finding analyses on a given imaging phenotype, and is also the best option to assess whether there are genetic correlations between phenotypes. To the best of our knowledge, no twin studies have been carried out that directly combine data on brain structure and brain function to see if these are genetically correlated phenotypes. In a large Mexican-American pedigree study, Glahn et al. (Reference Glahn, Winkler, Kochunov, Almasy, Duggirala, Carless, Curran, Olvera, Laird, Smith, Beckmann, Fox and Blangero2010) found that the genetic factors that influence DMN functional connectivity and GM density seem to be distinct, suggesting that unique genes influence the structure and function of the DMN. This is consistent with our repeated finding that task-related brain activation does not correlate strongly with GM volume (Blokland et al., Reference Blokland, McMahon, Hoffman, Zhu, Meredith, Martin, Thompson, Zubicaray and Wright2008; Blokland et al., Reference Blokland, McMahon, Thompson, Martin, Zubicaray and Wright2011). It is not unlikely that different physiological mechanisms with distinct genetic etiologies are involved in brain structure and function.
It is apparent that there is still relatively little certainty about the heritability of brain function as measured with task-based and resting-state fMRI. Therefore, this will be a focus for future twin research. Findings of heritability for individual differences in fMRI measures converge with similar results from twin studies of the electroencephalogram, particularly of event-related potentials that are reported to be up to 60% heritable (van Beijsterveldt & van Baal, Reference van Beijsterveldt and van Baal2002). Heritability findings for fMRI measures suggest that it is likely that genetic influences may vary with task paradigm, brain region, and how brain activation/deactivation is quantified; they demonstrate the importance of determining an appropriate measure of brain activation. One must also consider the possibility that heritability of brain activation may reflect genetic commonalities in vascular or blood-flow responses generated by nonspecific demand or effort not related directly to the cognitive process being manipulated (Duncan & Owen, Reference Duncan and Owen2000). Replicability across samples and paradigms will likewise need to be addressed.
From voxel-based studies, both structural and functional, it is apparent that genetic and environmental effects cross anatomical boundaries (Blokland et al., Reference Blokland, McMahon, Thompson, Martin, Zubicaray and Wright2011; Joshi et al., Reference Joshi, Leporé, Joshi, Lee, Barysheva, Stein, McMahon, Johnson, Zubicaray, Martin, Wright, Toga and Thompson2011; Lenroot et al., Reference Lenroot, Schmitt, Ordaz, Wallace, Neale, Lerch, Kendler, Evans and Giedd2009; van Soelen et al., Reference van Soelen, Brouwer, van Baal, Schnack, Peper, Collins, Evans, Kahn, Boomsma and Hulshoff Pol2012; Yoon et al., Reference Yoon, Fahim, Perusse and Evans2010), such that voxel-based approaches may have preference over ROI approaches in imaging genetic studies. Although a common genetic factor appears to influence much of the brain (Schmitt et al., Reference Schmitt, Lenroot, Ordaz, Wallace, Lerch, Evans, Prom, Kendler, Neale and Giedd2009), there are considerable regional differences across the brain (Chen et al., Reference Chen, Panizzon, Eyler, Jernigan, Thompson, Fennema-Notestine, Jak, Neale, Franz, Hamza, Lyons, Grant, Fischl, Seidman, Tsuang, Kremen and Dale2011; Rimol et al., Reference Rimol, Panizzon, Fennema-Notestine, Eyler, Fischl, Franz, Hagler, Lyons, Neale, Pacheco, Perry, Schmitt, Grant, Seidman, Thermenos, Tsuang, Eisen, Kremen and Dale2010). Voxel-wise approaches seem most adept at finding those differences as well.
In conclusion, this meta-analysis demonstrates that results for many imaging measures require further replication across independent samples and demographic groups, especially for such measures as (voxel-based) CT and surface area, FA, and BOLD signal. As twin imaging cohorts are growing in size, they will be gaining the statistical power to do so, with great potential for important discoveries about the underlying mechanisms involved in brain functioning, behavior, and brain disorders.
Acknowledgments
G.A.M.B. is supported by an ANZ Trustees PhD Scholarship in Medical Research, Queensland, Australia. G.I.Z. is supported by an ARC Future Fellowship.


