

Introduction
A fundamental aspect of economic development—here taken to mean improvement in the material conditions of life in a society—is an expansion in the quantity and variety of exchanged goods. For this to occur, goods must move from their place of production into the hands of those who use and consume them. This movement entails costs in time and energy, and these costs necessarily increase with distance. Hence, transport costs represent a fundamental constraint on the distribution of goods, and this in turn places limits on the potential division and specialization of labour in an economy (Arrow, Reference Arrow, Buchanan and Yoon1994; Kelly, Reference Kelly1997). It follows that an important aspect of economic development is improvements in organization, technology, and infrastructure that reduce the rate at which transport costs accumulate with distance.
Today, moving goods from production sites to consumers is relatively inexpensive. In one study, Glaeser and Kohlhase (Reference Glaeser and Kohlhase2003) estimated that transport costs for goods in the USA declined by about ninety per cent over the course of the twentieth century. As a result, today goods are far cheaper and easier to move around than people. An important determinant of the cost of transporting a physical item is the array of technologies available for its transport, as this affects the speed and safety with which goods can be moved from one location to another. Innovations in such technologies have been associated with major economic advances in the past: for example, the development of steam-powered engines and railways were essential for the industrial revolution (Wrigley, Reference Wrigley2016), and advances in wind-powered sailing ships were central to the emergence of a Mediterranean-wide economy during the Bronze and Iron Ages (Smil, Reference Smil2017; Manning, Reference Manning2018). Transport technology is, however, only one component of transport costs; physical infrastructure (roads, bridges, locks, quays) and social infrastructure (tariffs, social and administrative boundaries, social safety, etc.) also play a role. The link between transport and economic development emerges in preindustrial economies because transport costs could constitute a significant part of the total cost (and effort) involved in getting goods to those who wanted or needed them.
A clear demonstration of the impact of transport for the cost of goods is Peter Temin's (Reference Temin2013: 29–52) analysis of wheat prices in the Early Roman empire: it reveals that the price of wheat in various locations was set by the price of wheat in Rome, the zone of highest demand, minus the cost of transporting wheat produced in that location to Rome. He identified a strong relationship between distance and price which suggested a doubling of the price for every thousand kilometres of transport by sea during the first century ad (Temin, Reference Temin2013: tab. 2.3). Temin's work also provides evidence that geographically extended markets which connected producers with consumers could emerge even in non-industrial and non-capitalist economies.
Temin's analysis illustrates that it is possible to estimate transport costs in past societies by considering relationships between price and distance from the zone of highest demand. Unfortunately, price data from ancient societies are generally too scarce to estimate changes in transport costs over time or across economies and regions. In Roman Britain, for example, there are only a handful of letters from just two sites providing information on the costs of transport: the Bloomberg site in London and the fort at Vindolanda in Northumberland (Bowman & Thomas, Reference Bowman and Thomas1983, Reference Bowman and Thomas1994, Reference Bowman and Thomas2003; Tomlin, Reference Tomlin2016). Here, we suggest an alternative approach that focuses on spatial patterns in the consumption of different kinds of everyday goods, the prices of which can be assumed to have varied with the cost of moving them to consumers. We illustrate the approach through the changing distributions of pottery from specific production centres across Britannia during the Roman period.
In Romano-British archaeology, there is a long tradition of distinguishing and quantifying pottery fabrics macroscopically and associating these with specific production locations marked by kilns and other production debris (Swan, Reference Swan1984). In an early analysis of such data, Fulford and Hodder (Reference Fulford and Hodder1975) found that the portion of Late Roman pottery consumption defined by products of the Oxfordshire industry followed a pattern of exponential decay with distance from its production location. Importantly, they suggested that the rate of decay was shallower for sites for which water transport was important than for sites where land-based transport was required and interpreted these differences as a reflection of the relative costs of water-based vs land-based transport. Here we follow a similar approach, examining changes in the rate of decay in pottery consumption with distance across many industries and irrespective of the modes of transport used for specific goods and paths, to quantify changes in average transport costs over time. First, we discuss improvements in transport technologies in Britain during the Roman period which suggest that transport costs did indeed fall. Second, we draw on basic concepts from economic geography and demography to argue that, irrespective of other social factors that influenced consumption in specific locations, the consistent role of transport costs should lead to a series of patterns, including exponential decay in the probability of consumption of pottery with distance from its source. Third, we present the dataset we compiled for this study and the empirical patterns it reveals. Finally, we consider the implications of declining transport costs for the economic development in Roman Britain by examining changes in the composition of pottery assemblages over time.
Transport and Economic Development in Roman Britain
Long-distance travel existed in Britain well before the Roman conquest of ad 43. Log- and plank-built boats are known from the mid-second millennium bc (Wright, Reference Wright1990; Jones, Reference Jones2012: 33–37), and similarities in material across the English Channel from the later part of the second millennium demonstrate a regular seaborne traffic (Lehoërff & Talon, Reference Lehoërff and Talon2017). From the late second/early first century bc onwards, seaborne trade from Gaul brought Roman goods, including Italian amphorae and Armorican ceramics, to southern Britain, with trade between south-eastern Britain and Gaul intensifying from the mid first century bc (Webley, Reference Webley, Anderson-Whymark, Garrow and Sturt2015). Within Britain, wheeled vehicles and fittings are attested from the earlier part of the first millennium onward (e.g. a wheel at Flag Fen, 1300–900 bc; Pryor, Reference Pryor2001). There are also several long-distance routeways, such as the Wiltshire–Oxfordshire Ridgeway, which are also generally thought to date to prehistoric times (Miles et al., Reference Miles, Palmer, Lock, Gosden and Cromarty2003).
Within decades of the Roman conquest continental pottery imports, including samian ware from Gaul and amphorae to transport olive oil from Baetica, reached locations throughout Britain, which implies that Britain had a province-wide transport system in place from the second half of the first century ad. Nevertheless, several aspects of transport technology clearly improved during the Roman era. These include: a) increased use of wheeled carts and wagons pulled by draft animals; b) an increase in the size of draft animals; c) a province-wide system of well-engineered roads and bridges; d) the construction of harbours and quays along inland waterways; and e) the excavation of canals, particularly in the East Anglian fens. The initial purposes of the road system involved facilitating flows of people, material, and information between military sites (Haynes, Reference Haynes and Erdkamp2002). These military installations were placed in strategic locations for the administration of the new province, and so probably balanced geographic factors such as topography, navigable rivers, and natural resources with social and demographic aspects including the distribution of populations and ethnic groups. Roads and bridges were also engineered specifically for the movement of soldiers on foot and supplies by horse-drawn carts, given that horses were used for transport to a much greater extent during the Roman period than had been the case during the Late Iron Age (Mattingly, Reference Mattingly2006: 256–90). The importance of these roads is reflected in their relationship with population centres. The earliest roads linked the primary towns, which mostly grew at locations of earlier Late Iron Age oppida and subsequent Roman military activity, while in subsequent centuries many of the so-called small towns developed along major roads or at crossroads, indicating that the population was becoming more orientated to the movement of people and goods.
Coincident with this expansion in transport, several lines of evidence—such as the increased use of stone masonry, the greater frequency of mosaics and hypocaust heating systems, increasing rates of coin loss, larger numbers of metal artefacts, growing evidence of industrial specialization, and evidence of increased agricultural labour and productivity—lead us to conclude that material living standards increased for at least some people during the Roman period (Casey, Reference Casey1986; Ward-Perkins, Reference Ward-Perkins2006; Lodwick, Reference Lodwick, Allen, Lodwick, Brindle, Fulford and Smith2017; Jongman et al., Reference Jongman, Jacobs and Klein Goldewijk2019). Taken together, these data suggest that the economy of Roman Britain experienced substantial per capita growth, not just increases in gross output, and that reductions in transport costs played a role in this process. Here, we attempt to measure these reductions by considering the spatial distribution of pottery produced in specific locations at different times.
Materials and Methods
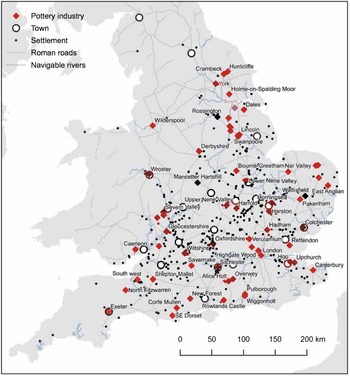
For this study, we compiled a large database of quantified pottery assemblages, working from existing summary data in reports available through the Archaeology Data Service, online journals, and libraries. Details of how we collected the data can be found in the online Supplementary Materials. The database contains quantified pottery fabric information for 775 excavations in 652 distinct settlements. We listed the pottery fabric quantities according to the classification used in each report, and then translated these data into a single pottery fabric series (see the Supplementary Materials for details). We then consulted Swan (Reference Swan1984), Tomber and Dore (Reference Tomber and Dore1998), and Tyers (Reference Tyers2003), and the Study Group for Roman Pottery (2022) website to identify forty-nine industries whose production sites are well located. We used these coordinates to calculate the straight-line distance from each production centre to each excavated site (road distances proved to be unreliable, for reasons discussed in the Supplementary Materials). Table 1 summarizes the frequency of settlements and samples in the dataset, by settlement size and region, and Figure 1 shows the spatial distribution of settlements and sourced industries in our database. To examine changes in the distribution of industries over time, we apportioned excavated assemblages into three chronological periods based on the production spans of each industry and on uniform probability density analysis (see the Supplementary Materials): Early Roman (c. ad 50–150), Middle Roman (ad 150–250 ad), and Late Roman (ad 250–400). We use these assemblages to assess relationships between relative abundance and distance to the source for each of the forty-nine industries in each period.
Summary of settlements included in the dataset, by settlement type and region.

Notes:
1) The database includes assemblages from the legionary fortresses at Colchester, Exeter, and Wroxeter.
2) There is an early and a late assemblage from Colchester and Exeter.
Distribution of settlements (n = 652) and sourced industries (n = 49) in the dataset. Industry names are labelled and known Roman roads and potentially navigable rivers are shown.

We wish to emphasize that, although this study examines pottery assemblages recovered from specific locations, our goal is not to explain spatial patterns in pottery consumption, either across Britannia or in specific localities. Several recent studies have shown that a wide range of statistical, social, cultural, geographic, and economic factors must be considered to account for patterns in pottery consumption at various scales (Allen & Fulford, Reference Allen and Fulford1996; Pitts & Perring, Reference Pitts and Perring2006; Rippon, Reference Rippon2018; Rippon & Holbrook, Reference Rippon and Holbrook2021). Instead, we use similar information to quantify changes in a single contributing factor—the cost of moving pottery from producers to consumers—over time. In other words, we are not seeking to explain the archaeological record in detail but aim to use this record to estimate changes in one specific socioeconomic rate over time. Several lines of evidence suggest these costs did indeed decline, and here we attempt to put some numbers to these observations. A wide range of factors contributed to pottery distributions in space and time. We examine one of these factors and its potential effects to highlight the determinants of economic development more generally.
Measuring Transport and their Costs Consequences
Consumption, prices, and distance-decay
The interpretation of pottery distributions, and especially ‘fall-off’ curves with distance from the source, has a long history in Romano-British archaeology (Hodder, Reference Hodder1974; Fulford & Hodder, Reference Fulford and Hodder1975; Hodder & Orton, Reference Hodder and Orton1976: 98–153). Early studies suggested that fall-off curves could be interpreted in terms of strictly economic processes. More recently, researchers have viewed exponential decay as the expectation of a purely ‘rational’ process, with deviations from the expected pattern reflecting the social embeddedness of economic relations (Allen & Fulford, Reference Allen and Fulford1996; Allen et al., Reference Allen, Lodwick, Allen, Lodwick, Brindle, Fulford and Smith2017; Rippon, Reference Rippon2018; Rippon & Holbrook, Reference Rippon and Holbrook2021). We build from this approach; while many social, cultural, geographic, political, and economic factors are responsible for consumption patterns in specific locations, the primary factor behind exponential decay with distance in the proportional consumption of pottery from specific industries is accumulating transport costs.
Human behaviour generally involves dedicating time and effort to different activities which generate outcomes (Pryor, Reference Pryor2005). Producing and distributing goods of any type would have required time and resources and would have closed off opportunities for the individuals involved to carry out other desirable activities. Therefore, production and distribution had ‘costs’ in a broad sense, regardless of whether these costs were monetized. Likewise, consumers have limited resources to exchange for goods they want and need, leading to decisions regarding the allocation of these limited resources. Finally, given that producing and distributing goods involves some ‘cost’, producers and distributors will only give a good to someone else in exchange for something of perceived equivalent value, even if this ‘price’ is not monetized or involves delayed reciprocity. Various factors influence human behaviour in specific contexts, but when integrated across a great number of people at large spatial and temporal scales, human behaviour tends to strike a balance between costs and benefits, in aggregate, on average, and over time. Note that in our study there is no presumption of a centralized market or price system across Britannia, nor is there any assumption that the motivation for selling pottery was profit. The considerations above do not define a capitalist economy—they merely define a system where producers, distributors, and consumers seek to balance costs and benefits, which could have been accounted for formally or informally, in the moment or over a period of time.
Here, we develop formal models rooted in this aggregate balancing of costs and benefits to derive expected average relationships between transport costs, distance, and pottery consumption. We then combine this model with data for pottery consumption and distance to estimate changes in transport costs over time. We begin by considering the implications of distance-decay relationships for the character of transport costs. Mathematically, a quantity is subject to exponential decay if it decreases at a consistent proportional rate per increment (of time or distance). For artefact distributions, exponential decay represents a process in which the probability of consumption decreases as the distance from the production location increases. An exponential decay function that captures this process can be written as:
 $$P_x = P_0e^{-\mu x}, \;$$
where x is the distance from the source, P x is the probability of consumption at that distance, P 0 is the probability of consumption at the source, and μ is the rate of decay in the probability of consumption per unit distance. Equation (1) describes the process of reducing an amount by a constant percentage per unit distance, as the distance increases. Exponential decay is different from linear decay in that the decay factor is a fraction of the remaining amount, which means the actual amount the original amount is reduced by decreases with each additional increment of distance; in linear decay, by contrast, the original number is decreased by the same amount with each additional increment of distance.
Equation (1) can be transformed into a linear function by taking the logarithm of both sides, yielding:
 $$\ln P_x = \ln P_0-\mu x, \;$$
and this can be rearranged to solve for the decay rate:
 $$\displaystyle{{\ln P_x-\ln P_0} \over x} = {-}\mu \to \displaystyle{{\Delta \ln P} \over {\Delta x}} = {-}\mu .$$
The left side of Equation (3) represents the slope of the fit line relating the log-proportion of the artefact category to distance from the source, and the right side of the equation indicates that this quantity is equal to the rate of decay in the proportion with distance. Notice also that Equation (2) is a linear function that relates the log-proportion of a particular good to the distance from the source x, via the factor μ representing the decay rate. Therefore, when the spatial distribution of an artefact type exhibits exponential decay, this will be reflected in a linear relationship between the log-proportion and the distance. It will also imply that consumption of the artefact type decreases by a consistent fraction with each additional increment of distance, with the slope of the fit line to the data reflecting this fraction.
Why should the probability of consumption of a specific variety of pottery exhibit exponential decay with distance from the production source? Our chain of reasoning is as follows: 1) consumption of a given variety of manufactured good is proportional to the price (whether mediated through money, barter, or reciprocal exchange) of that variety in the local market relative to other varieties; 2) the increase in the price of a good with distance from its source is proportional to the total transport cost; 3) transport costs accumulate in a linear fashion with distance; and 4) linear transport costs lead to a consistent fractional decline in the probability that a good will ‘survive’ to be consumed over the next increment of distance (Lee & Wang, Reference Lee and Wang2003). When transport costs increase proportionally with distance, the fraction of consumption represented by pottery from a given source will be highest at its production location, and with each additional increment of distance the likelihood of ‘survival’ to be consumed at an even greater distance (the remaining fraction) will be reduced by the unit distance cost of transport of a pottery vessel. This cost per unit distance is represented by μ in Equation (1). Thus, the slope of the relationship between the log-proportion and distance can be interpreted directly as the cost of transport per unit distance, as specified in Equation (3). Note that μ is agnostic regarding the determinants of transport costs, which could lie in transport technology (horses, wheeled vehicles, watercraft), physical infrastructure (roads, bridges, ferries, locks, quays), or even social infrastructure (tariffs, social hostility, protection from bandits, etc.). For additional discussion of these arguments, see the Supplementary Materials.
Transport, specialization, diversity, and consumption
We also consider how changes in transport costs might be expected to affect overall patterns of pottery production and consumption. As the frictional effect of distance declines, the total cost of pottery at a given distance from the production location will also decline. As a result, the area over which a product can be effectively distributed will expand, and this will expand the potential market for the product. This will in turn stimulate an expansion in the scale and specialization of production (Arrow, Reference Arrow, Buchanan and Yoon1994; Kelly, Reference Kelly1997; Smith, Reference Smith2007). Overall, reductions in transport costs will result in an increase in specialized production, or a decrease in the diversity of production, as production focuses on fewer, more intensively produced and generally higher-quality varieties. In addition, lower transport costs would have had consequences not just for individual industries but would also have allowed competing industries to have easier access to local markets. Even sites where pottery was being produced would have been increasingly open to wares produced elsewhere. Read in terms of Equation 2, the implication is that at production sites (where the distance x = 0), the proportion of locally produced wares should decrease as transport costs decrease and wares produced by competitors became increasingly available.
The distribution of people in space also exerts an influence on production and consumption patterns. Populations that are more concentrated in space will interact more frequently with more people of different kinds, and this will increase the connectivity of, and information available to, an individual (Ortman & Lobo, Reference Ortman and Lobo2020). Thus, at any given time, individuals who live in more populous settlements will integrate more information about choices available to them in their daily activities, including their consumption activities, than individuals who live in less populous settlements (Hanson & Ortman, Reference Hanson and Ortman2020). Individuals in an agglomerated population can also become more productive as a result of learning and sharing skills (Ortman & Lobo, Reference Ortman and Lobo2020). This increase in individual-level productivity can in turn support increases in consumption. Transport costs and population thus have seemingly opposed effects on patterns of pottery consumption, with increasing population supporting greater diversity in consumption, and declining transport costs leading to greater specialization in production. These two effects are connected via the increase in demand for all goods that a reduction in ‘price’ (in turn the result of decreased transport costs) creates.
In the Supplementary Materials, we employ the analytical framework known as Settlement Scaling theory (Lobo et al., Reference Lobo, Bettencourt, Ortman and Smith2020) to show that the amount of information embedded in a pottery assemblage, captured by the Shannon Index 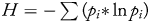 $H = {-}\sum ( {p_i\ast \ln p_i} ) $, can be expected to grow with the number of interacting people represented by that assemblage according to:
 $$H( {N_t} ) = \delta [ {\ln N_t} ] + H_{0_t}, \;$$
where  $H_{0_t}$ represents the baseline information available to an individual at time t, H(N t) represents the amount of information embedded in a pottery assemblage derived from consumption by N persons, at time t, and δ ≅ 1/6 represents the growth rate of information as the interacting population grows. Equation (4) can be tested directly by fitting a linear function to the logarithm of a population proxy and the Shannon Diversity Index of the associated pottery assemblage for data from a variety of settlements dating to different times. As population increases, one would expect H(N t) to increase due to an increase in the information that is integrated by consumers in consumption choices; and as transport costs decline one would expect $H_{0_t}$ to decline due to increasing specialization in production.
Finally, we note that, due to the many positive effects of declining transport costs, one would expect such reductions to increase the carrying capacity of a region by stimulating more widespread flows of goods; an increase in the number of people who can live close together by increasing the effective catchment from which individuals can obtain products necessary to them; and an increase in household inventories and use-rates of pottery through overall economic growth. These changes should be apparent in increases in pottery consumption rates per unit time and unit area.
Expectations
The observations made above lead to the following expectations regarding patterns in pottery assemblages from Romano-British settlements:
1. The slope μ of the linear fit of the log-proportion of pottery consumed at a specific site to the distance from its production location reflects the decay rate of this proportion with distance from the source. One would expect this decay rate to become less negative (closer to zero) with improvements in transport technology over time.
2. The intercept, ln P 0, of the linear fit of the log-proportion of pottery vs distance from its source, which represents the proportional consumption of pottery at production locations, provides a measure of the access of individuals at a source to products of industries from other sources. Since one would expect opportunities for greater variety in consumption to develop with decreasing transport costs, one would expect the value of this intercept to decrease as transport costs decrease.
3. Assuming our sample of pottery assemblages is roughly representative (we selected excavations irrespective of location, date, or settlement type, focusing solely on the presence of quantified assemblages containing more than 500 sherds or 4 kg of pottery), the total amount of pottery from an industry found across all assemblages assigned to a period and industry should reflect the relative amount of production of that industry in each period. If transport costs did decrease over time, one would expect the average level of production of an industry to increase, the variation in production levels across industries to decrease, and production levels of the largest industries to increase, as producers took advantage of expanded markets.
4. Pottery recovered from an excavation reflects consumption activities by a certain number of people over a given period. Since the process of assigning pottery to a specific industry and period controls for variation in the duration of an assemblage, variation in assemblage size should be proportional to the number of people whose activities contributed to the assemblage. The Shannon Diversity Index calculated from an assemblage reflects the average information integrated by one of these individuals in their consumption choices over that same period. As transport costs decrease, diversity in production will also decrease; but diversity in consumption will also be consistently higher in larger local markets. As a result, the y-intercept of the linear fit of the Shannon Diversity Index vs the logarithm of apportioned assemblage size (a proxy for relative population) should decrease over time, but the slope should remain a constant δ ≅ 1/6 across periods, regardless of changes in transport (see the Supplementary Materials).
5. Finally, decreases in transport costs should lead to increases in pottery densities, measured as grams of pottery per year per m2 of excavation. This may be due to increases in consumption rates of pottery, increases in the size and density of settlements, or both.
Results
We apportioned the pottery assemblage from each settlement into three periods, with amphorae excluded, to estimate the fraction of pottery of each fabric that was consumed at each site during each of these periods. We then plotted the log-proportion of each fabric against the straight-line distance in kilometres to the corresponding production location. We restricted the analysis to industries no more than 200 km away from a given site because more than ninety-five per cent of the measured distances were less than 200 km, and visual inspection of the data showed that beyond this distance the fabric proportions become unstable, presumably due to the difficulty of accurately estimating extremely low proportions. In the Supplementary Materials, Figure S1 shows scatterplots and linear fits of these relationships for each tracked industry through time, and Table S2 presents ordinary least squares regression results for each industry and period, with standard errors estimated using the White correction for heteroskedasticity (meaning that the standard deviations of the proportion is non-constant over distance). In these regressions, the fraction of variation in log-proportions that is accounted for by distance, reflected in the R2 values, is often low. This is not unexpected because the dependent value is a proportion, not a level, and proportions are sensitive to sampling error in the data. Moreover, there are many social, economic, and geographical factors that one would expect to influence the observed consumption patterns in specific settlements. This analysis does not seek to account for as much of the variation in pottery assemblages as possible; rather, it seeks to identify the contribution of a single factor, distance, to the observed variation. What is most important for our purposes is the average relationship between log-proportion and distance, and from this perspective most industries exhibit the expected exponential decay pattern.
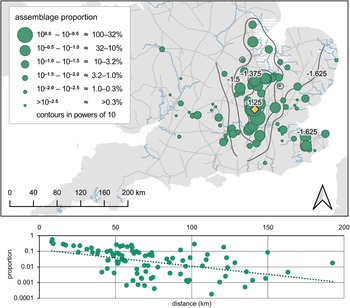
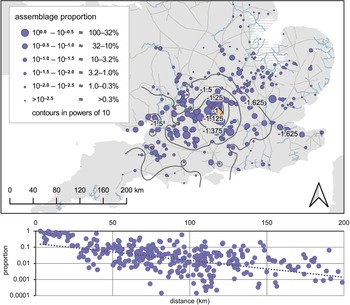
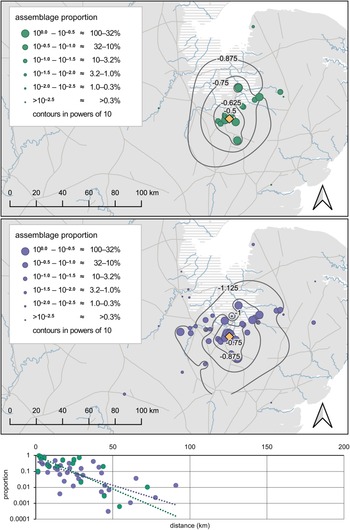
A limitation of the data, immediately apparent in Figure S1 in the Supplementary Materials, is that there are several industries and periods for which the relevant pottery has only been identified at a few sites, and this leads to significant sampling error and uncertainty in individual fits. To compensate for this issue, we include all log-proportions and distances, across all industries, in a single analysis. This has the effect of weighting the influence of each source according to the number of settlements where pottery from each source occurs. This analysis is presented in Figure 2. There, we grouped the data by 10 km increments and calculated the mean log-proportion for each ‘bin’ to better illustrate overall trends in the data. The ordinary least squares regression results, again using the White correction for heteroskedasticity, are also presented in Table 2, and shown in Figure 3. These results reinforce the conclusion that the rate of exponential decay in consumption of pottery with distance from kiln sites did decrease by a factor of nearly two between the Early Roman and Late Roman periods, with a more substantial change between the Early and Middle periods than between the Middle and Late periods. The difference between the Early Roman and Late Roman slope is statistically significant, indicating that, despite the noisy data, pottery did become more widely distributed, on average, from production locations over time. Figure 4 illustrates this pattern, using the distributions of three selected industries during the Early vs Late Roman periods: one industry was distributed primarily by road (Verulamium), one by river (Horningsea), and one by mixed means (Oxfordshire). These findings are all consistent with a reduction in transport costs. In the Supplementary Materials we examine a number of additional factors, including site size class, region, vessel type, and ethnic marking, which could possibly affect distance-decay relationships, finding in all cases that these additional factors are not responsible for our results.
Relationship between relative consumption and distance across all industries, by period. Data are in 10 km ‘bins’ and the large circles represent the mean value of each ‘bin’. ERP = Early Roman period (ad 50–150); MRP = Middle Roman period (ad 150–250); LRP = Late Roman period (ad 250–400). The slope of the relationship becomes less negative over time, by a factor of about two.

Slopes (A) and intercepts (B) of exponential decay curves over time based on assemblages assigned to period. Intercepts have been converted back to proportions of assemblages following the analysis. Error bars represent standard errors of the estimate using the White correction for heteroskedasticity, and numbers associated with the intercepts are the number of observations (industry proportions and associated distances) for each period. The increasing (less negative) slope (Beta) reflects a decreasing friction of distance in consumption choices, and the decreasing intercept reflects less localized consumption choices overall.

a) Distribution of the Early Roman pottery industry from Verulamium; it is likely that the bulk was transported overland by road.

b) Distribution of the Late Roman Oxfordshire pottery industry: it is likely that much was transported by road, with some transported along the rivers Thames and Severn, and some by sea down the Bristol Channel.

c) Distribution of the Early (Green) and Late (Purple) Horningsea pottery industry, most of which was likely transported along the tributaries of the rivers Cam and (later) Great Ouse.

Summary of results.

Notes:
a) Standard errors for these analyses were calculated using the White correction for heteroskedasticity.
b) These differences are statistically significant (one-sided t = -5.682, df = 805.06, p-value = 9.301e-09).
c) These differences are statistically significant (one-sided t = 1.9014, df = 274.98, p-value = 0.02915).
d) These differences are not significant (two-sided t = -0.9672, df = 254.43, p-value = 0.3343).
Figure 5A illustrates the total weight of pottery from each known source in our assemblages using box-and-dot plots. Several patterns are evident. First, the average weight of pottery from a given industry increased over time, suggesting increases in overall production levels. Second, variation in total weights across industries decreased substantially, as is shown by the narrowing mid-spreads of the boxplots, suggesting reduced variation in production levels across industries. Third, the total weight of the most popular industries increased across periods. Because the process of assigning pottery to a specific industry and period controls for time, this pattern suggests an increase in the spatial and demographic extent of markets over time. All three patterns reflect changes that would be expected to follow from decreases in transport costs.
Changes in pottery production and consumption over time. A) Box-and-dot plots of the total weight of pottery assigned to each sourced industry in assemblages. Over time, the median production level of an industry increases, the variance in production levels across industries declines, and the production level of the largest industries increases. B) Histograms of assigned pottery densities (g/m2/year) across all sites in the database. This suggests an increasing number of inhabited sites and increasing rates of pottery deposition at these sites, consistent with increasing population and population density.

Figure 5B expands on this analysis by presenting histograms of pottery densities (g/m2/year) at sites inhabited during each period, based on their assigned assemblages and excavated areas. The chart shows that pottery accumulated more rapidly over time, due to increased consumption per capita, increasing residential densities, or both. This finding casts new light on studies which have shown that the number of inhabited rural sites peaked in the second century ad, followed by a long and gradual decline (Allen et al., Reference Allen, Lodwick, Brindle, Fulford and Smith2017: 416–20). If there was no change in the size and density of rural sites, this pattern would imply rural population decline. But increasing momentary pottery densities across sites suggest some combination of growth and agglomeration may have compensated for declining site numbers. This is consistent with bio-archaeological studies which suggest migration into towns and relative health and wealth in towns (Pitts & Griffin, Reference Pitts and Griffin2012; Eckardt et al., Reference Eckardt, Müldner and Lewis2014; Redfern, Reference Redfern, Betsinger and DeWitte2020), and with studies of botanical and faunal remains which suggest increases in farm productivity (Allen & Lodwick, Reference Lodwick, Allen, Lodwick, Brindle, Fulford and Smith2017). These findings suggest overall economic development, which would have resulted in fewer farmers being required to feed the population, and in an increasing concentration of wealth in larger and denser settlements (see Pitts, Reference Pitts, Millett, Revell and Moore2016). The results in Figure 5B are consistent with such a scenario, in that they suggest that improvements in transport were correlated with more prosperous and more densely populated settlements overall.
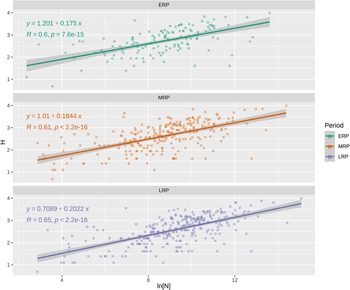
Finally, Figure 6 presents the relationship between assemblage size and information, by period. Because the process of assigning pottery to a specific industry and period controls for time, the weight of pottery from a site attributed to a given period is a proxy for the number of consumers who contributed to the pottery assemblage during that period. The Shannon Diversity Index is also calculated from the assemblage. Figure 6 shows the data for each settlement along with the ordinary least squares fit to these data for each period. The results are also presented in Table 2. The fits are once again consistent with expectations. First, the slope of the fit line of the Shannon Diversity Index to the log of assemblage size (population) is not statistically distinguishable across periods and has a value of δ ≅ 1/6, as predicted by Settlement Scaling theory (see Bettencourt, Reference Bettencourt2014). This pattern illustrates a consistent effect of scale in the range of choices available to consumers through their social contacts. Second, the y-intercept of this same relationship declines over time, indicating decreasing diversity (increasing specialization) in pottery production. The observed difference in the intercept for the Early Roman and Late Roman periods is also statistically significant. Both patterns are consistent with expectations of a consistent relationship between population, connectivity, and diversity based on models drawn from Settlement Scaling theory. They are also in line with an expected decrease in the baseline level of diversity of available products with declining transport costs due to a corresponding increase in the baseline level of specialization in pottery production.
Relationship between population (pottery consumption per year) and diversity (Shannon Index) through time based on assigned pottery assemblages. The consistency in slope over time reflects consistent effects of scale for the connectivity and amount of information integrated by a consumer in consumption decisions, and the declining intercept reflects increasing specialization (and thus decreasing diversity) in production due to declining transport costs.

Discussion and Conclusion
This study builds on the premise that a reduction in the cost of transport for manufactured goods is an important element of economic development. Previous research suggests that transport costs decreased and average material living standards increased over the course of the Roman period in Britain. We examined whether it is possible to measure relative changes in transport costs by considering changing distance-decay relationships of pottery over time. We developed a series of expectations for how reductions in transport costs would affect pottery assemblages and spatial distributions, and compiled an extensive database of pottery assemblage information from over 700 excavations across Britannia. The analysis revealed a series of related changes in pottery production, distribution, and consumption, namely: 1) a decline in the decay rate of consumption with distance from the source; 2) an increase in the availability at production sites of pottery from other industries; 3) an increase in the average output of pottery industries; 4) a reduction in variation in production levels across industries; 5) an increase in the output of the most popular industries and in overall pottery consumption rates; 6) a consistent effect of agglomeration for the range of choices available to consumers; and 7) an increase in the baseline level of specialization in pottery production.
The estimated relationships between pottery consumption and distance only account for a fraction of the total variance in our data (i.e. r2 values in Table 2 are between .13 and .28). This indicates that distance accounts for only a fraction of the total variance in pottery assemblages. Several factors, from sampling, classification, and measurement error to social and cultural factors also influenced local production and consumption choices; monetization, Romanisation, local identities, territorial boundaries, spatial segregation, administrative structures, military logistics, and so forth are also embedded in the data. In the online Supplementary Materials, we evaluate the potential effects of these factors (including settlement size, region, territoriality, and vessel form and function), finding that none of these introduce a significant bias to the regression results. In addition, our results are all consistent with expectations derived from economic geography and Settlement Scaling Theory; the observed changes are all predictable effects of declining transport costs. Together, these results inspire confidence that the decay rate of pottery consumption with distance from the production location is a good proxy measure of average transport costs for manufactured goods. By this measure, transport costs decreased by a factor of nearly two between the Early and Middle Roman periods (0.0362/0.0214 = 1.693), and the average rate of reduction in transport costs was about one half of one per cent per year between ad 150 and 250 (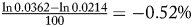 ${{\ln 0.0362-\ln 0.0214} \over {100}} = {-}0.52\% $), and a small fraction of a per cent per year between ad 250 and 400 ( ${{\ln 0.0214-\ln 0.0205} \over {150}} = {-}0.027\% $). These results suggest that improvements in transport occurred primarily during the Early and Middle Roman periods, with only small refinements during the Late Roman period. However, the maximum and median industry production levels both continued to increase, and the variance in industry production levels as well as the baseline consumption diversity both continued to decrease during the Late Roman period (Figures 5 and 6). These patterns suggest a time lag in economic adjustment, which in turn suggests that producers in Roman Britain continued to explore and adapt to the changing economic environment even after the associated technologies and infrastructures had stabilized. This is significant, in that it suggests that the economic benefits of investments in transport technology and infrastructure can be realized over much longer time scales than the immediate period in which they are established.
The fact that average rates of change of such a small but non-trivial magnitude can be measured using archaeological data is an exciting prospect for future research on economic change in ancient societies. Furthermore, the ability to quantify this aspect of technological change over time provides a means of controlling for its effects in a broader examination of the determinants of economic development. The fact that the expectations regarding economic change we developed in this study are all observed for a pre-industrial and non-capitalist economy suggests that the underlying socioeconomic processes behind these expectations are quite fundamental, despite evidence for social embeddedness (residuals to the fit line) reflected in our results and those of other studies. To study these processes effectively requires large-scale data synthesis of a type that is only now becoming feasible through substantial investments in cyberinfrastructure, the rapid expansion of data processing tools, and the cumulative benefits of previous synthesis projects leading to open access data. We hope that our results will encourage more archaeologists to make such investments, and share the resulting datasets, to promote the cumulative nature of archaeological research.
Acknowledgements
Parts of this research were supported by a grant from the James S. McDonnell Foundation. We thank Christopher Evans, Katie Anderson, and Neil Holbrook for discussions, and four anonymous reviewers for many helpful comments on a previous draft. The raw data analysed in this article are interoperable with the ‘Rural Settlement of Roman Britain’ and ‘Defended Small Towns of Roman Britain’ datasets and will be deposited with the Archaeology Data Service following the publication of this article.
Supplementary Material
To view supplementary material for this article, please visit https://doi.org/10.1017/eaa.2023.37.


 Open access