





1. Introduction
“What gets measured gets improved,” legendary management consultant Peter Drucker allegedly said. Whether the quip is apocryphal or not, it nevertheless conveys the idea that before one can tackle a problem, one must take stock of the extent of that problem. Consequently, social scientists whose ultimate goal is to reduce the extent of poverty and improve welfare have devised various ways of measuring poverty and welfare and keep improving on those ways. In places where the fiscal capacity of the state is limited, and where accurate income tax records are not available or are only available for some of the wealthiest households in the population, the measurement of poverty relies on surveys that try to measure household income, expenditures, or assets as proxies for household welfare (Deaton, Reference Deaton1997). But given the level of detail involved in collecting precise values for those proxies for household welfare, household surveys can take a few hours of a survey respondent’s time, and it is not unlikely that the longer a survey, the more response patterns are likely to change over the course of that survey. For the researcher interested in using data from those surveys in applied research, this means that the choice of when specific data are collected within a survey might introduce measurement error of a classical or non-classical nature, which can lead to either attenuation or systematic bias when the data measured with error are used in empirical work.
Is welfare more likely to be measured with error depending on the placement of the welfare measurement module within a survey? We answer this question by looking at household assets—both the number of assets a household owns as well as the total value of those assets—as a proxy for welfare.Footnote 1 Within a survey administered in Bangladesh at the individual level, we randomly assign half of the survey respondents to answer questions about their assets early in the survey (treatment) and the remainder of our respondents to answer questions about their assets at the end of the survey (control). To assess whether the early asset module treatment introduces non-classical measurement error, we rely on a standard approach wherein we regress each measure of welfare on an early asset module treatment dummy. To assess whether the placement of the asset module introduces classical measurement error, we compare distributions between the treatment and control groups for each outcome of interest by conducting (i) Breusch-Pagan tests of group-wise heteroskedasticity after estimating the aforementioned regressions, and (ii) Kolmogorov-Smirnov tests of equality of distributions for the outcomes of those regressions. Finding evidence of classical measurement error implies a more dispersed distribution in the error-prone group of respondents. This more dispersed distribution, in turn, leads to attenuation in estimated effects when assets represent the dependent variable in regression analysis.
We find no evidence in the full sample that survey ordering introduces non-classical measurement error either in the number of reported assets or the reported asset value. Moreover, we find no evidence that survey ordering introduces classical measurement error in either measure.Footnote 2 In exploratory analysis, we find evidence of non-classical measurement error due to survey ordering within sub-samples of respondents who (i) are from larger (i.e., more than four individuals) households or (ii) have low levels (i.e., fewer than six years) of education.Footnote 3 We also find suggestive evidence that respondents who are not the head of their household report higher asset values when asked about them early in the survey. These results highlight possibly important sources of heterogeneity in response bias due to survey module placement which, despite the null effect in the full sample, can nevertheless be meaningful for both policy and applied research.
This paper is closely related to several recent papers that experimentally study the effects of survey length and questionnaire design as well as response bias. First, using long (i.e., two- to three-hour) multi-module household surveys administered in Liberia and Malawi, Jeong et al. (Reference Jeong, Aggarwal, Robinson, Kumar, Spearot and Park2023) randomize the order of survey modules measuring assets and food consumption and find that an additional hour of survey time needed to reach a given question increases the probability that a respondent triggers a skip code by answering “No” to the question.Footnote 4 Second, and again using a long multi-module household survey administered in Ghana, Ambler et al. (Reference Ambler, Herskowitz and Maredia2021) randomize the order in which household members appear within the labor module of their survey, and find that moving a household member back by one position reduces their reported number of productive activities. Finally, Abay et al. (Reference Abay, Berhane, Hoddinott and Tafere2022) study response bias in relatively short phone surveys administered in Ethiopia by using a study design similar to ours. The authors randomly assign a survey with the dietary diversity module early vs. late in the questionnaire and find that respondents receiving a late dietary diversity module report less dietary diversity.Footnote 5
Our contribution is fourfold. First, whereas the literature focuses on whether various survey modalities introduce systematic bias in measurement, we test whether the within-survey placement of the welfare (here, assets) measurement module introduces either systematic bias, attenuation bias, or both. Given that proxies for welfare are often used as outcome variables in empirical work, knowing whether they suffer from attenuation bias matters for inference, because that would increase the risk of Type II error when using those proxies as dependent variables. Second, we document conditions under which the randomized placement of a survey module within a questionnaire leads to a null effect on average. Documenting these null effects is important both for the purpose of preventing publication bias (Chopra et al., Reference Chopra, Haaland, Roth and Stegmann2023; Stanley, Reference Stanley2005) and because our multi-module survey took respondents about 75 minutes to complete. This is considerably shorter than the multi-module survey administered by Jeong et al. (Reference Jeong, Aggarwal, Robinson, Kumar, Spearot and Park2023) and provides a useful proof of concept for the length of a multi-module household survey without measurable response bias. Third, we document heterogeneous effects in response bias due to survey module placement. Documenting these heterogeneous effects is important because they demonstrate that response bias can lead to systematic bias even in a context where there is no measurable response bias in the full sample. Finally, our experimental design generalizes to an ex-post test of data quality with respect to questionnaire length. Researchers can embed our survey experiment within their questionnaires and measure differential responses to questions based on the randomized ordering of survey modules. If answers do not systematically change based on survey module ordering, then this result can help support confidence in the quality of the data collected in the entire survey.
The remainder of this paper proceeds as follows. In the next section, we introduce our experimental design. In Section 3, we discuss both our main, pre-registered results and additional, exploratory results. We conclude in section 4 with recommendations for survey design and future research.
2. Experimental design
We embed this survey experiment within the baseline survey of a larger experiment that aims to estimate demand for digital financial services in Bangladesh (Rahman & Bloem, Reference Rahman and Bloem2020). We differentiate between that “larger experiment” (i.e., the study of demand for digital financial services) which, at the time of writing this paper is still ongoing, and this “survey experiment” (i.e., the study of survey ordering on the measurement of welfare) which is the focus of this paper.
In this survey experiment, we randomly assign respondents at the individual level into two groups. Roughly half of the respondents (i.e., 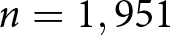 $n=1,951$), whom we assign to the treatment group, receive a survey where the module collecting information about household assets appears at the beginning of the survey; we refer to that group as the “early asset module” group in what follows. The remainder of the respondents (i.e.,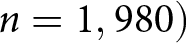 $n=1,980)$, whom we assign to the control group, receive a survey where the module collecting information about household assets appears at the end of the survey. Table A.4, shown in the Supplemental Appendix, reports both basic summary statistics about our sample and balance tests that illustrate the validity of our randomization among observable variables. Our sample is 99 percent female, the average respondent is 38 years old, 93 percent of respondents are married, about half live in households with more than four members, 34 percent of respondents are the head of their household, and about half have completed schooling up to about class six. These statistics are not significantly different between the treatment and control groups.Footnote 6
Table 1 lists the order of the survey modules for respondents in the treatment group and respondents in the control group. The key difference is whether respondents receive a survey with the asset module early in the questionnaire (i.e., treatment) or a survey with the asset module late in the questionnaire (i.e., control). Of course, the relative placement of other modules is also different between the treatment and control groups. The relative difference in the placement of those other, non-asset modules is much less than the relative placement of the assets module. Therefore, we assess the effect of assignment to the treatment group on reported assets. Each respondent, regardless of treatment status, received the same survey modules and questions.
Survey module order
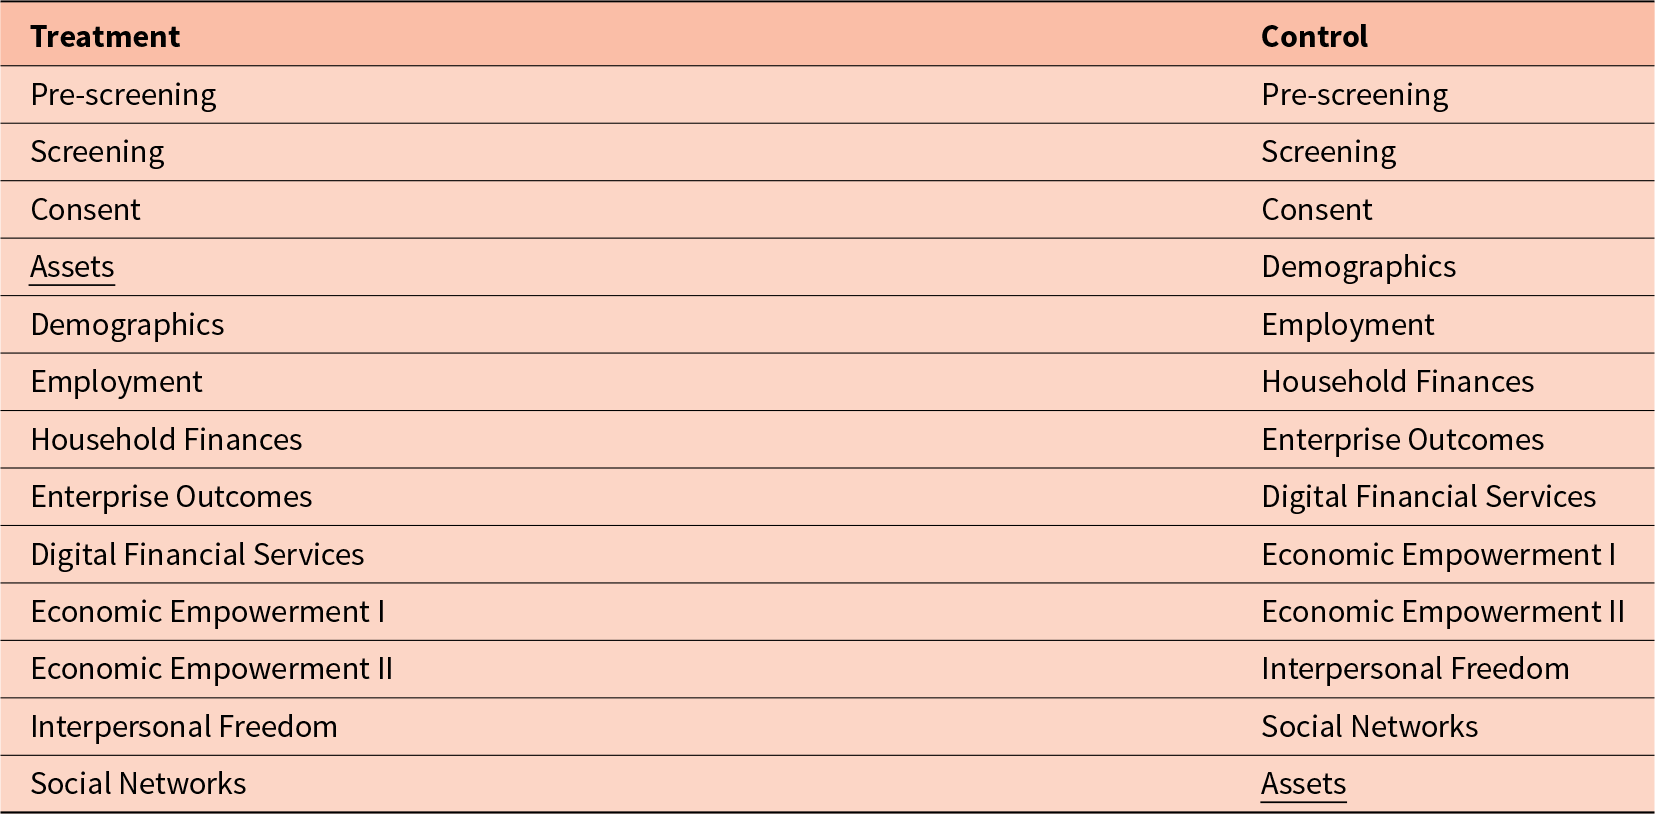
Notes: Household survey module order for respondents in the treatment and control group. Statistics about the duration of active survey time are reported in Figure 1.
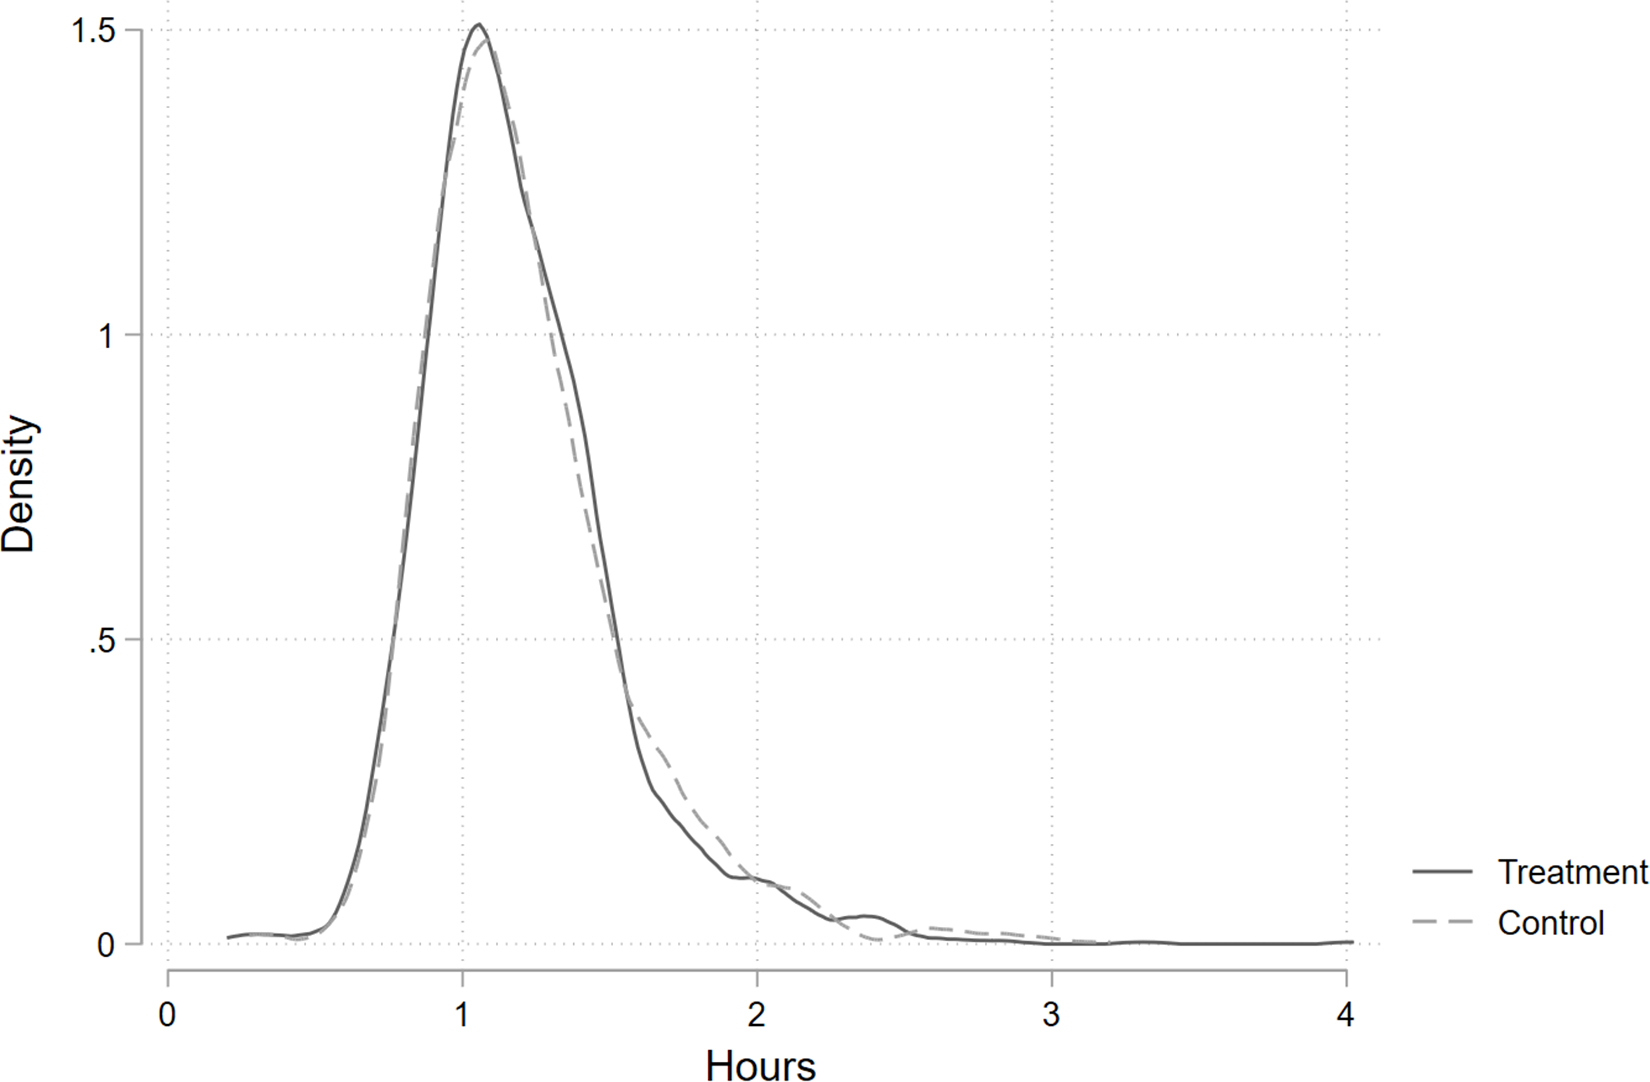
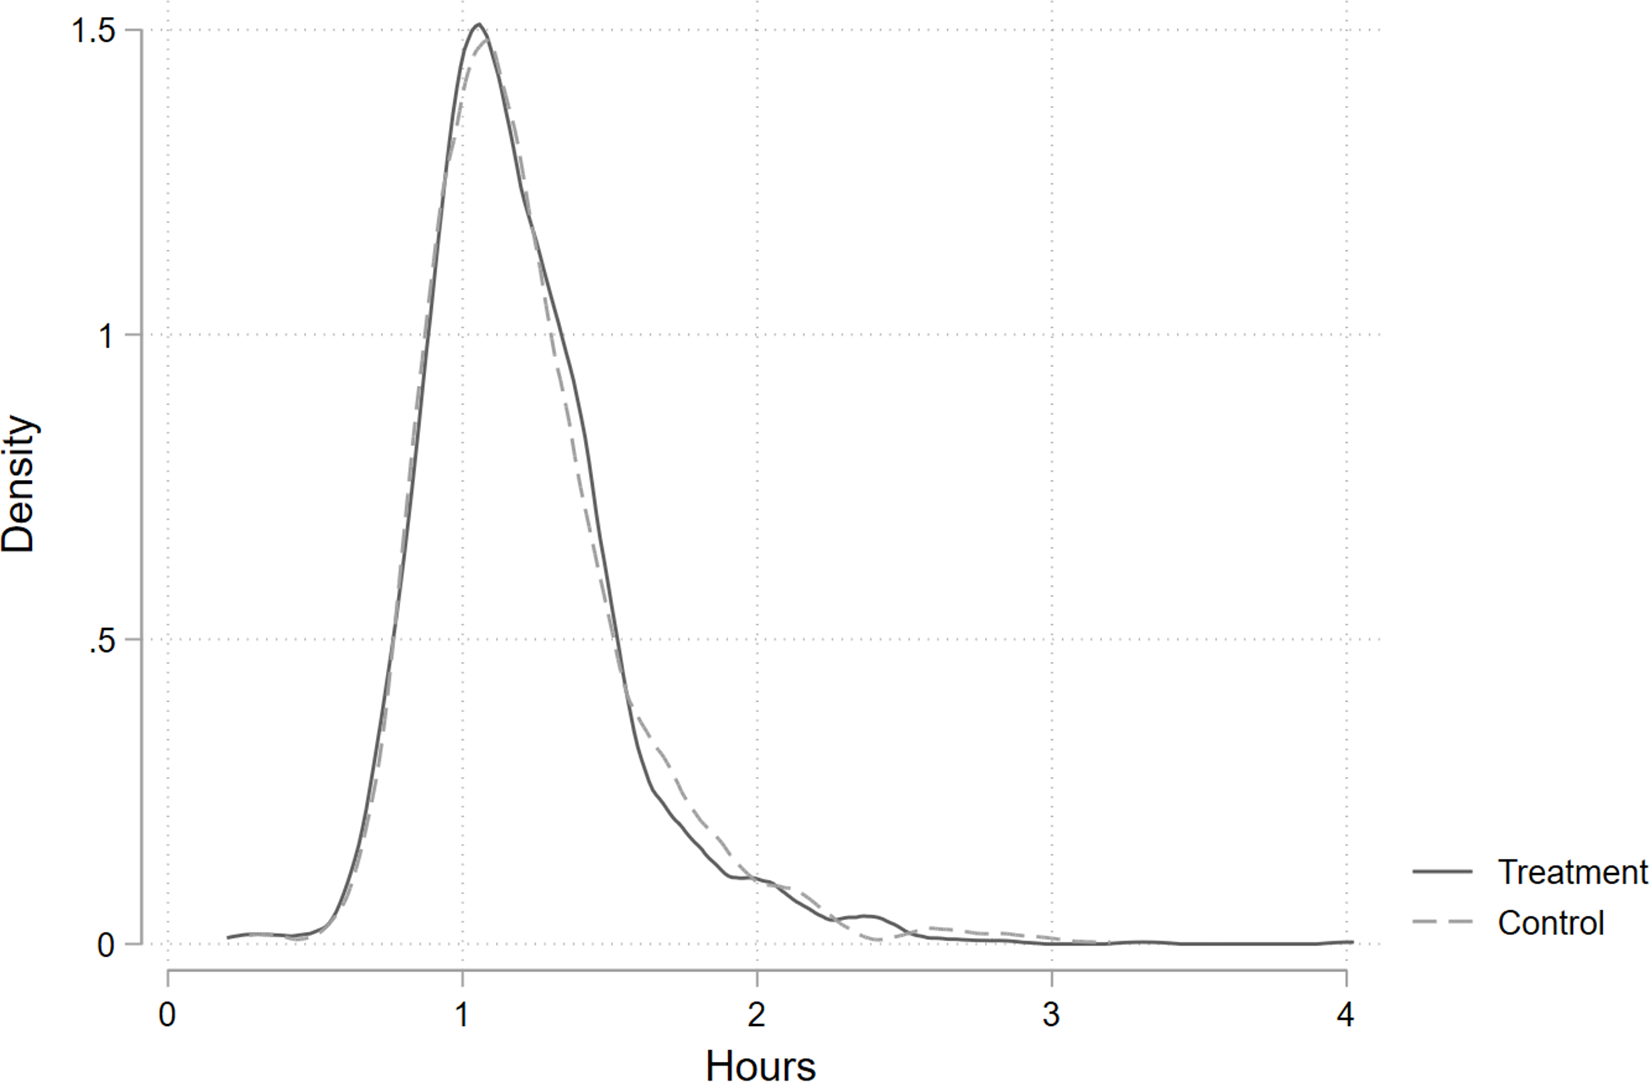
Therefore, it is unsurprising to find that the distribution of the duration of active survey time is essentially identical between the treatment and control groups, as shown in Figure 1. On average, respondents took about 75 minutes to complete our survey, with the first percentile of the distribution completing the survey in about 40 minutes and the 99th percentile of the distribution completing the survey in about 2 hours and 15 minutes. Our survey is thus notably shorter than the 2.5 hour (on average) survey used by Jeong et al. (Reference Jeong, Aggarwal, Robinson, Kumar, Spearot and Park2023) in their survey experiment. The key difference in the survey received by individuals in our treatment and control groups is the placement of the assets module. The treatment group received a survey with the assets module placed just after the consent module, roughly five minutes into the survey on average. The control group received a survey with the assets module placed at the end of the questionnaire, roughly seventy minutes into the survey on average. Thus, our treatment leads to a difference in the time between the start of the survey until the asset module of just over 60 minutes. Figure A.1 in the Supplemental Appendix shows the order in which assets are listed in the asset module and the probability of reported asset ownership.
Kernel Density Estimate of the Duration of Active Survey Time
Notes: Epanechnikov kernel. Full sample mean = 1.21 hours, median = 1.14 hours, 1st percentile = 0.64 hours, and 99th percentile = 2.38 hours. Sample size = 3,931. The average difference in duration by treatment status is not statistically significant. Regression results are shown in Table A.4
The assets module itself takes respondents about 10 minutes to complete, includes 41 categories of assets, and requires respondents to first indicate if they, or another member of their household, owns a given asset. If they answer ‘yes,’ then there are two follow up questions: (i) a question about the current market value of the asset and (ii) a question characterizing the ownership structure of the asset. Therefore, similar to the work of Jeong et al. (Reference Jeong, Aggarwal, Robinson, Kumar, Spearot and Park2023), respondents can expedite the end of the assets module by responding ‘no’ to the initial question and triggering a skip code.
2.1. Estimation strategy
Our analytical approach is straightforward. We compare reported assets between the treatment group and the control group to estimate the effect of receiving a survey with the asset module early in the questionnaire relative to receiving a survey with the asset module placed at the end of the questionnaire. It is important to note that, similar to most surveys, our survey does not collect data on the objectively “true” asset value for each household. Instead, our data collects information on the asset value reported by household respondents. Thus, in the absence of an objective benchmark, our empirical strategy focuses on testing for (i) differences in distributions (i.e., classical measurement error) and (ii) differences in expectations (i.e., non-classical measurement error).
Our main estimation approach uses the following regression specification:
 \begin{equation}
Y_{ij} = \alpha_{j} + \beta_{j}T_{i} + \gamma_{i} + \epsilon_{ij}
\end{equation}
\begin{equation}
Y_{ij} = \alpha_{j} + \beta_{j}T_{i} + \gamma_{i} + \epsilon_{ij}
\end{equation}In equation (1), Yi denotes the number of assets reported by the respondent from household i or the inverse hyperbolic sine of the reported value of each asset category j (Bellemare and Wichman, Reference Bellemare and Wichman2020).Footnote 7 Ti is a dummy variable equal to one if household i is in the treatment group and equal to zero otherwise, and ϵij is an error term with mean zero. As this survey experiment uses baseline data from a larger experiment (Rahman & Bloem, Reference Rahman and Bloem2020), we also control for stratum fixed effects, γi, pertaining to treatment status in the larger experiment. In our pre-analysis plan, we pre-specified that we would cluster the standard errors by survey experiment treatment status within centers (i.e., a micro-finance branch location) as this represents the level of randomization from the larger experiment (Rahman & Bloem, Reference Rahman and Bloem2020). Given that the center-level randomization from the larger experiment is independent of the individual-level randomization in this survey experiment, clustering the standard errors in this way is likely overly conservative. Therefore, following the insights of Abadie et al. (Reference Abadie, Athey, Imbens and Wooldridge2023), we report Eicker-Huber-White robust standard errors in the main manuscript and report results clustered by survey experiment treatment status within centers in the Supplemental Appendix.
With these regressions, we conduct two sets of analyses. The first, investigating the presence of non-classical measurement error, we test for differences in expectations. In particular, we follow a straightforward approach of testing whether  $\hat{\beta}$ from equation (1) is different from zero. If so, this would provide evidence of non-classical measurement error and systematic bias embedded in our data driven by the placement of the assets module. The second, investigating the presence of classical measurement error, we test for differences in distributions. Specifically, we conduct (i) Breusch-Pagan tests of group-wise heteroskedasticity after estimating equation (1), and (ii) Kolmogorov-Smirnov tests of equality of distributions for the outcomes of the regressions specified in equation (1). If these tests reveal differences in the distributions between the early assets group and the late assets group, then this implies the presence of classical measurement error and attenuation bais driven by the placement of the assets module.
2.2. Possible mechanisms
Survey fatigue is the dominant mechanism discussed in the literature to date (Abay et al., Reference Abay, Berhane, Hoddinott and Tafere2022; Ambler et al., Reference Ambler, Herskowitz and Maredia2021; Jeong et al., Reference Jeong, Aggarwal, Robinson, Kumar, Spearot and Park2023). Those who posit this mechanism speculate that respondents become fatigued and choose answers in order to expedite the end of the survey or become more likely to inadvertently misreport information. Survey fatigue, the story goes, thus leads responses provided near the end of a survey to be more prone to error than responses near the beginning. If respondents systematically choose responses in order to expedite the end of the survey or inadvertently misreport information near the end of the survey, then measurement error would lead to systematic bias in responses near the end of the survey.
Despite the dominance of the survey fatigue mechanism hypothesis in the literature, other mechanisms remain possible. For example, it might take time for respondents to acclimate to answering survey questions. Although this is a novel mechanism in this literature, it draws from survey design techniques that provide “warm up” or practice questions and aligns most closely with the experimental design of Laajaj & Macours (Reference Laajaj and Macours2021) who assess differential responses due to order effects and anchoring. This mechanism posits that respondents require time to acclimate to a particular survey. This alternative mechanism would lead responses provided near the end of a survey to be less prone to error than responses near the beginning. If respondents inadvertently misreport information near the beginning of the survey this could lead to either attenuation or systematic bias near the beginning of the survey.
We are ultimately unable to directly test for the survey fatigue, acclimation, or other mechanisms within our survey experiment. Such a direct test of the survey fatigue mechanism, for example, would require an experiment that holds survey ordering fixed and randomly assigns cognitively more or less taxing questions preceding a given module. As we discuss in the conclusion, given the results in this paper and other existing results documented in similar papers to date (Ambler et al., Reference Ambler, Herskowitz and Maredia2021; Abay et al., Reference Abay, Berhane, Hoddinott and Tafere2022; Jeong et al., Reference Jeong, Aggarwal, Robinson, Kumar, Spearot and Park2023), a fruitful next step in this literature will be to design survey experiments that directly test possible mechanisms (i.e., survey fatigue, acclimation, etc.)
3. Results
This section presents our results for whether the placement of the asset module introduces measurement error in the form of either attenuation or systematic bias. We first report our pre-registered results.Footnote 8 We then report the results of an exploratory analysis of treatment effect heterogeneity.
3.1. Pre-Registered results
To test whether the placement of the asset module introduces systematic bias, we start by estimating regressions aimed at assessing the differences in the number of assets reported and the inverse hyperbolic sine (i.e., asinh) of the reported value for each asset category. To test whether the placement of the asset module introduces attenuation bias, we then compare the mean of the squared residuals from those regressions with a Breusch-Pagan test of group-wise heteroskedasticity for each outcome. We further test whether the distribution of each outcome is equal across treatment and control groups using Kolmogorov-Smirnov tests to assess the robustness of our attenuation bias findings.
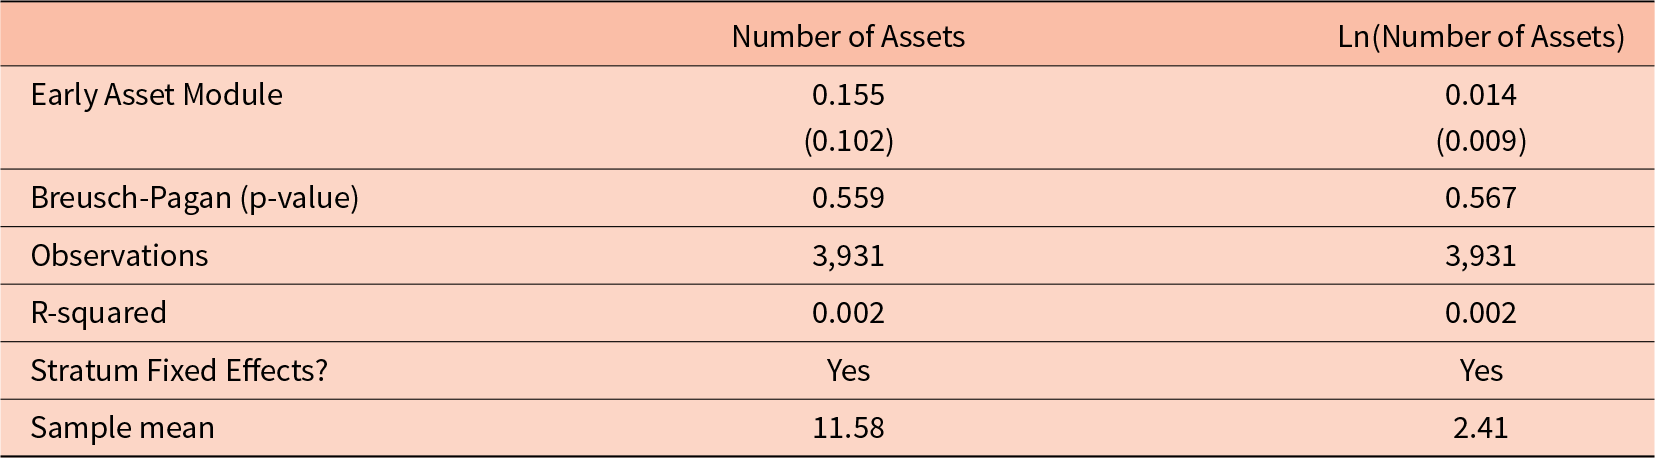
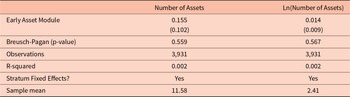
Table 2 reports results from estimating equation (1) with the number of assets reported as the dependent variable. The first column uses the raw number of assets as the dependent variable and the second column uses the natural log of the number of assets reported. In both columns, we find a null effect. In the first column, the coefficient indicates that respondents receiving a questionnaire with an early asset module report 0.15 more assets than respondents receiving a questionnaire with a late asset module, relative to a sample mean of about 11.5 assets reported. In the second column, we find that an early asset module leads to about 1.4 percent more assets reported. The estimates in both columns are relatively precise null effects, meaning they are small in magnitude and not statistically significant. Moreover, we conduct a Breusch-Pagan test of group-wise heteroskedasticity across the treatment and control groups. In both columns in Table 2, we fail to reject the null of no difference in the sum of squared residual by treatment status. Finally, a Kolmogorov-Smirnov test with a p-value of 0.784 shows that, along the entire distribution of the outcome variables used in Table 2, there is no difference between the treatment and control groups.
Number of assets reported, full sample
Notes: Eicker-Huber-White robust standard errors in parentheses ***p < 0.01, **p < 0.05, *p < 0.1.
We now estimate differences in the reported value of each asset category. We observe 41 asset categories, but for many asset categories, many respondents report not owning any assets. We thus transform these values using the inverse hyperbolic sine transformation, which is log-like but allows retaining zero-valued observations. Figure 2 reports estimates of the effect of receiving a questionnaire with a relatively early asset module on the inverse hyperbolic sine of the reported value of assets for each category. We report these estimates from the lowest coefficient to the highest coefficient. Notably, none of the estimates are statistically significant at the 95 percent level. Moreover, this finding holds when we adjust for multiple hypothesis testing using the method developed by Benjamini et al. (Reference Benjamini, Krieger and Yekutieli2006), as implemented by Anderson (Reference Anderson2008).
Effect on the Value Reported of Each Asset
Notes: This figure shows coefficient estimates with associated 95 percent confidence intervals. When we adjust for multiple hypothesis testing using the method developed by Benjamini et al. (Reference Benjamini, Krieger and Yekutieli2006), as implemented by Anderson (Reference Anderson2008), none of these effects are statistically different from zero
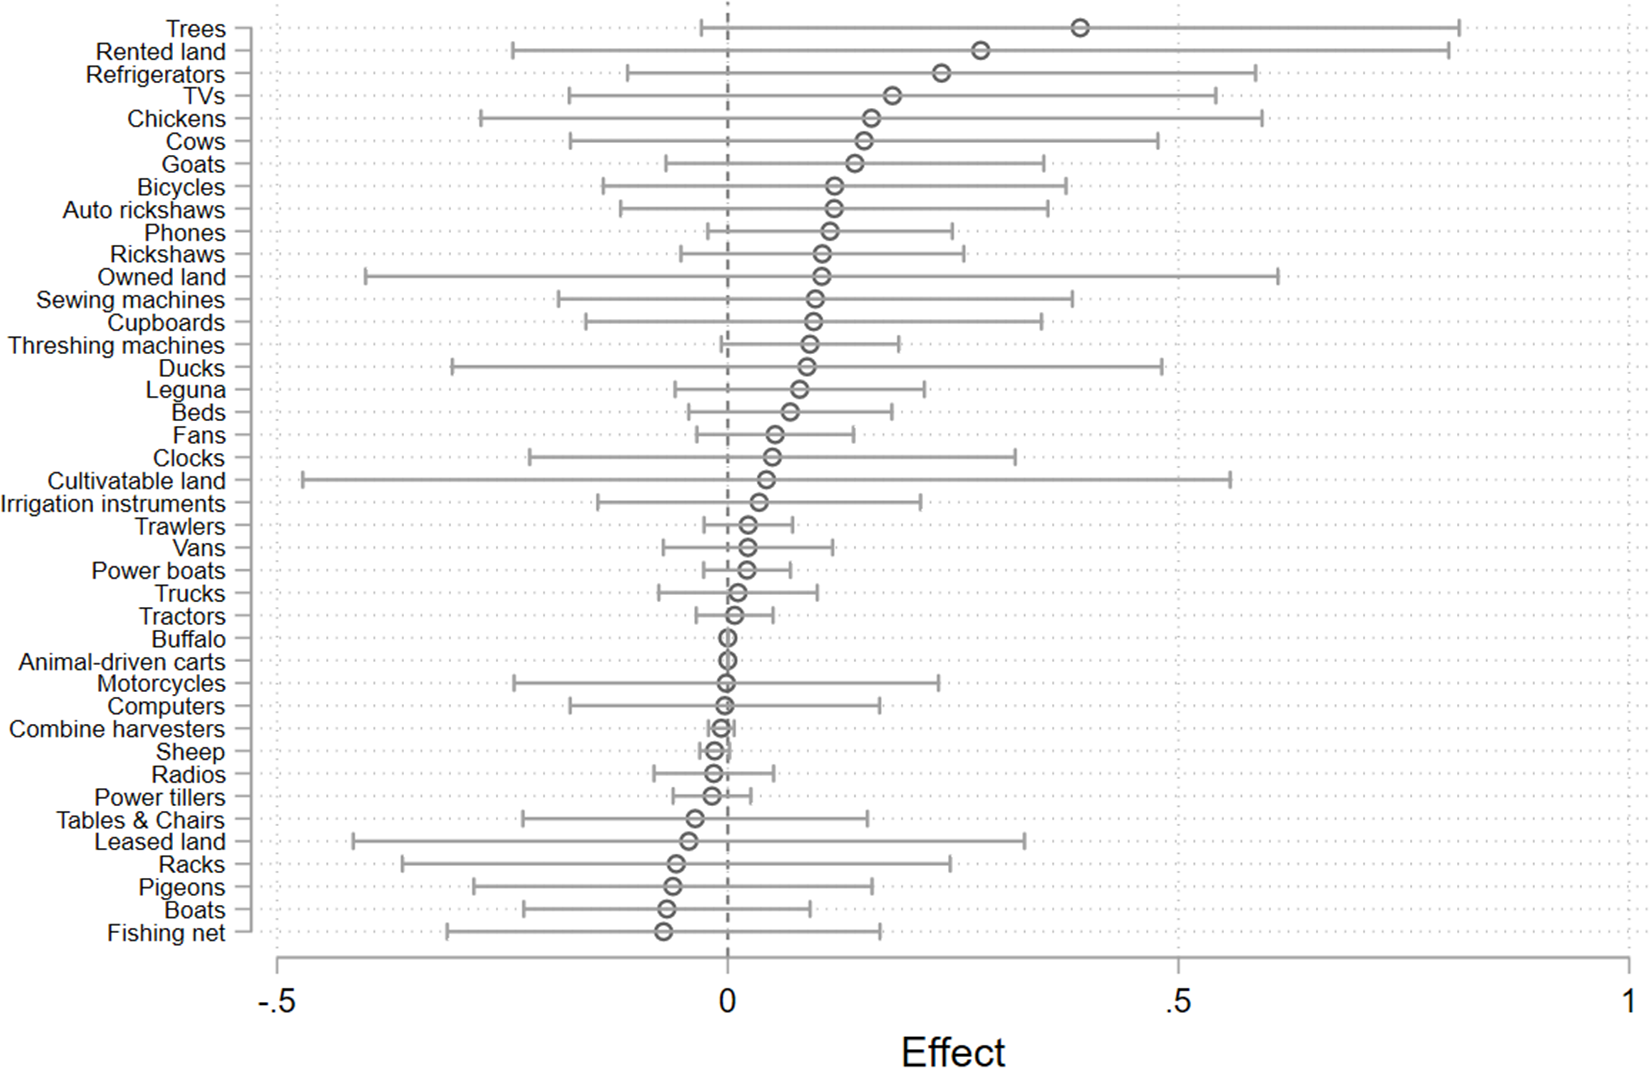
We further conduct a series of Breusch-Pagan and Kolmogorov-Smirnov tests for each of the 41 asset categories and, after adjusting for multiple hypothesis testing, we find no difference in the squared residuals and no difference along the entire distribution of the outcome variables for each regression reported in Figure 2. By failing to reject the null of no attenuation or systematic bias on the value reported for each of the 41 asset categories, these findings further support the null effect of survey ordering on the measurement of welfare, at least in our relatively short (i.e., 75 minute, on average) survey.
3.2. Exploratory results
We now depart from our pre-registered results to examine some exploratory results that provide additional nuance and insights from our survey experiment. First, we report additional results from our full sample. Second, we document important dimensions of treatment effect heterogeneity. Although these results are not pre-registered and are rather exploratory in nature, we report results from each of the sub-group analyses we conducted in our analysis.
Additional Full Sample Results. Given the null effects reported in Table 2 on the total number of assets reported and in Figure 2 on the reported value of each asset, one may expect that we also find a null effect on the total reported asset value, and indeed this is what we find. Table A.4, shown in the Supplemental Appendix, reports the effect of receiving an early asset module on the natural log of total reported asset value. We find that our treatment led to a roughly 9-percent increase in the total reported asset value, but this estimate is imprecise, and thus not statistically significant. Nevertheless, this effect magnitude could represent a meaningful source of bias in some empirical settings.
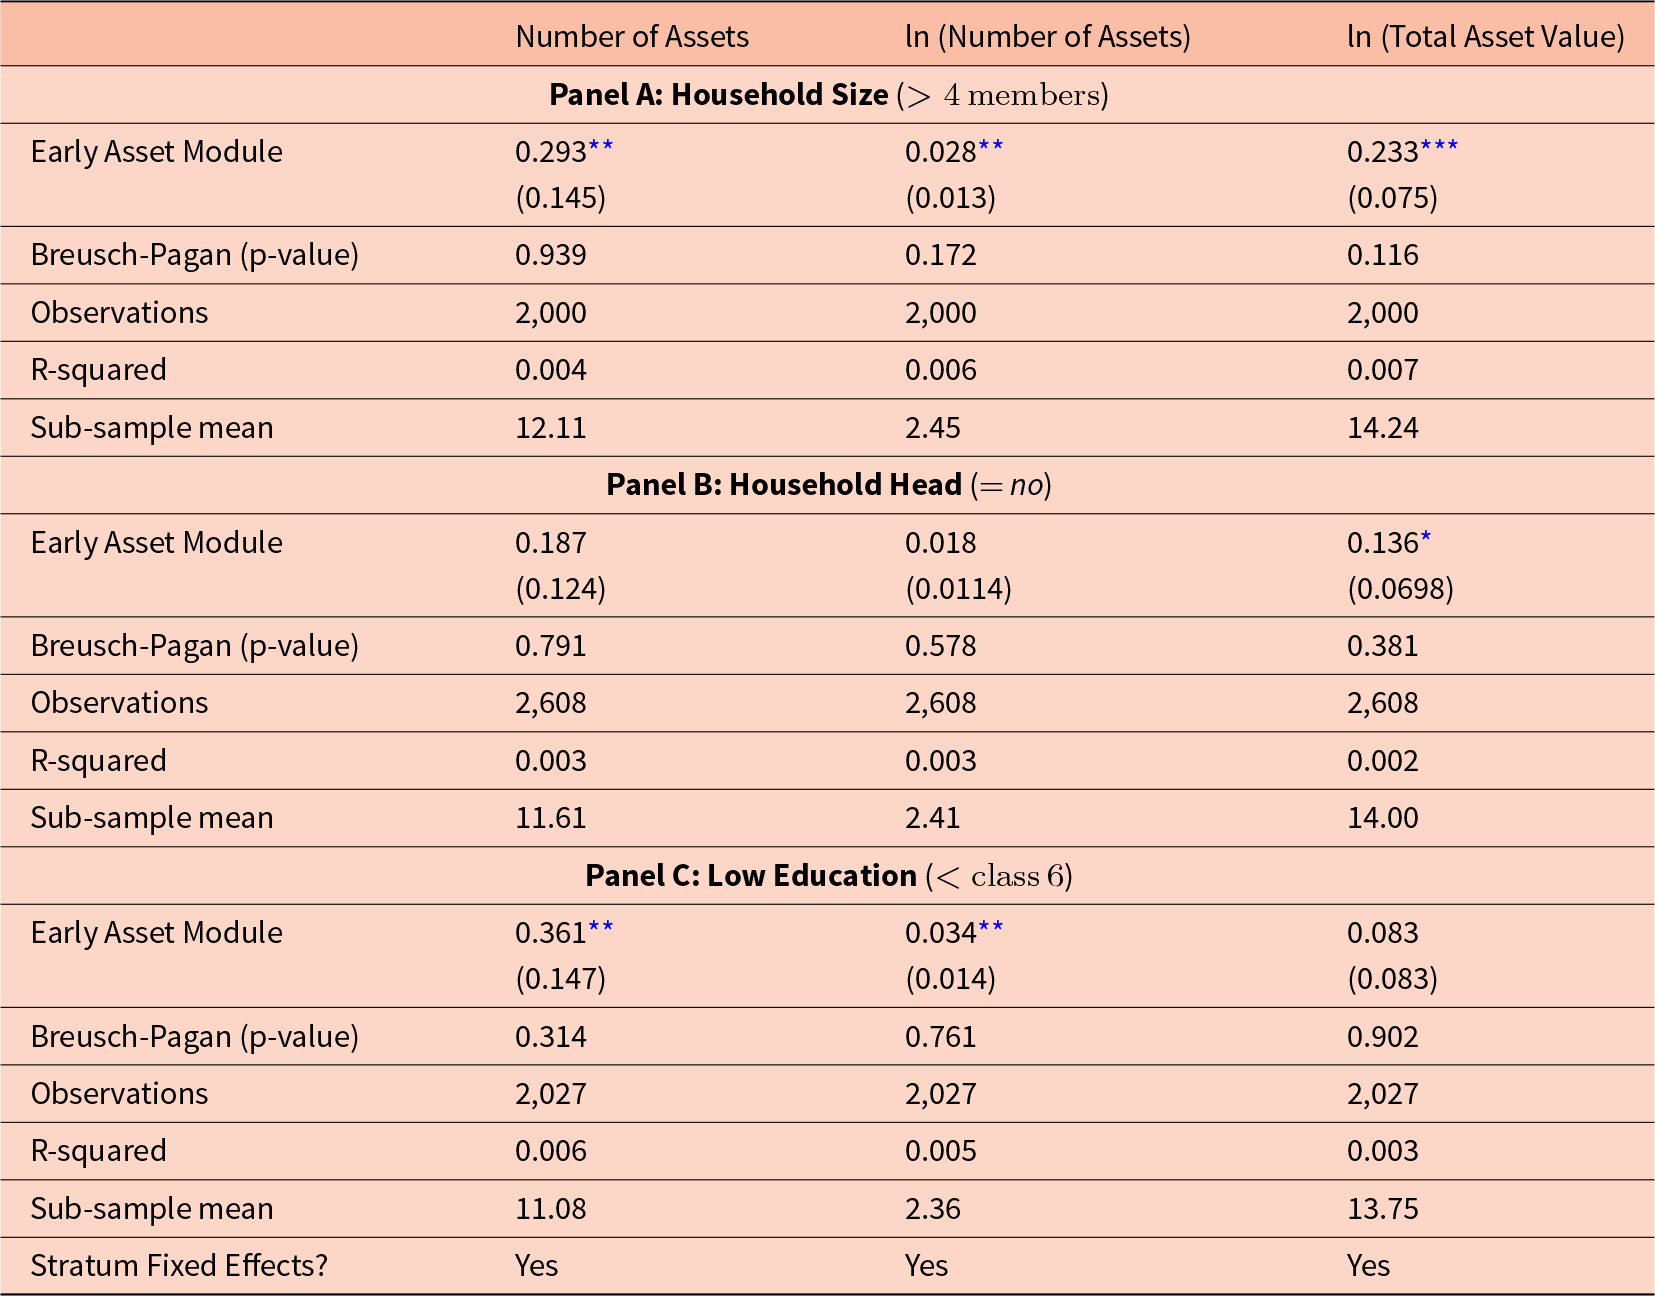
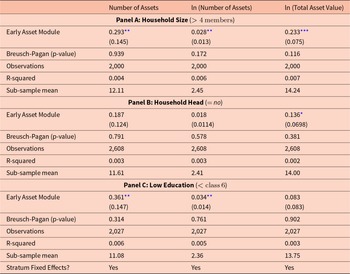
Heterogeneity Analysis. Our second set of exploratory results focuses on effect heterogeneity within distinct sub-samples of our data. We explore three sub-samples: (i) respondents from households with more than four members, (ii) respondents who are not the head of their household, and (iii) respondents who have completed less than class six. As shown in Table A.1 in the Supplemental Appendix, these sub-samples each divide our sample roughly in half. Table 3 reports estimates of the effect of our treatment on the number of assets reported and the reported asset value for each of these sub-sample groups.
Number of assets reported and total asset value, within sub-samples
*** Notes: Eicker-Huber-White robust standard errors in parentheses p < 0.01, **p < 0.05, *p < 0.1.
We test heterogeneity by these sub-groups because respondents who are (i) from larger households, (ii) not the head of their household, and (iii) have completed less education might have a more difficult time accurately recalling details about household assets—because they exert less control over those assets—and their reporting error might differ based on when we ask them about their household’s assets for at least two reasons. First, it could be that respondents become fatigued the longer a survey lasts; and respondents with less control over assets might fatigue quicker and report these assets with more error when enumerated later in the questionnaire. Second, and to the contrary, it could be that respondents need time to acclimate to answering questions about their household; and respondents with less control over assets might require more time to “warm up” and report these assets with more error when enumerated early in the questionnaire.
In panel A of Table 3, we report results for the sub-sample of respondents who live in households with more than four members, which effectively cuts our sample in half. In the first column, we find that respondents from larger households and who receive a questionnaire with an early asset module report 0.29 more assets than respondents receiving a questionnaire with a late asset module, relative to a sample mean of 12.11 assets reported. In the second column, we find that our treatment leads to about 2.8 percent more assets reported for respondents from larger households. In the third column, we find that receiving a questionnaire with an early asset module leads to a 23 percent higher total reported asset value among respondents from larger households. The estimates in each column are statistically significant and represent notable systematic bias due to the placement of the asset module. However, in each column of panel A of Table 3 Breusch-Pagan test results indicate no evidence of attenuation bias within the sub-sample of respondents living in a relatively large household.
In panel B of Table 3, we report results for the sub-sample of respondents who are not the head of their household. Due to the nature of the larger experiment that focuses on clients of local micro-finance branch centers, roughly 66 percent of our sample are not the head of their household. In the first column, we find that respondents who are not the head of their household and who receive a questionnaire with an early asset module report 0.19 more assets than respondents receiving a questionnaire with a late asset module, relative to a sample mean of 11.61 assets reported. In the second column, we find that our treatment leads to about 1.8 percent more assets reported for respondents who are not the head of their household. In the third column, we find that receiving a questionnaire with an early asset module leads to a 14 percent higher total reported asset value among respondents who are not the head of their household. The estimates in the first two columns are not statistically significant, however, the estimate in the third column is statistically significant at the 0.1 percent level and the magnitude represents a meaningful systematic bias due to the placement of the asset module. Similar to the results in panel A, in each column of panel B of Table 3 Breusch-Pagan test results indicate no evidence of attenuation bias within the sub-sample of respondents who are not the household head.
Finally, in panel C of Table 3, we report results for the sub-sample of respondents who have completed less than class six. In the first column, we find that respondents who completed less than class six and who receive a questionnaire with an early asset module report 0.36 more assets than respondents receiving a questionnaire with a late asset module, relative to a sample mean of 11.08 assets reported. In the second column, we find that our treatment leads to about 3.4 percent more assets reported. In the third column, we find that receiving a questionnaire with an early asset module leads to an 8 percent higher total reported asset value. The estimates in the first two columns are statistically significant, but the estimate in column three is not statistically significant. Again, in each column of panel C of Table 3 Breusch-Pagan test results indicate no evidence of attenuation bias within the sub-sample of respondents who have relatively low levels of education attainment.
4. Conclusion
Does the within-survey placement of a module aimed at measuring household welfare, proxied here by household assets, introduce measurement error leading to either attenuation or systematic biases? We answer this question by randomizing the placement of the asset module earlier in the questionnaire (treatment) or at the end of the questionnaire (control) within a relatively short (i.e., 75-minute) household survey in Bangladesh. We find no evidence that survey ordering introduces systematic bias in the measurement of assets in the full sample. Additionally, we find no evidence that survey ordering introduces attenuation bias in the measurement of assets.
Here it is important to again emphasize that our survey was short relative to other surveys. Thus, if survey fatigue explains the discrepancy between our results and those in Abay et al. (Reference Abay, Berhane, Hoddinott and Tafere2022) and Jeong et al. (Reference Jeong, Aggarwal, Robinson, Kumar, Spearot and Park2023), then our null results provide a useful proof-of-concept for the length of a multi-module household survey without measurable response bias, at least on average.
Ultimately, however, we cannot test whether survey fatigue, or lack thereof, is the mechanism that explains our results. While survey fatigue is certainly a possible mechanism, it could also be the case that respondents are more acclimated and in the right state of mind to answer precise questions about their assets when they are asked about those assets toward the end of the survey. Given that, and in the absence of a formal test of respondent fatigue, one must necessarily remain agnostic about the mechanism behind extant findings in this literature.
More generally, one limitation of our approach is that while our research design allows testing whether there are systematic differences in the mean and variance of our proxy for welfare, it does not allow testing which of the two versions of the questionnaire—the early asset module version or the version with the asset module at the end of the questionnaire—is closer to the truth. Future research should aim to test which of early or late asset modules are more likely to generate answers closer to the truth, and thus test for the precise mechanism whereby reported assets (or other proxies for welfare) differ. One way to do this could be to randomize both the within-survey placement of survey sections as well as the length of the survey (say, by introducing additional, ancillary middle sections), and then test whether survey length is a mediator in the relationship between survey section placement and reported assets. Alternatively, future work could experiment with additional measurement tools, such as having enumerators record their own observations of assets or asking the same questions at a different time or with additional respondents from the same household. While potentially prohibitively costly to implement at scale, these approaches would provide a more direct assessment of measurement error if conducted in a smaller pilot survey.
Nevertheless, the experiment we discuss in this paper could be generalized to serve as an ex-post test of whether the questionnaire was too lengthy. In particular, if answers do not systematically change based on the location of a module within the questionnaire, then this result can help support confidence in the quality of the data collected in the entire survey. In this regard, survey experiments designed similar to the experiment we discuss in this paper can be considered part of the empirical toolbox for assessing data quality in relatively long surveys.
Finally, our results highlight a potential trade-off when it comes to designing surveys. If the placement of a given module influences the quality of the data measured by this module, then there may also be systematic bias embedded in survey modules coming relatively earlier or later in the questionnaire. Ostensibly, this implies that researchers should design surveys with the most important modules placed at the point in the questionnaire where respondents are more likely to give accurate answers. In practice, however, most information included in any given survey is likely to be important for some purpose or another. Thus, ordering survey modules based on their relative level of importance may not be a reasonable task. In that case, a potential solution may be to divide the survey into multiple sessions or administer the survey in short time periods across multiple days if survey fatigue is indeed the mechanism driving differential reporting, or to administer longer surveys aimed at getting respondents in the right state of mind if longer surveys provide respondents time to acclimate to the questionnaire.
Supplementary material
The supplementary material for this article can be found at https://doi.org/10.1017/esa.2025.7.
Acknowledgements
Authors are listed in reverse alphabetical order. The authors thank Raied Arman and Farhana Kabir for excellent assistance in coordinating the fieldwork and collecting the data. We also thank Bill Kinsey for comments and Jasmine Foo for her insights on misclassification and aggregation. The authors are also grateful to Lionel Page, our editor at the Journal of the Economic Science Association, along with two anonymous referees for providing constructive comments on a previous version of this paper. This project is funded by the WEE-DiFine Initiative at the BRAC Institute of Governance and Development. All remaining error are ours.
Competing interests
None of the authors has any conflict of interest to declare.




 Open access

