


1. Introduction
The uppermost mantle and the brittle–viscous transition (BVT) in the crust are generally considered the strongest parts of the continental lithosphere (e.g. Brace & Kohlstedt, Reference Brace and Kohlstedt1980; Handy & Brun, Reference Handy and Brun2004; Chen et al. Reference Chen, Hung, Tseng, Brudzinski, Yang and Nowack2012). Moreover, the BVT and the uppermost viscous zone might be the only depth region where strong faults exist in the crust (Behr & Platt, Reference Behr and Platt2014; Hirth & Beeler, Reference Hirth and Beeler2015). Hence, understanding the processes that govern rock strength at this depth region is critical for building accurate models of plate-boundary mechanics and seismogenesis (e.g. Platt & Behr, Reference Platt and Behr2011 a; Montési, Reference Montési2013; Behr & Platt, Reference Behr and Platt2014; Mulyukova & Bercovici, Reference Mulyukova and Bercovici2019). Unfortunately, brittle–viscous fault processes in many crustal rocks cannot be accurately reproduced in laboratory experiments because the temperatures needed to enable viscous creep at laboratory strain rates exceed the stability range of most hydrous minerals. It also is difficult to reach large strains and reproduce the combined effects of episodic seismogenic slip and interseismic creep in laboratory experiments. Therefore, case studies of naturally deformed rocks remain an essential tool for understanding rock deformation and the evolution of faults at the BVT and in the uppermost viscous zone.
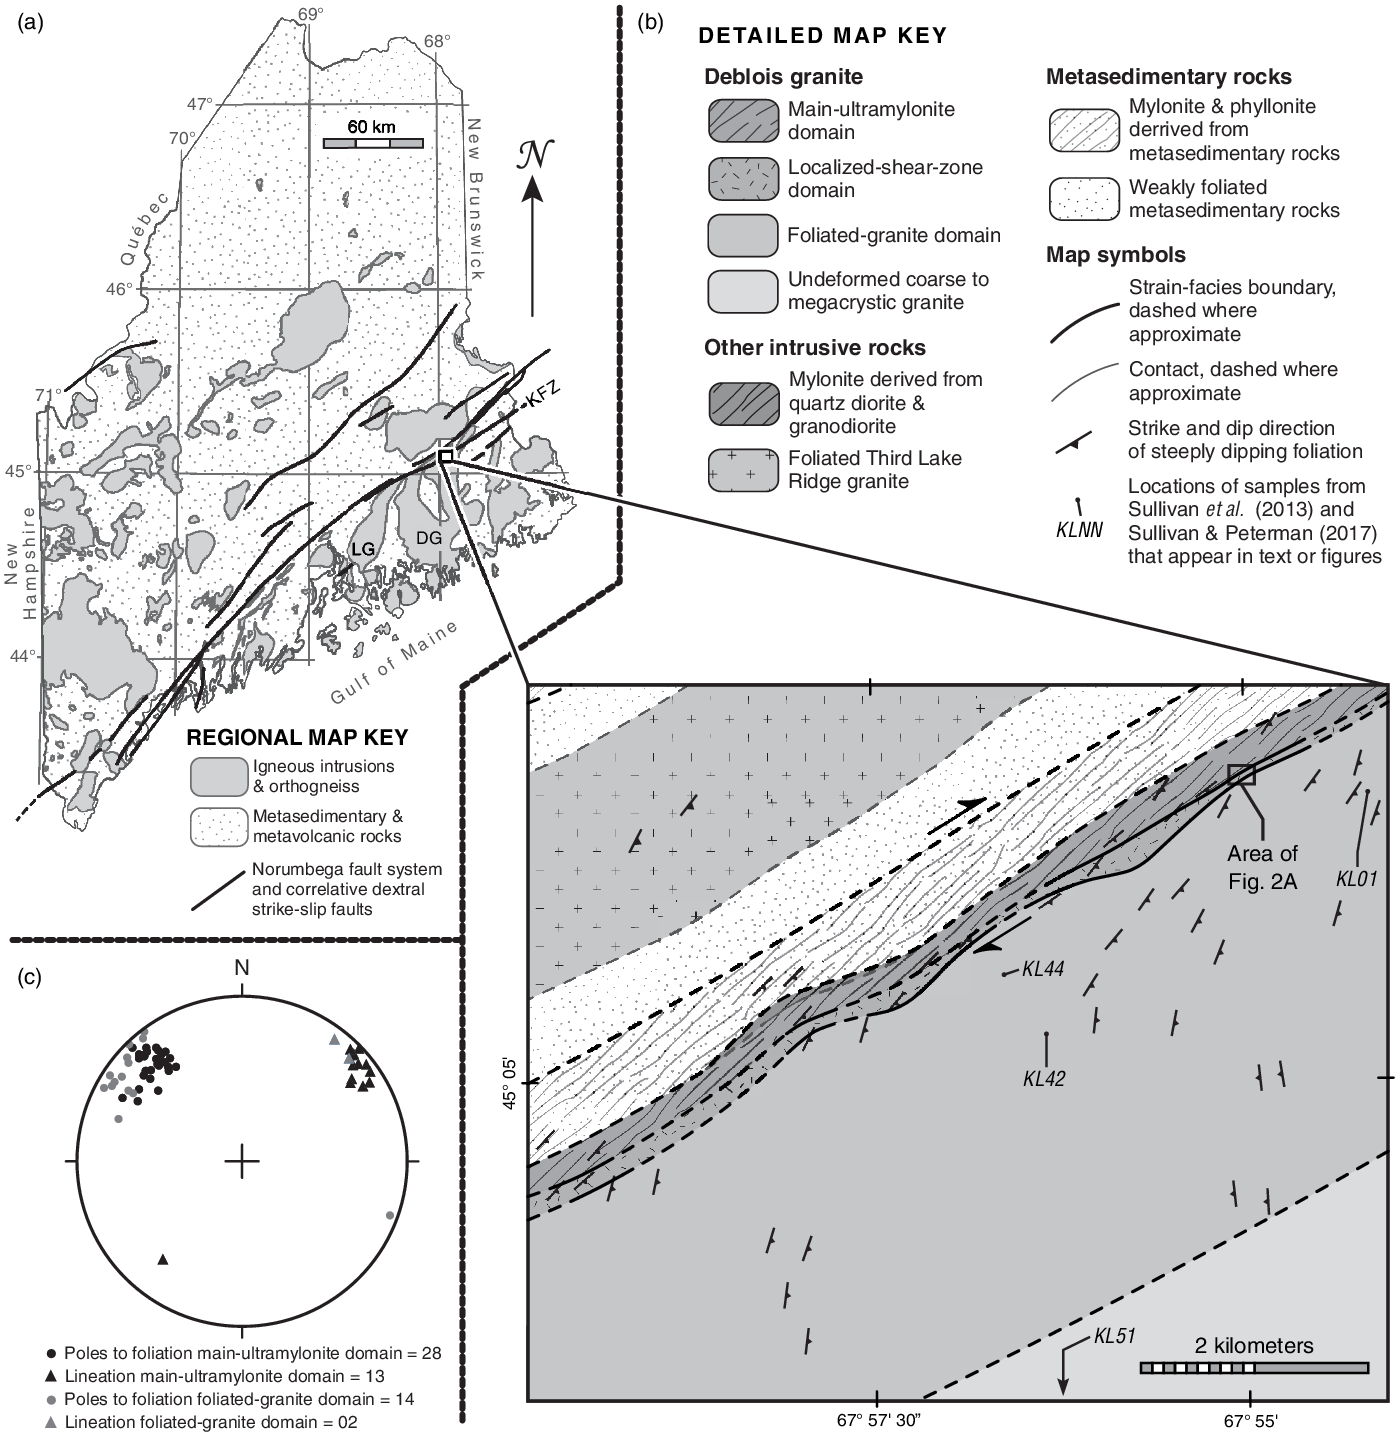
The Kellyland fault zone (KFZ) in eastern Maine provides an excellent natural laboratory to study the interaction of brittle and viscous deformation processes in an evolving crustal-scale, strike-slip fault zone (e.g. Ludman, Reference Ludman1998; Ludman & Gibbons, Reference Ludman, Gibbons, Ludman and West1999; Sullivan et al. Reference Sullivan, Boyd and Monz2013; Sullivan & Monz, Reference Sullivan and Monz2016; Sullivan & Peterman, Reference Sullivan and Peterman2017). The NE-striking KFZ juxtaposes low-grade metasedimentary rocks with coarse-grained granite for much of its length (Ludman & Berry, Reference Ludman and Berry2003; Wang & Ludman, Reference Wang and Ludman2004). In the present study area, granite cut by the KFZ exhibits three distinct strain facies that record different phases in the evolution of the fault zone (Sullivan et al. Reference Sullivan, Boyd and Monz2013; Sullivan & Monz, Reference Sullivan and Monz2016). From SE to NW across strike these are (1) a 2–3 km wide belt of variably foliated granite called the foliated-granite domain, (2) a 50–300 m wide band of variably foliated granite cut by numerous 0.5–100 cm wide mylonitic shear zones and coeval brittle shear fractures called the localized-shear-zone domain, and (3) a 200–400 m wide band of ultramylonite and minor mylonite derived from granite called the main-ultramylonite domain (Fig. 1) (Sullivan et al. Reference Sullivan, Boyd and Monz2013). Foliated-granite wall rocks throughout the localized-shear-zone domain host pervasive networks of healed microfractures that likely record dynamic pulverization (Sullivan & Peterman, Reference Sullivan and Peterman2017). Bands of pulverized rocks in the upper crust extending tens to hundreds of metres from fault cores record propagation of large-magnitude earthquake ruptures (e.g. Ben-Zion & Shi, Reference Ben-Zion and Shi2005; Xu & Ben-Zion, Reference Xu and Ben-Zion2017). Therefore, the KFZ likely experienced large-magnitude earthquakes with ruptures nucleating at or propagating to the present depth of exposure.
(a) Simplified bedrock map of Maine, USA, showing the Norumbega fault system and correlative dextral strike-slip faults. DG – Deblois granite; LG – Lucerne granite; KFZ – Kellyland fault zone. (b) Geologic map of the study area showing strain facies in the KFZ and sample locations. Exact location of KL51 shown in figure 2 of Sullivan et al. (Reference Sullivan, Boyd and Monz2013). (c) Measurements of foliation and lineation from the area of (b). Maps modified from Sullivan & Peterman (Reference Sullivan and Peterman2017). Geology compiled from Osberg et al. (Reference Osberg, Hussey and Boone1985), Goldstein & Hepburn (Reference Goldstein, Hepburn, Ludman and West1999), New Brunswick Department of Resources & Energy (2000), Ludman & Berry (Reference Ludman and Berry2003), Wang & Ludman (Reference Wang and Ludman2004), Hibbard et al. (Reference Hibbard, van Staal, Rankin and Williams2006), Wang (Reference Wang2007, Reference Wang2011, Reference Wang2020a,b) and Sullivan et al. (Reference Sullivan, Boyd and Monz2013). Foliation and lineation measurements from Sullivan et al. (Reference Sullivan, Boyd and Monz2013).
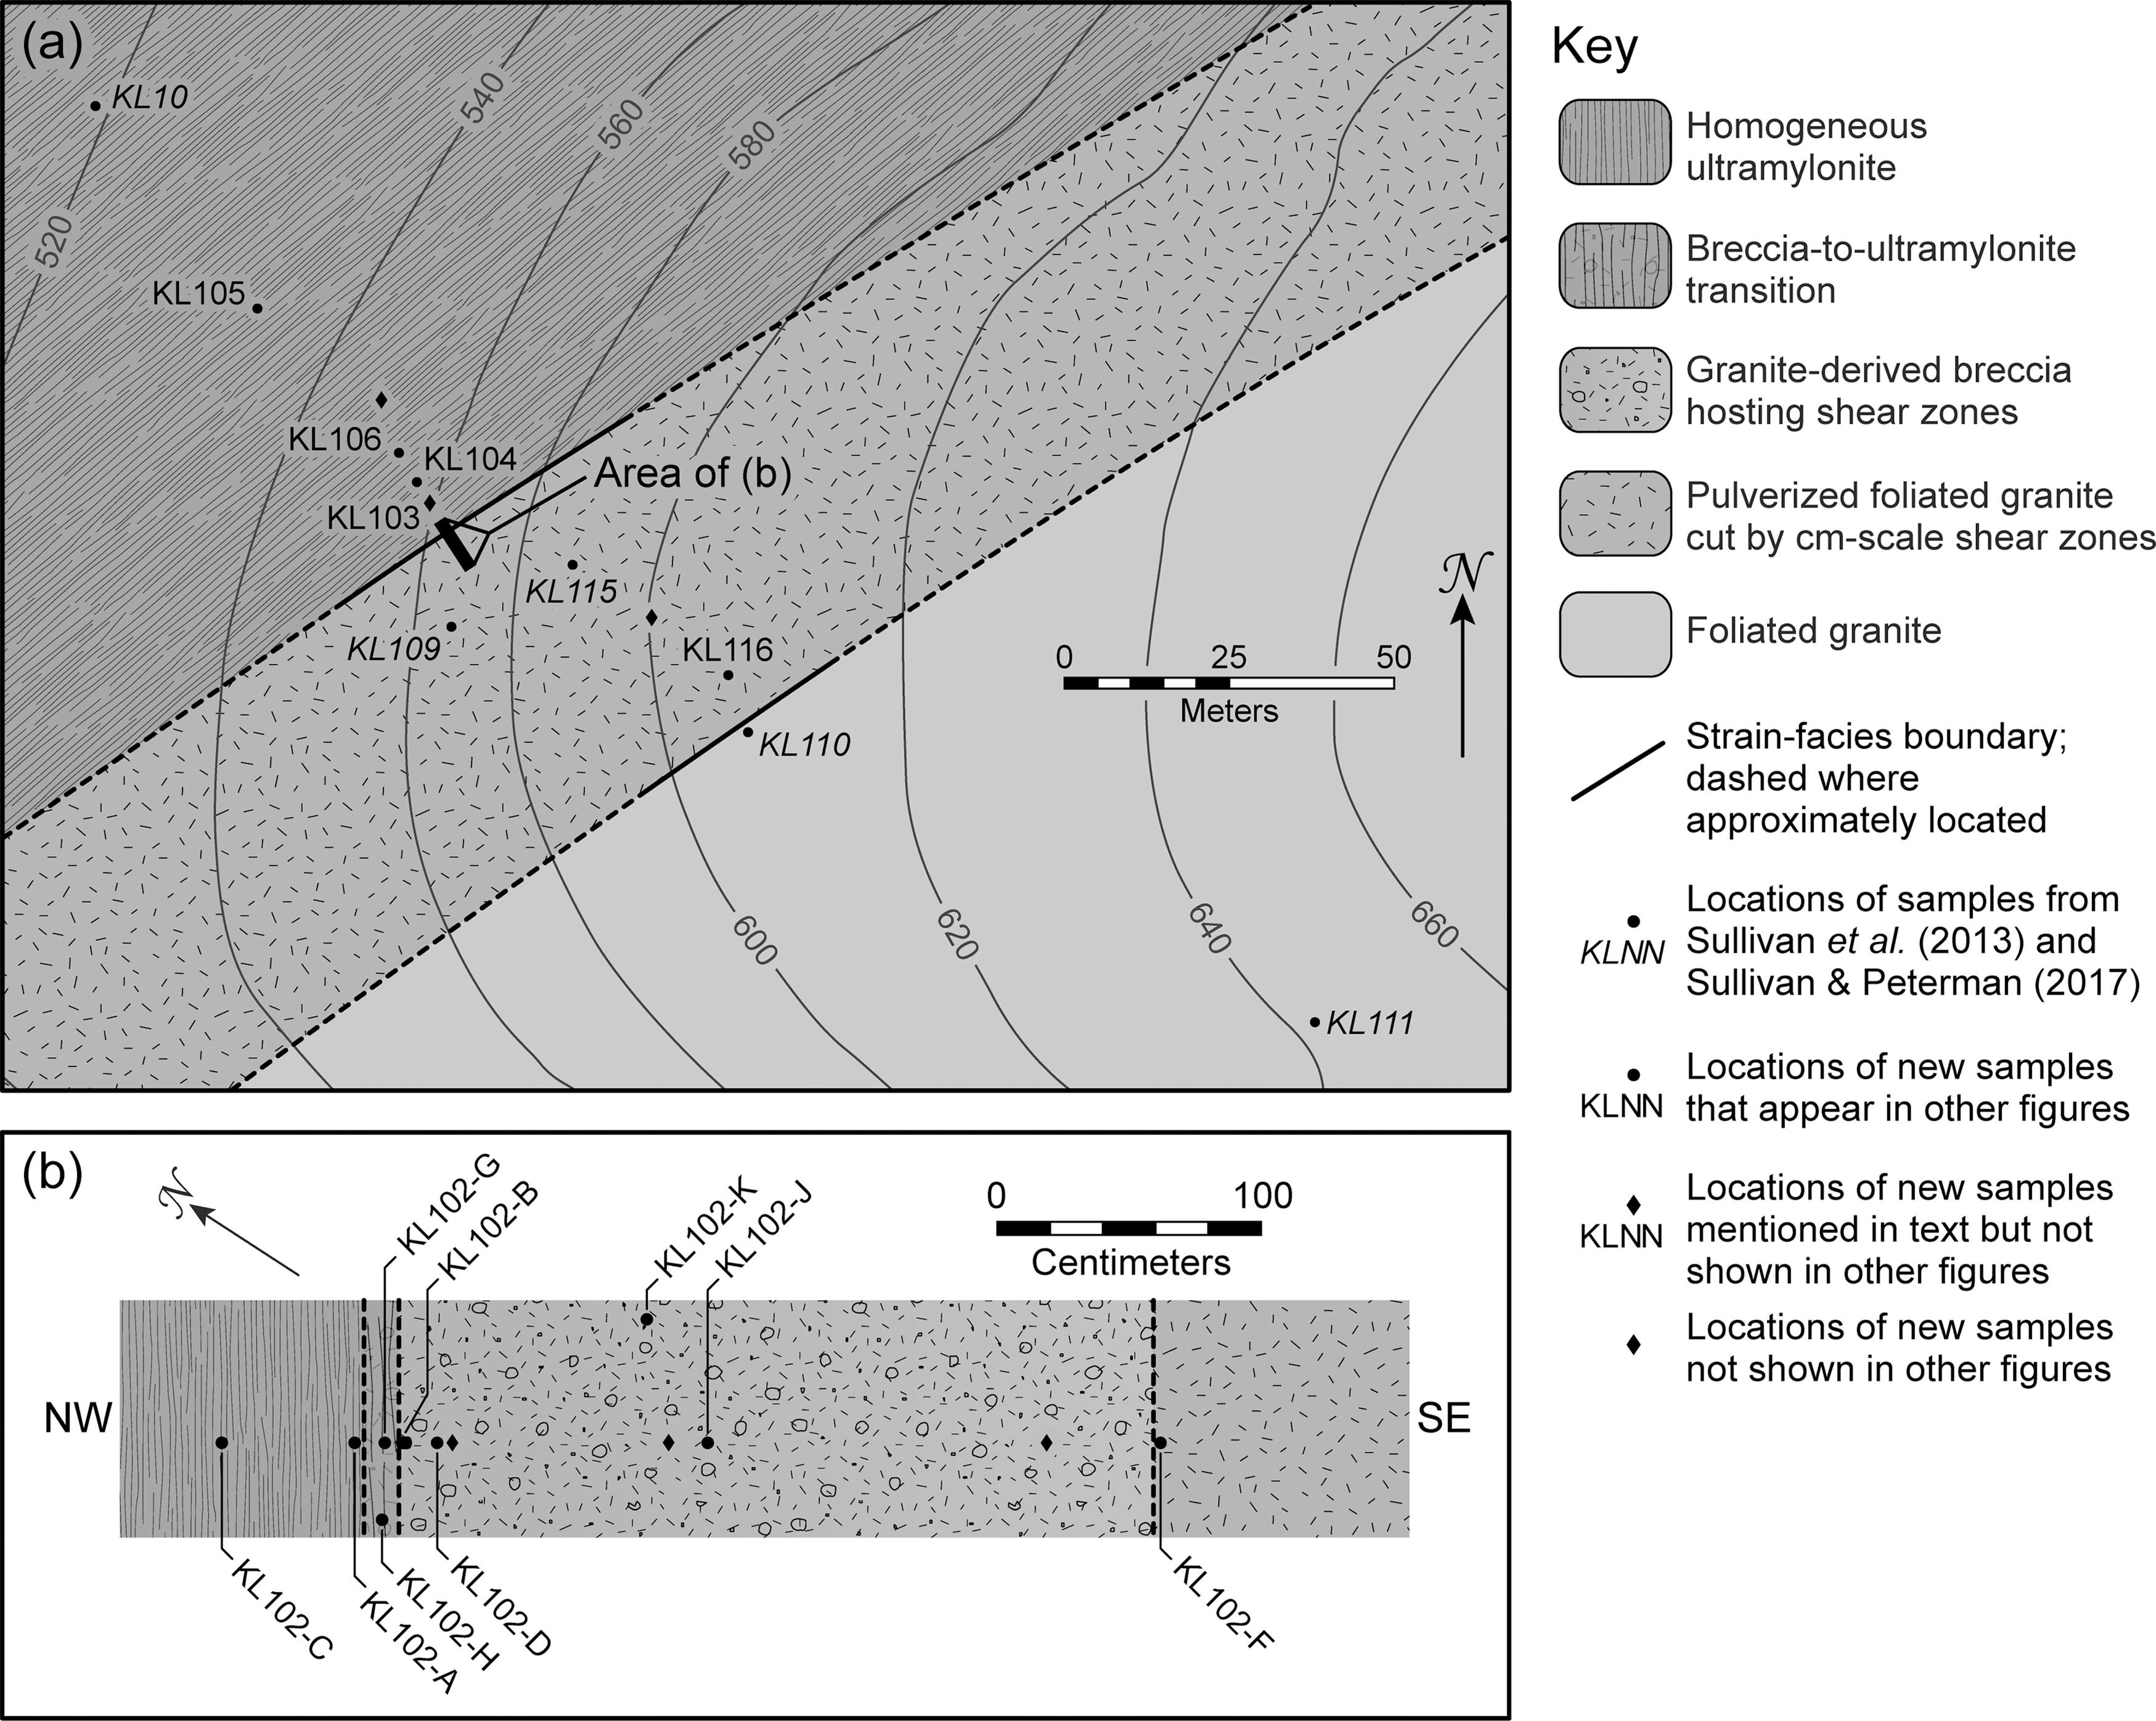
Mylonitic shear zones of the localized-shear-zone domain formed after brittle fault rocks (Sullivan et al. Reference Sullivan, Boyd and Monz2013), and the brittle precursors of these shear zones are coeval with pulverization of the wall rocks (Sullivan & Peterman, Reference Sullivan and Peterman2017). The clear overprinting relationships between brittle and viscous fault rocks in the localized-shear-zone domain, a lack of any significant change in bulk chemical composition across all three strain facies, the textural similarity of mylonitic rocks in the localized-shear-zone and main-ultramylonite domains, and a paucity of brittle structures cutting mylonitic rocks of the main-ultramylonite domain indicate that ultramylonite of the main-ultramylonite domain in the core of the KFZ also formed after brittle fault rocks and therefore may record brittle-to-viscous deformation weakening in a crustal-scale fault zone (Sullivan et al. Reference Sullivan, Boyd and Monz2013). This hypothesized brittle-to-viscous weakening may also have inhibited nucleation and/or propagation of earthquake-generating fault ruptures at this depth because mylonitic rocks overprint pulverized rocks throughout the localized-shear-zone domain (Sullivan & Peterman, Reference Sullivan and Peterman2017). In this article, we test the brittle-to-viscous-weakening hypothesis for granite cut by the KFZ and explore the role that pulverization may have played in forming ultramylonites of the main-ultramylonite domain using an extensive suite of samples collected from a set of nearly continuous outcrops extending across the foliated-granite, localized-shear-zone and main-ultramylonite domains (Fig. 2).
(a) Geologic map of the present study area showing foliated-granite, localized-shear-zone and main-ultramylonite domains as well as locations of samples. (b) Strip map of site KL102 showing the distribution of rock types and sample locations across the SE margin of the main-ultramylonite domain.
2. Geologic setting
The KFZ is one of three primary strands of the Norumbega fault system in eastern Maine (Fig. 1). Like the modern San Andreas fault system, the Norumbega system formed parallel with a long-lived active margin (e.g. van Staal et al. Reference van Staal, Whalen, Valverde-Vaquero, Zagorevski, Rogers, Murphy, Keppie and Hynes2009; Hatcher, Reference Hatcher, Tollo, Bartholomey, Hibbard and Karabinos2010; Kuiper, Reference Kuiper2016), cuts many arc- and oceanic-affinity accreted terranes as well as plutonic rocks (e.g. Robinson et al. Reference Robinson, Tucker, Bradley, Berry and Osberg1998; Ludman & West, Reference Ludman, West, Ludman and West1999; Hibbard et al. Reference Hibbard, van Staal, Rankin and Williams2006) and offsets the seismic Moho (Costain et al. Reference Costain, Domoracki and Çoruh1990; Doll et al. Reference Doll, Domoracki, Costain, Çoruh, Ludman and Hopeck1996). Regional mapping and palinspastic reconstructions indicate that the KFZ accommodated at least 25 km of dextral strike-slip motion (Wang & Ludman, Reference Wang and Ludman2004). In the area of this study, the KFZ forms a bimaterial interface juxtaposing chlorite-grade metasedimentary rocks of the Flume Ridge Formation with the c. 384 Ma Deblois granite pluton (Fig. 1) (Wang & Ludman, Reference Wang and Ludman2004; Wang, Reference Wang2007). The Deblois granite has a relatively narrow 0.5–1 km wide contact areole south of the KFZ (Ludman et al. Reference Ludman, Wang, Gibbons, Idleman, Rasbury, Yates, Lux and Kelley2000; Riley, Reference Riley2004), and U–Pb crystallization and biotite 40Ar–39Ar cooling ages of granite near the study area are within error of each other (Idleman & Ludman, Reference Idleman and Ludman1998; Ludman et al. Reference Ludman, Lanzirotti, Lux, Wang, Ludman and West1999, Reference Ludman, Wang, Gibbons, Idleman, Rasbury, Yates, Lux and Kelley2000), indicating shallow emplacement and rapid cooling. High-temperature fabrics in the foliated-granite domain indicate that solid-state deformation along the KFZ immediately followed crystallization of the Deblois granite and correlative Lucerne granite plutons (Wang & Ludman, Reference Wang and Ludman2004; Sullivan et al. Reference Sullivan, Boyd and Monz2013).
3. Methods
3.a. Whole-rock powder X-ray diffraction and geochemical analyses
We conducted whole-rock powder X-ray diffraction (powder-XRD) analyses on ten samples from the present study area from which we could obtain at least 80 cm3 of fresh rock. Precise sampling of glaciated pavement-style outcrops in this area requires a portable core drill, and this limits sample size. The 80 cm3 minimum sample volume is sufficient for detection of the primary mineral phases, but does not allow precise quantification of mineralogy in coarse-grained rocks. We also analysed four 1 kg samples of foliated or undeformed granite from outside the present study area (KL01, KL42, KL44 and KL51) (Fig. 1) that were initially collected for whole-rock geochemical analyses (Sullivan et al. Reference Sullivan, Boyd and Monz2013). Samples selected for powder-XRD analyses were crushed and then processed into powders using a tungsten-carbide ball mill. Powders were analysed using a Bruker D2 Phaser powder X-ray diffractometer housed at Colby College. The instrument was equipped with a Cu source, a 1 mm divergence slit and a 2.5 mm Soller receiving slit. Data were collected using coupled 2θ/θ scans over a 5–75° 2θ range with 0.010° steps and a 0.500 second scan time at each step. The resulting diffraction patterns were processed by stripping Kα2 radiation using the default settings in Bruker’s DIFFRAC.EVA software. Likely mineral phases in each sample were identified with the ‘search match’ and ‘search by name’ functions in DIFFRAC.EVA using both the Crystallography Open Database (COD) and the International Centre for Diffraction Data (ICDD) PDF-4+ 2020 databases. The best-fit phases out of all likely candidates for each sample were selected by visual comparison. Three new samples from the present study area also were sent to Actlabs, Ontario, Canada for inductively coupled plasma (ICP) analysis of major and trace elements. These new geochemical data are combined with whole-rock geochemical data published by Sullivan et al. (Reference Sullivan, Boyd and Monz2013).
3.b. Microstructural analysis
Sixty-two thin-sections cut perpendicular to foliation and parallel with strike were prepared from samples from the present study area and undeformed-granite samples from outside the present study area. Samples were cut parallel with strike rather than parallel with mineral lineations because (1) foliation surfaces are not visible in drill-core samples and (2) most ultramylonite samples are S tectonites. Mineral lineations elsewhere in the KFZ are gently plunging (Fig. 1c; fig. 4 of Wang & Ludman, Reference Wang and Ludman2004). The ubiquitous presence of structures exhibiting dextral asymmetry on subhorizontal outcrop faces and in our thin-sections indicates that the vorticity-normal section is roughly parallel with the strike of foliation. All thin-sections were examined with a petrographic microscope, and 19 representative sections were chosen for high-resolution imaging using a scanning electron microscope (SEM). Most SEM imaging was carried out with a Tescan Vega-3 tungsten-filament SEM equipped with an Oxford Instruments energy dispersive spectroscopy (EDS) system housed at Bowdoin College. Full-thin-section back-scattered-electron (BSE) images of 11 thin-sections from nine samples were stitched together using the Tescan ‘image snapper’ tool. Additional high-resolution BSE and cathodoluminescence (CL) images of microstructures in these samples were collected using the instrument parameters and procedures for CL imaging outlined in Sullivan & Peterman (Reference Sullivan and Peterman2017). BSE images of ultramylonite samples KL102-A, KL102-C, KL104 and KL106 were collected with a Hitachi S-2700 tungsten-filament SEM equipped with an EDAX EDS system housed at Colby College.
The aggregation of high-atomic-mass phases (primarily biotite) visible in BSE images was quantified with the free program FRAGSTATS (McGarigal & Marks, Reference McGarigal and Marks1995; McGarigal, Reference McGarigal2015) using the clumpiness index (CI). FRAGSTATS calculates CI using the following relationships:
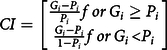 $$CI = \left[ {\matrix{ {{{{G_i} - {P_i}} \over {{P_i}}}f\,or\,{G_i} \ge {P_i}} \cr {{{{G_i} - {P_i}} \over {1 - {P_i}}}f\,or\,{G_i} \lt {P_i}} \cr } } \right]$$
where
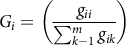 $${G_i} = \left( {{{{g_{ii}}} \over {\sum\nolimits_{k - 1}^m {{g_{ik}}} }}} \right)$$
P i is the proportion of the image occupied by pixels of class i, g ii is the number of like adjacencies between pixels of class i, and g ik is the number of unlike adjacencies between pixels of classes i and k based on the double-count method. We defined bright pixels corresponding to high-atomic-mass phases as class i, and all other pixels as class k. CI equals negative one when pixels of class i are maximally disaggregated (no pixel of class i is adjacent to another pixel of class i), zero when pixels of class i are randomly distributed and approaches one when all pixels of class i are aggregated in a single circle (McGarigal, Reference McGarigal2015). CI can only equal one if all pixels in a sample belong to class i. CI also is scale dependent, and higher-magnification images yield higher CI values for any given microstructure. Full-thin-section BSE scans were prepared for CI analysis by (1) cropping the images to eliminate as much of the non-rock regions as possible in a rectangle format, (2) ensuring that the epoxy surrounding the rock contained no bright pixels, and (3) reducing the pixel dimensions of full-thin-section images to a uniform value using the bicubic sharper resampling routine in Adobe Photoshop. Full-thin-section BSE scans were reduced in resolution so that the short dimension was 4314 pixels, parallel with the 27 mm width of the standard thin-sections. CI values from our full-thin-section scans should be considered estimates of the aggregation of high-atomic-mass phases because (1) the microstructure of coarse-grained samples cannot be precisely quantified in the area of one or two thin-sections, and (2) all of the full-thin-section images contain some pixels that are not rock. One-millimetre-wide images of fine-grained samples were collected with a long-axis dimension of 2048 pixels and analysed at their native resolution. Bright pixels in all images were isolated using the ‘threshold’ tool in Adobe Photoshop. Threshold values for each image were determined by visual inspection, because instrument parameters were optimized for each image area and sample.
The density and pattern of microfractures in select microcline grains was analysed following the methods of Sullivan & Peterman (Reference Sullivan and Peterman2017). In brief, fracture maps were generated by tracing overlaid colour-CL and BSE images in Adobe Illustrator. Length-weighted fracture orientations and density measurements were compiled from inventory circles using the MATLAB toolbox FracPaQ (Healy et al. Reference Healy, Rizzo, Cornwell, Farrell, Watkins, Timms, Gomez Rivas and Smith2017). FracPaQ only calculates fracture density as a function of the total area of square or rectangular images. Therefore, we determined the total length of fractures in each inventory circle and divided this sum by the area of the circle to obtain estimates of fracture density in mm/mm2. These are likely minimum values because (1) every sample contains some CL-dark regions of recrystallized microcline where fractures cannot be mapped, and (2) albite in these samples produces weak CL intensities relative to microcline and therefore some healed fractures cutting exsolution lamellae or albite inclusions are not visible.
Quartz recrystallized grain size was measured using transmitted-light microscopy. We chose this method over more precise SEM–electron backscatter diffraction (SEM-EBSD) mapping because (1) it enables precise selection of analysis areas in the few remaining nearly pure quartz domains in mylonitic samples, (2) it enables analysis of many more samples, and (3) the results are directly comparable with previously published results from elsewhere in the KFZ (Sullivan et al. Reference Sullivan, Boyd and Monz2013; Sullivan & Monz, Reference Sullivan and Monz2016). All thin-sections were examined to identify nearly pure quartz domains with the greatest proportion of recrystallized grains, because these regions should be closest to a steady state quartz microstructure (e.g. White, Reference White1976; Urai et al. Reference Urai, Means, Lister, Heard and Hobbs1986). Recrystallized grains are defined as optically distinct grains without visible subgrains. All areas selected for analysis were photographed at the same magnification under cross-polarized light with a one-lambda interference plate inserted. The lengths and widths of recrystallized grains were measured in two perpendicular directions using Nikon’s NIS Elements software, and the reported results for each grain are the mean of that grain’s length and width measurement. To avoid sample bias, every recrystallized grain visible in each image was measured, and each dataset includes measurements from at least two images of different regions in the same thin-section. All samples except KL111 likely contain a few recrystallized grains that are too small to resolve optically. Therefore, our results may slightly overestimate mean recrystallized grain sizes. We calculated the root mean square (RMS) of each grain-size dataset and applied the experimentally calibrated piezometer of Stipp & Tullis (Reference Stipp and Tullis2003) to estimate flow stress from these values. This piezometer is unaffected by water content (Stipp et al. Reference Stipp, Tullis and Behrens2006) and provides accurate results for rocks deformed at geologic strain rates (Kidder et al. Reference Kidder, Avouac and Chan2012). Holyoke & Kronenberg (Reference Holyoke and Kronenberg2010) proposed an apparatus correction for the Stipp & Tullis (Reference Stipp and Tullis2003) piezometer that yields significantly lower flow stresses for a given grain size. However, we prefer the original Stipp and Tullis piezometer, because it appears to give accurate results for naturally deformed rocks (Kidder et al. Reference Kidder, Avouac and Chan2012; also see discussion in Tokle et al. Reference Tokle, Hirth and Behr2019).
4. Data and observations
4.a. Field relationships
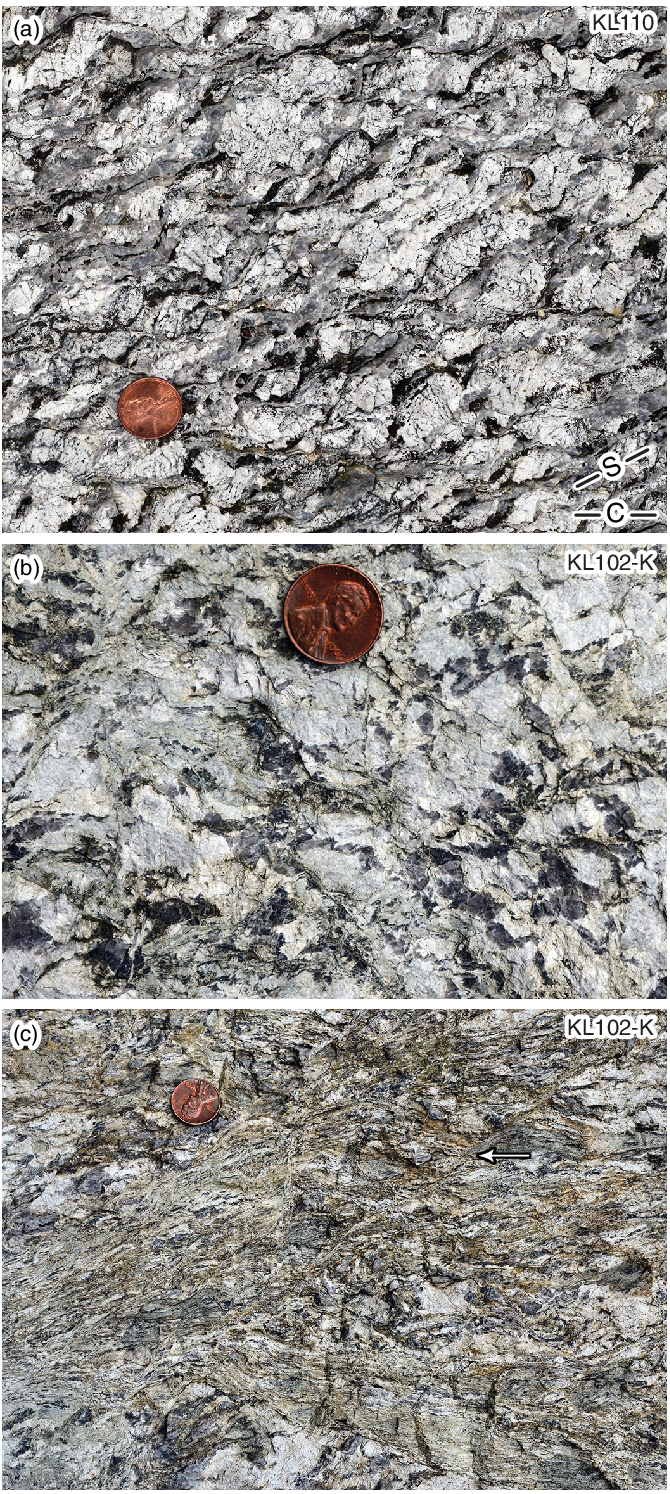
The present study area spans the foliated-granite, localized-shear-zone and main-ultramylonite domains of Sullivan et al. (Reference Sullivan, Boyd and Monz2013) (Fig. 2a). Rocks of the foliated-granite domain in this area exhibit a grain-shape foliation (S-surface) defined by elongated quartz and biotite grains and aligned tabular feldspar grains (cf. fig. 4 of Sullivan et al. Reference Sullivan, Boyd and Monz2013). Foliated granite at site KL110 near the SE margin of the localized-shear-zone domain exhibits dextral S-C fabrics (Fig. 3a). The 10–20 cm long C surfaces at site KL110 are defined by linked quartz and biotite ribbons. Some quartz ribbons in C surfaces can be traced continuously into elongated quartz grains that define the S surfaces. Therefore, the S and C surfaces at site KL110 likely formed during continuous simple-shear-dominated deformation (Lister & Snoke, Reference Lister and Snoke1984). Intact feldspar grains in the foliated-granite domain typically exhibit blocky weathering patterns controlled by the mineral cleavage (fig. 2c of Sullivan & Peterman, Reference Sullivan and Peterman2017).
Textures visible in outcrop. Coin used for scale is 1.8 cm in diameter. View for all images is straight down onto subhorizontal surfaces. (a) S-C fabrics indicating dextral motion at KL110. Note blocky, cleavage-controlled weathering of microcline grains. (b) Breccia at KL102-K. (c) Breccia-hosted shear zones at KL102-K. Arrow points to a discrete fault surface that merges with the shear-zone fabric towards the bottom left of the image and the breccia fabric towards the top right of the image.
The SE margin of the localized-shear-zone domain in the present study area is defined by the first appearance of centimetre-wide mylonitic shear zones and coeval brittle shear fractures cutting the foliated granite (cf. Sullivan et al. Reference Sullivan, Boyd and Monz2013). These mylonitic shear zones are distinct from the C surfaces at site KL110 because they often truncate individual quartz and biotite grains and contain fine-grained, polymineralic matrix (cf. Sullivan et al. Reference Sullivan, Boyd and Monz2013). The abundance of centimetre-scale mylonitic shear zones and shear fractures increases to the NW approaching the main-ultramylonite domain. However, the lichen and moss obscuring most outcrops makes quantifying the abundance of centimetre-scale shear zones and shear fractures difficult. Feldspar grains within the localized-shear-zone domain exhibit irregular, microfracture-controlled weathering patterns distinct from the blocky weathering patterns of the foliated-granite domain (cf. fig. 2b of Sullivan & Peterman, Reference Sullivan and Peterman2017). The shapes of primary felspar grains are preserved despite this pervasive microfracturing.
Pulverized foliated granite of the localized-shear-zone domain grades into a ∼2.8 m wide band of granite-derived breccia along the SE margin of the main-ultramylonite domain in the present study area (Fig. 2b). The breccia consists of 1–20 mm wide, angular quartz clasts in a matrix of comminuted feldspar and biotite that is white to light grey on weathered surfaces and charcoal grey on fresh surfaces. Primary grain shapes and foliations are completely overprinted in the breccia, and intact biotite masses are not visible (Fig. 3b). The map boundary between breccia and pulverized foliated granite is placed where the shapes of primary feldspar grains are recognizable in outcrop. The breccia also hosts many 0.5–15 cm wide, discontinuous, branching shear zones consisting of alternating 0.5–5 mm wide discontinuous layers of quartz and white-to-light-grey-weathering comminuted feldspar ± biotite (Fig. 3c). Similar banded shear-zone textures occur along gradational margins of mylonitic shear zones in the localized-shear-zone domain (cf. figs 6–8 of Sullivan et al. Reference Sullivan, Boyd and Monz2013). Unlike their counterparts in the localized-shear-zone domain, fabric elements in the breccia-hosted shear zones are often cut by discrete fault surfaces with millimetres to centimetres of separation. Many of these fault surfaces merge into the fabric of the surrounding breccia and/or the fabric of the breccia-hosted shear zones. Layered shear-zone fabrics also show synthetic drag along discrete fault surfaces that lie at high angles to foliation.
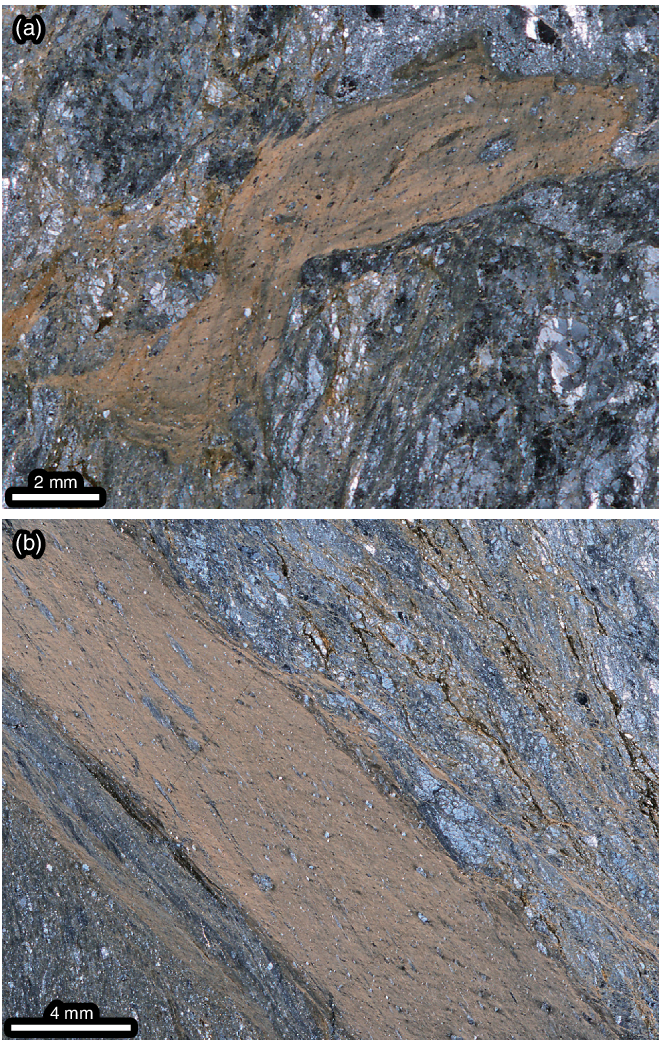
The breccia also is cut by at least two 2–20 mm wide, curviplanar zones of brownish-grey-weathering homogeneous ultramylonite. These zones exhibit at least one sharp boundary along their entire length that truncates quartz clasts in the breccia. The brownish-grey-weathering ultramylonite zones are spatially associated with 2–10 mm wide injection veins of compositionally similar material into the surrounding breccia, although we did not observe injection veins extending directly from ultramylonite zones. We interpret these features as recrystallized pseudotachylyte for three reasons: (1) the very fine-grained matrix of injection veins and brownish-grey-weathering ultramylonite is enriched in biotite relative to the bulk rock (Fig. 4), which is compatible with disequilibrium melting, (2) injection veins exhibit flow banding in thin-section (Fig. 4a), and (3) injection veins and brownish-grey-weathering ultramylonite contain rounded quartz and feldspar clasts similar to survivor clasts of refractory phases in pseudotachylyte (cf. Allen, Reference Allen1979; Price et al. Reference Price, Johnson, Gerbi and West2012; Kirkpatrick & Rowe, Reference Kirkpatrick and Rowe2013). The layered fabric of breccia-hosted shear zones typically exhibits synthetic drag when cut by the brownish-grey-weathering ultramylonite zones, and these composite shear zones also merge with the surrounding breccia fabric at their terminations.
Cross-polarized-light images of probable recrystallized pseudotachylyte in breccia sample KL102-E. (a) Injection vein hosted in breccia. Note the round quartz and feldspar clasts, abundance of biotite in the matrix and flow banding following the outline of the vein. (b) Brownish-grey-weathering ultramylonite zone. Note the elongated clasts and the abundance of biotite in the matrix.
Breccia-hosted shear zones become more abundant and form anastomosing networks surrounding pods of breccia within 50–80 cm of the main-ultramylonite domain, and they coalesce and grade into light-grey-weathering homogeneous ultramylonite of the main-ultramylonite domain over a 25 cm wide zone hereon called the breccia-to-ultramylonite transition zone (Fig. 2b). The strike of the steeply dipping foliation progressively changes from ∼030° to ∼045° from SE to NW across this transition zone as expected for the margin of a NE-striking, dextral, simple-shear zone (cf. Ramsay & Graham, Reference Ramsay and Graham1970). Ultramylonite is exposed almost continuously for ∼85 m across strike between the SE margin of the main-ultramylonite domain and site KL10 at the NW edge of the present study area (Fig. 2a). Sullivan et al. (Reference Sullivan, Boyd and Monz2013) recognized two ultramylonite facies in the KFZ (homogeneous ultramylonite and pinstripe ultramylonite) that grade into each other. Homogeneous ultramylonite constitutes ∼80 % of the outcrops in the present study area. Fresh faces are uniform charcoal grey, and weathered faces are light grey with sparse 0.5–1 mm wide medium-grey bands. Pinstripe ultramylonite consists of alternating 0.5–5 mm wide ribbons of (in order of abundance) comminuted feldspar + biotite, recrystallized quartz and recrystallized biotite. Both ultramylonite facies exhibit well-developed, NE-striking grain-shape foliations that consistently dip ∼70° to the SE in the present study area. An ∼80 cm wide body of granite-derived breccia is hosted within the ultramylonite at site KL105 (Fig. 2a). The fabric in this breccia and its contact relationships with the ultramylonite are similar to those at site KL102 along the SE margin of the main-ultramylonite domain except that it grades into pinstripe ultramylonite rather than homogeneous ultramylonite.
4.b. Whole-rock mineralogy and geochemistry
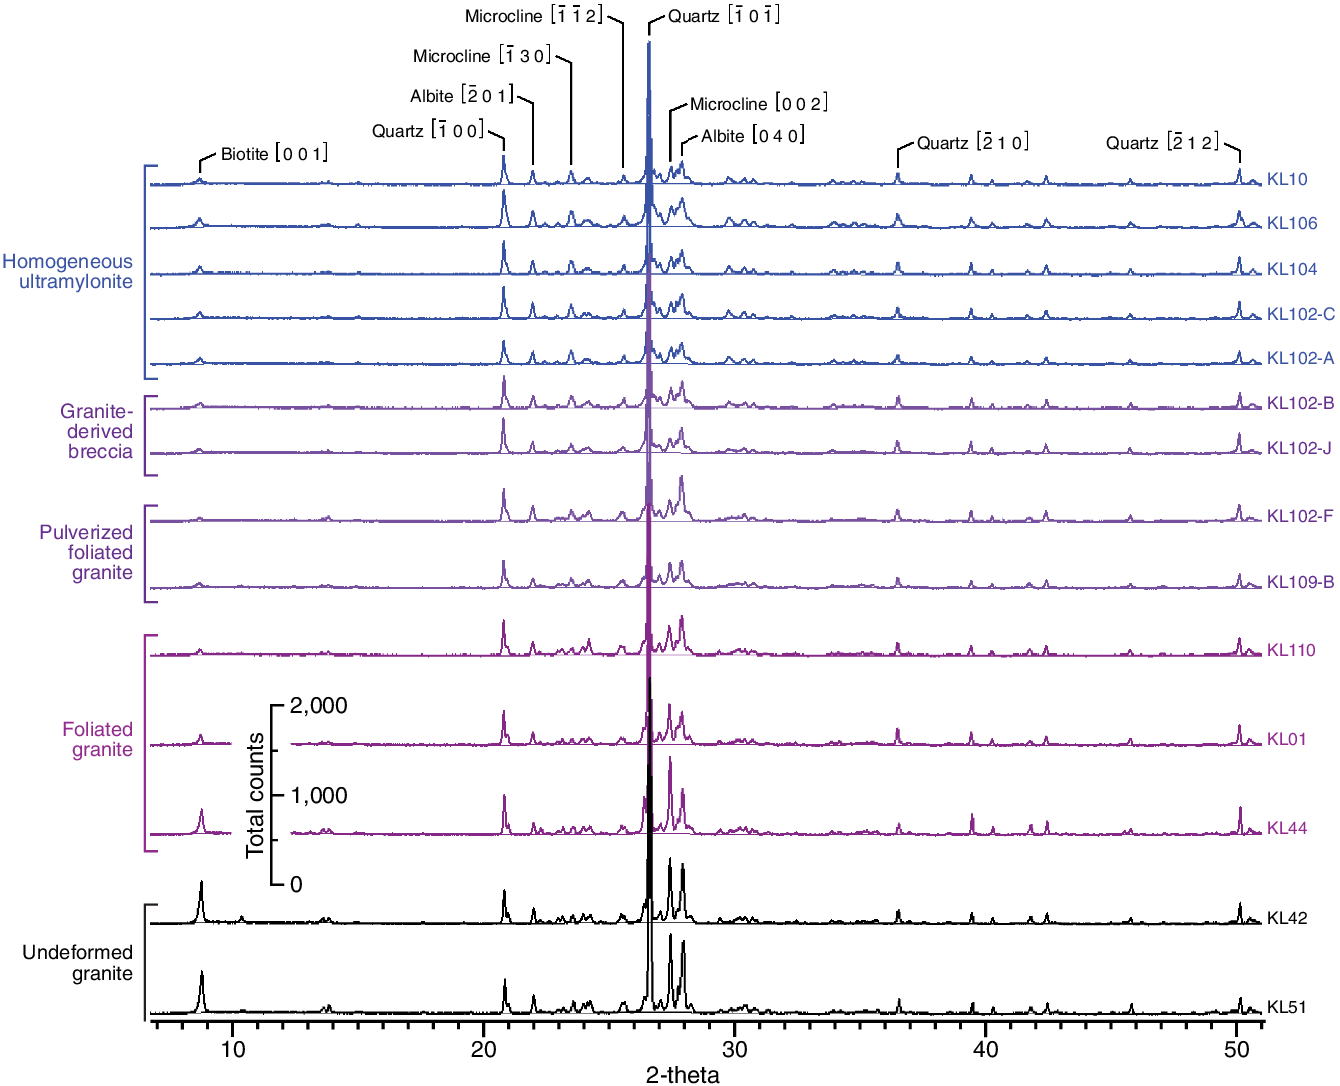
Powder-XRD patterns from across the present study area and from foliated- and undeformed-granite samples from outside the present study area reveal very little change in mineralogy. All samples yield prominent quartz, microcline and albite peaks (Fig. 5). However, the best-fit patterns for feldspar phases change systematically between strain facies (online Supplementary Material Table S1). The height of feldspar and quartz peaks systematically decreases approaching the main-ultramylonite domain, and the most prominent microcline and albite peaks become wider and less distinct (Fig. 5). Undeformed-granite samples and one foliated-granite sample also yield prominent biotite [001] peaks, but biotite peaks in all other deformed samples are 75–80 % smaller (Fig. 5). Nevertheless, thin-section observations show that biotite is abundant in these rocks, and it is the primary Fe-bearing phase in all samples. Undeformed-granite sample KL42 yields a small cordierite XRD peak, and minor ilmenite and apatite along with trace amounts of zircon and allanite are visible in all thin-sections of undeformed and foliated granite. All thin-sections of pulverized foliated granite, breccia and mylonitic rocks reveal minor titanite, epidote and apatite along with trace amounts of allanite and zircon. Minor calcite also is visible in some thin-sections of breccia and ultramylonite. A pinstripe-ultramylonite sample from site KL105 contains clots of randomly oriented chlorite grains that formed after all deformation ceased. The two homogeneous-ultramylonite samples and one breccia sample from the present study area selected for whole-rock geochemical analyses show no significant change in bulk chemical composition relative to undeformed granite (online Supplementary Material Table S2; Sullivan et al. Reference Sullivan, Boyd and Monz2013). The lack of change in major mineral assemblages and bulk-rock geochemistry across the present study area confirms Sullivan et al.’s (Reference Sullivan, Boyd and Monz2013) finding that there was no significant chemical alteration of granite-derived fault rocks across the KFZ.
Powder-XRD patterns from samples collected across the present study area and undeformed- and foliated-granite samples from outside the present study area. Strain facies are given on the left-hand side of the plot and sample locations on the right. Note that there is very little change in mineralogy across the present study area, which is consistent with Sullivan et al.’s (Reference Sullivan, Boyd and Monz2013) finding that there is no significant chemical alteration of granite-derived fault rocks across the KFZ.
4.c. Microstructure
4.c.1. Foliated-granite domain
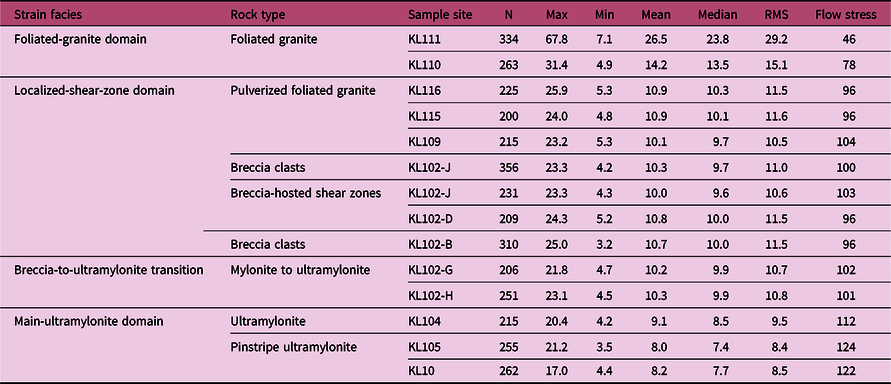
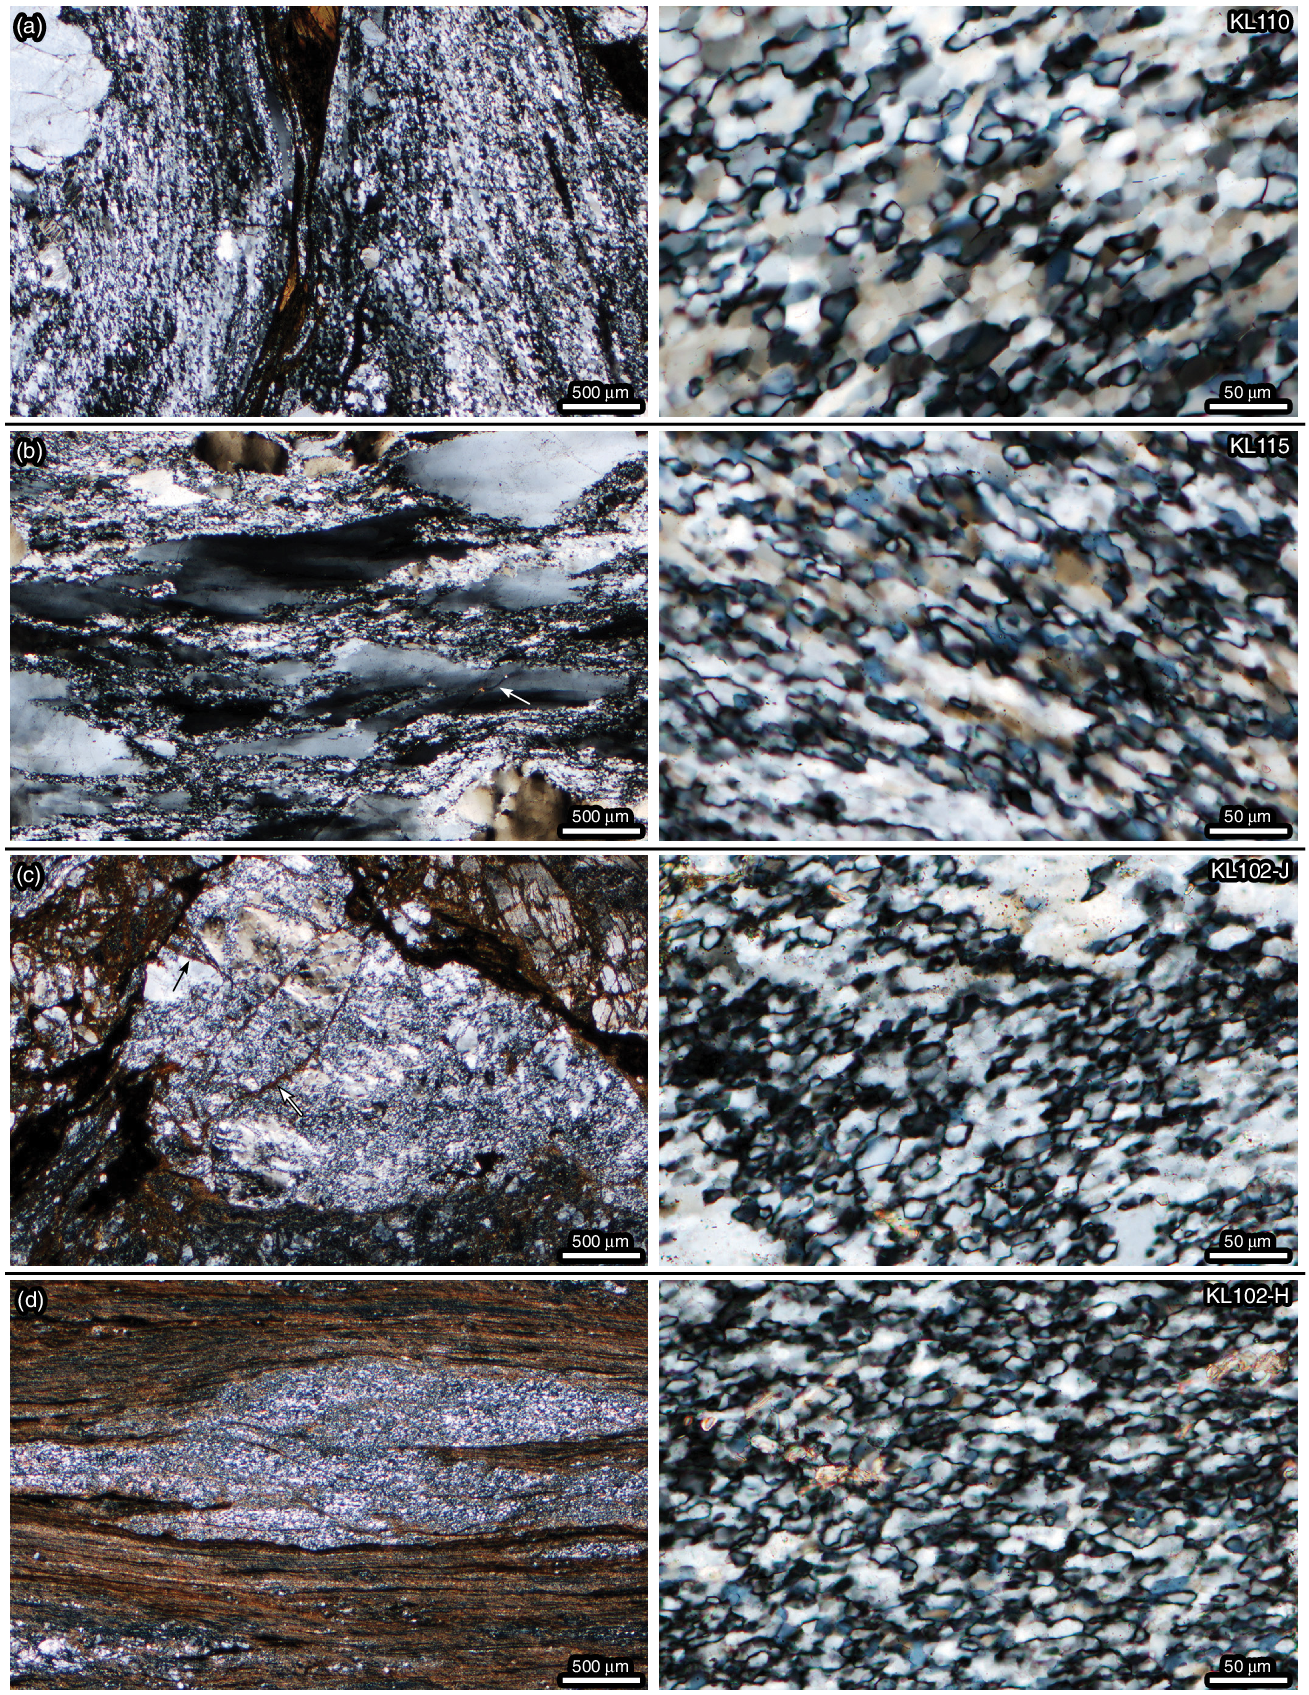
Textures in samples from the foliated-granite domain are nearly identical to those described by Sullivan et al. (Reference Sullivan, Boyd and Monz2013) and Sullivan & Peterman (Reference Sullivan and Peterman2017). In brief, microcline grains typically exhibit patchy to sweeping undulose extinction with myrmekite replacement along many grain boundaries. Microcline also hosts 20–100 μm wide, planar-systematic dilational fractures filled with quartz, microcline, biotite and/or albite that lie at high angles to foliation (figs 5b, 7g of Sullivan & Peterman, Reference Sullivan and Peterman2017). Nevertheless, primary perthitic exsolution lamellae remain well preserved in foliated-granite samples (figs 6b, 7e, g of Sullivan & Peterman, Reference Sullivan and Peterman2017). Albite grains exhibit patchy to sweeping undulose extension and cleavage-controlled fractures (Fig. 6b). Quartz in foliated-granite samples from the present study area is almost entirely recrystallized and forms aggregates of semi-polygonal to irregularly shaped grains (fig. 7a, f of Sullivan & Peterman, Reference Sullivan and Peterman2017). Sparse relict grains within recrystallized quartz bands exhibit subgrains the same size and shape as adjacent recrystallized grains. Some larger, irregularly shaped quartz grains in sample KL111 (collected furthest from the centre of the KFZ in the present study area) also host island grains that are optically continuous with neighbouring grains. Sample KL111 yields an RMS quartz recrystallized grain size of 29.2 μm corresponding to a flow stress of 46 MPa, and a C domain in sample KL110 yields an RMS recrystallized grain size of 15.1 μm corresponding to a flow stress of 78 MPa (Table 1). Biotite in these samples appears as elongated relict grains and fish with sweeping undulose extinction. Relict biotite grains are typically mantled by recrystallized grains, and C surfaces of KL110 host discontinuous ribbons of recrystallized biotite that do not form thorough-going networks. Despite the formation of biotite ribbons and biotite-filled fractures, high-atomic-mass phases in two thin-sections of foliated granite yield CI values of ∼0.89: only slightly lower than the CI value of 0.95 for undeformed-granite sample KL51 (Fig. 8).
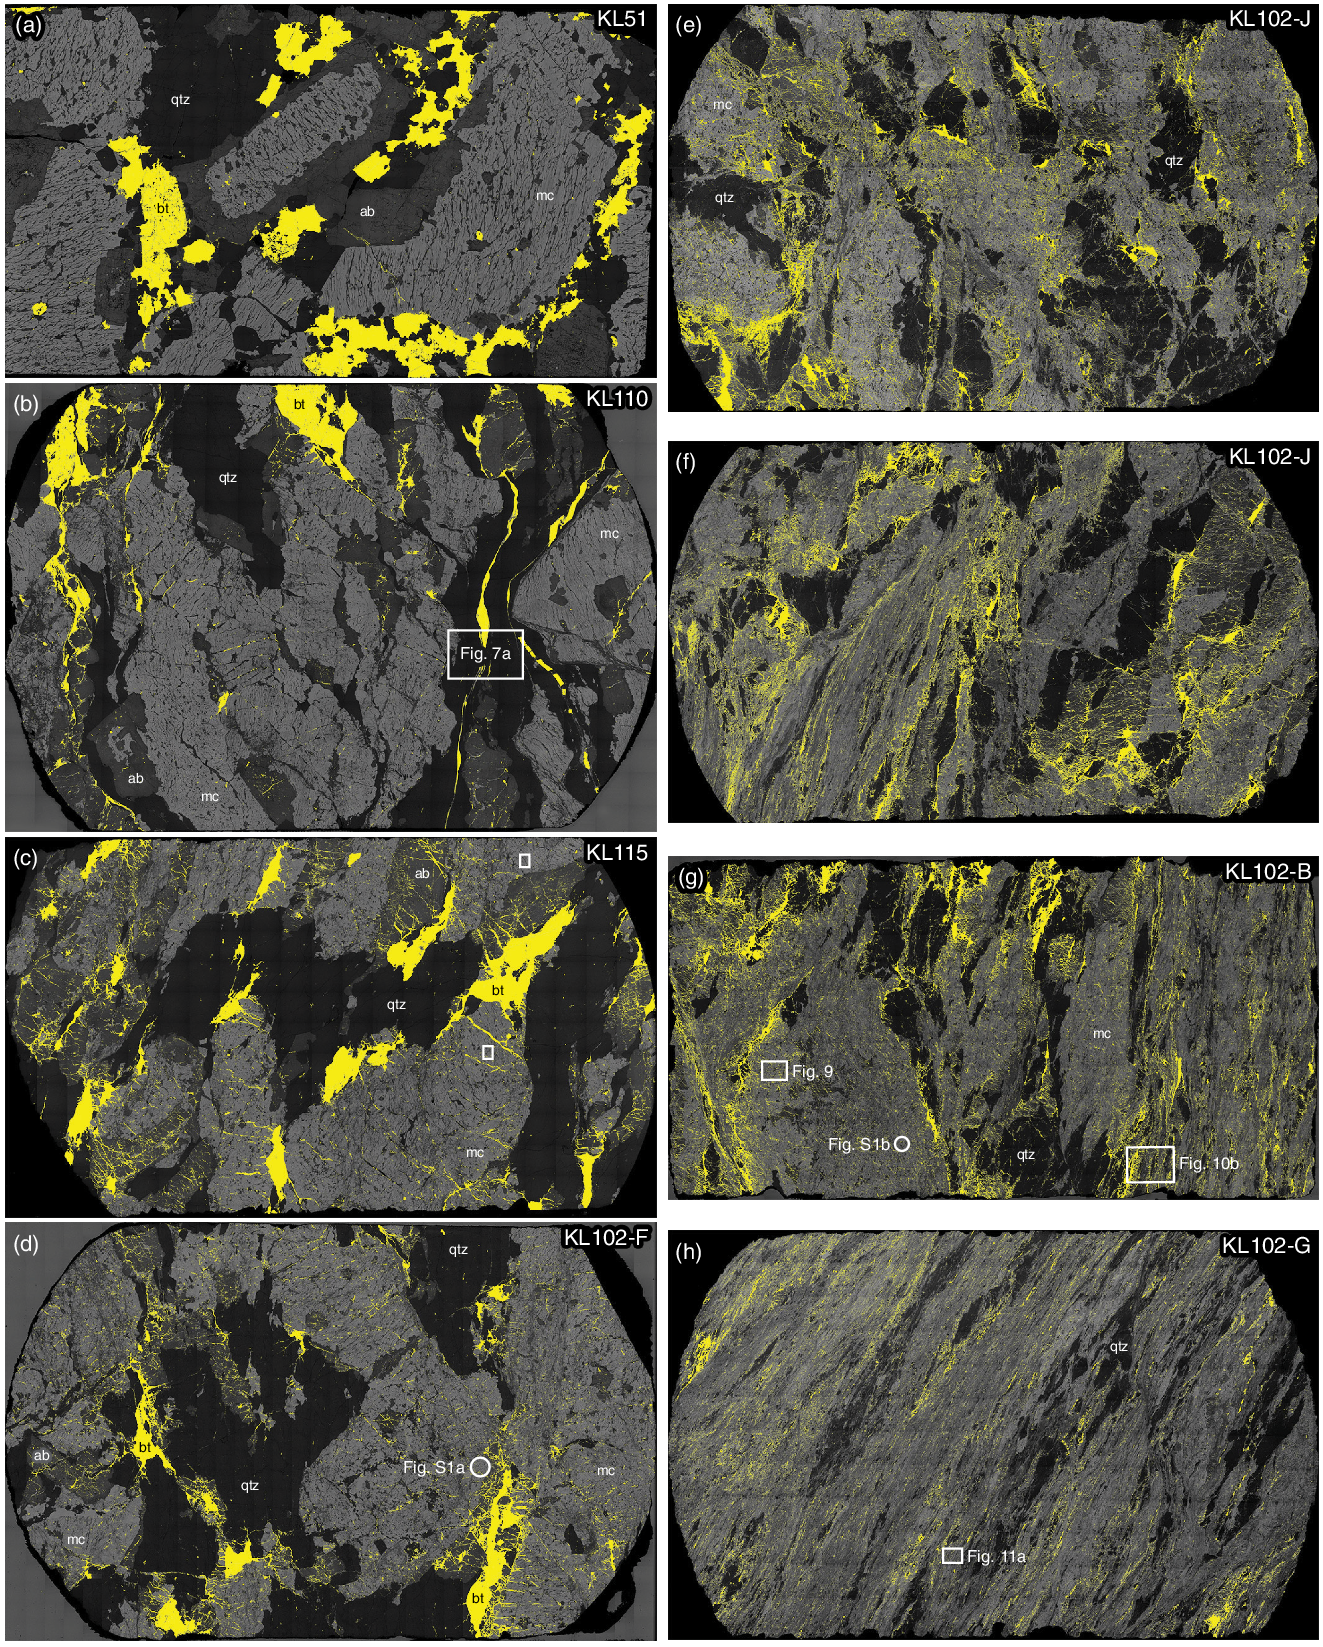
Full-thin-section BSE scans with high-atomic-mass phases used in the CI analysis rendered in yellow. All images are ∼25 mm in the short direction. Sample locations are given in the upper right-hand corner of each image. (a) Undeformed granite. See figure 6 of Sullivan & Peterman (Reference Sullivan and Peterman2017) for cross-polarized-light and CL images of this thin-section. (b) Foliated granite. See figure 7 of Sullivan & Peterman (Reference Sullivan and Peterman2017) for cross-polarized-light and CL images of this thin-section. (c, d) Pulverized foliated granite. Boxes in (c) show locations of fracture maps in figure 5 of Sullivan & Peterman (Reference Sullivan and Peterman2017). (e) Breccia. (f) Breccia-hosting tip of shear zone. (g) Contact between breccia on left and mylonite of a breccia-hosted shear zone on right. (h) Mylonite from the breccia-to-ultramylonite transition at the SE margin of the main-ultramylonite domain. Areas of images in Figures 8, 9, 10, 11 and online Supplementary Material Figure S1 are noted. Mineral abbreviations: ab – albite; bt – biotite; mc – microcline; qtz – quartz.
Two-dimensional quartz recrystallized grain-size distributions in μm and flow stresses in MPa calculated from RMS grain sizes using the Stipp & Tullis (Reference Stipp and Tullis2003) piezometer
4.c.2. Pulverized foliated granite of the localized-shear-zone domain
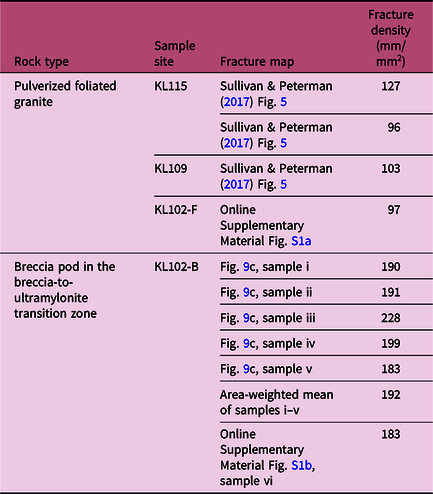
The microstructure of pulverized foliated granite of the localized-shear-zone domain is superficially similar to that of samples from the foliated-granite domain. However, even the most pristine microcline grains in these rocks host dense networks of 5–100 μm wide healed microfractures (online Supplementary Material Fig. S1; fig. 5 of Sullivan & Peterman, Reference Sullivan and Peterman2017). Most of these microfractures exhibit no offset and many are dilational and filled with (in order of abundance) CL-dark recrystallized microcline, plagioclase, biotite and/or quartz (Sullivan & Peterman, Reference Sullivan and Peterman2017). Microfracture populations measured in samples from sites KL115 and KL109 in the present study area all span a full 180°, but they also exhibit weak preferred orientations either parallel with (KL109) or perpendicular to (KL115) foliation (fig. 5 of Sullivan & Peterman, Reference Sullivan and Peterman2017). Measurements of average microfracture density in these samples range from 96 to 127 mm/mm2 (Table 2; Sullivan & Peterman, Reference Sullivan and Peterman2017). These pervasive microfractures significantly disrupt the primary textures of microcline grains, and perthitic exsolution lamellae are obscured or overprinted, even where original grain shapes and Carlsbad twinning are preserved. Feldspar grains in most pulverized-foliated-granite samples also are locally cut by 100–500 μm wide transgranular cataclastic shear zones marked by anastomosing bands of mixed 1–5 μm wide microcline + albite ± biotite grains. Elongated quartz grains in pulverized foliated granite exhibit distinct core–mantle recrystallization textures defined by bands of 5–25 μm wide, semi-polygonal neoblasts surrounding elongated relict grains with sweeping undulose extinction, basal deformation lamellae and subgrains the same size as adjacent recrystallized grains (Fig. 8b). Relict grains also host healed fractures visible as 5–20 μm wide curviplanar trails of neoblasts, CL-dark material and/or fine-grained biotite. Fractures cutting relict quartz grains are locally deformed where they cross into adjacent recrystallized zones, and fractures marked by trails of quartz neoblasts often merge with zones of recrystallized grains. RMS quartz recrystallized grain sizes in three samples from across the localized-shear-zone domain range from 10.5–11.6 μm corresponding to flow stresses of 96–104 MPa (Table 1). The remnants of primary biotite grains and biotite ribbons in pulverized-foliated-granite samples consist of small masses of relict grains with sweeping undulose extinction surrounded by fine-grained recrystallized biotite. Fracture arrays filled with recrystallized biotite radiate outwards from most masses of relict biotite grains into adjacent albite grains (Fig. 6c). Three thin-sections from samples collected at sites KL109 and KL115 yield CI values of 0.88 to 0.94, comparable with CI values from foliated- and undeformed-granite thin-sections (Fig. 8).
Microfracture density in microcline
Pairs of cross-polarized-light images showing representative quartz textures from across the present study area. The right-hand images show parts of the left-hand images at ten-times greater magnification. (a) Part of a C domain with recrystallized quartz and biotite from site KL110. (b) Part of an elongated quartz grain in a pulverized-foliated-granite sample from site KL115. Arrow in left-hand image highlights biotite-filled fracture that is offset across the boundaries of a relict quartz grain. (c) Quartz clast in breccia from site KL102-J. Albite fragments in a network of biotite-filled fractures are visible in the top-right corner of the low-magnification image, and matrix consisting of comminuted feldspar + biotite is visible in the bottom of this image. Arrows in left-hand image highlight biotite-filled fractures cutting the quartz microstructure. (d) Folded and boudinaged quartz band in ultramylonite from the breccia-to-ultramylonite transition zone at site KL102-H. Note that biotite grains in the matrix surrounding the quartz body are uniformly bright because the polarizers are inclined at 30° to the foliation.
CI values for high-atomic-mass phases (primarily biotite) versus distance across strike from the SE margin of the main-ultramylonite domain. Data are separated by image class: full-thin-section BSE scans and 1 mm wide images of mylonitic matrix. Both image types were analysed for samples KL102-G and KL102-H. We analysed four 1 mm wide images of homogeneous-ultramylonite samples and three 1 mm wide images of KL102-G and KL102-H, but some results are so close that they are not resolvable on the plot. Some of the full-thin-section images used in the CI analysis are shown in Figure 6, and some of the 1 mm wide images are shown in Figure 11. The corresponding figure numbers are shown for these data points. Note that CI values in the foliated granite and pulverized foliated granite are similar to the undeformed-granite sample. This shows that foliation formation and pulverization did not significantly contribute to disaggregation of high-atomic-mass phases.
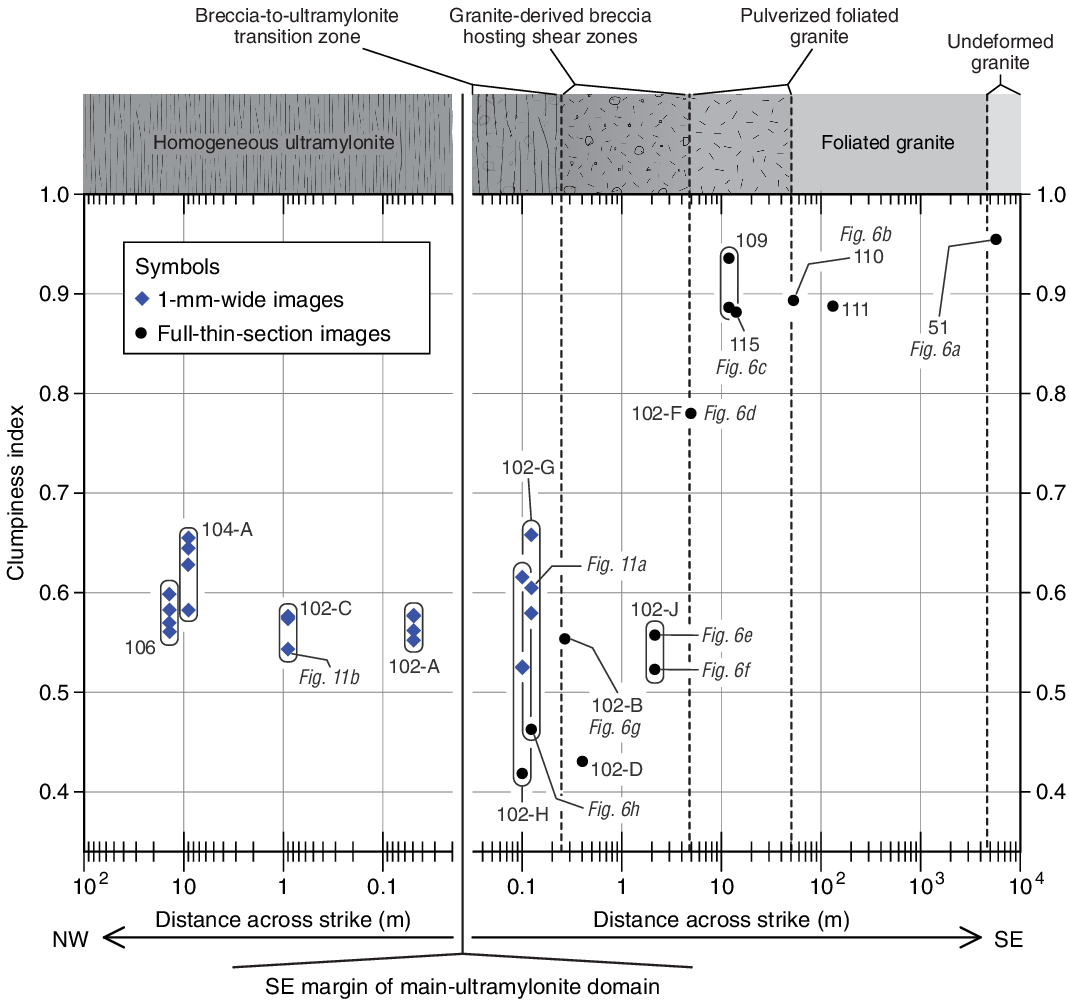
Pulverized-foliated-granite sample KL102-F was collected at the mapped contact between pulverized foliated granite and breccia (Fig. 2b). Quartz and feldspar microstructures in three thin-sections from this sample are similar to those visible in other pulverized rocks except that cataclastic shear zones cutting feldspar grains are more abundant. Microfractures mapped in one microcline grain in sample KL102-F also are distributed around a full 180°, but they exhibit preferred orientations in two directions that we attribute to cleavage control of fracturing (online Supplementary Material Fig. S1a). Microfracture density in this sample is 97 mm/mm2, within the range of values measured in pulverized-foliated-granite samples collected at sites KL109 and KL115 (Table 2). Biotite textures in sample KL102-F are noticeably more evolved from those in other pulverized-foliated-granite samples. Masses of relict biotite grains are smaller in all three thin-sections, and biotite-filled fracture arrays radiating from relict biotite grains are more pervasive in both albite and microcline (compare Fig. 6c and 6d). One thin-section from sample KL102-F yields a CI value of 0.78 confirming that biotite in this sample is less aggregated than in samples collected further from the centre of the KFZ (Fig. 7).
4.c.3. Breccia and breccia-hosted shear zones
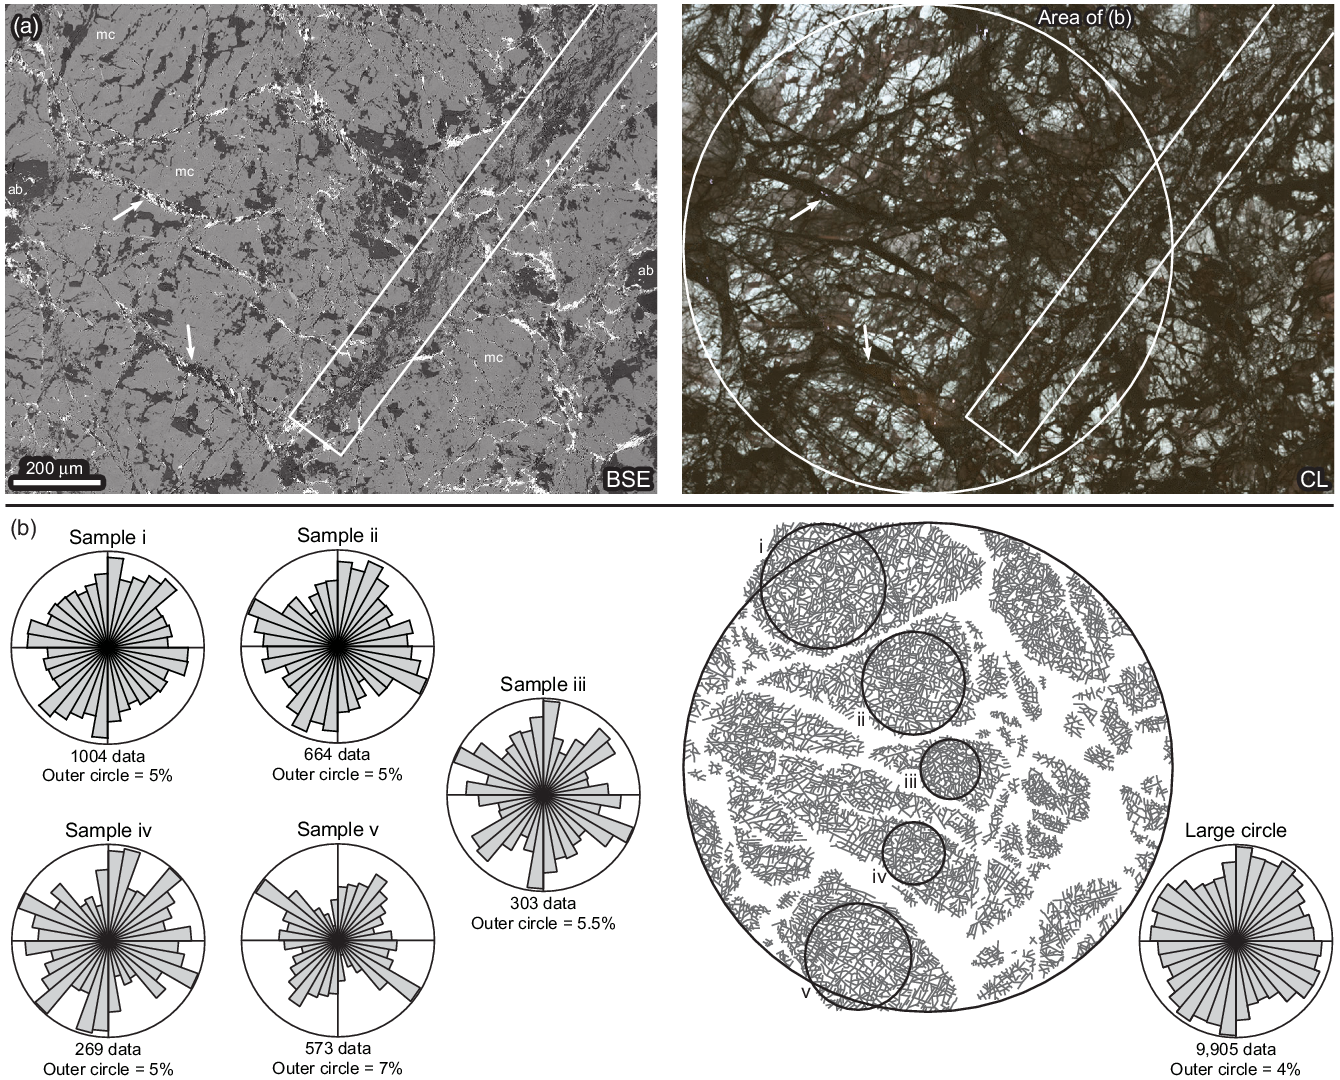
Microstructural features in the breccia are noticeably different from those in the pulverized foliated granite. Feldspar in these rocks primarily consists of 40–1000 μm wide angular clasts separated by dilational fractures filled with (in order of abundance) biotite, CL-dark recrystallized microcline, albite and quartz as well as 50–500 μm wide cataclastic shear zones marked by mixtures of 1–5 μm wide feldspar ± biotite grains (Figs 6e–g, 8c, 9a). Microcline clasts in breccia samples also host dense networks of randomly oriented healed microfractures similar to those in pulverized foliated granite of the localized-shear-zone domain (Fig. 9; online Supplementary Material Fig. S1b). Microfracture densities measured in individual microcline fragments in sample KL102-B collected near the SE margin of the breccia-to-ultramylonite transition zone (Fig. 2b) range from 183 to 228 mm/mm2 (Table 2). Quartz clasts in breccia preserve core–mantle textures defined by bands of 4–25 μm wide, semi-polygonal neoblasts surrounding relict grains with sweeping undulose extinction, basal deformation lamellae and subgrains the same size as adjacent recrystallized grains (Table 1; Fig. 8c). The boundaries of relict quartz grains are clearly truncated along clast margins and by biotite-filled fractures within the clasts (Fig. 8c). RMS quartz recrystallized grain sizes and resulting flow-stress values measured in breccia clasts are nearly identical to those measured in pulverized-foliated-granite samples (Table 1). Primary biotite grains are completely overprinted in the breccia, and most biotite is disseminated throughout the samples in arrays and networks of fractures (Figs 6e–g, 9). Recrystallized biotite in these samples typically appears opaque under transmitted light because it is so fine grained. CI values of high-atomic-mass phases in three thin-sections of breccia samples collected at sites KL102-J and KL102-B (Fig. 2b) range from 0.52 to 0.56 (Fig. 7). Finally, it also is important to note that rare 0.5–2 mm wide angular clasts of layered and foliated mylonitic material are visible in some thin-sections of breccia (online Supplementary Material Fig. S2).
Microstructure in a relatively intact microcline domain in breccia of sample KL102-B. (a) BSE and CL images of the same field of view. White arrows highlight dilational fractures separating angular microcline clasts. White rectangle highlights a small cataclastic shear zone. Circle outlines area of fracture maps in (b). Image location within the thin-section is shown in Figure 6g. Mineral abbreviations are the same as in Figure 6. (b) Map of microfractures within microcline clasts and rose diagrams showing fracture orientations relative to the images in (a). Sample sites for fracture-density measurements i–v (Table 2) also are shown.
Fabrics in branching, discontinuous shear zones are highly variable. The most evolved regions of these shear zones consist of 10–100 μm wide, discontinuous layers with varying concentrations of 1–5 μm wide microcline, albite and biotite grains; 5–30 μm wide ribbons of recrystallized biotite; and boudinaged and/or folded layers of partially to completely recrystallized quartz (Figs 6f, g, 10a). Less-evolved regions consist of 10–200 μm wide discontinuous layers of 1–20 μm wide feldspar ± biotite grains with some larger angular feldspar clasts; 5–50 μm wide ribbons of recrystallized biotite; and elongated pods and rounded clasts of partially recrystallized quartz (Figs 6f, 10b, c). Less-evolved shear-zone textures often grade into the chaotic fabric of the surrounding breccia both along and across strike (Figs 6f, g, 10b). Discrete fractures offsetting fabric elements in the shear zones are often overprinted by subsequent viscous deformation in the matrix (Fig. 10a). Quartz in boudinaged and/or folded layers in the most evolved regions of the breccia-hosted shear zones consists of masses of 4–24 μm wide, semi-polygonal recrystallized grains surrounding sparse elongated relict grains with sweeping undulose extinction and subgrains the same size as adjacent recrystallized grains. Quartz recrystallization textures in less-evolved regions of these shear zones are similar to those in adjacent breccia clasts, including truncation of relict grains along the margins of quartz pods. RMS quartz recrystallized grain sizes and the resulting flow-stress values measured in completely recrystallized boudinaged and/or folded quartz layers of two breccia-hosted shear zones are nearly identical to those measured in pulverized-foliated-granite and breccia samples (Table 1). One thin-section of a breccia-hosted shear zone in sample KL102-D yields a CI value of 0.43 (Fig. 7).
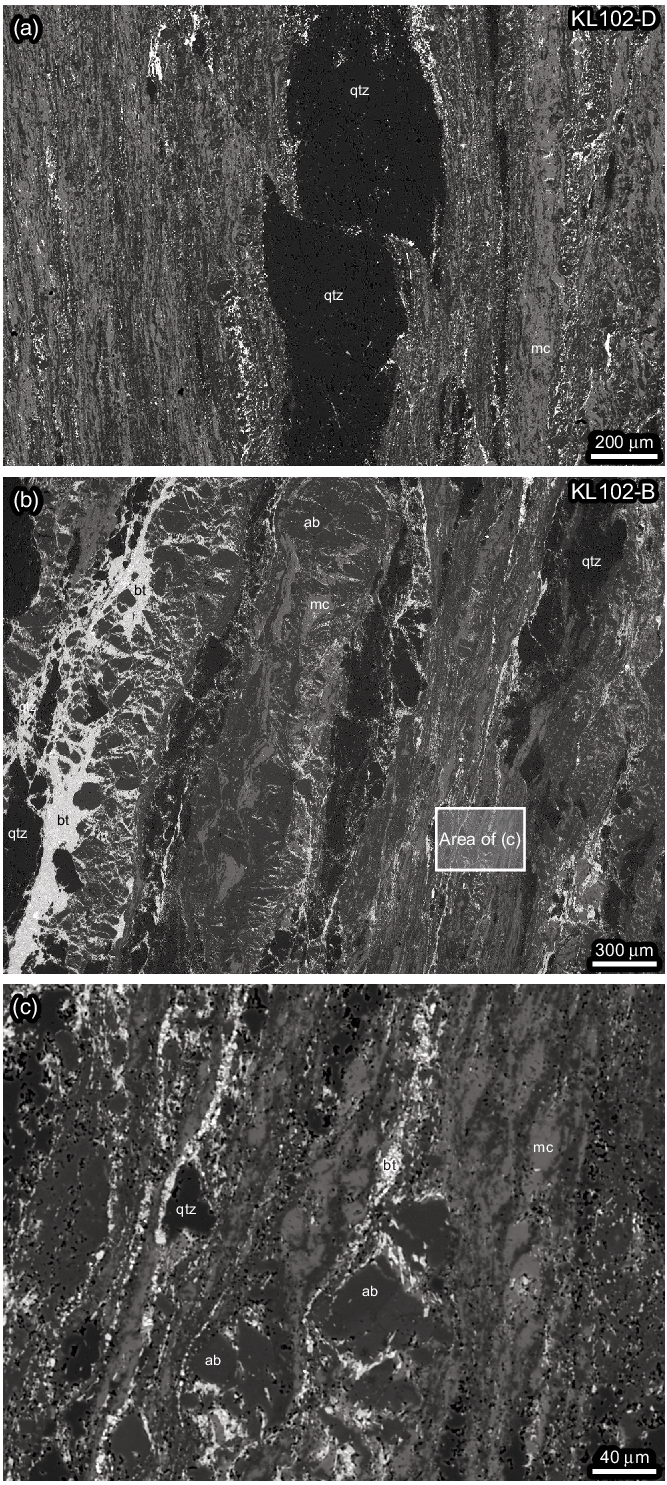
BSE images showing textures in breccia-hosted shear zones. (a) Fine-grained polyphase matrix and elongated quartz pod. The quartz pod is offset by a discrete fracture that is rotated by subsequent dextral simple shear in the surrounding matrix. (b) Transition from chaotic breccia fabric on left to mylonitic fabric defined by compositional layering on right. (c) High-magnification image of part of the mylonitic fabric in (b). Notice biotite grains hosted in dilational sites between albite fragments and the fine-grained matrix of microcline + albite ± biotite. Mineral abbreviations are the same as in Figure 6.
4.c.4. Breccia-to-ultramylonite transition zone and main-ultramylonite domain
Mylonitic rocks of the breccia-to-ultramylonite transition zone are texturally very similar to the more evolved regions of breccia-hosted shear zones (Figs 6h, 8d, 11a). The fabric in transition-zone mylonitic rocks also wraps around 1–20 mm wide pods of weakly foliated material similar to the less-evolved regions in the breccia-hosted shear zones (Fig. 6h). The fabric in the weakly foliated material typically grades into the more evolved mylonitic fabric over 0.5–5 mm. Near-simultaneous extinction and pleochroic transitions of biotite in the matrix of these samples reveal a pronounced alignment of biotite basal planes parallel with the foliation (Fig. 8d). Full-thin-section BSE images of samples KL102-G and KL102-H yield CI values of 0.46 and 0.42, respectively (Fig. 7), and 1 mm wide BSE images of the matrix in these samples yield CI values of 0.66 to 0.53 (Fig. 7) that reflect the variability of matrix textures and biotite concentrations (Figs 6h, 11a). Recrystallized quartz textures, grain-size distributions and the resulting flow stresses in completely recrystallized boudinaged and/or folded quartz layers in the breccia-to-ultramylonite transition zone are indistinguishable from those of the more evolved regions of the breccia-hosted shear zones (Fig. 8d; Table 1).
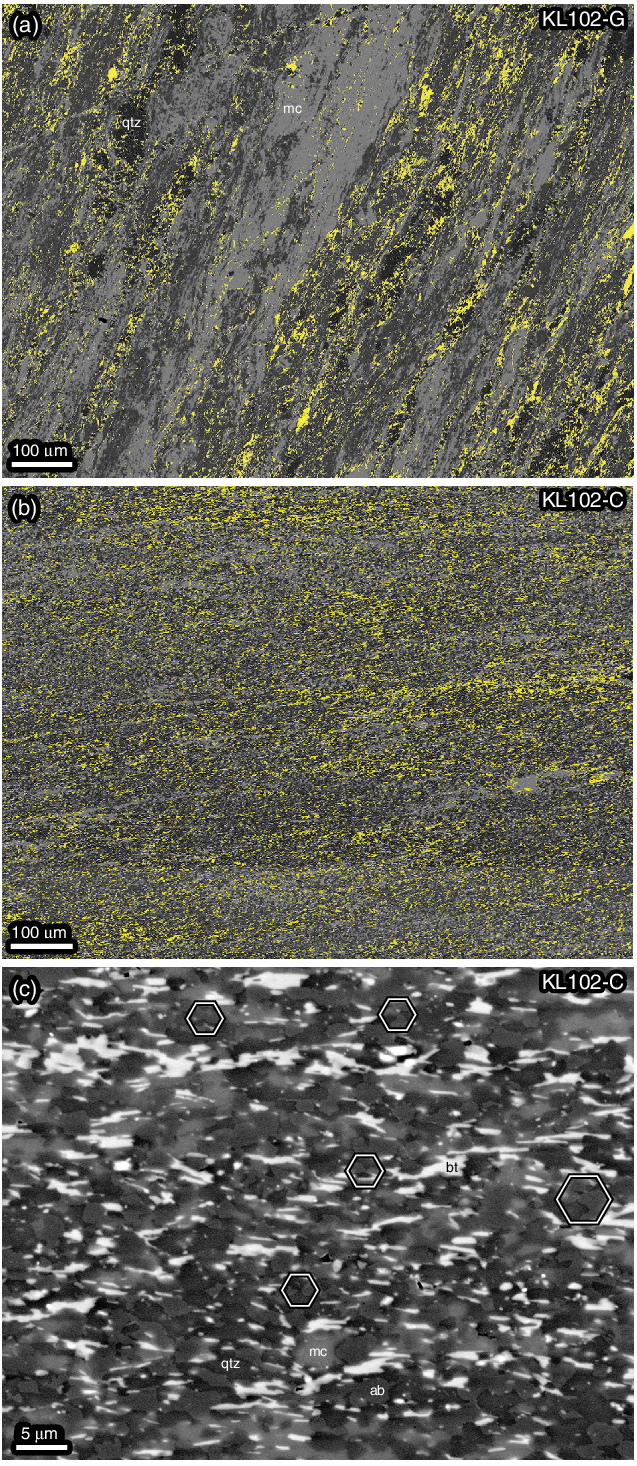
BSE images of samples from the breccia-to-ultramylonite transition zone and main-ultramylonite domain. (a) Mylonite sample KL102-G with discontinuous layered fabric from the transition zone. (b) Homogeneous-ultramylonite sample KL102-C of the main-ultramylonite domain. (c) High-magnification image of KL102-C. Polygons highlight four-grain junctions. High-atomic-mass phases in (a) and (b) used in the CI analysis are rendered in yellow. Mineral abbreviations are the same as in Figure 6.
Homogeneous-ultramylonite samples from the main-ultramylonite domain in the present study area primarily consist of variable mixtures of 0.5–5 μm wide microcline, albite, biotite and quartz grains with sparse 30–100 μm wide quartz and feldspar porphyroclasts (Fig. 11b, c). Microcline and albite grains in the matrix are semi-polygonal to irregular in shape, and grain boundaries of both feldspar phases often bulge into neighbouring feldspar grains (Fig. 11c). Quartz grains are generally polygonal to semi-polygonal in shape and rarely exhibit grain-boundary bulges with other phases. Four-grain junctions between tectosilicate grains are common (Fig. 11c). Small biotite grains are tabular in shape, but most larger biotite grains have highly irregular shapes with branches at low angles to the foliation that envelope neighbouring quartz and feldspar grains (Fig. 11c). Simultaneous extinction and pleochroic transitions reveal pronounced biotite basal-plane alignments parallel with the foliation regardless of grain shape. Most homogeneous-ultramylonite thin-sections contain a few domains of fragmented 10–50 μm wide microcline or albite grains with biotite and feldspar filling dilational sites between the fragments. Biotite also occurs as overgrowths on some porphyroclasts. CI values calculated from 1 mm wide images of homogeneous-ultramylonite samples are generally between 0.54 and 0.60, although two images from sample KL104 yield CI values greater than 0.60 (Fig. 7). Some thin-sections reveal thin stringers and/or rootless isoclinal fold hinges of recrystallized quartz with variable amounts of interstitial biotite that we interpret as remnants of primary quartz grains. Quartz in these bodies consists of 3–20 μm wide grains that are semi-polygonal to irregular in shape (Fig. 12). Sparse larger grains exhibit sutured grain boundaries and semi-polygonal subgrains, and both the grain-boundary sutures and subgrains are similar in size to adjacent recrystallized grains (Fig. 12). Quartz clasts in breccia at site KL105 and quartz ribbons in pinstripe-ultramylonite samples collected at sites KL105 and KL10 also exhibit core–mantle textures (Fig. 12b). Regardless of rock type, RMS quartz recrystallized grain sizes measured in samples from the main-ultramylonite domain are consistently 10–20 % smaller than those measured in samples from the breccia-to-ultramylonite transition, breccia-hosted shear zones, breccia clasts and pulverized foliated granite, and the resulting flow-stress values are 10–20 % greater (Table 1). These results agree with those of Sullivan et al. (Reference Sullivan, Boyd and Monz2013) from elsewhere in the main-ultramylonite domain.
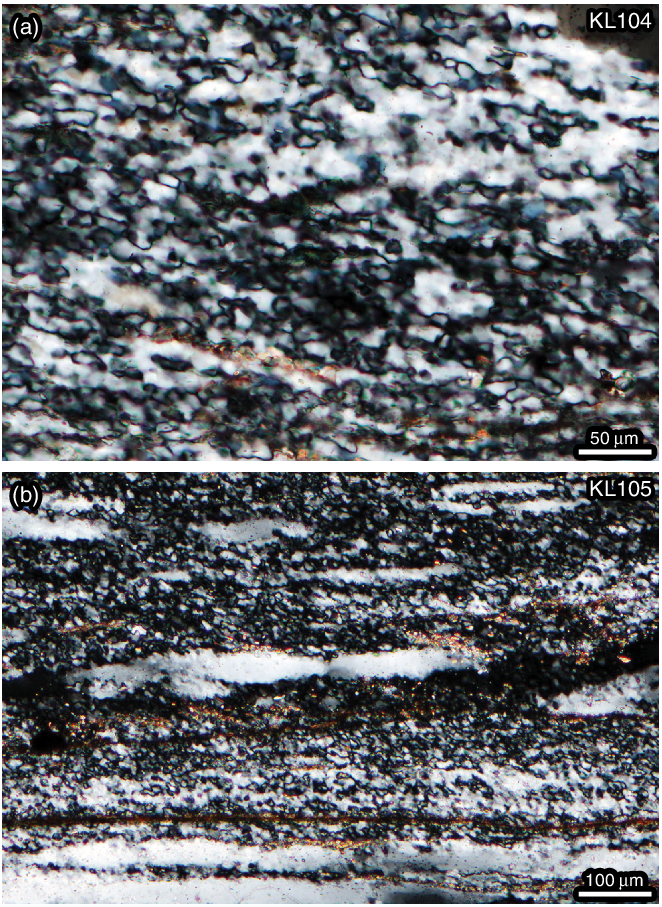
Cross-polarized-light images showing quartz recrystallization textures from the main-ultramylonite domain. (a) Part of a recrystallized quartz boudin in homogeneous-ultramylonite sample. (b) Part of a recrystallized quartz ribbon in a pinstripe-ultramylonite sample.
5. Discussion
5.a. Evolution of the KFZ in the present study area
The onset of deformation in the present study area is recorded by the foliated granite. Both S and local C surfaces in the foliated-granite domain are dominated by elongated quartz grains and quartz ribbons. Quartz microstructures in foliated-granite samples indicate subgrain-rotation (SGR) and subordinate fast-grain-boundary-migration (fast-GBM) dynamic recrystallization in response to dislocation creep (e.g. Hirth & Tullis, Reference Hirth and Tullis1992; Stipp et al. Reference Stipp, Stünitz, Heilbronner, Schmid, de Meer, Drury, de Bresser and Pennock2002). Therefore, the rheology of these rocks during initial foliation formation was likely governed by a quartz dislocation creep flow law (cf. Sullivan et al. Reference Sullivan, Boyd and Monz2013). Quartz in sample KL111 (collected furthest from the centre of the KFZ in the present study area) is entirely recrystallized, but the size of recrystallized grains is heterogeneous. Larger grains in this sample exhibiting evidence for fast-GBM recrystallization likely record the early high-temperature deformation phase documented by Sullivan et al. (Reference Sullivan, Boyd and Monz2013) elsewhere in the foliated-granite domain and possibly deformation at lower strain rates. This microstructure is significantly overprinted by SGR recrystallization that we attribute to progressive deformation during cooling. Quartz deformation experiments conducted under (1) constant-temperature, variable-strain-rate and (2) variable-temperature, constant-strain-rate conditions show that early low-stress microstructures can be partially preserved after a significant high-stress overprint, and the resulting recrystallized grain sizes yield stress values between the two end-member stress conditions (Kidder et al. Reference Kidder, Hirth, Avouac and Behr2016; Soleymani et al. Reference Soleymani, Kidder, Hirth and Garapić2020). Therefore, the 46 MPa flow stress determined for sample KL111 likely lies between the stress supported by these rocks during initial high-temperature and later low-temperature deformation. Quartz in C domains of sample KL110 is entirely recrystallized with a relatively uniform grain size and consistent textural evidence for SGR recrystallization. Therefore, the flow stress of 78 MPa determined from this sample is probably an accurate estimate of the stress conditions when C domains were forming at site KL110.
Elongated quartz grains in pulverized-foliated-granite samples from the localized-shear-zone domain and quartz clasts in breccia also exhibit consistent evidence for SGR recrystallization of quartz prior to the onset of brittle deformation. However, the relict grains and core–mantle textures in these samples indicate that intracrystalline recovery was not as complete as in the foliated-granite domain despite similar levels of foliation development. We attribute this to lower deformation temperatures near the margins of the Deblois granite. Mutual cross-cutting relationships between recrystallized quartz aggregates and brittle fractures related to pulverization of foliated granite in the localized-shear-zone domain indicate that the waning stages of dislocation creep and resulting dynamic recrystallization of quartz are coeval with the onset of pulverization in these rocks. The gradational contact between pulverized rocks that preserve the initial foliation and the chaotic fabric of the breccia along the SE margin of the main-ultramylonite domain indicates that pulverization and breccia formation are coeval. The presence of recrystallized pseudotachylyte in the breccia, the abundance of dilational fractures separating microcline fragments, and textural similarities with other coseismic breccias (cf. Melosh et al. Reference Melosh, Rowe, Smit, Groenewald, Lambert and Macey2014) indicate that at least some seismogenic slip was coeval with breccia formation. Similar gradational contacts between pulverized plutonic wall rocks and coeval breccia and gouge in fault cores occur in the upper crust along the margins of modern strike-slip faults (e.g. Dor et al. Reference Dor, Ben-Zion, Rockwell and Brune2006; Mitchell et al. Reference Mitchell, Ben-Zion and Shimamoto2011; Rempe et al. Reference Rempe, Mitchell, Renner, Nippress, Ben-Zion and Rockwell2013).
The gradational contacts between the chaotic breccia fabric and the layered fabric of the breccia-hosted shear zones indicate that they formed from relatively fine-grained regions within the breccia. This interpretation is supported by the presence of angular to subangular feldspar and quartz fragments in the shear zones. Overprinting phases of brittle and viscous deformation are recorded by the discrete shear fractures cutting fabric elements in the breccia-hosted shear zones overprinted by viscous deformation of the matrix; rare breccia clasts of layered, foliated material; and the ultramylonite zones formed from recrystallized pseudotachylyte. Thus, we interpret the breccia-hosted shear zones as recording interseismic viscous creep and the breccia and pseudotachylyte as recording coseismic brittle deformation related to pulverization in the localized-shear-zone domain. Microstructures in folded and boudinaged quartz layers in the breccia-hosted shear zones also record SGR recrystallization in response to dislocation creep. However, folding and boudinage of quartz layers in the breccia-hosted shear zones indicates that quartz in these zones was rheologically stronger and deformed at lower strain rates than the surrounding polymineralic matrix.
The progressive change in strike of foliation across the breccia-to-ultramylonite transition zone indicates that mylonitic rocks of the transition zone and breccia-hosted shear zones are low-strain equivalents of the main-ultramylonite domain. This interpretation is supported by the progressive change from the discontinuous layered fabric and heterogeneous matrix of the breccia-hosted shear zones to the uniform matrix of homogeneous ultramylonites of the main-ultramylonite domain across the transition zone. Thus, our new observations confirm that formation of the homogeneous ultramylonite of the main-ultramylonite domain was primarily catalysed by grain-size reduction and phase mixing during brittle deformation. We can further add that grain-size reduction and phase mixing primarily occurred during cataclasis that is coeval with wall-rock pulverization. Dynamic recrystallization and formation of myrmekite during early fabric development also contributed to grain-size reduction. However, these processes did not form fine-grained mixtures of feldspar + biotite ± quartz that characterize the ultramylonite matrix and therefore did not play a significant role in forming the ultramylonite.
Quartz aggregates in the pulverized foliated granite, breccia clasts, breccia-hosted shear zones, and the breccia-to-ultramylonite transition zone all yield similar quartz recrystallized grain sizes and resulting flow-stress values of 96–104 MPa. Cross-cutting relationships indicate that the waning stages of quartz dynamic recrystallization in the pulverized foliated granite and breccia overlapped in time with the onset of seismogenic brittle deformation. However, it is unlikely that RMS quartz recrystallized grain sizes in these rocks record peak stresses just prior to seismic rupture (cf. Soleymani et al. Reference Soleymani, Kidder, Hirth and Garapić2020). It also is possible that quartz microstructures in the breccia-hosted shear zones and breccia-to-ultramylonite transition zone are inherited from earlier foliation formation in the granite. However, quartz bodies in the mylonitic rocks record much more strain (compare Fig. 8b–d). Therefore, a large stress decrease after formation of the breccia-hosted shear zones and mylonitic rocks of the transition zone would have been recorded by grain growth, and a large stress increase would have been recorded by additional grain-size reduction. Based on these arguments, we interpret quartz recrystallized grain sizes measured in the breccia-hosted shear zones and mylonitic rocks of the transition zone as primary rather than inherited features. Because the quartz aggregates in these rocks occur as discontinuous layers and small isolated bodies in a viscous matrix, they must record the stress transmitted to them by the surrounding matrix. Stress components transmitted to such layers or inclusions may be smaller than the corresponding stress components supported by the matrix owing to incomplete coupling along the material boundaries, but differential stress in layers or inclusions cannot be larger than the differential stress supported by the matrix. There is no evidence for decoupling between the matrix and quartz bodies. Therefore, we assume that the flow stress recorded by the quartz layers approximates the flow stress supported by the mylonitic matrix.
The small grain sizes, mixing of phases, abundant four-grain junctions, grain-boundary bulging between feldspar grains, irregular biotite grain shapes and strong crystallographic alignment of biotite in the homogeneous ultramylonite of the main-ultramylonite domain are most compatible with deformation by diffusion-mediated grain-boundary sliding (e.g. Gower & Simpson, Reference Gower and Simpson1992; Stünitz & Fitz Gerald, Reference Stünitz and Fitz Gerald1993; Herwegh & Jenni, Reference Herwegh and Jenni2001; Menegon et al. Reference Menegon, Pennacchioni and Spiess2008, Reference Menegon, Stünitz, Nasipuri, Heilbronner and Svahnberg2013; Kilian et al. Reference Kilian, Heilbronner and Stünitz2011). Therefore, the rheology of the main-ultramylonite domain was likely governed by a grain-size-sensitive (GSS) creep flow law. Rare nearly pure quartz layers in the main-ultramylonite domain exhibit textural evidence for simultaneous SGR and slow-GBM (a.k.a. bulging) recrystallization in response to dislocation creep (e.g. Hirth & Tullis, Reference Hirth and Tullis1992; Stipp et al. Reference Stipp, Stünitz, Heilbronner, Schmid, de Meer, Drury, de Bresser and Pennock2002). Boudinage and folding of quartz layers in homogeneous-ultramylonite samples show that they deformed more slowly than the surrounding matrix.
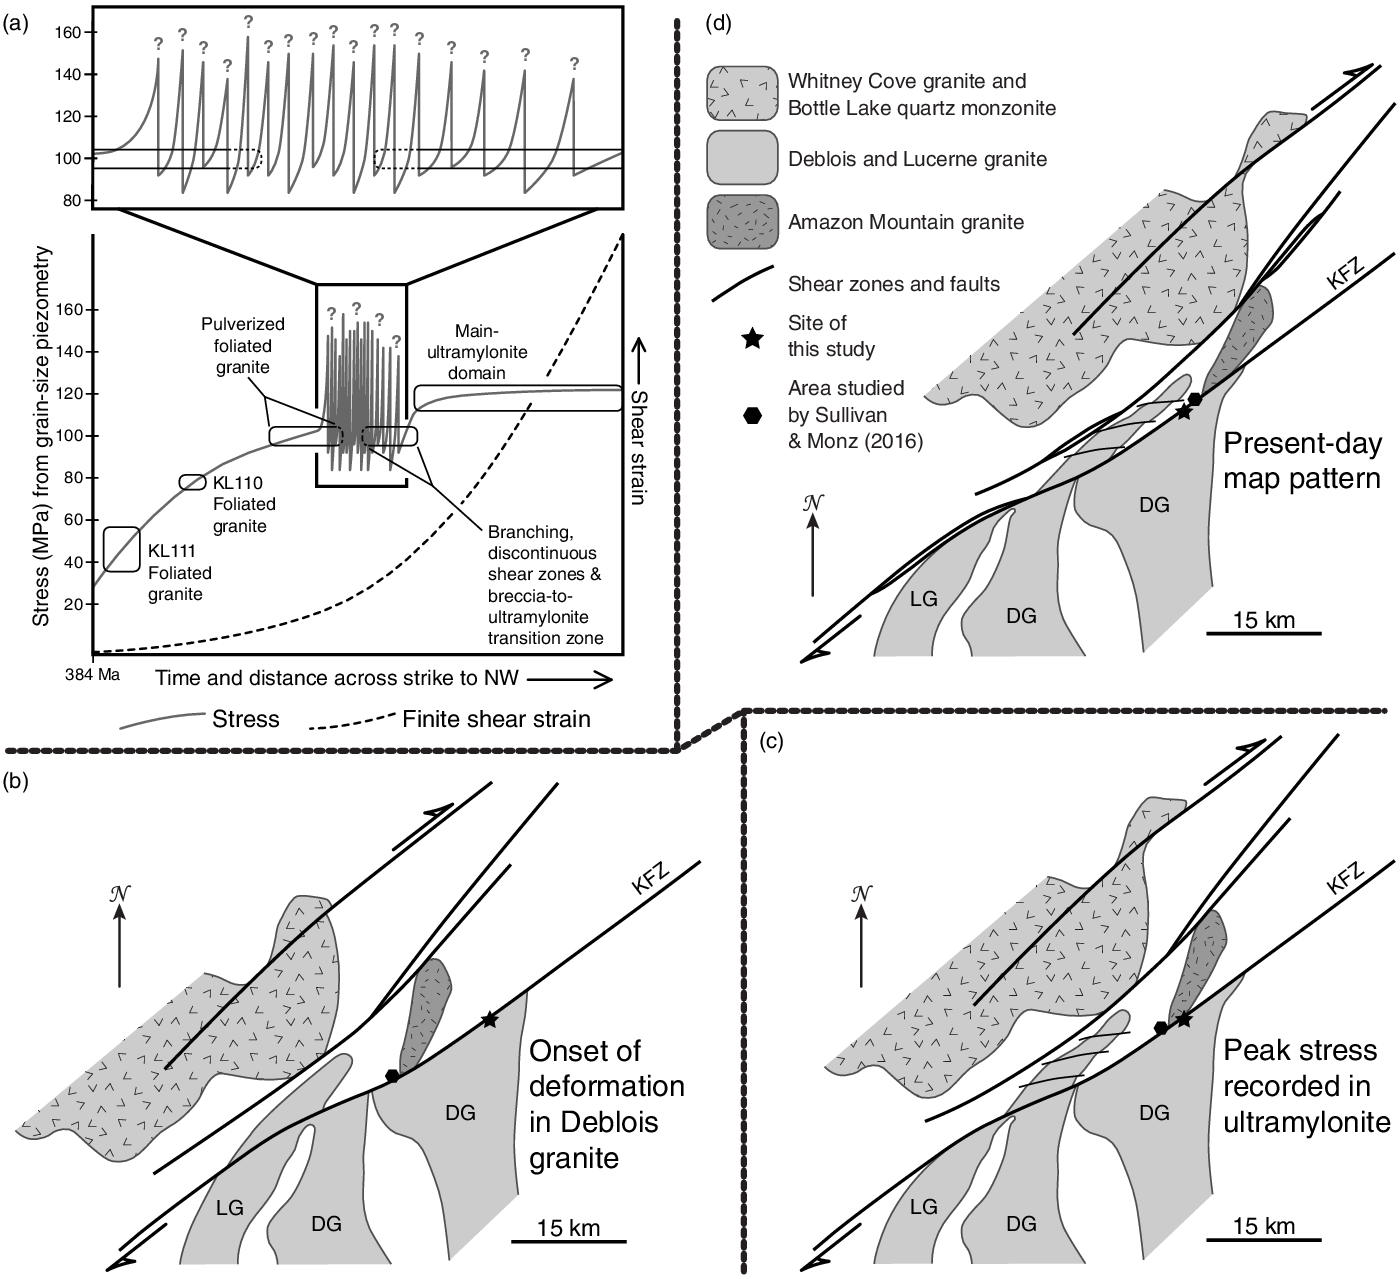
We propose a modified model for the evolution of the KFZ in the present study area where deformation was progressively localized from SE to NW (Fig. 13a). Deformation initiated in the foliated-granite domain almost immediately after crystallization of the Deblois granite c. 384 Ma and was progressively localized as the granite cooled preserving high-temperature microstructures in rocks distal from the KFZ (cf. Wang & Ludman, Reference Wang and Ludman2004; Sullivan et al. Reference Sullivan, Boyd and Monz2013). Cooling resulted in strengthening of the deforming rocks that is recorded by the decrease in quartz recrystallized grain sizes and increase in corresponding flow stresses from SE to NW across the present study area. Seismogenic brittle deformation of the foliated granite initiated when the recorded stress reached 96–104 MPa while the rocks were still in the biotite stability field and hot enough to allow dislocation creep and SGR recrystallization of quartz at relatively high strain rates, likely 400–450 °C (Stipp et al. Reference Stipp, Stünitz, Heilbronner, Schmid, de Meer, Drury, de Bresser and Pennock2002). The breccia-hosted shear zones and the breccia-to-ultramylonite transition zone record interseismic viscous creep at flow stresses of 96–104 MPa, which is identical to the stress recorded by the pulverized foliated granite at the onset of seismogenic deformation. Grain-size reduction and phase mixing during brittle deformation resulted in a shift in the rate-controlling creep mechanism from quartz dislocation creep to GSS creep in fine-grained mylonitic rocks. GSS creep enabled deformation at faster strain rates than was possible with quartz dislocation creep under these conditions, but stress remained constant. The paucity of brittle features overprinting ultramylonite in the main-ultramylonite domain indicates that a significant amount of deformation in the ultramylonite postdates seismogenic brittle deformation (cf. Sullivan et al. Reference Sullivan, Boyd and Monz2013; Sullivan & Peterman, Reference Sullivan and Peterman2017). The 10–20 % larger flow stresses recorded in the main-ultramylonite domain can be explained in two ways. Our preferred interpretation envisions the KFZ as an approximately constant-stress system (cf. Platt & Behr, Reference Platt and Behr2011 b) from the onset of seismogenic deformation wherein the rate-controlling deformation mechanism shifted from episodic seismogenic brittle deformation and interseismic viscous creep to steady state GSS creep as the zone evolved. In such a case, the 96–104 MPa flow stresses recorded in the pulverized foliated granite and breccia-hosted shear zones record periods of interseismic creep, and the high-stress pulses leading to seismogenic slip are not recorded. The 112–124 MPa flow stresses recorded in the main-ultramylonite domain approximate the time-averaged mean stress during both interseismic creep and the high-stress pulses leading to seismogenic slip (Fig. 13a), and formation of ultramylonite resulted in a net increase in strain rate and an end to seismogenic slip at this depth while the time-averaged mean stress remained constant (Fig. 13a). An alternative interpretation invokes a progressive increase in stress supported across the KFZ as the fault zone cooled and became narrower. However, all available evidence indicates that deformation in the main-ultramylonite domain largely postdates seismogenic slip, and this model fails to explain why seismogenic slip ceased as stress increased.
(a) Schematic plot showing inferred stress conditions versus time and dimensionless shear strain versus time for the KFZ in the present study area. Rounded rectangles highlight stress conditions recorded by different strain facies, structures, rock types and/or samples. Coseismic stress pulses in the centre of the plot are inferred based on the evidence for seismogenic slip, and the magnitude of these pulses is unconstrained. (b) Sketch map showing inferred regional geology during initial foliation development in the Deblois granite. (c) Inferred regional geology when peak-stress conditions were recorded in the main-ultramylonite domain. (d) Present-day map pattern around the Norumbega fault system in eastern Maine. DG – Deblois granite; LG – Lucerne granite; KFZ – Kellyland fault zone. Panels (b–d) compiled and adapted from Ludman & Berry (Reference Ludman and Berry2003), Wang & Ludman (Reference Wang and Ludman2004) and Wang (Reference Wang2007, Reference Wang2011, Reference Wang2020a,b).
5.b. Implications for seismogenesis and crustal strength
The recrystallized pseudotachylyte and pulverized rocks preserved in the present study area both record seismogenic slip at this depth of exposure. Furthermore, formation of wide zones of pulverized rock as observed along the KFZ likely records multiple large-magnitude earthquake ruptures nucleating in a preferred direction (e.g. Xu & Ben-Zion, Reference Xu and Ben-Zion2017; Griffith et al. Reference Griffith, St Julien, Ghaffari and Barber2018), but it is unclear whether these ruptures nucleated at this depth or propagated downwards from higher structural levels. Stable sillimanite without K-feldspar in the contact areole of the Deblois granite indicates metamorphic pressures in excess of 200 MPa at the onset of deformation along the KFZ (see discussion in Sullivan & Peterman, Reference Sullivan and Peterman2017), and this implies a minimum depth of ∼8 km. Deformation temperatures of 400–450 °C at the onset of seismogenesis are compatible with depths of 9–13 km assuming a geothermal gradient of 35–45 °C km−1, a reasonable assumption for the upper continental crust in magmatically active regions (e.g. Rothstein & Manning, Reference Rothstein, Manning, Johnson, Paterson, Fletcher, Girty, Kimbrough and Martín-Barajas2003; Blackwell et al. Reference Blackwell, Richards, Frone, Ruzo, Dingwall and Williams2011). These depths are similar to the base of the seismogenic zone along much of the modern San Andreas fault system (Hill et al. Reference Hill, Eaton, Jones and Wallace1990).
If the BVT zone is indeed the strongest region of the crust (e.g. Brace & Kohlstedt, Reference Brace and Kohlstedt1980; Handy & Brun, Reference Handy and Brun2004; Chen et al. Reference Chen, Hung, Tseng, Brudzinski, Yang and Nowack2012; Behr & Platt, Reference Behr and Platt2014; Hirth & Beeler, Reference Hirth and Beeler2015), then our results indicate that the entire KFZ was relatively weak. Effective lithostatic stress (σ2 in the strike-slip regime) under hydrostatic pore-fluid pressure at 10 km depth is ∼150 MPa assuming a mean rock density of 2600 kg/m3 and a fluid density of 1100 kg/m3. Assuming that aseismic viscous creep in the main-ultramylonite domain occurred near the stress threshold for brittle failure, the flow stresses recorded by these rocks combined with an effective lithostatic stress of 150 MPa imply a coefficient of sliding friction of ∼0.45 for an optimally oriented, cohesionless strike-slip fault. This coefficient of sliding friction should be considered an upper bound for the strength of the KFZ at the BVT for two reasons. First, the KFZ cannot be considered an optimally oriented strike-slip fault because it dips at ∼75° (Wang & Ludman, Reference Wang and Ludman2004; Sullivan et al. Reference Sullivan, Boyd and Monz2013), and the Norumbega fault system developed in a regional transpressional regime (e.g. Ludman & West, Reference Ludman, West, Ludman and West1999). Second, the KFZ cannot be treated as cohesionless at this depth of exposure because microstructures record pervasive healing during interseismic phases. Of course, fluid pressure may also have greatly exceeded hydrostatic conditions in the KFZ. But, fluid pressure approaching lithostatic stress should be associated with formation of veins and dilational microstructures such as pressure-shadow overgrowths. These structures are rare in granite-derived fault rocks in the SE side of the KFZ, but they are abundant in metasedimentary rocks in the NW side of the KFZ (Sullivan & Monz, Reference Sullivan and Monz2016). Sullivan & Monz (Reference Sullivan and Monz2016) proposed that fluid movement in the KFZ was restricted across strike based on these observations.
5.c. Role of pulverization in formation of ultramylonite
Phase mixing and grain-size reduction are the primary processes leading to formation of ultramylonite in the KFZ. CI analysis of whole thin-sections shows that, although biotite-filled fractures are more abundant in pulverized-foliated-granite samples, the dispersion of biotite among and within other phases did not increase significantly in these rocks. Phase mixing as approximated by dispersion of biotite is significantly greater in breccia and reaches near-maximum values in the breccia-hosted shear zones and the breccia-to-ultramylonite transition zone. The abundance of dilational fractures separating microcline fragments and the large increase in the density of randomly oriented microfractures in the breccia indicate that much of the fragmentation of this unit (and coincident phase mixing by precipitation of biotite and other phases in dilational fractures) is related to pulverization during the dynamic phase of the seismic cycle. Therefore, pulverization played an indirect role in forming mylonitic rocks in the present study area inasmuch as it was an important process in forming the cataclastic fault rocks from which ultramylonite developed. However, pulverization without coeval cataclastic shearing cannot be directly linked to formation of mylonitic rocks in the KFZ.
The systematic reduction in height of quartz, microcline, albite and biotite powder-XRD peaks and coincident broadening of feldspar XRD peaks in the pulverized-foliated-granite and breccia samples also is significant. Takagi et al. (Reference Takagi, Takahashi, Shimada, Tsutsi, Miura, Kato and Takizawa2012) documented similar degradation of quartz powder-XRD peaks in a 400 m wide damage zone adjacent to the Median Tectonic Line in Japan and showed that XRD peak degradation resulted from dense tangles of short dislocations. Similar dislocation patterns occur in quartz subjected to rapid stress loading during deformation experiments that reproduce stress fluctuations during the seismic cycle (Trepmann & Stöckhert, Reference Trepmann and Stöckhert2013). Therefore, coseismic stress fluctuations likely contributed to a significant increase in intracrystalline strain in all phases in our samples. Additionally, pervasive in situ recrystallization of feldspar in pulverized rocks is recorded by systematic changes in the best-fit XRD patterns for microcline and albite across the present study area. This recrystallization probably also was a response to coseismic intracrystalline damage. Experiments show that shock loading increases feldspar solubility (e.g. Cygan et al. Reference Cygan, Casey, Boslough, Westrich, Carr and Holden1989). Therefore, intracrystalline damage related to pulverization may have increased dissolution rates in mylonitic rocks during the transition to GSS creep. Interestingly, diminished XRD peak intensities and wider feldspar peaks indicating high levels of intracrystalline strain persist in the main-ultramylonite domain. This may reflect rapid precipitation of minerals at relatively low temperatures and/or spontaneous development of dislocations under relatively large differential stresses. Or, it may be a cryptic record of seismogenic damage in these rocks.
5.d. Incorporation into the regional framework of the evolving KFZ
Fine-grained metasedimentary rocks recording large shear strains on the NW side of the KFZ present a different record of fault-zone evolution (Sullivan & Monz, Reference Sullivan and Monz2016). Partially recrystallized detrital quartz grains and boudinaged quartz veins in metasedimentary rocks and recrystallized primary quartz grains in a mylonitized leucogranite dyke yield RMS recrystallized grain sizes of 37.0–23.3 μm corresponding to flow stresses of 38–55 MPa. Sullivan & Monz (Reference Sullivan and Monz2016) concluded that fabrics in the metasedimentary rocks cut by the KFZ must record later stages of deformation than fabrics in the granite-derived fault rocks (including the present study area) because (1) they found no evidence for a high-stress overprint in quartz microstructures in metasedimentary rocks cut by the KFZ, and (2) stable chlorite in metasedimentary rocks cut by the KFZ indicates deformation at lower temperatures and hence later stages in this cooling fault zone. Theoretically, stress should not vary across layers parallel with the boundaries of an approximately planar shear zone. This raises the question: why do granite-derived fault rocks on the SE side of the KFZ record much higher stresses than texturally similar metasedimentary rocks on the NW side of the shear zone?
We hypothesize that formation of the main-ultramylonite domain under apparent high-stress conditions along the SE side of the KFZ was coeval with translation of the c. 60 km2 Amazon Mountain granite pluton along the NW side of the shear zone (Fig. 13b, c). Microstructures in ultramylonite and other fault rocks derived from Deblois granite were subsequently preserved as deformation localized in weaker metasedimentary rocks on the NW side of the KFZ after the Amazon Mountain granite passed the present study area. This hypothesis also helps explain the apparent lack of fluid communication between ultramylonite derived from Deblois granite and metasedimentary rocks. If this hypothesis is correct, the strength of the KFZ at the present depth of exposure must have varied significantly along strike with a strong zone located where the Amazon Mountain and Deblois granites were directly juxtaposed. This hypothetical strong zone may have served as a focal point for seismogenesis. Modelling of dynamic stress patterns around earthquake ruptures along bimaterial interfaces (like most of the KFZ) indicates that off-fault damage can be concentrated in the stiff material if earthquake ruptures nucleate with a preferred direction (Xu & Ben-Zion, Reference Xu and Ben-Zion2017). These model predictions match the observed damage pattern across the KFZ with a wide zone of pulverized rocks in the Deblois granite and no off-fault damage observed in the metasedimentary rocks (Sullivan & Monz, Reference Sullivan and Monz2016; Sullivan & Peterman, Reference Sullivan and Peterman2017). Reconnaissance observations of the Amazon Mountain granite on the NW side of the KFZ also reveal no evidence for a damage zone similar to the localized-shear-zone domain and pulverized rocks in the Deblois granite. This damage asymmetry can be explained by earthquake ruptures nucleating at the contact of the Amazon Mountain and Deblois granites and preferentially propagating northeastwards to produce an asymmetrical damage zone on the SE side of the shear zone before the Amazon Mountain granite reached the present study area (Fig. 13b, c) (cf. Mitchell et al. Reference Mitchell, Ben-Zion and Shimamoto2011; Xu & Ben-Zion, Reference Xu and Ben-Zion2017; Sullivan & Peterman, Reference Sullivan and Peterman2017). An asymmetrical damage zone in the Deblois granite produced by northeastward-propagating earthquake ruptures would have allowed deformation to localize in the Deblois granite as the Amazon Mountain granite passed the present study area (Fig. 13c).
6. Summary and conclusions
A variety of granite-derived fault rocks in the present study area record evolution of the crustal-scale KFZ through the BVT. From the margins to the interior of the zone, these include (1) foliated granite, (2) a ∼50 m wide band of pulverized foliated granite, (3) a ∼2.8 m wide band of breccia-hosting shear zones formed after cataclastic rocks and minor pseudotachylyte, and (4) a >100 m wide band of ultramylonite derived from breccia and cataclasite. Deformation initiated immediately after crystallization of the Deblois granite and was progressively localized in the foliated granite as the rocks cooled. The initial foliation is primarily defined by elongated quartz grains, and the rheology during the earliest phase of deformation was likely governed by quartz dislocation creep. Strengthening of the KFZ as the zone narrowed is recorded by a decrease in quartz recrystallized grain sizes and an increase in corresponding flow stresses.
The onset of seismogenic brittle deformation is recorded by pulverization of foliated granite and coeval formation of the breccia and minor pseudotachylyte. Brittle deformation initiated when the flow stresses recorded by recrystallized quartz reached 96–104 MPa while the rocks were still likely at temperatures of 400–450 °C. Interseismic viscous creep is recorded by mutual cross-cutting relationships between breccia-hosted shear zones and brittle shear fractures and fault rocks. Boudinaged and folded layers of recrystallized quartz in breccia-hosted shear zones record flow stresses of 96–104 MPa, but the rate-controlling mechanism in shear zones shifted to GSS creep.
A progressive change in strike of foliation and coincident increase in textural maturity of mylonitic rocks indicate that the breccia-hosted shear zones are low-strain equivalents of the >100 m wide band of ultramylonite. A paucity of brittle features overprinting ultramylonite indicates that seismogenic deformation at this depth largely ceased after formation of the ultramylonite. The rheology of ultramylonites was governed by GSS creep, and boudinaged and folded bands of recrystallized quartz in ultramylonites record flow stresses of 112–124 MPa. Our preferred interpretation of these data and observations envisions the KFZ as an approximately constant-stress system starting with the onset of seismogenic deformation wherein the rate-controlling deformation mechanism shifted from episodic seismogenic slip and interseismic viscous creep to steady state GSS creep as ultramylonite formed. In such a case, the 112–124 MPa flow stresses recorded by recrystallized quartz in ultramylonites approximates the time-averaged mean stress during episodic seismogenic slip and interseismic creep, and formation of ultramylonite from cataclastic fault rocks resulted in an increase in strain rate with no change in mean stress. Regardless of the mechanisms of strain localization, flow stresses recorded across the BVT in the focus area imply that the whole fault zone was relatively weak if the BVT and uppermost viscous zone are indeed the strongest region of the continental crust.
Supplementary material
To view supplementary material for this article, please visit https://doi.org/10.1017/S0016756821001035
Acknowledgements
This work was funded by the Colby College Natural Science Division and the Dixon Endowment for Geoscience Research. We are grateful to J. Hill, A. Martzolf and K. Mitchel for assistance with fieldwork and sample collection; E. Peterman for assistance with SEM analyses; and A. Ortiz for assistance with FRAGSTATS. We also made use of R. Allmendinger’s Stereonet and MohrPlotter programs. This detailed work would not have been possible without the excellent mapping and regional characterization of C. Wang and A. Ludman. W. Behr and J. Singleton provided helpful reviews that improved the final version of this manuscript.


 Open access