


1. Introduction
Collaboration is central to research and the creation of new knowledge, as research work does not occur in a vacuum (Akbaritabar et al., Reference Akbaritabar, Casnici and Squazzoni2018). Collaboration can occur at various levels, such as between individuals and between organizations (Kenekayoro et al., Reference Kenekayoro, Buckley and Thelwall2014). Collaboration between organizations involves academic institutions, along with partners from industry and government (Mascarenhas et al., Reference Mascarenhas, Ferreira and Marques2018). Collaborative ties between organizations allow access to greater sources of funds, expertise, and equipment in the creation of new scientific knowledge. This paper aims to provide an examination of the factors underpinning the formation of inter-organizational collaboration ties on UK research council-funded projects. Universities are argued to be core knowledge producing entities and play a key role in the development of innovative output for industry and business (Fritsch & Slavtchev, Reference Fritsch and Slavtchev2007; Huggins et al., Reference Huggins, Johnston and Steffenson2008; Roesler & Broekel, Reference Roesler and Broekel2017; Smith & Bagchi-Sen, Reference Smith and Bagchi-Sen2006). Universities have been identified as central to knowledge production (Etzkowitz & Leydesdorff, Reference Etzkowitz and Leydesdorff2000) and act as engines for both regional and national development of innovation capabilities (Coenen, Reference Coenen2007; Sánchez-Barrioluengo et al., Reference Sánchez-Barrioluengo, Uyarra and Kitagawa2019; Yusuf, Reference Yusuf and Nabeshima2006).
Innovation activities are becoming increasingly open and networked (Hewitt-Dundas, Reference Hewitt-Dundas2012), resulting in dyadic partnerships between organizations to develop new knowledge and to exchange ideas. This gives rise to collaboration networks, where organizations are embedded in the collaborative system. The production of academic and scientific knowledge cannot be separated from the system, context, or network in which it is generated (Newell et al., Reference Newell, Swan and Kautz2001); therefore, network analysis is a useful analytical tool to understand the process of knowledge production. Network analysis is a widely utilized framework to understand collaborative partnerships at a variety of levels (Durugbo, Reference Durugbo2016), including institutional and individual levels (Newman, Reference Newman2001, Reference Newman2004).
In the UK, the Research Excellence Framework, or REF, is the mechanism by which the government evaluates research in universities (Khazragui & Hudson, Reference Khazragui and Hudson2015). The REF is a performance-based funding system (Watermeyer, Reference Watermeyer2016), as it acts as a mechanism for the distribution of quality-related funding by the government. Therefore, the REF often drives organizational level strategy regarding funding bids, collaborative partnerships, and target journal publication. There have been two REF exercises, one in 2014 and another in 2021. The results of REF 2021 were released in May 2022 and have been the subject of much discussion at the institution and national level. The REF 2021 results highlighted that the “golden triangle” of world’s leading universities in the South of England (Imperial College London, University of Cambridge, and University of Oxford) remains amongst the highest ranked institutions (Financial Times, 2022).
After a number of government reviews, such as the Lambert Review (Lambert, Reference Lambert2003), there was an increased pressure for UK research councils to improve levels of impact of funded projects (Lyall et al., Reference Lyall, Meagher and Bruce2015). Therefore, when applying for Research Council UK funding, organizations and individuals must demonstrate impact, often in the form of economic, cultural, and societal benefits in their research (Watermeyer, Reference Watermeyer2016). As a result, public engagement activities, such as industry or community partnerships, are often built into research bids in order to demonstrate the reach and significance (beyond academia) of their research (Chowdhury et al., Reference Chowdhury, Koya and Philipson2016; Copley, Reference Copley2018; Watermeyer, Reference Watermeyer2014). Given the importance of collaborative arrangements in the distribution of public money, and the subsequent impact on national innovative performance and knowledge creation, understanding the mechanisms underpinning the formation of collaborative ties has profound policy implications (Chompalov et al., Reference Chompalov, Genuth and Shrum2002).
The collaboration between universities and industry is often perceived as a vehicle for knowledge exchange and innovation creation (Ankrah & Omar, Reference Ankrah and Omar2015). Although partnering with industry collaborators is encouraged by UK research councils, some argue that the impact of these collaborators does not always yield a positive outcome. Many argue that industry participation can result in the suppression of the dissemination of preliminary results, limiting the practice of open science and academic independence (Bölling & Eriksson, Reference Bölling and Eriksson2016; Czarnitzki et al., Reference Czarnitzki, Grimpe and Toole2015; Nelson, Reference Nelson2004; Partha & David, Reference Partha and David1994). Banal-Estañol et al. (Reference Banal-Estañol, Jofre-Bonet and Lawson2015) note in their examination of Engineering and Physical Sciences Research Council (EPSRC)-funded projects in top UK universities that academics benefit most when industry is involved in some projects, but not all. Collaboration is vital for universities, as it supports the development of research capacity (Aldieri et al., Reference Aldieri, Kotsemir and Vinci2018; Kodama et al., Reference Kodama, Watatani and Sengoku2013) and increasing the general productivity of a university (Lissoni et al., Reference Lissoni, Mairesse, Montobbio and Pezzoni2011).
The research to date has tended to focus on explaining university—industry partnerships, given the implications for impact and reaching relevant beneficiaries. However, there has been less attention given to university—university collaborative ties. Yet given the role that universities play in national innovation systems, and their role in research council-funded projects, it is important to understand the factors that give rise to these partnerships, in addition to university-industry ties. Projects funded by research councils rarely involve only one university, rather involve many university stakeholders. This paper examines collaborations between organizations on research-funded projects involving several partnership ties, including university–industry and university–university ties.
As noted by Subramanyam (Reference Subramanyam1983), collaboration within scientific research may differ vastly from one discipline to another. This paper intends to provide a comparative analysis, investigating whether inter-organizational collaboration differs amongst disciplines. This paper contributes to the extant literature that attempts to understand the formation of university–industry ties, along with contributing to better understanding what determines university–university ties (which has received less attention). There is a rich and extensive literature devoted to understanding collaborative inter-organizational network ties (Lomi et al., Reference Lomi, Lusher, Pattison and Robins2014; Lomi & Pattison, Reference Lomi and Pattison2006); this paper aims to contribute to the inter-organizational literature by taking an inter-organizational perspective to understand the formation of collaborative ties arising from arrangements on UK research council-funded projects. Additionally, much of the existing work devoted to understanding the scientific process itself, or the Science of Science (Fortunato et al., Reference Fortunato, Bergstrom, Börner, Evans, Helbing, Milojević and Barabási2018), focused on single research disciplines; this work extends the analysis to various research councils covering a range of disciplines, representing a contribution to the Science of Science literature. Understanding the formation and patterns of collaboration also is of importance to key funding bodies in the UK and has the potential to shape funding allocation decisions.
This paper is structured as follows: the next section provides an overview of the relevant theory and literature, along with the research questions that this be addressed by this paper. The third section will provide an overview of the data and methodological approach used to address these research questions. This will be followed by a results section that will provide both the descriptive analysis and modeling results. The paper will conclude with a discussion of the results, along with final remarks and directions for future research.
2. Theory and literature
This section will provide an overview of the theory and literature for three key areas, more specifically, inter-organizational networks, geography and collaboration, and the role of elite status in collaboration networks.
2.1. Inter-organizational networks
There is an extensive literature on inter-organizational networks (Bergenholtz & Waldstrøm, Reference Bergenholtz and Waldstrøm2011), often focusing on what gives rise to these networks and how they shape organizational behavior or performance, especially innovation performance (Gulati & Gargiulo, Reference Gulati and Gargiulo1999; Powell et al., Reference Powell, Koput and Smith-Doerr1996).
Inter-organizational networks have been utilized in investigating patterns of innovation, more specifically how these networks promote and facilitate innovation activities. University–industry collaborations have been recognized as key for the development of innovation and economic activity (Bishop et al., Reference Bishop, D’Este and Neely2011; Skute et al., Reference Skute, Zalewska-Kurek, Hatak and de Weerd-Nederhof2019); therefore, there has been an increase of empirical work examining the collaborative arrangements and relations between academic institutions and industry actors (Bruneel et al., Reference Bruneel, D’Este and Salter2010; He et al., Reference He, von Krogh, Sirén and Gersdorf2021; Isaeva et al., Reference Isaeva, Steinmo and Rasmussen2021; Olmos-Peñuela et al., Reference Olmos-Peñuela, Castro-Martínez and D’Este2014; Scandura, Reference Scandura2016; Tian et al., Reference Tian, Su and Yang2021). These works often consider the benefits of university collaboration to industry partners, along with the impact of geography and regional patterns on formation of university–industry ties, where these will often vary depending on the content of the tie.
This paper aims to understand the formation of inter-organizational collaboration arising from UK research council-funded projects and seeks to address the following research question, concerning network effects (or network factors):
RQ1: What are the factors underpinning the formation of inter-organization collaborative ties for UK research council-funded projects? How do these factors differ from each other when the funding bodies are different research councils?
2.2. Geography and collaboration
Geography often plays a role in the formation of collaborative ties on research projects, where much research crosses national borders (Bergé, Reference Bergé2017; Cronin et al., Reference Cronin, Shaw and La Barre2003; Gui et al., Reference Gui, Liu and Du2018). Others note that proximity more generally (which includes geographic proximity) substantially shapes and impacts collaboration, including inter-organizational collaboration (Knoben & Oerlemans, Reference Knoben and Oerlemans2006). However, the extent that geography impacts collaboration, more specifically interactive learning and innovation, is extensively debated (Ben Letaifa & Rabeau, Reference Ben Letaifa and Rabeau2013; De Fuentes & Dutrénit, Reference De Fuentes and Dutrénit2016; Ter Wal, Reference Ter Wal2014). Many note that geographic proximity has the potential to increase cooperation amongst collaborators (Katz, Reference Katz1994). Much of the extant literature examining collaborative patterns notes the positive impact of geographic proximity on productivity (Adams et al., Reference Adams, Black, Clemmons and Stephan2005; Wang et al., Reference Wang, Wu, Pan, Ma and Rousseau2005). Broström (Reference Broström2010) argues that geographic proximity is very important for short-term, applied projects, where high levels of trust and cooperation are required, yet it is less important for long-term projects, where it is easier to work across large distances. In their study of EPSRC-funded research projects, D’Este & Iammarino (Reference D’Este and Iammarino2010) identified an inverted U-shaped relationship between academic research quality and the collaboration distance between university and industry partners. They found that university departments with high level of research quality were more likely to attract distant partners, up to a certain point.
Boschma (Reference Boschma2005) notes in his seminal work on proximity and innovation that geographic proximity alone does not encourage collaborative learning to occur, rather it facilitates interactive learning by strengthening other dimensions of proximity. There are many forms of proximity, including cognitive, organizational, social, institutional, and geographic proximity. Geographic proximity is the most well known and considers the impact of distance on collaborative ties. Cognitive proximity refers to organizations sharing, or having a close cognitive base, which is sufficient for the organizations to communicate, understand, and process any new knowledge creation. Organizational proximity refers to interdependencies between organizations, often in the form of existing relationships (economic, organizational relationships), which reduces the risk of uncertainty and opportunism. Social proximity consists of the socially embedded relations between actors at the micro level (within the organization), which promote trust. Institutional proximity is when organizations have a similar institutional environment, in terms of norms and values of conduct. Institutional proximity can result in a stable environment for interactive learning to occur effectively. Although these various forms of proximity are seen to have a positive impact on collaboration, Boschma (Reference Boschma2005) does highlight potential negative impacts. More specifically, that high levels of proximity can result in the issue of lock-in, which can cause a lack of openness and flexibility.
Many have extended and examined the impact of proximity in further detail (Broekel & Boschma, Reference Broekel and Boschma2012; Ponds et al., Reference Ponds, Van Oort and Frenken2007). Gertler (Reference Gertler2003) notes that proximity, more specifically geographic proximity, will impact tacit knowledge in a different way compared with codified knowledge flows. Gertler (Reference Gertler2003) further highlights that tacit knowledge is a vital element of learning and innovative activity, yet it often poses challenges given it often cannot be easily codified or articulated (especially over long distances). Alpaydın & Fitjar (Reference Alpaydın and Fitjar2021) find that when an organization is making the decision to collaborate with a university, all five types of proximity play a key role, where the importance of a particular type of proximity depends on the context of the interaction, whereas D’Este et al. (Reference D’Este, Guy and Iammarino2013) find that geographic proximity and organizational proximity are perhaps the most important for the formation of university–industry collaborative ties, yet geographic proximity remains more important than organizational proximity.
Several studies have noted the importance of geographic proximity for establishing and maintaining university–industry relations in innovation networks (Laursen et al., Reference Laursen, Reichstein and Salter2008; Ponds et al., Reference Ponds, Van Oort and Frenken2007; Runiewicz-Wardyn, Reference Runiewicz-Wardyn2022). This has been found to be of particular importance in the life sciences, where numerous empirical studies have attributed the success of industry–university relationship to geographic proximity (these include the works of Feldman, Reference Feldman1999; Majava et al., Reference Majava, Leviäkangas, Kinnunen, Kess and Foit2016).
When examining collaboration networks, it is expected that collaborative relations and activity are more likely to originate from, or occur within, regions where there are more firms, as there is simply more opportunity (Huggins & Prokop, Reference Huggins and Prokop2017). However, when considering universities, regions often do not house an extensive number of universities, and Broekel & Hartog (Reference Broekel and Hartog2013a) suggest that this results in cross-regional collaborative ties between universities to occur. When considering university and firm collaborations, the impact of geographic distance can vary based on firm size. For example, Helmers & Rogers (Reference Helmers and Rogers2015) find that smaller firms benefit more from localized partnerships with universities. Larger firms are not evenly distributed across the country, and there are regions with a university present that are not home to large multinational corporations. Kindt et al. (Reference Kindt, Geissler and Bühling2022) note that when there are fewer multinational corporations in the region, universities will take a more central role as facilitators of knowledge exchange, often working with Small and Medium Enterprises.
Given that scientific activity is reliant on collaboration, especially between academic institutions, there have been a number of policy initiatives to encourage and promote collaboration across national borders. Amongst them is the Horizon 2020 program, which is an EU initiative that aims to act as a policy tool for collaborative activity across the European Research Area (Hoekman & Frenken, Reference Hoekman and Frenken2013), that are not dampened by geographic distance or borders (Bergé, Reference Bergé2017).
Geographic proximity is noted to have a substantial impact in the formation of inter-organizational ties, including university–industry relations; therefore, in this study we expect that organizations (including academic institutions) that are closer to each other are more likely to collaborate.
Given the importance of proximity, and more specifically geographic proximity on collaboration (and to test our expectations), this paper seeks to address the following research question:
RQ2: What is the role of geography in the formation of collaborative ties? Are collaborative ties more likely to be London centric?
2.3. Elite status and networks
Powell et al. (Reference Powell, White, Koput and Owen-Smith2005) provide an examination of inter-organizational collaboration in the life sciences, where they find that network expansion is a result of herdlike behavior, with network partners selected by matching with the dominant choices of others, exhibiting a follow the trend pattern of network expansion. This pattern of behavior can encourage the practice of selecting prestigious organizational partners that are often the dominant choice of others in the selection of collaborative partners.
Maghssudipour et al. (Reference Maghssudipour, Balland and Giuliani2021) consider the role of status in inter-firm knowledge transfer networks in an industrial cluster. They found that status was the key driver of assortative matching in the formation of knowledge transfer ties. More specifically, they found that low-status firms were not part of the more meaningful collaborations, or “collaborative circles,” rather high-status firms were likely to collaborate with other high-status firms. These findings are in line with the work of Balland et al. (Reference Balland, Belso-Martínez and Morrison2016); they find that status drives the formation of business knowledge networks. Furthermore, they find that proximity is particularly important for technical knowledge networks.
In the UK university context, status often plays a role, as universities exhibit heterogeneous characteristics in terms of their background, history, resources, and even how they approach external opportunities (Chang et al., Reference Chang, Yang, Martin, Chi and Tsai-Lin2016; Charles et al., Reference Charles, Kitagawa and Uyarra2014; Huggins et al., Reference Huggins, Johnston and Stride2012). University characteristics are often reflected in the “mission groups” that universities belong to. There are a number of mission groups that a university can be a member of in the UK; these include the prestigious Russell Group, Million+, and University Alliance (Furey et al., Reference Furey, Springer and Parsons2014). The Million+ group describes itself as a university think tank and the University Alliance is a group of universities that focus on practice. The Russell Group is a set of elite UK universities with a focus on research-intensive activities and receives the largest share of government funding (O’Connell, Reference O’Connell2015). Therefore, this paper aims to examine the roles of these Russell Group institutions in the collaboration network, and how their role differs between disciplines. The links between nonacademic organizations and universities differ by mission group; the Russell Group is more likely to partner with larger firms and non-commercial organizations, whereas the other groups have a broad range of partnerships, with lower levels of specialization (Sánchez-Barrioluengo et al., Reference Sánchez-Barrioluengo, Uyarra and Kitagawa2019). This paper aims to examine where the factors for forming collaborative ties differ between research-intensive universities, compared to other institutions. Russell Group membership has frequently been utilized as a measure of proxy for elite universities in the extant literature examining university cooperation for innovation purposes (Abreu et al., Reference Abreu, Demirel, Grinevich and Karataş-Özkan2016; Degl’Innocenti et al., Reference Degl’Innocenti, Matousek and Tzeremes2019; Guerrero et al., Reference Guerrero, Cunningham and Urbano2015; Hewitt-Dundas, Reference Hewitt-Dundas2013; Pickernell et al., Reference Pickernell, Ishizaka, Huang and Senyard2019; Sánchez-Barrioluengo & Benneworth, Reference Sánchez-Barrioluengo and Benneworth2019). For instance, Guerrero et al. (Reference Guerrero, Cunningham and Urbano2015) use Russell Group membership as a definition of entrepreneurial universities.
Cruz-Castro et al. (Reference Cruz-Castro, Benítez-Amado and Sanz-Menéndez2016) developed a typology to understand how Spanish universities react to European funding opportunities. The typology is based on two dimensions: firstly, the commitment (of the university along with individual academics) to act and respond to research oriented and research excellence values held by funding bodies, and secondly, their organizational capabilities. The four typologies are Committed, Operational, Hesitant, and Neglected. They find that a university with a Committed response is one that is research focused with links to international funding, whereas they note that universities with a Neglected response are typically those with low levels of research specialization yet have a strong teaching orientation.
Given the importance of status in the context of the UK research ecosystem, and in inter-organizational networks more generally, we address the following research question in this paper:
RQ3: Are elite universities, those belonging to the Russell Group, more active in collaboration on UK research council-funded projects? Are these higher capacity universities more likely to have collaborative ties? Do Russell Group members collaborate with each other?
When considering the typology developed by Cruz-Castro et al. (Reference Cruz-Castro, Benítez-Amado and Sanz-Menéndez2016), and their findings regarding the activities of Committed organizational responses, we expect in this study, higher status universities will be more active in the collaboration networks, as they are more likely to have a committed response to research funding opportunities.
3. Data and methods
The data are extracted programmatically from the Gateway to Research website. This dataset provides detailed information on UK research council-funded projects, including funded value, collaborating organizations, individuals, and project outcomes. This dataset has been used in extant literature to tackle a variety of research questions, including understanding collaboration and knowledge exchange patterns (Sarabi & Smith, Reference Sarabi and Smith2021; Williams et al., Reference Williams, Dovey, Cronin, Garside, Flintham, Smith and Taylor2017). In this paper, the Gateway to Research dataset is utilized to construct a set of inter-organizational collaboration networks. Gateway to Research provides details on a number of different types of projects that are funded by research councils, such as studentships, research grants, and knowledge exchange programs. In this study, we focus only on research grants, as these are often the largest (in terms of funding allocated) and typically involve a range of collaborative partners. Also, by focusing on one type of award, it allows for a more reliable comparison between the different research councils.
Average amount awarded per project by each UK research councils.
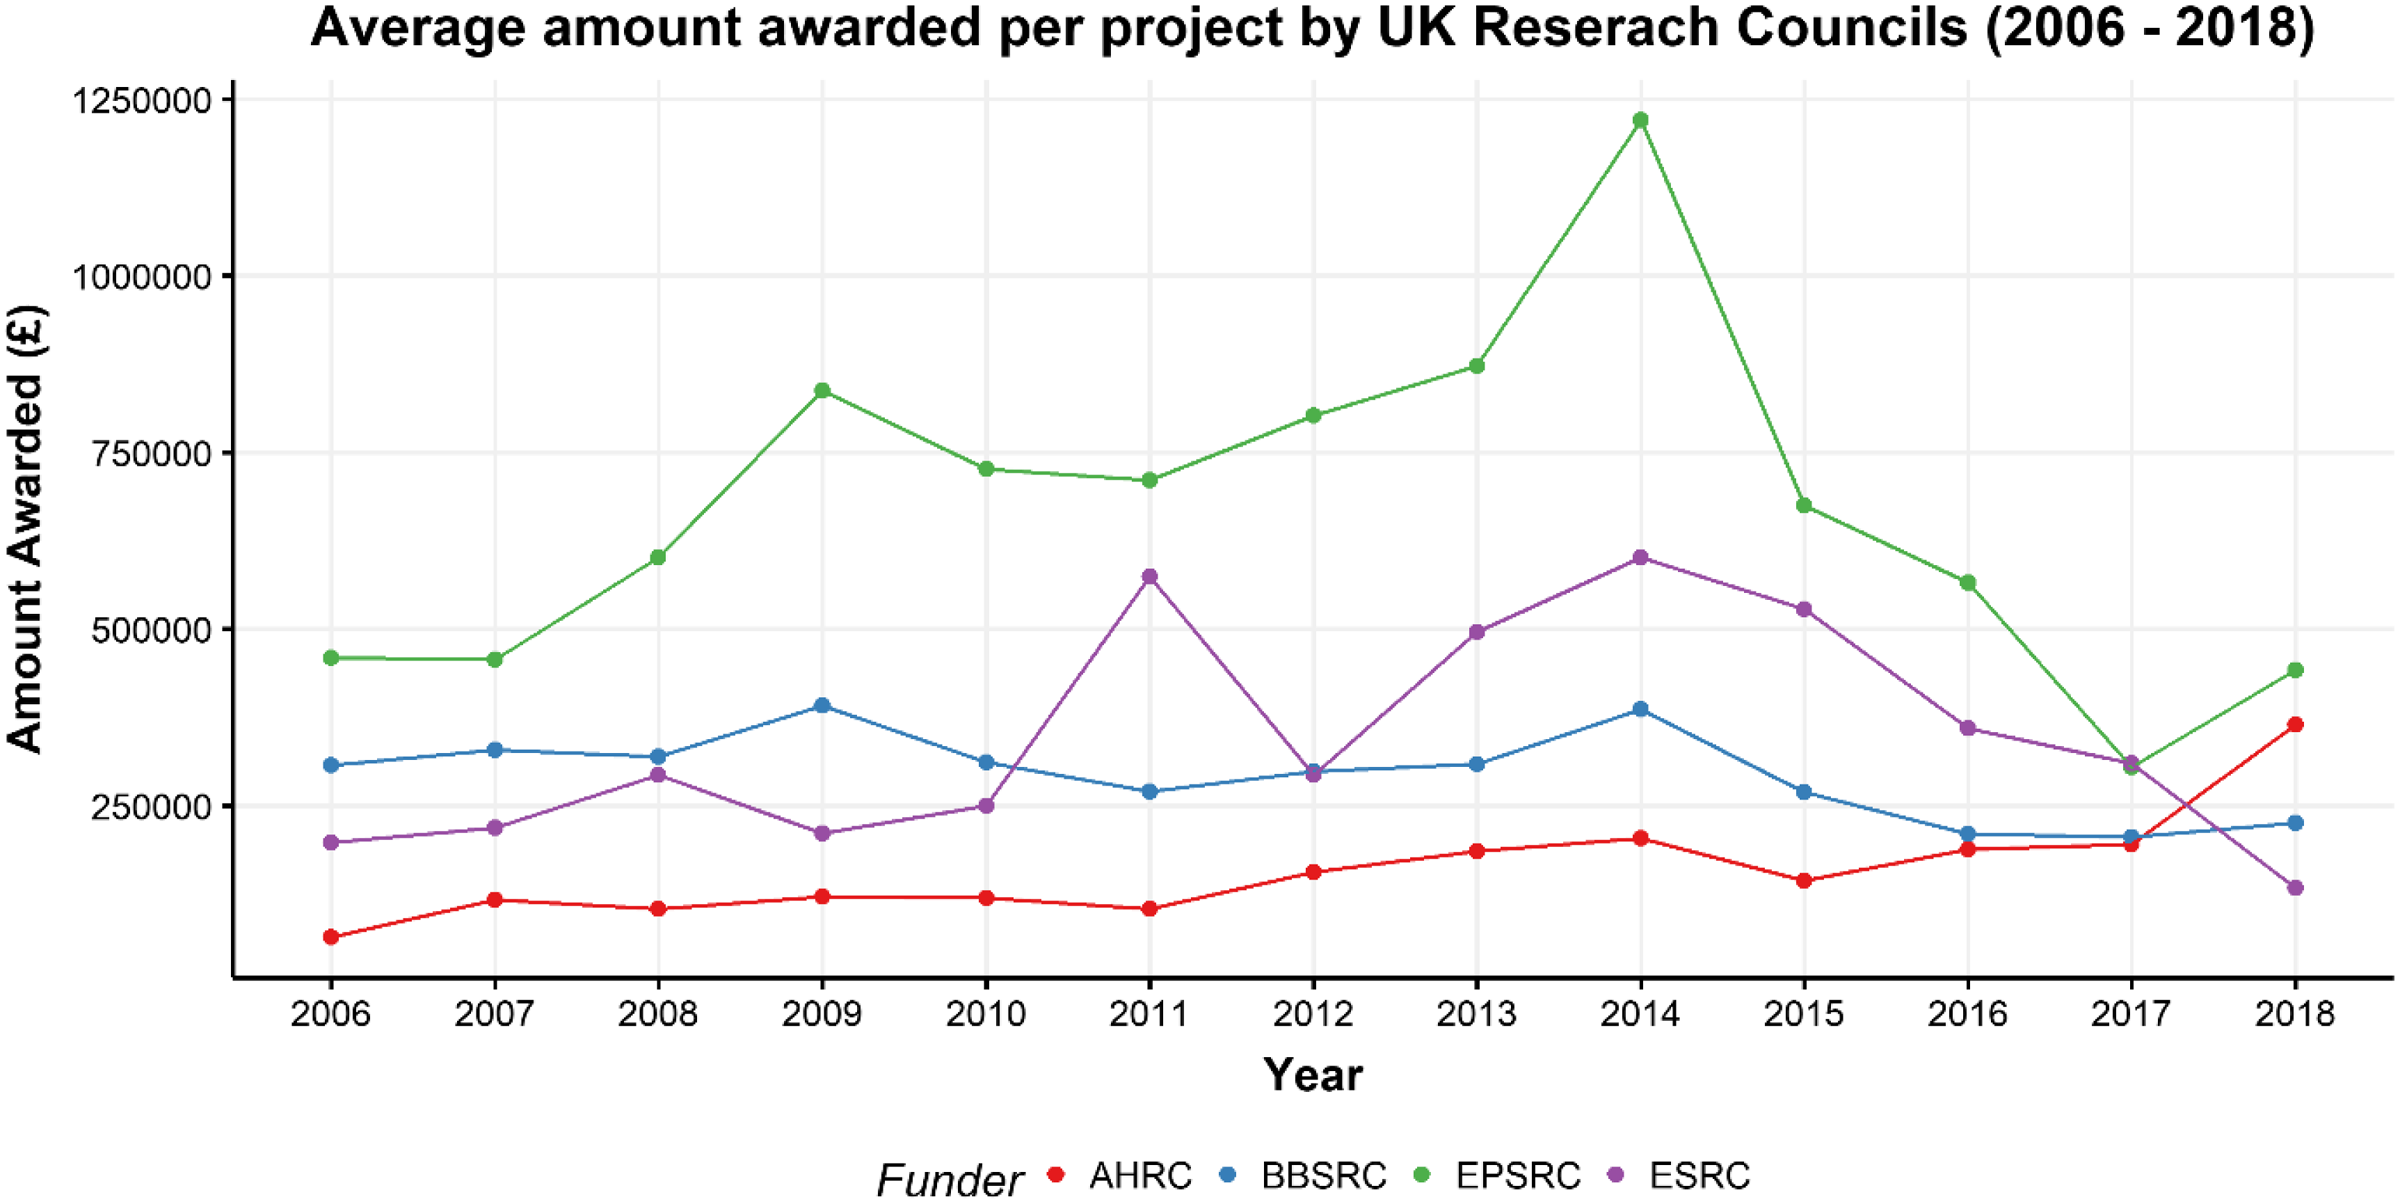
There are several UK research councils that fund projects in various disciplines. In this paper, four research councils are examined, representing four key disciplines. These are the Arts and Humanities Research Council (AHRC), the Economic and Social Research Council (ESRC), the EPSRC, and the Biotechnology and Biological Sciences Research Council (BBSRC). The EPSRC and BBSRC are the two largest scientific research councils by the number of projects they fund. It is important to note that whilst the UK research councils are a major source of funding for UK universities, there are other funding sources available to UK universities, such as those provided by the EU. However, this study focuses on the four UK research council-funded projects and the collaboration networks that arise from these projects.
The AHRC funds research projects belonging to a range of disciplines in the arts and humanities, including history, archaeology, philosophy, and languages. They also fund more contemporary research such as the application, design, and effectiveness of digital content. The subjects funded by the ESRC overlap somewhat with the AHRC, yet they have more of a focus on social and economics questions, and subsequent policy impacts and outcomes. The EPSRC focuses on several disciplines in the sciences, such as healthcare technologies, structural engineering, manufacturing, mathematics, advanced materials, and chemistry. They are one of the largest public funders in the UK for research related to innovation activities (Owen & Goldberg, Reference Owen and Goldberg2010). In more recent years, the EPSRC has funded a number of projects linked to industrial decarbonization. This research council emphasizes a focus on international engagement. The BBSRC state in their strategic vision statement that they aim to focus on creating environments for partnership with universities, research organizations, businesses, charities, and government to create the best possible environment for research and innovation to flourish. The discipline areas covered by the BBSRC include green energy, food security issues, industrial biotechnology, and pharmaceuticals. Much of the extant studies investigating the activities of UK research councils focuses on the ESRC and the EPSRC, with limited attention given to other councils, especially the AHRC and the BBSRC (Vick & Robertson, Reference Vick and Robertson2017); therefore, this paper contributes to the empirical analysis of these understudied research councils.
Universities can apply for a number of grants across all research councils, yet the success rate can vary. For instance, in the academic year 2015–16, UCL applied for 167 EPSRC research and innovation grants and fellowships, yet only 51 were awarded. Over the same period, the University of Leeds applied for 34 AHRC research grants and fellowships, yet less than half of these were awarded. Some universities have competitive internal procedures for larger grants, where expressions of interest for a grant application are put forward internally (often at a departmental level). These are then assessed by a panel and a smaller number are supported by the institution and these applications will then receive support and assistance in developing the final grant application. However, it must be noted that internal procedures for research council grant applications differ from university to university.
Figure 1 indicates the average amount awarded per project for each research council from 2006 to 2018. We observe that EPSRC, that is most closely associated with the hard sciences, provides higher levels of funding per project (although this has been decreasing since 2014). Perhaps reflecting that projects within engineering and associated areas often require expensive and specialized equipment. Although the BBSRC is also linked to the hard sciences, on average it awards less funding per project when compared to the EPSRC and is somewhat comparable to projects funded by the ESRC. The AHRC awards the least per project and is perhaps the research council most associated with the social sciences. However, there has been a steady increase in the average amount awarded per project.
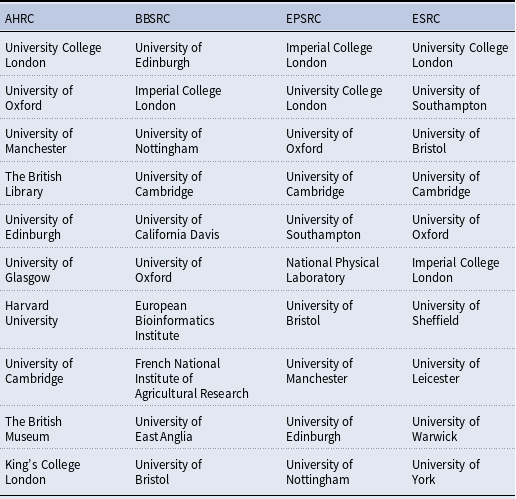
The Russell Group is a set of universities that claim to have higher research activities. Prior to the main analysis undertaken by this paper, we provide an exploratory analysis of features of Russell Group universities, compared to non-Russell Group universities drawing on data from the Higher Education Statistics Agency. The data include university income, revenues generated from intellectual property, number of academic staff employed, number of attendees at community engagement events, income from regeneration programs, and value of research contracts with nonacademic partners. Table 1 indicates the members of the Russell Group; we observe a number of older institutions are included, such as the University of Oxford and the University of Cambridge. A further point to highlight when discussing the Russell Group is the geographic distribution. Out of these 24 universities, 5 are based in London, with a further 5 toward the south of England, with only 4 outside of England, and the remaining 10 in the midlands and north of England. Therefore, the Russell Group is England centric, and to some extent, London centric.
Russell Group universities
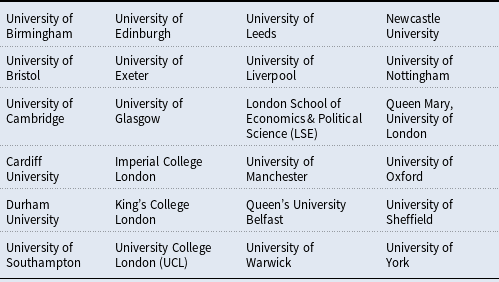
Figure 2 provides an overview of Russell Group universities, compared to the remaining UK universities that are not part of the group. It provides a boxplot of the various measures of capacity (taking the average for each institution over the period 2014/15 to 2017/18) for all higher education institutions in the UK.
Boxplot of capacity indicates for UK HEIs.

This indicates that the Russell Group membership is not just a measure of elite in terms of reputation in the UK higher education system, but it is also a sign of increased capabilities, with higher levels of investment and capacity on research-related activities than non-Russell Group members (Pinar & Unlu, Reference Pinar and Unlu2019). For instance, Russell Group members tend to have higher levels of income, increased returns from intellectual property, more valuable contracts with nonacademic institutions, and higher levels of academic staff. However, there are two notable areas where Russell Group members do not clearly outperform their non-group member counterparts: community engagement events and development programs.
Data from Gateway to Research are used to construct the collaboration network. The networks represent collaboration on projects that are active anytime during the period 2015–2018; 2015 is used as the starting point, as it is the first year following the 2014 REF. The REF is taken as the starting year, as it represents a key driver of university level strategy regarding research activity, more specifically, funding bids, collaborative partnerships, and journal publication. The nodes are organizations (including both academic and nonacademic institutions), and they are linked if they have collaborated together on the same project; this approach has been utilized in previous research examining inter-organizational collaboration (Bellotti et al., Reference Bellotti, Kronegger and Guadalupi2016). The nonacademic institutions include firms, government organizations, NGOs, and other charities; these are both UK institutions and those based outside the UK. In the inter-organizational networks, the links are weighted by the number of research projects they have collaborated on together; these data are essentially a one-mode projection of two-mode affiliation data.
To understand patterns of collaboration, a sophisticated network model is applied, an exponential random graph model (ERGM). Network analysis is an established methodological approach to understand collaboration patterns (Broekel & Hartog, Reference Broekel and Hartog2013b; Fan et al., Reference Fan, Li and Law2017; Kyvik & Reymert, Reference Kyvik and Reymert2017) and the inter-organizational relations (Lomi & Pallotti, Reference Lomi and Pallotti2012). Hazir (Reference Hazir2013) makes use of an ERGM to R&D collaboration arising from funding allocated as part of the EU’s 7th Framework Program. Network analysis has been utilized in various forms in the extant literature to inform on collaborative patterns (Bellotti, Reference Bellotti2012; Broekel et al., Reference Broekel, Balland, Burger and van Oort2014; Sylvan Katz & Martin, Reference Katz and Martin1997; Lissoni, Reference Lissoni2010; Maggioni & Uberti, Reference Maggioni and Uberti2005), examining networks at the level of individuals, organizations, and even bibliometric data.
An ERGM is a network model that is parameterized in terms of local structural configurations (Lusher et al., Reference Lusher, Koskinen and Robins2013). ERGMs can test hypothesis at the very local level, where the model is able to identify micro configurations that represent a theoretical process, and then calculates whether this process is seen in the network more than a researcher would expect by chance. For example, a transitivity effect, which would capture the propensity for triadic closure. In the context of collaboration, if two actors share a collaborative partner, is it more likely that they would also become collaborative partners? The ERGM would allow us to test whether transitivity occurs in the network significantly more or less than by random chance (Robins et al., Reference Robins, Pattison, Kalish and Lusher2007). The ERGM takes the following form:
 \begin{equation*} P\left(Y=y\right)=\frac{1}{k(\theta )}\exp \left(\sum \theta _{Q}z_{Q}\left(y\right)\right). \end{equation*}
where $Y$
is the observed network.
$Y$
is the observed network. $y$
is a network instance.
$y$
is a network instance. $Q$
is all the network configuration types (the local structural configurations).
$Q$
is all the network configuration types (the local structural configurations). $z_{Q}(y)$
is the network statistic corresponding to configuration type
$z_{Q}(y)$
is the network statistic corresponding to configuration type $Q$
.
$Q$
. $\theta _{Q}$
is the parameter corresponding to configuration type
$\theta _{Q}$
is the parameter corresponding to configuration type $Q$
.
$Q$
. $k(\theta )$
is the normalizing constant to ensure that the above is a proper probability distribution.
$k(\theta )$
is the normalizing constant to ensure that the above is a proper probability distribution.
ERGMs have been applied in a vast range of empirical settings (Kibanov et al., Reference Kibanov, Heiberger, Rödder, Atzmueller and Stumme2019), including knowledge exchange networks (Jiang & Chen, Reference Jiang and Chen2019) and co-authorship collaborations (Kronegger et al., Reference Kronegger, Mali, Ferligoj and Doreian2012; McLevey et al., Reference McLevey, Graham, McIlroy-Young, Browne and Plaisance2018). In this study, the ERGM is implemented using the ergm package in R (Hunter et al., Reference Hunter, Handcock, Butts, Goodreau and Morris2008b), which is part of the statnet suite of packages for social network analysis (Handcock et al., Reference Handcock, Hunter, Butts, Goodreau and Morris2008).
ERGMs are limited to binary relationships; therefore, a dichotomization process needs to be applied, as this is a weighted network, where the strength of the tie between organizations is the number of funded projects they collaborate on. Extant work has noted that applying dichotomization algorithms to networks that are one-mode projections of two-mode networks can provide additional challenges (Neal, Reference Neal2014; Neal et al., Reference Neal, Domagalski and Sagan2021), in particular noting which co-occurrences are significant.
There are several dichotomization techniques and algorithms available (Baggio, Reference Baggio2019). The most straightforward is to simply ignore the edge weights and retain all the edges. However, this does not account for the heterogeneity of edge weights and is only useful when the density is low or there is little variation in the edge weights (which is not the case for these collaboration networks) (Thomas & Blitzstein, Reference Thomas and Blitzstein2011). A further dichotomization technique is to apply a threshold, where the researcher takes a particular value (often an arbitrary value) and disregards all edges with weights less than this value (Borgatti & Quintane, Reference Borgatti and Quintane2018). Although this approach is popular, one difficulty that arises in its application is the selection of an appropriate threshold value, as a network with an uneven distribution of edge weights can increase the issues of arbitrariness and structural bias of the threshold approach (Neal, Reference Neal2014). In addition to the threshold approaches, there are procedures available to assess an edge’s significance and to use this as the basis for the edge reduction. Serrano et al. (Reference Serrano, Boguná and Vespignani2009) propose a more systematic approach to extract the key edges from a network, which they refer to as the network backbone. This is a filtering approach that retains the significantly heterogeneous links at specified significance level and disregards all other edges (considering them non-essential). This approach does not only preserve high value edges but also preserves low value edges that are important for maintaining the overall connectivity of the network. The multiscale backbone filtering procedure has become an established approach within social network analysis and network science, with applications in international trade (García-Pérez et al., Reference García-Pérez, Boguñá, Allard and Serrano2016; Xing et al., Reference Xing, Han and Wang2021) and transport (Viljoen & Joubert, Reference Viljoen and Joubert2016) to name a few.
In this study, we extract the backbone of the network, making use of the approach outlined by Serrano et al. (Reference Serrano, Boguná and Vespignani2009), where we retain the significantly heterogeneous links at the 0.05 significance level. This approach (and significance level) helps retain key ties, whilst preserving the overall connectivity of the network.
In the specification of the ERGM, several network terms are specified, along with a set of actor covariates. The network terms that are specified include edges, a degree centralization parameter (geometrically weighted degree or GWDEGREE), and a clustering parameter (geometrically weighted edgewise shared partners). The edges parameter captures the baseline tendency for a collaborative tie to form in the network (it is analogous to the intercept in a regression model). The degree activity effect (also referred to as the GWDEGREE effect) allows to control for the distribution of collaborative ties in the network and test for centralization effects (Levy, Reference Levy2016). A negative and significant effect would indicate that collaborative ties are concentrated in a small handful of actors, pointing toward a centralized network structure. This would suggest that there is a tendency for preferential attachment or assortative mixing based on degree occurring in the network (Newman, Reference Newman2002). In the case of inter-organizational networks, organizations with many ties tend to have more access to information about activities and partners, and therefore can better evaluate potential (and current) collaborative partners (Broekel & Bednarz, Reference Broekel and Bednarz2018; Polidoro et al., Reference Polidoro, Ahuja and Mitchell2011), whereas a positive and significant effect would indicate that collaborative ties are spread out evenly throughout the network (Hunter, Reference Hunter2007). There is evidence of both disassortative and assortative mixing in inter-organizational networks, and differences are often due to inter-organizational differentiation and institutional arrangements (Amati et al., Reference Amati, Lomi and Mascia2019).
Lead organizations receiving the most funding from the research councils

The clustering parameter, geometrically weighted edgewise shared partners (gwesp), captures the mechanism of triadic closure in the network (Hunter, Reference Hunter2007). This term measures the number of triangles in the collaboration network, in consideration of the number of ties involved in multiple triads. Therefore, a positive and significant parameter provides evidence for triadic closure and clustering in the network (Broekel & Hartog, Reference Broekel and Hartog2013b). Pallotti et al. (Reference Pallotti, Lomi and Mascia2013) suggest that in the context of inter-organizational collaborative ties, the presence of triads ties (and clustering more generally) can act as insurance against the disruption of knowledge and resource flows and can reduce uncertainty, as actors have access to multiple sources of information. The degree centralization parameter and the clustering parameter are included in the model specification to address the first research question posed by this paper. To examine whether degree centralization and clustering are key processes underpinning the formation of inter-organizational collaborative ties, and whether these patterns are the same across research councils.
The ERGM approach also allows for the specification of nodal attributes, to investigate the impact of actor properties on the formation of network ties. These include a node activity effect, which captures whether an actor in the network is more likely to establish collaborative ties in the network. The other is a nodal homophily effect, which captures whether actors with the same nodal attribute are more likely to collaborate, compared to those with a different nodal attribute (McPherson et al., Reference McPherson, Smith-Lovin and Cook2001).
Given the Russell Group is a set of self-proclaimed leading universities with a focus on research activities, we include two variables that account for whether an organization is a member of the group (or not). The first is the activity effect, which captures whether members of the Russell Group are more active in a network and are more likely to be involved in research council-funded projects. The second is a group homophily effect, this captures whether members of the Russell Group are more likely to collaborate with other leading universities that are members of this group. The use of the Russell Group parameters in the ERGM addresses the third research question posed by this paper, as they allow us to examine the activity of elite academic institutions in these various inter-organizational collaboration networks.
Additionally, a set of geography parameters are specified, capturing whether certain regions of the UK are more active, for instance are collaborative ties more likely if they involve London-based institutions? A region match term is also specified to examine whether collaborative ties are more likely to occur within the same region—are geographically proximate institutions more likely to collaborate? The regional groupings include London, the South of England (South West, South East, East of England), the Midlands (West Midlands and East Midlands), Northern England (North West, North East, and Yorkshire and Humber), Scotland, Wales, Northern Ireland, and outside the UK. The number of regional groupings has been condensed to allow for a more parsimonious modeling approach. The inclusion of these effects aids in addressing the second research question posed by this paper, more specifically to examine the role of geographic proximity in the formation of collaborative ties.
Descriptive network statistics

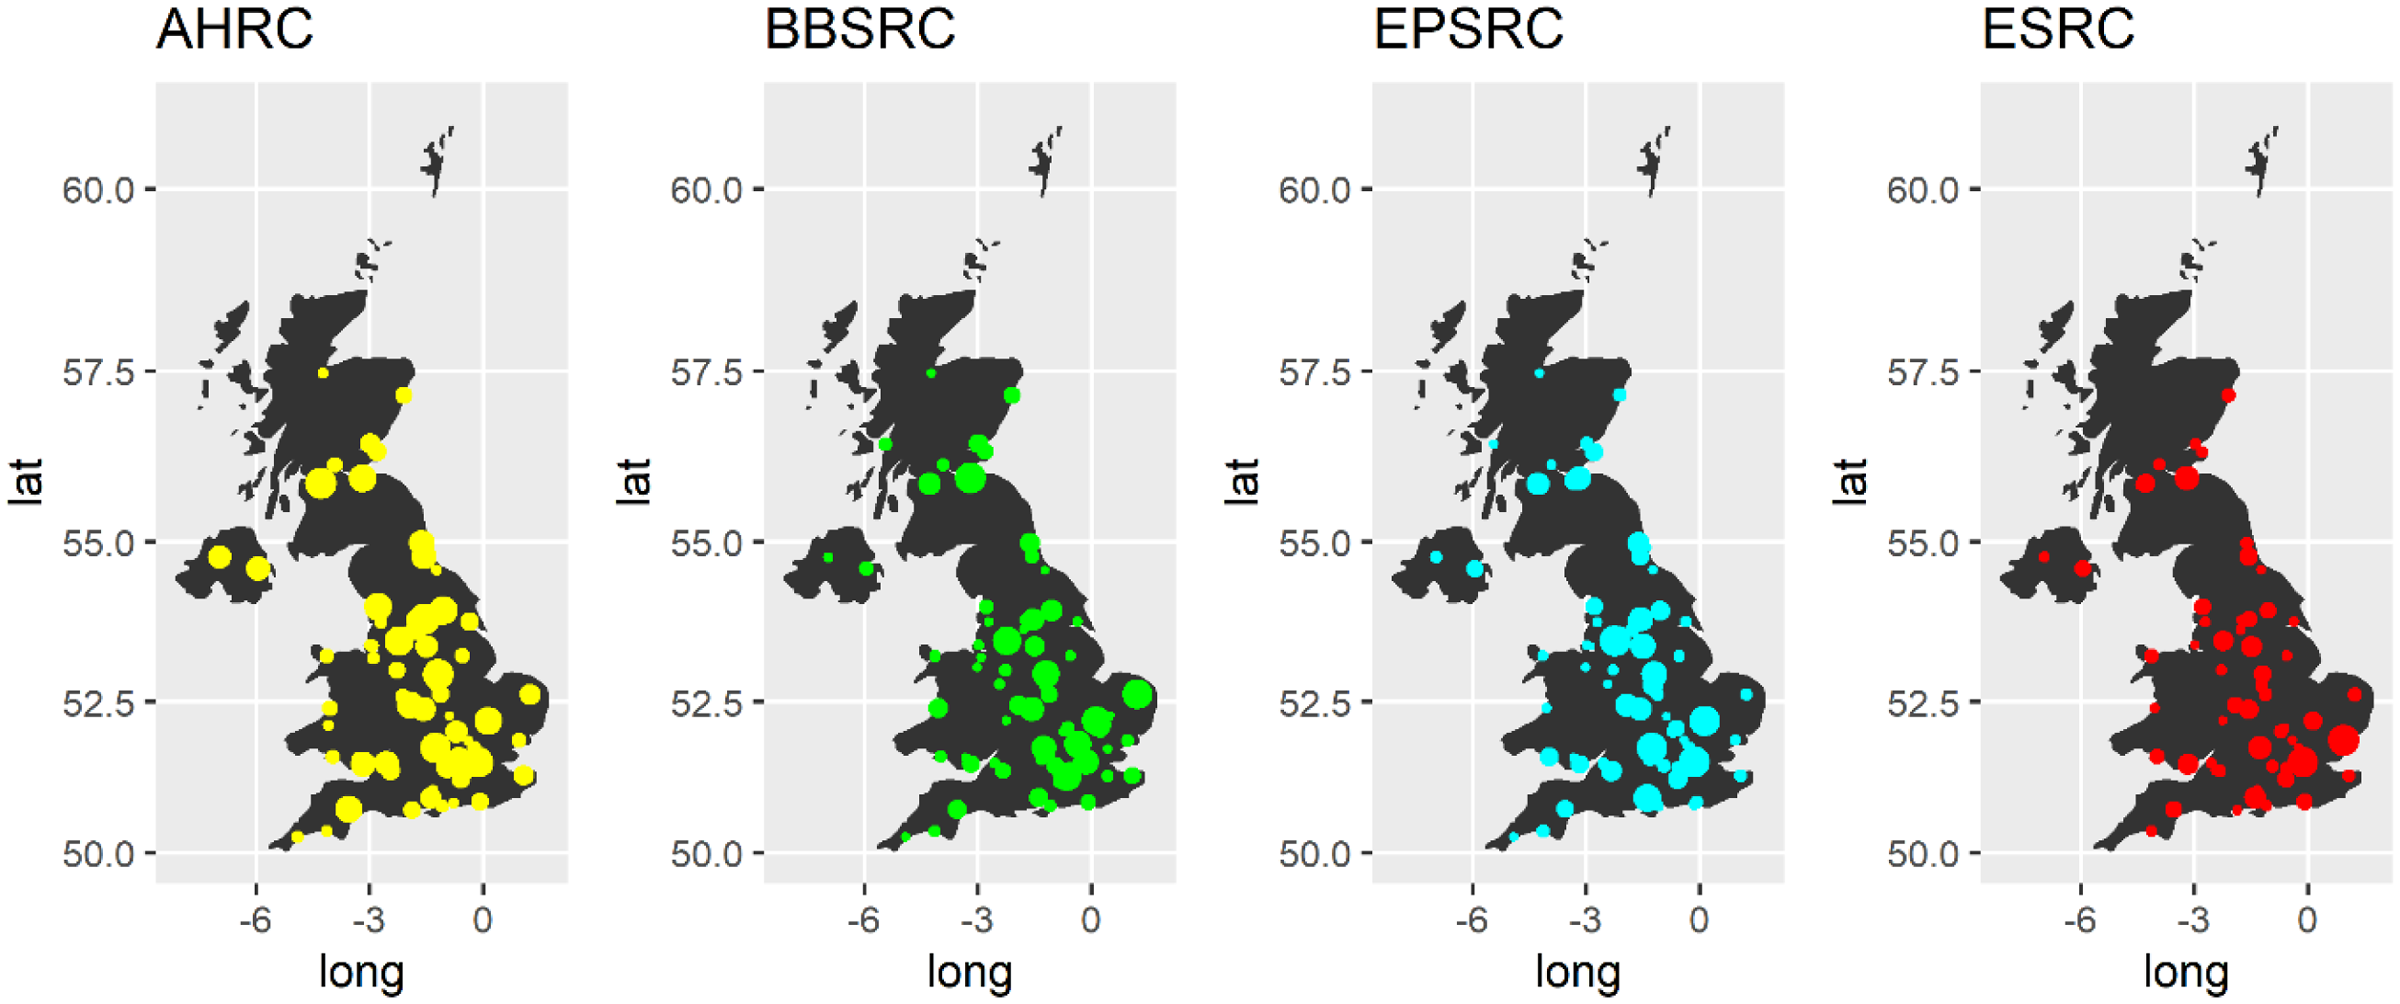
Map of funding levels to lead organizations.
AHRC collaboration network.

BBSRC collaboration network.

EPSRC collaboration network.

ESRC collaboration network.

4. Results
Table 2 presents the top leading institutions by the level of funding they receive from each research council. There is a high level of overlap amongst the different research councils, with elite UK universities (often part of the Russell Group) obtaining the most funding across disciplines. It is no surprise that the Pirbright Institute receives a high level of funding, given that its parent organization is the BBSRC.
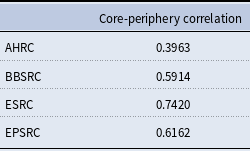
Correlation results for between the observed network matrix and the optimal core-periphery matrix
Top organizations by eigenvector centrality
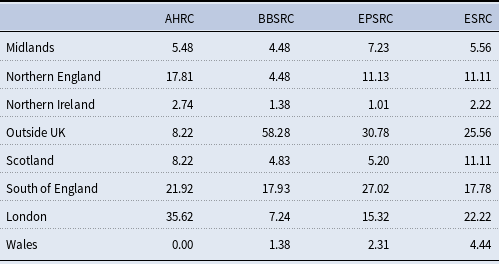
Percentage of total organizations in the network belonging to each region
ERGM results

***p $< 0.001$
; **
$< 0.001$
; ** $p < 0.01$
; *
$p < 0.01$
; * $p < 0.05$
.
$p < 0.05$
.
A descriptive analysis for each research council network is presented in Table 3 and includes a variety of network level metrics to inform on features of the collaboration networks. We observe that there are fewer organizations present in the backbone collaboration network in the AHRC and ESRC, compared to their counterparts in the sciences, where the networks are over three times the size. We can note that this is not simply a result of the level of funding awarded by the research councils, as the BBSRC awards similar levels (in terms of amount awarded) to the ESRC and AHRC.
Density is the ratio of observed ties to all possible ties in a network and acts as a measure of network connectivity (Wasserman & Faust, Reference Wasserman and Faust1994). We observe that although the networks vary in terms of size, they have more comparable levels of connectivity, where they are all relatively low (this can also be observed in the network visualizations presented in Figures 4–7). Network diameter is the longest geodesic distance in the network, where the geodesic distance refers to the number of relationships in the shortest possible path from one actor to another (Knoke & Yang, Reference Knoke and Yang2008). Average path length is the average distance between any two actors in the network. These results indicate that organizations are further apart in the AHRC collaborations, especially compared to the ESRC where they are much closer.
Degree assortativity captures the correlation between degree centrality of connected actors in a network (Newman, Reference Newman2002), where scores can be between −1 and 1. Degree centrality is the number of ties an actor has in the network (Freeman, Reference Freeman1978), in this empirical setting, it is the number of collaborative partners an organization has. A positive score would suggest that well-connected actors link to other well-connected actors, whereas a negative score, which would suggest that high degree actors are connected to many low degree actors, pointing toward a pattern of disassortativity in the network. The score is negative across research councils, indicating that there is a set of organizations with many collaborative ties that link to less connected collaborative partners. Other aspects of the network, such as centralization and clustering patterns, are presented through the use of the ERGM.
AHRC goodness of fit plots.
BBSRC goodness of fit plots.

EPSRC goodness of fit plots.

ESRC goodness of fit plots.

Figure 3 presents the geographical distribution of funding for each research council, the circles represent the lead organization that was funded by the research council, and the size of the node is the total level of funding they received over the time period. Across research councils, much of the funding is centered on institutions in the south of England, particularly London. Funding for the AHRC appears to be more evenly distributed compared to the other research councils. The BBSRC has higher level of funding awarded to Scottish institutions compared to the other research councils.
Figures 4–7 present the inter-organizational networks associated with each research council; networks were visualized using the Visone software (Baur et al., Reference Baur, Benkert, Brandes, Cornelsen, Gaertler, Köpf and Wagner2001) applying the layout outlined by Nocaj et al. (Reference Nocaj, Ortmann and Brandes2015). This layout algorithm puts an emphasis on structurally embedded ties, highlighting these ties and using these to drive the network layout. The red nodes represent members of the Russell Group. The networks represent the backbone, the statistically significant collaborative ties, where isolated nodes have been removed from the visualization and subsequent analysis.
The AHRC network (Figure 4) is significantly smaller and sparser than the other network, this is because the AHRC funds far less projects when compared to its counterparts in the sciences (as observed in Figure 1). The ESRC network (as seen in Figure 7) has a similar structure yet has a larger number of organizations present, whilst the BBSRC (Figure 5) and EPSRC (Figure 6) networks are much larger networks and are characterized by clusters, that is, areas of the network with higher level of connectivity. In the EPSRC network, this is the densely connected core.
These collaboration networks consistently have a core-periphery structure, where there is a densely connected core, with disconnected actors orbiting the center (Borgatti & Everett, Reference Borgatti and Everett2000). These structures point toward the potential for silos to emerge, which can result in constrained single loop learning (Argyris & Schoen, Reference Argyris and Schoen1978), rather than effective inter-organizational collaboration (Cronin, Reference Cronin2007). Table 4 confirms the core-periphery structure that is observed in the visualizations of the inter-organizational collaboration networks (employing the core/periphery analysis procedure documented in Borgatti et al., Reference Borgatti, Everett and Johnson2018). Table 4 presents the correlation between the observed network matrix and the optimal patterns matrix for a core/periphery structure. We observe high correlations for all research councils, in particular the ESRC, yet somewhat less so in the case of the AHRC.
An examination of top institutions by their global position in the networks is also undertaken. This is operationalized through the calculation of the eigenvector centrality of organizations in the collaborative networks. Eigenvector centrality captures the centrality of an organization’s collaborative partners; therefore, actors with a high eigenvector centrality will be well-connected organizations are connected to other well-connected organizations (Bonacich, Reference Bonacich1987). Therefore, eigenvector represents an ideal metric (compared to other centrality measures) to capture the importance of an actor in the collaboration system, as it allows to identify those at the core and most active in collaborative research projects funded by each research council.
Table 5 shows the top 10 institutions by eigenvector centrality in each research council network. These are mainly Russell Group universities, and the list is similar to the lead institutions that receive high levels of funding, as presented in Table 1. However, there are some nonacademic or non-UK-based institutions holding prominent positions in the networks. In the case of the AHRC, the British Library and the British Museum are both nonacademic institutions holding prominent positions; however, these are still considered elite institutions with close historical ties to Russell Group members. With the exception of the University of Leicester, all of the most central institutions in the ESRC network are Russell Group members. Similar patterns are observed for EPSRC; apart from the National Physical Laboratory, the most central universities are all Russell Group members.
Table 6 presents the percentage of total organizations belonging to each regional partition present in the network (these are only actors that are a part of the backbone of the network); here we expect to observe more organizations from regions with a higher population or a higher number of large cities (which are more likely to include a higher number of academic institutions). In the EPSRC and BBSRC networks, there is not only a higher level of nonacademic partners but also a higher proportion of international partners, based outside the UK. For the AHRC, we observe that there are no Welsh institutions in the backbone of the network. A potential explanation for this is that most of the employment in the creative sector that is closely aligned with the AHRC is concentrated in London and the South East (this is also observed in Table 6), with very little in Wales and Northern Ireland (Mateos-Garcia & Bakhshi, Reference Mateos-Garcia and Bakhshi2016). For the BBSRC and EPSRC, the majority of collaborators come from outside the UK. The BBSRC is less London centric, especially compared to the other research councils. Institutions collaborating on ESRC projects tend to be from London and the South of England; however, similar to the EPSRC and BBSRC, there is a high level of non-UK institutions. Extant work has identified that geographic proximity is important for university–industry collaborations, yet some regions contain more universities than others and therefore are potentially in a better position to establish collaborations with nonacademic partners. However, D’Este et al. (Reference D’Este, Guy and Iammarino2013) find that the impact of geographic proximity in the formation of university–industry ties is weakened when firms are located in dense clusters (especially tech clusters).
Academic and industry partnerships are often essential for the commercialization of knowledge (Perkmann et al., Reference Perkmann, Tartari, McKelvey, Autio, Broström, D’Este and Hughes2013); therefore, it is no surprise that it is on EPSRC projects where the majority of nonacademic partnerships are observed. The field of engineering is more applied and better suited for commercialization when compared to the other research council funders (Lee & Miozzo, Reference Lee and Miozzo2019), such as the AHRC. In university–industry collaborations, universities act as important centers for the development and creation of scientific knowledge (Dooley et al., Reference Dooley, Kenny and Cronin2016; Hemmert, Reference Hemmert2004), acting as entrepreneurial agents allowing firms to accrue innovative performance benefits (Caloghirou et al., Reference Caloghirou, Kastelli and Tsakanikas2004; Etzkowitz et al., Reference Etzkowitz, Webster, Gebhardt and Terra2000; Gassmann & Zeschky, Reference Gassmann and Zeschky2008; Huggins et al., Reference Huggins, Prokop and Thompson2019). Kumaramangalam (Reference Kumaramangalam2005) notes that in the UK biotech industry, there is the potential for firm-level benefits to be accrued from participating in academic collaborations, yet these can vary drastically between firms.
The results of the ERGM are given in Table 7; the parameter estimates are provided along with the standard errors in parentheses. For the regional activity effects, the baseline region is London; therefore, the results capture whether organizations from the region are more or less likely to form collaborative ties compared to London-based institutions.
Table 7 indicates that across research councils, members of the elite Russell Group are more likely to form collaborative ties, where there is a large and strongly positive and significant Russell Group activity effect in all four models. However, there is only a significant tendency for Russell Group universities to collaborate in the sciences, as shown by the positive and significant match effect in the BBSRC and EPSRC models. Whereas in the social sciences and humanities (AHRC and ESRC), there is not a significant tendency for elite Russell Group institutions to collaborate.
AHRC goodness of fit statistics

BBSRC goodness of fit statistics

EPSRC goodness of fit statistics

ESRC goodness of fit statistics

The ERGM results indicate that regional activity differs by research council. In the case of the AHRC, we observe that institutions from the North of England (North East, North West, and Yorkshire) are less likely to form collaborative ties than London-based institutions. For BBSRC-funded projects, there are several negative and significant effects, indicating that much of the collaboration in this discipline is London centric. There are negative and significant effects for Northern England, Northern Ireland, and outside the UK. There is a positive and significant Scotland activity effect; this suggests that Scottish institutions are more likely to be involved in BBSRC collaborative ties than their London-based counterparts. There is a weakly positive and significant South of England activity effect.
Collaborative ties on EPSRC-funded projects tend to be London centric, with a set of negative and significant regional activity results. This indicates that institutions from all other regions are less likely to form collaborative ties than London-based institutions. In Scotland, there is a range of initiatives related to EPSRC disciplines to promote knowledge exchange and collaborations (Kitagawa, Reference Kitagawa2010). For instance, there is the Scottish Universities Physics Alliance, which aims to foster physics-related partnerships in Scotland. However, there is no significant Scottish activity effect, indicating that the involvement of Scottish consortiums does not surpass London-based organizations.
In the case of the ESRC, there are only negative and weakly significant regional activity effects for the North of England and Northern Ireland. This suggests a weaker link between regional partition and collaborative activity for economics and the social sciences.
Across research councils, there is a positive and significant regional homophily effect. This indicates that even geographic distance plays an important role in the formation of collaborative ties, regardless of discipline.
The network effects of degree centralization and clustering indicate that collaborative ties are more hierarchical in the sciences, compared to the social sciences, humanities, and arts (the AHRC and ESRC-funded projects). There is a negative and significant degree centralization effect for the BBSRC and EPSRC networks. This indicates that for these research councils’ collaborative ties are concentrated in a small handful of organizations, rather than spread out evenly throughout the system, pointing toward a more hierarchical structure, where for the AHRC and ESRC the degree centralization parameter is non-significant.
The clustering parameter is positive and significant across research council networks, this indicates that these networks are characterized by areas of higher density; this can also be observed in the network visualizations. Furthermore, it suggests that there is a tendency for triadic closure in the network, that if two organizations share collaborative partners, they are also likely to collaborate. This process occurs regardless of research council discipline, yet the effect is larger in the hard science (BBSRC and EPSRC), compared to the social sciences (AHRC and ESRC).
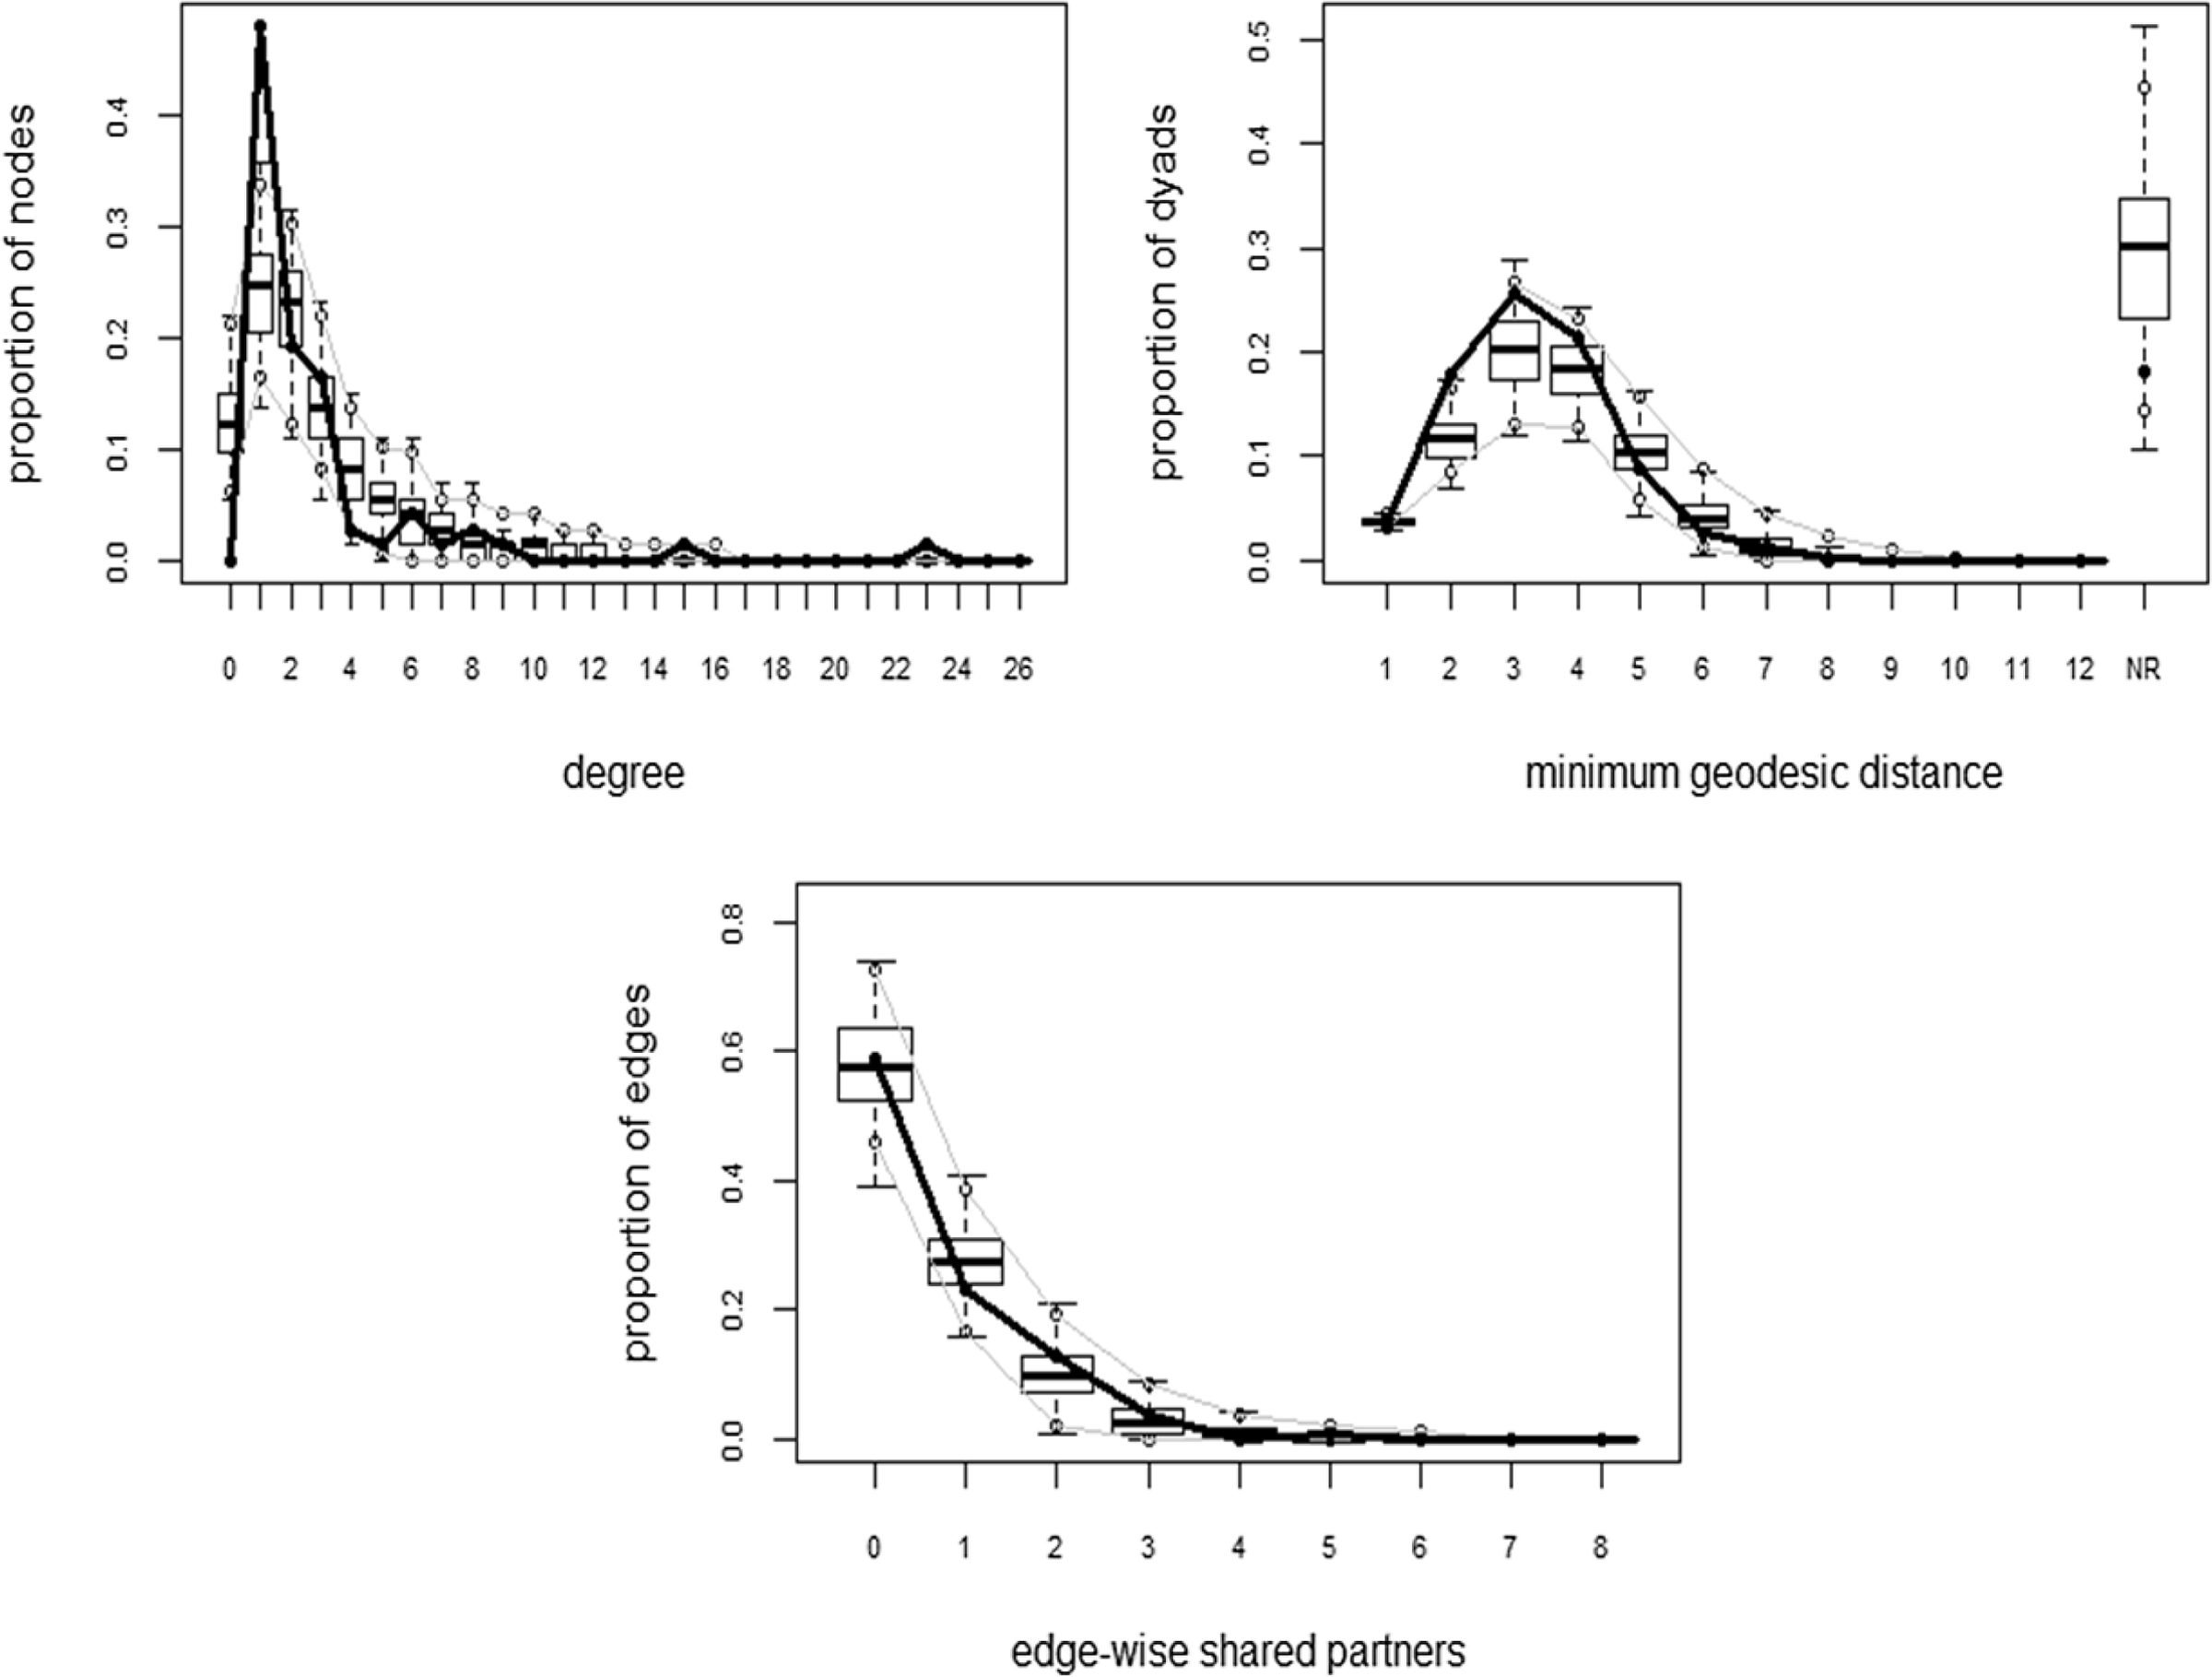
In order to assess whether the models sufficiently explain the observed networks and data, goodness of fit procedures are carried out. The goodness of fit procedure compares the salient structural features of the observed networks with a set of networks simulated from the estimated ERGM (Hunter et al., Reference Hunter, Goodreau and Handcock2008a). If the model is a good fit, then the simulated networks would share characteristics with the observed networks. The results for the goodness of fit for each research council are given in Figures 8–11.
We observe that the ERGMs are able to reasonable explain degree patterns for each research council (yet less so in the case of EPSRC). The models are also able to sufficiently explain minimum geodesic distance and edgewise shared partner patterns.
In addition to the goodness of fit plots presented in Figures 8–11, Tables 8–11 give the goodness of fit summary statistics. For each effect specified in the model, it gives the observed value, along with the minimum, maximum, and mean for the effect in the set of simulated networks. Tables 8–11 also report the Monte Carlo p-values, which are the proportion of the simulated values of the effect that are at least as extreme as the observed value. Therefore, in this case a small p-value (less than or equal to 0.05) indicates cases where the model is not able to produce the particular effect or network characteristic (Luke, Reference Luke2015).
The tables, in combination with the goodness of fit plots presented in Figures 8–11, show that the ERGMs for the cases of AHRC, ESRC, and BBSRC are a relatively good fit, capturing many of the network characteristics. However, in the case of the EPSRC (although it is able to reproduce many other salient characteristics), the tables indicate that the model is not able to fully explain the degree centralization patterns in the networks (with an MC p-value below 0.05). This suggests that in the case of engineering and the physical sciences, group membership and geography are not enough to explain degree patterns. This indicates further research is required to understand what other features shape degree centralization patterns in a collaboration network in the (hard) sciences.
5. Discussion and conclusion
This paper addresses three key research questions regarding the formation of collaborative ties on UK research council projects. The first research question asked what the factors underpinning the formation of collaborative ties are and whether differences emerge between research councils. The results from the ERGM provide an answer to this question, in particular the estimated degree centralization and clustering effects. In the BBSRC and EPSRC models, there was a negative and significant effect, pointing toward collaborative ties being concentrated in a handful of organizations in these networks, which contrasted to the case of the AHRC and ESRC. This provides a strong indicator that the discipline and the setting of research matter for the formation of collaborative ties. Collaboration in the humanities and social sciences follows a different process to the hard sciences (in particular engineering and biological sciences). However, the tendency for clustering and triadic closure was observed across the research council networks, although this effect was larger in the case of BBSRC and EPSRC. The presence of a connected core arising from collaboration on funded projects is not unique to these two UK research councils; Breschi & Cusmano (Reference Breschi and Cusmano2004) find that a network of R&D joint ventures arising from the EU Frameworks Program (FP) is characterized by an “oligarchic core.” Furthermore, Maggioni et al. (Reference Maggioni, Uberti and Nosvelli2014) find that knowledge flows arising from EU-funded research networks (as part of the fifth Framework Program) are characterized by a hierarchical network structure with a high level of activity concentrated in core economic regions.
The second research question asked what the role of geography is in the formation of collaborative ties—whether collaboration tend to be London centric. In addition, whether geography plays the same role across disciplines? From the ERGM results, we observe that geography had a significant effect on collaboration, with some regions being more active than others, with clear differences between the research councils. Furthermore, there was a strong tendency for collaboration to occur within the same regional partition. This indicates that distance matters when forming collaborative ties on research council-funded projects.
At the regional level, the ERGM results point toward potential policy implications, as there are far fewer collaborative partnerships being developed that involve institutions for the North of England. This points toward a need to develop either academic capabilities in the region or to better engage nonacademic institutions from the region in research-funded partnerships. There have already been some attempts to establish consortiums in Yorkshire and Humber through the White Rose Consortium (a strategic partnership between the Universities of Leeds, Sheffield, and York) (Harrison et al., Reference Harrison, Smith and Kinton2017), yet this is a partnership of Russell Group universities and is not replicated in other areas of the North of England.
The final research question posed addresses the issue of belonging to a university mission group and collaboration participation. More specifically, it asked whether elite universities, those belonging to the Russell Group, are more active in collaboration on UK research council-funded projects. The descriptive analysis examining where funding and eigenvector centrality were concentrated provided some insights to address this question. Members of the Russell Group received the most funding from these four research councils and were amongst the most central organizations in all of the networks. The ERGM results confirmed this finding, where members of the elite Russell group were much more likely to establish collaborative ties in the networks, with a positive and significant effect in all four models. This effect was particularly large in the case of the EPSRC. This suggests that there is a need for research councils to ensure that projects are not limited to this small subset of UK institutions, to foster collaboration outside of these 24 universities, indicating that university status should be considered in research council funding allocation decisions. However, the Russell match parameter indicated that only in the hard sciences (BBSRC and EPSRC) we observed collaboration between Russell group members; the same tendency is not observed for ESRC and AHRC. This perhaps indicates potential competitive effects in these disciplines (although the effect was not negative and significant for these research councils).
There are a number of limitations to this work, which can be explored further in future research. Firstly, our examination of the network is restricted to the backbone, that is, the binary version of the network. Future work could make use of alternative modeling framework, to explicitly account for the edge weights (such as Wilson et al., Reference Wilson, Denny, Bhamidi, Cranmer and Desmarais2017), this would allow for a different set research question related to exploration and exploitation collaboration on research council-funded projects to be tackled (Cronin, Reference Cronin2007; Gilsing & Nooteboom, Reference Gilsing and Nooteboom2006; Gilsing et al., Reference Gilsing, Nooteboom, Vanhaverbeke, Duysters and van den Oord2008), and to explain the intensity of collaborative ties. However, it is key to note that these models are more computationally intensive, especially for some of the larger network presented in this case, than the standard, binary ERGMs. Future work could also explore what determine organizational-project ties (rather than inter-organizational ties), through the use of a two-mode ERGM.
A further line of future research could investigate how collaborative patterns differ from one REF period to the next (such as from REF2014 to REF2021). For instance, do universities strategically collaborate following the REF? Are they likely to collaborate with those that performed better in the previous REF? A multiplex network analysis (Nicosia & Latora, Reference Nicosia and Latora2015) or graph matching approaches (Emmert-Streib et al., Reference Emmert-Streib, Dehmer and Shi2016) could be used in future work to address these questions. A further avenue for research could also explore the link between these collaboration networks and subsequent REF results; is holding a more central position in this collaboration network associated with a better ranking or performance in specific Units of Assessment in the REF exercise?
This work focuses on the UK setting; however, there are numerous other institutional settings that also use research funding as a key policy tool (often to encourage innovative activity). One prominent example is the Horizon 2020 program in the EU. Future research could examine the process underpinning inter-organizational networks arising from EU funding and compare and contrast to the single country case.
This research focuses on a single snapshot, using the REF as a frame; however, future work could compare and contrast two different REF cycles, to examine if any differences arise, and to better examine further political influence (such as change in government) impacts the formation of inter-organizational networks arising from collaborative arrange on UK-funded projects.
Future work could also consider this as a multiplex network (Battiston et al., Reference Battiston, Iacovacci, Nicosia, Bianconi and Latora2016), where each research council collaborative partnerships are considered to be layers in the same system, rather than examining them as separate networks (Lazega & Pattison, Reference Lazega and Pattison1999).
Competing interests
None.


 Open access