


1. Introduction
Rice is a vital source of earning foreign currencies in many Southeast Asian nations (Kea et al., Reference Kea, Li, Shahriar, Abdullahi, Phoak and Touch2019). After maize and wheat, rice is the world’s third-largest-produced crop (Held, Reference Held2021; Javed and Ghafoor, Reference Javed and Ghafoor2013). It is one of the most important food grains in the world (Irshad et al., Reference Irshad, Xin and Arshad2018). Rice is a major staple food in the world (Debnath et al., Reference Debnath, Babu, Ghosh and Helmar2018; Issar and Varma, Reference Issar and Varma2016; Kea et al., Reference Kea, Li, Shahriar, Abdullahi, Phoak and Touch2019, Reference Kea, Li, Shahriar and Abdullahi2020; Manjunatha et al., Reference Manjunatha, Achoth and Mamatha2017; Mariyono, Reference Mariyono2018; Mottaleb and Mishra, Reference Mottaleb and Mishra2016; OECD and FAO, 2012; Thompson et al., Reference Thompson, Wailes, Durand-Morat and Leister2015) and is produced not only for the domestic market but also for exports. Although the world market for rice has inelastic supply and demand, it is competitive due to residual demand from importing countries and price competition among exporters (Adhikari et al., Reference Adhikari, Sekhon and Kaur2016; Hui and Turay, Reference Hui and Turay1995). Karp and Perloff (Reference Karp and Perloff1996), and Mariyono (Reference Mariyono2018) have emphasized that the international market for rice is narrow, which is catered by only a few rice-producing countries.
As a major staple food for 3.5 billion people (Fathelrahman et al., Reference Fathelrahman, Osman, Hoag, Sixt and Strzepek2024), rice has a key source of daily dietary energy (Durand-Morat et al., Reference Durand-Morat, Nalley and Thoma2018; Fukagawa and Ziska, Reference Fukagawa and Ziska2019; Mottaleb and Durand-Morat, Reference Mottaleb and Durand-Morat2024; Nguyen, Reference Nguyen2002; Peterson-Wilhelm et al., Reference Peterson-Wilhelm, Nalley, Durand-Morat, Shew, Tsiboe and Mulimbi2023; Tsiboe et al., Reference Tsiboe, Nalley, Durand, Thoma and Shew2017; Wiseman et al., Reference Wiseman, Luckstead and Durand-Morat2021). Importantly, rice accounted for 780 and 689 kcal/capita/day of the food supply in Asia and India, respectively (Pradhan et al., Reference Pradhan, Mondal, Bisen, Jambhulkar, Kumar and Mishra2023; Rathna Priya et al., Reference Rathna Priya, Eliazer Nelson, Ravichandran and Antony2019). In Southeast Asia, approximately one-third of daily caloric intake comes from rice (Wiseman et al., Reference Wiseman, Luckstead and Durand-Morat2021). In developing nations, rice contributes 715 kcal/capita/day, accounting for 27% of dietary energy, approximately 20% of dietary protein and 3% of dietary fat (Sen et al., Reference Sen, Chakraborty and Kalita2020). Globally, rice is the single most important food item in terms of calorie intake, accounting for an average of 56 kg per capita consumption, or more than 20% of the human dietary energy (Calpe, Reference Calpe2006). Along with calories, rice is a significant source of iron, folic acid, thiamin, manganese, magnesium, phosphorus, selenium, and niacin (Fukagawa and Ziska, Reference Fukagawa and Ziska2019; Mohidem et al., Reference Mohidem, Hashim, Shamsudin and Che Man2022). Hence, rice plays a critical role in caloric intake and food security for a large number of population.
Over the past three decades, the consistent growth of rice production in India has not only ensured food security in the nation but also helped to become one of the world’s largest rice exporters. India emerged as a major rice exporter in the 1990s, and currently it is among the top exporters in the world (Adhikari et al., Reference Adhikari, Sekhon and Kaur2016; Manjunatha et al., Reference Manjunatha, Achoth and Mamatha2017). In this debate, Issar and Varma (Reference Issar and Varma2016) reported that India ranks first in rice exports among 40 countries, approximately exporting 13 million tons of rice in 2018. They mentioned that as a traditional exporter of rice India can sustain its status as a major rice exporter and even further expand its market base. In 2020, the value of India’s rice export in the global market stood at US$ 8 billion.
India ranks number two in the world in production of rice and number one in exports holding a share of 31% of global rice trade in 2020. During 2010–2012, India contributed around 22% of total world rice export (Narayan and Bhattacharya, Reference Narayan and Bhattacharya2019). A study by Manjunatha, Achoth, and Mamatha (Reference Manjunatha, Achoth and Mamatha2017) noted that India was the largest exporter of rice in 2014–15, with share of 27% in the global trade in rice. Hence, India is a net exporter of rice (Debnath et al., Reference Debnath, Babu, Ghosh and Helmar2018; OECD & FAO, 2022) in the global market. In a recent report, the OECD and FAO (2022) pointed out that over the next decade, global rice trade growth will be sustained by production excess in India, as output is anticipated to expand faster than domestic demand. Thus, India plays a significant role in the global rice market.
Table 1 depicts rice export performance of major exporting countries where global rice export is heavily concentrated in these five countries. During 2006 to 2010, India’s export volume was low and stagnant, remaining in the range of two to four million tonnes annually. We observed that Thailand, India’s top rice competitor, has dropped their rice exports significantly since 2019. Importantly, India’s rice exports in the global market have increased steadily since 2012 and with 22.12 million tonnes of export volume it reached at its peak in 2022. This persistent performance in exports over the years helped India to attain the position of world’s largest exporter of rice.
Top five rice exporting countries during 2006–2023

Source: USDA, Export volume: Million tonnes.
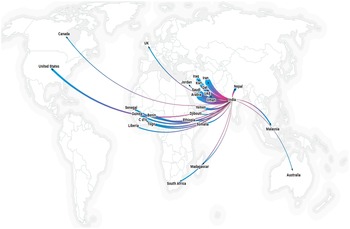
In 2020, India had the world’s largest export share of rice, accounting 31% of global exports, followed by Thailand (15%), Vietnam (11%), Pakistan (8%), and U.S.A. (7%). Furthermore, according to USDA (2023) database, India’s rice export share has significantly increased to approximately 41.20% of global exports during 2021–23, followed by Thailand (14.60%), Vietnam (13.90%), Pakistan (7.80%), and the United States (4.80%). The major export destinations of India’s rice in 2020 have been shown in Appendix Figure A1 (export destinations). In 2020, rice contributes more than 20% of total agriculture export basket from India, and it is also the most exported agricultural produce from the country. Therefore, Narayan and Bhattacharya (Reference Narayan and Bhattacharya2019) pointed out that rice is considered to be India’s most competitive Agri-produce in terms of export as compared to wheat, cotton, and sugar. Indeed, competitiveness of rice plays a critical role in bridging the gaps in India’s soaring trade deficits and helps in maximizing the overall gains from international trade.
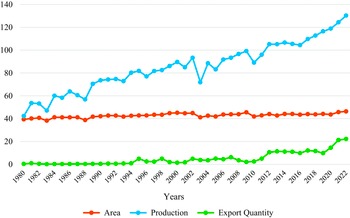
Figure 1 plots India’s area, production, and export of rice spanning from 1980 to 2022. This figure illustrates that the production and exports of rice in India have continuously increased over the last four decades while its area has remained almost stagnant. In 1980, rice occupied 39.42 million hectares of land with 42.33 million tonnes production which has remarkably reached 130.29 million tonnes of production with 49.38 million hectares of land in 2022. Simultaneously, in 1980, India’s rice export volume was meagre 0.43 million tonnes which has reached to a staggering figure of 22.24 million tonnes in 2022. Figure 1 depicts that India’s rice export has increased moderately from 1994 to 2010. However, after 2010, the country’s rice export increased steadily till it reached its highest figure in 2022. A recent study by Mottaleb and Durand-Morat (Reference Mottaleb and Durand-Morat2024) stated that India has significantly captured 38.5% of the global rice export market during 2020–2022.
India’s rice area, production, and export during 1980–2022. Area: Million hectares, Production: Million tonnes, and Export volume: Million tonnes. Source: UN Comtrade database and agricultural statistics at a glance 2021, DA&FW, Government of India.

India’s trade policy has been generally favorable to export of agricultural commodities including rice. However, occasionally India had either put restrictions or banned rice exports to ease out domestic market conditions. During 2007–2008, due to rapid increase in price of rice and to maintain domestic supply, India banned rice exports, except for basmati rice (Childs and Kiawu, Reference Childs and Kiawu2009; Clarkson and Kulkarni, Reference Clarkson and Kulkarni2011). Again, in July 2023, India banned exports of non-basmati rice (Glauber and Mamun, Reference Glauber and Mamun2023; Valera et al., Reference Valera, Mishra, Pede, Yamano and Dawe2024), which accounted for roughly 25% of all rice exported from the country (Fathelrahman et al., Reference Fathelrahman, Osman, Hoag, Sixt and Strzepek2024). But, despite these bans, India had exported 22.12 million tonnes of rice in 2022. Even during the period of trade restrictions, India allowed export of non-basmati rice to Bangladesh, Maldives and other food deficit countries from Sub-Saharan Africa. Overall, India’s rice export ban was either temporary or partial, and the country has been exporting huge quantity of rice in the global market to cater to the dietary needs other nations.
1.1. Motivation and significance of the study
Given the importance of rice in India’s overall agri-exports, the motivation behind this study is to explore what influences the competitiveness of rice export from India. The purpose of this article is to examine the key factors that affect India’s rice export competitiveness in the international market using the auto regressive distributed lag (ARDL) model. The literature on international business has explored several dimensions of export competitiveness related to various products including agricultural products. According to Kea et al. (Reference Kea, Li, Shahriar, Abdullahi, Phoak and Touch2019), there have been several studies that have found the export determinants of a particular commodity or a group of agricultural commodities; such as cocoa (Abolagba et al., Reference Abolagba, Onyekwere, Agbonkpolor and Umar2017; and Abdullahi et al., Reference Abdullahi, Zhang, Shahriar, Kea and Huo2022), cotton (Narayan and Bhattacharya, Reference Narayan and Bhattacharya2019; and Sharma and Bugalya, Reference Sharma and Bugalya2014), dates (Esmaeili, Reference Esmaeili2014), fish (Rani et al., Reference Rani, Immanuel and Ranjan2014), rice and coffee (Ilyas et al., Reference Ilyas, Mukhtar and Javed2009; Kea et al., Reference Kea, Li, Shahriar and Abdullahi2020; Lakkakula et al., Reference Lakkakula, Dixon, Thomsen, Wailes and Danforth2015; and Nguyen, Reference Nguyen2022), soybean (Boerema et al., Reference Boerema, Peeters, Swolfs, Vandevenne, Jacobs, Staes and Meire2016; and Wang, Reference Wang2016), tea (Hwang and Lim, Reference Hwang and Lim2017; Khaliqi et al., Reference Khaliqi, Gurning, Novanda and Simamora2020; Samudera et al., Reference Samudera, Daryanto and Saptono2017), pork (Shahriar et al., Reference Shahriar, Qian and Kea2019), egg (Tamini et al., Reference Tamini, Doyon and Simon2016), sea-food (Natale et al., Reference Natale, Borrello and Motova2015), fresh fruits (Bhattacharya, Reference Bhattacharya2019), sugar (Dlamini et al., Reference Dlamini, Edriss, Phiri and Masuku2016 and Narayan and Bhattacharya, Reference Narayan and Bhattacharya2019), sesame (Baker and Yuva, Reference Baker and Yuya2020), and shrimp (Khan et al., Reference Khan, Hossain, Islam, Rahman and Dey2022).
The above studies collectively offer a solid contribution to the body of literature on the commodity-specific model for agri-trade competitiveness. In their study, Atif et al. (Reference Atif, Haiyun and Mahmood2017) have mentioned that the trade determinants are among the most important questions that are also indicative of competitiveness. Further, Abbas (Reference Abbas2022) has reported that agri-products competitiveness and their export performance have been determined by production and trade-related factors. But one of the most important questions that still draws attention of the researchers is what determines success (competitiveness) in the international trade of a product like rice. However, the key determinants of the competitiveness of Indian rice exports have not yet been explored fully. In this debate, Adhikari et al. (Reference Adhikari, Sekhon and Kaur2016) asserted that it is critical to recognize the product-specific dynamics and their major determinants, more so in the case of agricultural commodities. Therefore, this study would help bridging some of the existing gaps in the literature on the key influencing factors of Indian rice exports.
The remainder of this paper is organized as follows. Section 2 describes the literature framework and provides a brief review of literature on export determinants for rice and other agri-products. In Section 3, econometric modeling approach employed in this research is discussed in detail along with data sources. Section 4 discusses the empirical results. Finally, Section 5 presents the concluding remarks.
2. Literature review
The main intention here is to provide literature support which will help in framing study objectives and model building. Product-level export competitiveness has always been a central issue in international business. However, there is lack of consensus among the researchers regarding its determinants and measurement. Bilal and Rizvi (Reference Bilal and Rizvi2013) asserted that production, yield and international demand are positively correlated while export and domestic prices are negatively correlated with the rice export from Pakistan. Javed and Ghafoor (Reference Javed and Ghafoor2013) suggested that cost of production, domestic prices and high-quality standards of Pakistani rice were among the major factors that helped in targeting high priced markets. They suggested that sale price, marketing cost, and exporters’ educational level have also influenced the export of rice. Ahmad and Garcia (Reference Ahmad and Garcia2012) commented that export prices, bilateral trade agreements, better marketing efforts, and Sanitary and Phyto-sanitary (SPS) measures would enhance Pakistan’s rice export in the world market. Abolagba et al. (Reference Abolagba, Onyekwere, Agbonkpolor and Umar2017) have found that production and producer price have positively influenced cocoa export while domestic consumption, exchange rate, world price of cocoa, and interest rate have negatively affected cocoa export in Nigeria. Further, Kea et al. (Reference Kea, Li, Shahriar, Abdullahi, Phoak and Touch2019) have explored major export determinants of Cambodia’s rice during 1995 to 2016. The findings revealed that per capita GDP, total rice import, total rice export, Chinese language, exchange rate policy, and land growth have positive significant impact on the Cambodia’s rice export. Based on the short-run regression model, Kea et al. (Reference Kea, Li, Shahriar and Abdullahi2020) have attempted to examine the relative export competitiveness of the Cambodian rice sector. They found that Everything but Arms and the Chinese Belt and Road initiatives have significant impact on the relative export competitiveness of Cambodian rice. The study also showed that higher per capita income has positive significant impact while higher domestic prices have negative significant impact on the relative export competitiveness of Cambodian rice. Recently, Nguyen (Reference Nguyen2022) argued that partner’s GDP has significant negative impact on Vietnam’s rice export while it has positive influence on coffee export. Trade agreements and regional economic block can enhance Vietnam’s export performance.
In case of India, Kumar et al. (Reference Kumar, Rai and Rai2008) found out that export price, exchange rate, and world market size were the main determinants of export and competitiveness in the case of cucumber and gherkin export during 1990 to 2005. Adhikari et al. (Reference Adhikari, Sekhon and Kaur2016) concluded that India’s rice export has been highly price sensitive. Simultaneously, Suresh and Mathur (Reference Suresh and Mathur2016) have examined export performance of India’s major agri-products and their competitiveness. They said that cotton, maize, and certain fruits and vegetables have increased their comparative advantage, though rice and wheat have reduced their competitiveness. In addition, Bhattacharya (Reference Bhattacharya2019) investigated India’s fresh fruits export determinants and their competitiveness from 1971 to 2012 using ARDL model. The results of the long-run elasticity demonstrated that importing nations‘ GDP per capita, domestic fruit prices, agricultural investment, and real effective exchange rate have a positive influence on Indian fresh fruit competitiveness, but local prices have a negative impact. Narayan and Bhattacharya (Reference Narayan and Bhattacharya2019) found that between 1960 and 1970 India’s rice had competitive disadvantage, while in 1980s country’s rice was strongly competitive. However, India’s rice exports were always less competitive compared to Thai rice export and world rice export during 1960 to 2012. They mentioned that India’s green revolution, particularly in its third phase (1981–1990), improved the relative export competitiveness of rice. In this discussion, Sharma et al. (Reference Sharma, Kathuria and Kaur2022) suggested that price and quality were the major factors that could strengthen competitiveness of Indian vegetable products in the global market.
The above literature review presents a set of determinants/ influencing factors (variables) of competitiveness for a variety of agricultural products. It also demonstrates different modeling approaches that have been adopted by the existing studies to analyze the export determinants. But these studies did not go deeper into the causes of competitiveness. Most of the above studies have employed gravity models to analyze product’s determinants and their impact on export competitiveness. Although the gravity model focuses on the trade flow of a commodity between two countries rather than the impacts of influencing factors on the product’s competitiveness. Further, it is unable to solve the complexity of econometric modeling issues in time series data. Therefore, we tapped a recent and advanced econometric approach to explore significant determinants and their impact on export competitiveness using an aARDL model. Currently, the ARDL approach is gaining more popularity in time series analysis. In this study, we have employed an ARDL model to explain the influencing factors (determinants) and their short-run and long-run relationships on product level competitiveness in the case of rice, one of India’s majorly exported agri-products.
3. Theoretical framework and econometric model
This study analyses the determinants and influencing factors on India’s rice export competitiveness for the period from 1990 to 2020. Competitiveness is a multidimensional concept and has been measured through various dimensions and indicators (Bhawsar and Chattopadhyay, Reference Bhawsar and Chattopadhyay2015). As the focus of this study is on rice, we have taken export competitiveness as a major dimension of competitiveness. India is a top exporter of rice and remains ahead of Thailand, Vietnam, Pakistan, and United States of America, the other leading exporting countries. The Sub-Saharan Africa and Asia are among the largest rice importing regions of the world. The market structure for rice in the international market is oligopolistic type, wherein the top five players together command more than 80% market share. In majority of her export destinations, India faces significant price competition from other exporting nations. In this study, the factors determining rice export from India will be analyzed by employing the ARDL model, where the percentage share of rice export in total agriculture exports from India is being regressed against the cost of production, yield, export price, exchange rate, world market size, and openness. The choice of variables (both dependent and independent) in this study has been largely influenced by the past study findings. The review of extant literature on export competitiveness confirms that the six independent variables (market size, product yield, production cost, exchange rate, country’s trade openness, and export price) included in the model are among the most important economic factors, which have the potential to impact an agri-product’s export performance in the international market (Table 2).
Determinants of export competitiveness based on select past studies

Source: Author’s compilation from the literature on competitiveness.
The dependent variable, on the other hand, is selected to emphasize the relative importance of a product in the overall export basket of the country. As export and competitiveness are intertwined, it is assumed that a better performance in export front would indicate a higher level of competitiveness. Given that the main objective of the study is to identify the factors that can potentially influence rice exports from India, the product’s share in total agricultural exports is the key aspect for investigation. Accordingly, the share in country’s total agri-exports has been chosen in preference over other conventional indicators of competitiveness like revealed comparative advantages, etc. The choice of rice as a product for analysis is obvious as it is the most dominant agri-product exported from India.
Based on the above discussions, we developed a conceptual framework for the model, which is depicted in Figure 2. The model demonstrates the relationship between key determinants and their significant impact on rice export competitiveness. Here, we posit the following specification to determine the product-level competitiveness. The model specified is based on the classical production function approach, which can be written in the following form:
Conceptual framework of the model.

 $$Y=\alpha _{0}+\alpha _{1}X_{1}+\alpha _{2}X_{2}+\alpha _{3}X_{3}+\alpha _{n}X_{n}+\in _{t }$$
Y = dependent variable, α 0 = Constant, α is = Parameters.
X 1 X 2 X 3 X n = Independent variables and ∈ t = Error term.
Therefore,
 $$PSR_{t}=\alpha _{0}+\alpha _{1}MS_{t}+\alpha _{2}RY_{t}+\alpha _{3}ER_{t}+\alpha _{4}PC_{t}+\alpha _{5}OP_{t}+\alpha _{6}EP_{T}+\in _{t }$$
where PSR t = percentage share of rice in India’s total agriculture export, MS = market size, RY = rice yield, ER = exchange rate, PC = production cost of the rice, OP = trade openness, EP = export price, t = time, and ∈t = error term. As pointed out by Islam and Tiku (Reference Islam and Tiku2005), errors have traditionally been assumed to be normally distributed in the regression model.
Further, Hassan et al. (Reference Hassan, Kausar and Arshed2022) argued that log–log transformation approach provides robust, efficient, and consistent results in the ARDL model with time series export determinants. This approach is used as a benchmark model (Saleem et al., Reference Saleem, Shabbir and khan Bilal2020). Accordingly, the equation number 2 is converted into a natural log–log linear production function in the following manner:
 $${lnPSR}_{t}=\alpha _{0}+\alpha _{1}lnMS_{t}+\alpha _{2}lnRY_{t}+\alpha _{3}lnER_{t}+\alpha _{4}lnPC_{t}+\alpha _{5}lnOP_{t}+\alpha _{6}lnEP_{t}+\in _{t}$$
Here ln is defined as natural logarithmic values of the dependent and independent variables of the model and α1, α2, α3, α4, α5, and α6 are the long-run elasticities of PSR (i.e., percentage share of rice export in total agricultural exports from India) with respect to MS, RY, ER, PC, OP, and EP, respectively. This helps to find out the long-run relationship between the dependent and independent variables as given in equation (3).
3.1. Unit roots tests
To confirm the stationarity in the time series data, we employ augmented Dickey Fuller (ADF) (Dickey and Fuller, Reference Dickey and Fuller1979) and Phillips–Perron (PP) (Phillips and Perron, Reference Phillips and Perron1988) unit root tests. To employ the ARDL model, ADF and PP tests ensured that variables should not have the second order I (2) (Baek and Koo, Reference Baek and Koo2009; Ferreira and Harrison, Reference Ferreira and Harrison2012; Gamal et al., Reference Gamal, Rambeli, Jalil and Viswanathan2019; Muhammad and Zheng, Reference Muhammad and Zheng2010; Sun and Zhou, Reference Sun and Zhou2018). Studies by Narayan and Narayan (Reference Narayan and Narayan2004), and Pesaran et al. (Reference Pesaran, Shin and Smith2001) advocated that the ARDL model is considered the best econometric method compared to others in a case when the variables are stationary at I (0) or integrated of order I (1). In this debate, Ali and Li (Reference Ali and Li2018); and Shrestha and Bhatta (Reference Shrestha and Bhatta2018) said that an ARDL model is an ordinary least square (OLS) based model, which is applicable for mixed order of integration. In fact, ARDL model is considered to be the best econometric method compared to others in cases where the variables are stationary at I (0) or I (1) (Bal et al., Reference Bal, Dash and Subhasish2016). The unit root results are presented in Table 4. The results of all the unit root tests suggest mixed orders of integration for the variables. Further, we have chosen the orders of the lags (2,2,2,1,2,0,0) in the ARDL model using Akaike’s information criterion (AIC). Table 5 reveals the orders of the optimal lags length for ARDL model.
3.2. Autoregressive distributed lag (ARDL) model
The ARDL approach has been (i.e., to cointegration) developed by Pesaran et al. (Reference Pesaran, Shin and Smith2001). This approach performs well in small samples (Narayan and Narayan, Reference Narayan and Narayan2004; Pesaran and Shin, Reference Pesaran and Shin1999). Interestingly, ARDL model is more flexible and efficient compared to other traditional methods. Further, the ARDL cointegration procedure involves two steps (Bhattacharya, Reference Bhattacharya2019). The first step is to examine the existence of long-run relationships between the variables in the model. Hence, we employed F- bound test to investigate the existence of the cointegrating long-run relationship. If co-integration exists, the second step is to estimate the long-run and the short-run coefficients using associated ARDL and error correction model (ECM).
3.2.1. Bounds test for cointegration
To examine long-run relationship among these variables, we conducted F-bounds test procedure in equation (4) for lower bound and upper bound significance of the coefficients of the lagged levels of the variables. The null hypothesis for the F-bound test is H0 = α1 = α2 = α3= α4 = α5 = α6 = 0 that implies no cointegration or no long-run relationship. Whereas the alternative hypothesis shows cointegration or long-run relationship exists, ie., H1 ≠ α1 ≠ α2 ≠ α3 ≠ α4 ≠ α5 ≠ α6 ≠ 0. We can reject or accept the null hypothesis (H 0) based on the calculated values of F-test with the critical F-test values (Pesaran et al., Reference Pesaran, Shin and Smith2001).
For co-integration analysis, the ARDL model bounds test equation is formulated to investigate the long-run relationships among the studied variables.
 \begin{align}\Delta{lnPSR}_{t}&=\alpha _{0}+\alpha _{1}lnMS_{t-1}+\alpha _{2}lnRY_{t-1}+\alpha _{3}lnER_{t-1}+\alpha _{4}lnPC_{t-1}+\alpha _{5}lnOP_{t-1}+\alpha _{6}lnEP_{t-1}\\&\,\,\,\,\,\,\,+\sum _{i=1}^{q}\beta _{1}\Delta{lnPSR}_{t-i}+\sum _{i=1}^{q}\beta _{2}\Delta lnMS_{t-i}+\sum _{i=1}^{q}\beta _{3}\Delta lnRY_{t-i}+\sum _{i=1}^{q}\beta _{4}\Delta lnER_{t-i}\\&\,\,\,\,\,\,\,+\sum _{i=1}^{q}\beta _{5}\Delta lnPC_{t-i}+\sum _{i=1}^{q}\beta _{6}\Delta lnOP_{t-i}+\sum _{i=1}^{q}\beta _{7}\Delta lnEP_{t-i}+{\in _{t }}\end{align}
where Δ is the first-order difference lagged term, q is the optimal lag length. Here, α1, α2, α3, α4, α5, and α6 represent the long-run elasticities of PSR with respect to MS, RY, ER, PC, OP, and EP, while the summation signs and β 1 , β 2 , β 3 , β 4 , β 5 , β 6, and β 7 are representing short-run dynamics structure. Hence, the ARDL bounds procedure is performed on equation (4) that shows a joint significance test of the null hypothesis of no cointegration (H0 = α1 = α2 = α3= α4 = α5 = α6 = 0) against its alternative hypothesis (H1 ≠ α1 ≠ α2 ≠ α3 ≠ α4 ≠ α5 ≠ α6 ≠ 0) that cointegration exists. Based on the alternative hypothesis, Table 6 confirms the cointegration long-run relationship. This is the core of the ARDL framework (Sun and Zhou, Reference Sun and Zhou2018).
It is necessary that ΔInPSR t be modeled as short-run ECM based on the equation (4). The ECM can be written as follows:
 \begin{align}\Delta{lnPSR}_{t}&=\beta _{0}+\sum _{i=1}^{q}\beta _{1}\Delta{lnPSR}_{t-i}+\sum _{i=1}^{q}\beta _{2}\Delta lnMS_{t-i}+\sum _{i=1}^{q}\beta _{3}\Delta lnRY_{t-i}+\sum _{i=1}^{q}\beta _{4}\Delta lnER_{t-i}\\&\,\,\,\,\,\,\,+\sum _{i=1}^{q}\beta _{5}\Delta lnPC_{t-i}+\sum _{i=1}^{q}\beta _{6}\Delta lnOP_{t-i}+\sum _{i=1}^{q}\beta _{7}\Delta lnEP_{t-i}+\tau ECM_{t-1}+{\in _{t }}\end{align}
The ECM shows the error correction term that has been derived from long-run relationship as given in equation (5). ECMt-1 should be negative and statistically significant where its coefficient τ has the most important in the short-run equation (Islam, Reference Islam2022). Here, τ denotes the speed of adjustment to equilibrium. The ECM integrates the short-run dynamics with the long-run equilibrium without losing long-run information (Bredin et al., Reference Bredin, Fountas and Murphy2003; Forgenie and Khoiriyah, Reference Forgenie and Khoiriyah2023; and Shrestha and Bhatta, Reference Shrestha and Bhatta2018).
3.3. Data sources
Zhou and Tong (Reference Zhou and Tong2022) emphasized the importance of data sources in the case of agricultural products. In this study, we use annual time series data over a period of 30 years from 1990 to 2020 that have been collected from various secondary sources. Nomenclature of rice data has been drawn from HS four-digit code: 1006. The harmonized commodity description and coding system (HS) Code: 1006 at a 4-digit is used in the study, and analyses were carried out focusing on export data on rice provided by the United Nations Commodity Trade Statistics (UN Comtrade) database. The HS System has been created by the European Customs Cooperation Council as a tariff nomenclature for traded commodities in the international market. It has been maintained by the World Customs Organization for 200 traded countries over 5000 tariff lines. In this study, the HS 4-digit level covers India’s basmati and non-basmati rice exports, which have included till HS 8-digit level of rice export. Thus, Harmonized System (HS) code 1006 covers all types of rice exported from India. The data on India’s total agricultural exports are collected from the World Trade Organization (WTO). Export price and market size data have been obtained from the UN Comtrade database. Exchange rate data has been retrieved from Federal Reserve Economic Data (FRED), Federal Reserve Bank of St. Louis, USA. Rice yield and production cost data have been drawn from Directorate of Economics and Statistics, Department of Agriculture & Farmers Welfare, Ministry of Agriculture and Farmers Welfare, Government of India. Trade openness was calculated using data from two sources, viz. the Ministry of Commerce, Government of India (total import-export data), and the World Bank’s World Development Indicators online database (data on India’s GDP). Thus, trade openness is estimated as export + import/GDP (Bal et al., Reference Bal, Dash and Subhasish2016). Appendix Table A1 presents the definition of dependent and independent variables along with their data sources.
4. Results and discussion
The basic descriptive statistics of the variables are presented in Table 3, which introduces the rice export determinants during the period. The descriptive statistics show that PSR, MS, RY, ER, PC, OP, and EP are positively skewed meaning that their mean are peaked to the right of the distribution. The Kurtosis coefficients for all the variables are below 3.000, showing that they are platokurtic which means they have lesser extreme outliers than the normal distribution. Outcome of the Jarque–Bera probability statistics shows that all variables are normally distributed.
Summary statistics

Source: Author’s own estimation.
Findings of augmented Dickey–Fuller (ADF) and Phillips–Perron (PP) unit root tests are shown in Table 4 to investigate the stationarity property of time series data. The above results confirm that all determinants (variables) are stationary either at the level or at the first difference while none of the determinants are stationary at the second difference.
Unit root test

Note: ***, **, * Denote 1, 5and 10%, significance levels, respectively.
Source: Author’s own estimation.
Table 5 shows the different lag length outcomes under different lag length selection criteria like LR, FPE, AIC, SIC and HQ, based on the vector autoregressive (VAR) involving the seven endogenous variables. In this study, Akaike information criterion (AIC) for lag selection has been employed to choose the optimal lag order of the model specification. Following AIC, the model has selected lag length of two for estimating determinants of rice exports from India. The selected lag length criterion for rice export competitiveness is 2,2,2,1,2,0,0.
Lag length selection criteria for ARDL model

Note: * Denotes lag order selected by the criterion. LR: sequential modified LR test statistic; FPE: final prediction error; AIC: Akaike information criterion; SIC: Schwarz information criterion; HQ: Hannan–Quinn information criterion.
Source: Author’s own estimation.
The bound test findings are given in Table 6. The F statistic is having a value of 6.8738, which is greater than the upper-bound critical value at the 1%, 2.5, 5, and 10 significance level. The null hypothesis indicates that there is no co-integration relationship among dependent variable PSR and independent variables MS, RY, ER, PC, OP, and EP is rejected. Table 6 confirms that rice export and its determinants have a long-run cointegrating relation with one another.
ARDL F-bounds test

The values in parenthesis represent the t-statistic.
Source: Author’s own estimation.
The results showing long-term coefficients of the ARDL model are given in Table 7. The coefficient of ln RY is 2.22, and it is positive and significant at the 1% level. It means a 1% increase in the yield accelerates competitiveness in rice exports by 2.22%. Here, positive sign indicates that rice yield has a favorable influence on its competitiveness. Suresh and Mathur (Reference Suresh and Mathur2016) mentioned that yield improvement may be a potential factor that results in exportable surplus for export growth and comparative advantage in agri-produce. Yield is also the classical and standard unit of measurement for a product’s competitiveness.
Results of long-run elasticities estimated by ARDL model

Note: ***, **, * Denote 1, 5, and 10%, significance levels, respectively.
Source: Author’s own estimation.
The coefficient of ln ER is positive (0.733), as expected, and statistically significant at 05% level. The exchange rate has a statistically significant effect on rice export, which indicates that INR depreciation will have significant effect on India’s rice export competitiveness. Similarly, Ahmad and Garcia (Reference Ahmad and Garcia2012) have found that exchange rate had a positive impact on Pakistan’s rice exports. Further, Kea et al. (Reference Kea, Li, Shahriar, Abdullahi, Phoak and Touch2019) have also found that exchange rate policy has positive and significant impact in the case of Cambodia’s rice export. Depreciation of the exchange rate should enhance export competitiveness, and it is an important determinant of export competitiveness (Abbas, Reference Abbas2022). Simultaneously, INR currency depreciation also stimulated rice competitiveness by lowering the export price in the global market. Hence, the outcome of the study recommends that fluctuations in exchange rates have significantly impacted India’s rice competitiveness.
The sign of the coefficient of ln PC is also in the excepted line. The long-term coefficient of this variable is −0.199545, and its t-statistic is significant at the 5% level. It indicates that a 1% increase in production costs can decrease rice’s competitiveness by 0.19%. So, increasing production cost of rice reduces its export competitiveness. Here, the negative sign of production costs clearly illustrates the efficiency of rice farming, which may increase profit margins for exporters at competitive prices in the international market. Sometimes cost of production may actually increase due to depreciation of domestic currency, which may, in turn, deteriorate competitiveness (Abbas, Reference Abbas2022). Although our findings are consistent with economic theories that suggest an increase in the production cost of a commodity may hurt its profitability and competitiveness.
As expected, the coefficient of ln EP is negative, and it is statistically significant. Its coefficient is having a value of −0.480 and the probability value of the t-statistic is 0.0083. Here, 1% increase in export price would reduce rice export competitiveness by 0.48% in the long-run. Results of the study show that if India’s rice price is reduced in the international market, it will enhance its global competitiveness. This finding of our study is also consistent with some of the earlier researchers indicating that an increase in export price of a commodity has a negative influence on its competitiveness (Khan et al., Reference Khan, Hossain, Islam, Rahman and Dey2022). Additionally, Adhikari et al. (Reference Adhikari, Sekhon and Kaur2016) have also found a negative significant impact of export price on fresh fruits export competitiveness. Moreover, statistically significant outcomes show that the export prices of rice may also increase India’s market share at competitive prices.
In addition, we have found that ln MS and ln OP are positively related, but they have insignificant impact on India’s rice export competitiveness in the long term. Thus, four out of six of the estimated coefficients are statistically significant, and their signs are consistent with economic theory. The values of R 2 and adjusted R 2 were estimated to be 93% and 90%, respectively, which explains more than 90% variation between dependent and independent variables and strongly suggests that the model is a good fit. Md Reza et al. (Reference Md Reza, Fan, Wang, Bhuiyan and K.M.Mehedi2019) believed that if the R 2 is more than 60% it shows model is best fit. They said that if the Durbin-Watson statistic range between 1.5 and 2.5 indicates that there are no autocorrelation issues in the model. So, our series is stationary in nature as we found 2.24 Durbin–Watson statistic in the model. These findings suggest that the export determinant factors used in this study are properly specified based on the model.
Table 8 shows the estimated short-run coefficients. Notably, the error correction term (ECM) has a negative coefficient, and it is statistically significant at 1% level. The lagged dependent variable ln PSR (−1) is statistically significant at 1% level and has a positive coefficient of (0.3773). In the short-run, the coefficients of ln MS, ln RY, ln ER are 0.8003, 2.6247, 0.8664, respectively, and they all are statistically significant at 1% level. A study by Akter (Reference Akter2022) revealed that exchange rate was seen to have a positive significant effect on the comparative advantage of soybeans at a 1 per cent level. The depreciation in rupee can make exports from India cheaper in the world market and hence enhance the demand for exported goods.
Results of short-run ECM test estimated by ARDL model

Note: ***, **, * Denote 1, 5, and 10%, significance levels, respectively.
Source: Author’s own estimation.
Further, ln PC and ln PC (−1) are also positive and significant at the 1% level. The results suggest that a 1% increase in current year’s and last year’s production cost leads to 0.10% and 0.14% increase in export competitiveness, respectively. In the case of rice production costs, Manjunatha et al. (Reference Manjunatha, Achoth and Mamatha2017) asserted that due to various taxes imposed by state governments, Indian rice has become costlier. They pointed out that increasing production costs of rice have also been influenced by rising input costs of paddy. Consequently, the high costs of production for Indian rice with inelastic prices have made it uncompetitive (Abbas, Reference Abbas2022). Contrastingly, in the short run, production costs may have a positive and significant impact on rice export competitiveness. However, it can be reduced through resource-saving technologies, which would lead to increased competitiveness (Manjunatha et al., Reference Manjunatha, Achoth and Mamatha2017).
Although, ln OP is not significant at the conventional level, ln OP (−1) has a negative significant impact on rice export competitiveness in the short term. Similarly, Dlamini et al. (Reference Dlamini, Edriss, Phiri and Masuku2016) also found that openness had negative impact on Swaziland’s sugar exports. In the short-run, trade openness might have negative impact on product-level competitiveness. The coefficient of the current year’s ln EP is negative as expected, and it is statistically significant. This coefficient is −0.3032, and the probability value of the t-statistic is 0.0027. In contrast, the sign of the coefficient of ln EP (−1) is positive (0.438226) and significant at 1% level. Sometimes, higher prices in the preceding year motivate farmers to produce more and hence leading to higher exports.
The calculated coefficient of the ECM is −1.18, suggesting that the speed of adjustment to long-run equilibrium is approximately 118% annually, which indicates that instead of monotonically converging to the equilibrium path directly. In other words, in the long run, export competitiveness corrects approximately 118% of the previous year’s imbalance. Finally, results demonstrate that all the determinants in this study have statistically significant impact on rice export competitiveness in the short run except current year exchange rate and openness.
To confirm the validity and consistency of the model, a number of robustness tests have been conducted and the results are shown in Table 9. The outcome of the diagnostic tests demonstrate that the model has passed heteroskedasticity and serial autocorrelation tests successfully. Hence, we can say that the explanatory power of the model is satisfactory and there are no heteroscedasticity and autocorrelation problems in the model. However, our normality finding is in line with Boutabba (Reference Boutabba2014), Ivanovski et al. (Reference Ivanovski, Awaworyi Churchill and Nuhu2020), and Hurley and Papanikolaou (Reference Hurley and Papanikolaou2021).
Residual diagnostic tests

Source: Author’s estimation.
The finding of the Ramsey RESET test reveals that there is no sign of misspecification errors in the model because the p-value of the model is above the 5% significance level. Overall, findings of the diagnostic tests imply that the model has anticipated econometric properties. Figures 3 and 4 demonstrate the CUSUM and CUSUMSQ results for model stability. Both tests (CUSUM and CUSUMSQ) should fall between critical levels for the model’s stability. These figures (Figures 3 and 4) confirm that all the parameters reveal long-run stability at the 5% significance level.
Plot of CUSUM of recursive residuals.

Plot of CUSUMSQ of recursive residuals.

5. Conclusion and policy implications
Export and competitiveness are important forces shaping economic outcomes around the world and they are deeply intertwined. While competitiveness is a multidimensional concept that depends on a large number of factors, export is an important indicator in the evaluation of a products’ performance in the international market. But, Bojnec and Fertő (Reference Bojnec and Fertő2017) believed that due attention has not been paid for exploring agri-food export competitiveness. Here, we have identified and analyzed the impact of major determinants on India’s rice export competitiveness. It is assumed that for any product, a performance in the international (export) market can be considered as a good measure of its overall competitiveness. Empirically, we found that rice export competitiveness has been affected by major economic (both internal and external) factors which influenced product-level competitiveness. In this study, following the ARDL modeling approach, we deployed the log–log linear production function for dependent and independent variables. The empirical results have successfully identified a set of significant determinants, both over the short run and long run, which affect rice exports from India.
The outcome of the study suggests that both yield and exchange rate have positive significant impact while production cost and export price have negative significant impact on India’s rice export competitiveness in the long run. The resulting findings on rice yield and production cost variables are novel and consistent with economic theories. The outcomes of the study suggest that both higher yield and lower production can enhance rice export competitiveness, which, in turn, may help gaining a larger market share in the global market. Additionally, factors like lagged export share, current market size and rice yield, exchange rate, and production costs – all have positive influence on rice exports in the short run. In comparison, last year’s openness and current year’s export price have negative significant impact in the short run, while last year’s export price has a positive significant impact on the export competitiveness of rice.
Interestingly, a favorable combination of the depreciated currency (INR) exchange rate and competitive export price can significantly enhance export competitiveness of rice. The conclusions of the study has important policy ramifications: exporters need to consider production costs and exchange rates when adjusting export prices so as to gain healthy profit margins and higher competitiveness. The insignificant impact of market size and openness indicates that these factors may not have any considerable influence on the export competitiveness of rice. However, both trade openness and market size are believed important as they can significantly influence export competitiveness by expanding market opportunities, fostering competition, creating economies of scale, and determining market dynamics.
It may be noted from the study’s findings that the impact of the determinants that affect export competitiveness of rice has varied over the time (i.e., between short run and long run), but the long-run results are more consistent with the economic theories. India is a leading producer of rice crop and one of the largest exporters of this product. Indeed, our analysis helped us to identify the key factors that influence the export of rice from India. To that extent, the study could successfully address the crucial research question that has been long overlooked in the existing economic literature – what factors drive product-level export competitiveness?
The findings of the study also give a broad direction to the policymakers regarding which aspects of competitiveness to be focused more for further promoting India’s rice exports in the global market. A larger export of rice will not only benefit the major stakeholders like farmers and exporters but also help reducing India’s soaring trade deficits. It might even help in augmenting the farm income, which is one of the key targets of the incumbent government at the center. Of course, export may depend on a whole lot of other factors, like undertaking promotional activities to increase awareness among the global consumers and importers about the variety and quality of India’s agricultural products including rice.
Furuoka, Harvey, and Munir (Reference Furuoka, Harvey and Munir2019) believed that exports play a key role in enhancing economic growth. This higher economic growth may increase productivity and competitiveness (Md Reza et al., Reference Md Reza, Fan, Wang, Bhuiyan and K.M.Mehedi2019). So, export-led growth is an important developmental goal that is widely acknowledged by economists and policy makers across the world (Ali and Li, Reference Ali and Li2018). This study, by identifying the major determinants of competitiveness, might provide a direction to the stakeholders of agricultural exports, including the farmers, exporters, and the government. It is expected that the findings of this research will be useful in understanding the influencing factors and establishing appropriate strategies in relation to competitiveness of rice and other agricultural products. Furthermore, the study will aid in the achievement of India’s 2023–2028 Foreign Trade Policy goals that, besides others, aim at fostering export competitiveness of Indian products in the global market. Additionally, it is recommended that future research can be done by exploring the influence of other factors like changes in government’s procurement policy, producer price, domestic sales, consumption, and trade policy shocks as a potential determinant of the export performance. Moreover, the upcoming studies might use its approach to assess the competitiveness of other agri-products having high prospects in the global market.
Data availability statement
The data that support the findings of this study are available from the corresponding author, Alok Kumar Yadav upon reasonable request.
Author contributions
Conceptualization, A.K.Y., U.Ch.; methodology, A.K.Y.; formal analysis, A.K.Y.; data curation, A.K.Y., U.Ch.; writing – original draft, A.K.Y.; writing – review and editing, A.K.Y., U.Ch.; supervision, U.Ch.
Financial support
The authors confirmed that this research did not receive any specific grant from public, commercial, or not-for-profit sectors.
Competing interests
The authors declare no known competing interest.
AI contributions to this research
The authors declare that they did not use any AI tools in the creation of this publication.
Ethical standards
This study is based on secondary data, and there are no human or animal participants/subjects. Therefore, this study does not require any official ethical approval.
Ethical approval
All authors read and approved the final manuscript.
Informed consent
“N/A”.
Definitions of dependent, independent variables and data sources

Note: Data for variables (determinants) are based on annual time series.
Source: Author’s own compilation.
India’s rice export destination market-2020.


 Open access