


Introduction
The study of the thermal stability of amphiboles, and of the fibrous ones in particular, has received increasing interest in recent years (Della Ventura et al., Reference Della Ventura, Susta, Bellatreccia, Marcelli, Redhammer and Oberti2017; Reference Della Ventura, Galdenzi, Cibin, Wei, Macis and Marcelli2018a; Oberti et al., Reference Oberti, Boiocchi and Zema2019). This topic is not only relevant for the implications it has in the geology, petrology and geophysics fields of research, but also for the very important information that can be retrieved and used for tailoring thermally induced inertisation processes. In fact, five fibrous amphiboles [actinolite, ‘amosite’ (fibrous variety of grunerite), anthophyllite, ‘crocidolite’ (fibrous variety of riebeckite) and tremolite], plus the fibrous serpentine mineral chrysotile, are grouped under the commercial term of asbestos. Thermally induced inertisation is considered as the most promising approach for asbestos containing materials (ACMs) (Paolini et al., Reference Paolini, Tomassetti, Segreto, Borin, Liotta, Torre and Petracchini2019), and this process has been proposed recently by the European Parliament as a method preferable to landfilling (European Parliament, 2013). For a safe use of the products of thermal treatments of ACMs it is of obvious interest to have a detailed knowledge of the structural modifications occurring in asbestos during heating as well as any correlation with surface reactivity (Pacella et al., Reference Pacella, Tomatis, Viti, Bloise, Arizza, Ballirano and Turci2020). From a toxicological point of view, an extensive knowledge of Fe topochemistry is very relevant. It has been proposed that not only the presence of Fe on the fibre surface, but also its structural coordination, are the most relevant factors for asbestos toxicity (Fubini et al., Reference Fubini, Mollo and Giamello1995), together with other parameters such as high aspect ratio (e.g. Stanton et al., Reference Stanton, Layard, Tegeris, Miller, May, Morgan and Smith1981) and biopersistence (Van Oss et al., Reference Van Oss, Naim, Costanzo, Giese, Wu and Sorling1999). As a general scheme, thermal treatments induce two main modifications in asbestos: (1) surface oxidation and partial de-hydroxylation occurs at lower T, often accompanied by cation migration, while preserving the crystalline phases of the pristine minerals; and (2) at higher T a dramatic loss of crystallinity is followed by the appearance of a newly formed mineral phase (Bloise et al., Reference Bloise, Catalano, Barrese, Gualtieri, Bursi Gandolfi, Capella and Belluso2016; Reference Bloise, Kusiorowski, Lassinantti Gualtieri, Gualtieri and Gualtieri2017; Pacella et al., Reference Pacella, Tomatis, Viti, Bloise, Arizza, Ballirano and Turci2020).
For correct handling of the inertisation process, a detailed knowledge of the temperature of structural breakdown of asbestos is required. It is unsurprising that, among amphiboles, the thermal behaviour of riebeckite, ideally, A□B(Na2)C(Fe2+3Fe3+2)T[Si8O22]O3(OH)2, (whose fibrous variety, called ‘crocidolite’, is also known with the commercial name of ‘blue asbestos’) has been investigated in detail since the 60s (Patterson, Reference Patterson1964; Addison and White, Reference Addison and White1968 and references therein; Ernst and Wai, Reference Ernst and Wai1970) as it represents a very favourable test case owing to its large iron content in both ferrous and ferric forms and being used for manufacturing ACMs. Oberti et al. (Reference Oberti, Boiocchi, Zema, Hawthorne, Redhammer, Susta and Della Ventura2018) indicated that prismatic riebeckite undertakes, at T > 700 K, a coupled Fe2+ oxidation/OH– deprotonation process and that the M-site cations experience a fairly complex mechanism of migration leading to the formation of vacancies at both M(3) and M(4) and an increased population at A sites. In particular, an exchange process of the type M(2,3)Fe2+1M(1)Mg1 → M(1)Fe2+1M(2,3)Mg1 and by oxidation of M(1)Fe2+ to allow for complete deprotonation, was proposed. Note that Oberti et al. (Reference Oberti, Boiocchi, Zema, Hawthorne, Redhammer, Susta and Della Ventura2018) combined single-crystal refinements, Fourier-transform infrared (FTIR) and Mössbauer spectroscopy data and that each analytical technique returned slightly different temperatures at which the various processes started. This was justified as caused by the different nature of the ‘probes’ used. In fact, a companion paper by Della Ventura et al. (Reference Della Ventura, Milahova, Susta, Cestelli Guidi, Marcelli, Schlüter and Oberti2018b) detected the beginning of the oxidation at the surface by Raman spectroscopy, while the total deprotonation in the crystal bulk (that occurred at slightly higher T) was followed by FTIR spectroscopy in transmission mode. Another important regulated fibrous amphibole is tremolite, ideally A□B(Ca)C(Mg5)T[Si8O22]O3(OH)2, which has very high adverse potency and can be found both as a primary constituent and as contaminant in ACMs. Despite its low Fe content, allocated at C sites, tremolite asbestos is considered to be highly toxic (Wagner et al., Reference Wagner, Chamberlain, Brown, Berry, Pooley, Davies and Griffiths1982; Weill et al., Reference Weill, Abraham, Balmes, Case, Chrug, Hughes, Schenker and Sebastien1990; Case, Reference Case, Landrigan and Kazemi1991; Nolan et al., Reference Nolan, Langer, Oechsle, Addison and Colflesh1991; Srivastava et al., Reference Srivastava, Lohani, Pant and Rahman2010). Accordingly, a recent study performed by our group on the pathogenic-related fibre surface reactivity of riebeckite and tremolite showed that both fibrous amphiboles have sustained radical production, even when highly altered by oxidative leaching. In particular, tremolite exhibited a significant radical production from both pristine and altered fibres (Andreozzi et al., Reference Andreozzi, Pacella, Corazzari, Tomatis and Turci2017). In contrast to riebeckite, the generally small iron content of tremolite makes a detailed analysis of subtle modifications of the iron site allocation and variation of its oxidation state potentially difficult. A further complication is that structure analysis of fibres is routinely carried out by powder X-ray diffraction (PXRD) and this technique suffers from well-known limitations, in terms of accuracy and precision, when compared to X-ray single-crystal refinements (SREF). Recently, synchrotron nano-diffraction has been shown to be a promising route for analysing asbestos fibres, at least ex situ (Giacobbe et al., Reference Giacobbe, Wright, Di Giuseppe, Zoboli, Zapparoli and Gualtieri2018). As far as tremolite is referred to, in situ SREF at 297, 673 and 973 K have been performed in the classical paper by Sueno et al. (Reference Sueno, Cameron, Papike and Prewitt1973) on a near end-member prismatic sample characterised by the chemical formula B(Ca1.86Na0.10K0.02)Σ1.98C(Mg4.97Fe2+0.02Mn2+0.05Al0.04)TΣ5.08[Si7.95Al0.05]Σ8.00O22O3(OH)2.00 (Papike et al., Reference Papike, Ross and Clarke1969). A further experiment at 1123 K produced the conversion of the single crystal to a polycrystalline solid preventing further structural analysis. The three data points suggested the occurrence of linear thermal expansion and the authors reported very similar mean thermal expansion coefficients (MTEC, defined as  $ {\rm MTEC} = \displaystyle{1 \over {X_{ref}}}$ ${{X_{Tmax}-X_{ref}} \over {T_{max}-T_{ref}}}$ (K–1), where, X = V, a, b, c, b and the subscripts ref and max indicate the reference and maximum T, respectively) for a and b (≈1.2 × 10⁻⁵ K–1) and smaller by a factor of two for c (≈0.6 × 10⁻⁵ K–1). In a recent paper (Pacella et al., Reference Pacella, Tomatis, Viti, Bloise, Arizza, Ballirano and Turci2020) the products of riebeckite and tremolite fibres heated at several temperatures, including above those of the breakdown of their structures, have been analysed ex situ by PXRD. In the case of riebeckite, the results were fully consistent with those reported by Oberti et al. (Reference Oberti, Boiocchi, Zema, Hawthorne, Redhammer, Susta and Della Ventura2018) for a prismatic sample confirming, once more, the potentiality of PXRD for the structural investigation of fibrous amphiboles (Ballirano et al., Reference Ballirano, Bloise, Gualtieri, Lezzerini, Pacella, Perchiazzi, Dogan, Dogan and Gualtieri2017). In the case of tremolite, breakdown products, obtained at 1473 K, were consistent with the idealised stoichiometric reaction (ignoring the small iron content):
 $$\eqalign{& {\rm C}{\rm a}_2{\rm M}{\rm g}_5\lsqb {{\rm S}{\rm i}_8{\rm O}_{22}} \rsqb \lpar {{\rm OH}} \rpar _2\lpar {\rm s} \rpar \cr &\rightarrow \;2{\rm CaMg}\lsqb {{\rm S}{\rm i}_2{\rm O}_6} \rsqb \lpar {\rm s} \rpar + 1.5{\rm M}{\rm g}_2\lsqb {{\rm S}{\rm i}_2{\rm O}_6} \rsqb \lpar {\rm s} \rpar + {\rm Si}{\rm O}_2\lpar {\rm s} \rpar + {\rm H}_2{\rm O\ }\lpar {\rm g} \rpar } $$
i.e. the association of subcalcic diopside and calcium-rich clinoenstatite plus cristobalite, a mineralogical association which is reasonably consistent with the findings of Johnson and Fegley (Reference Johnson and Fegley2003) and Giacobbe et al. (Reference Giacobbe, Wright, Di Giuseppe, Zoboli, Zapparoli and Gualtieri2018).
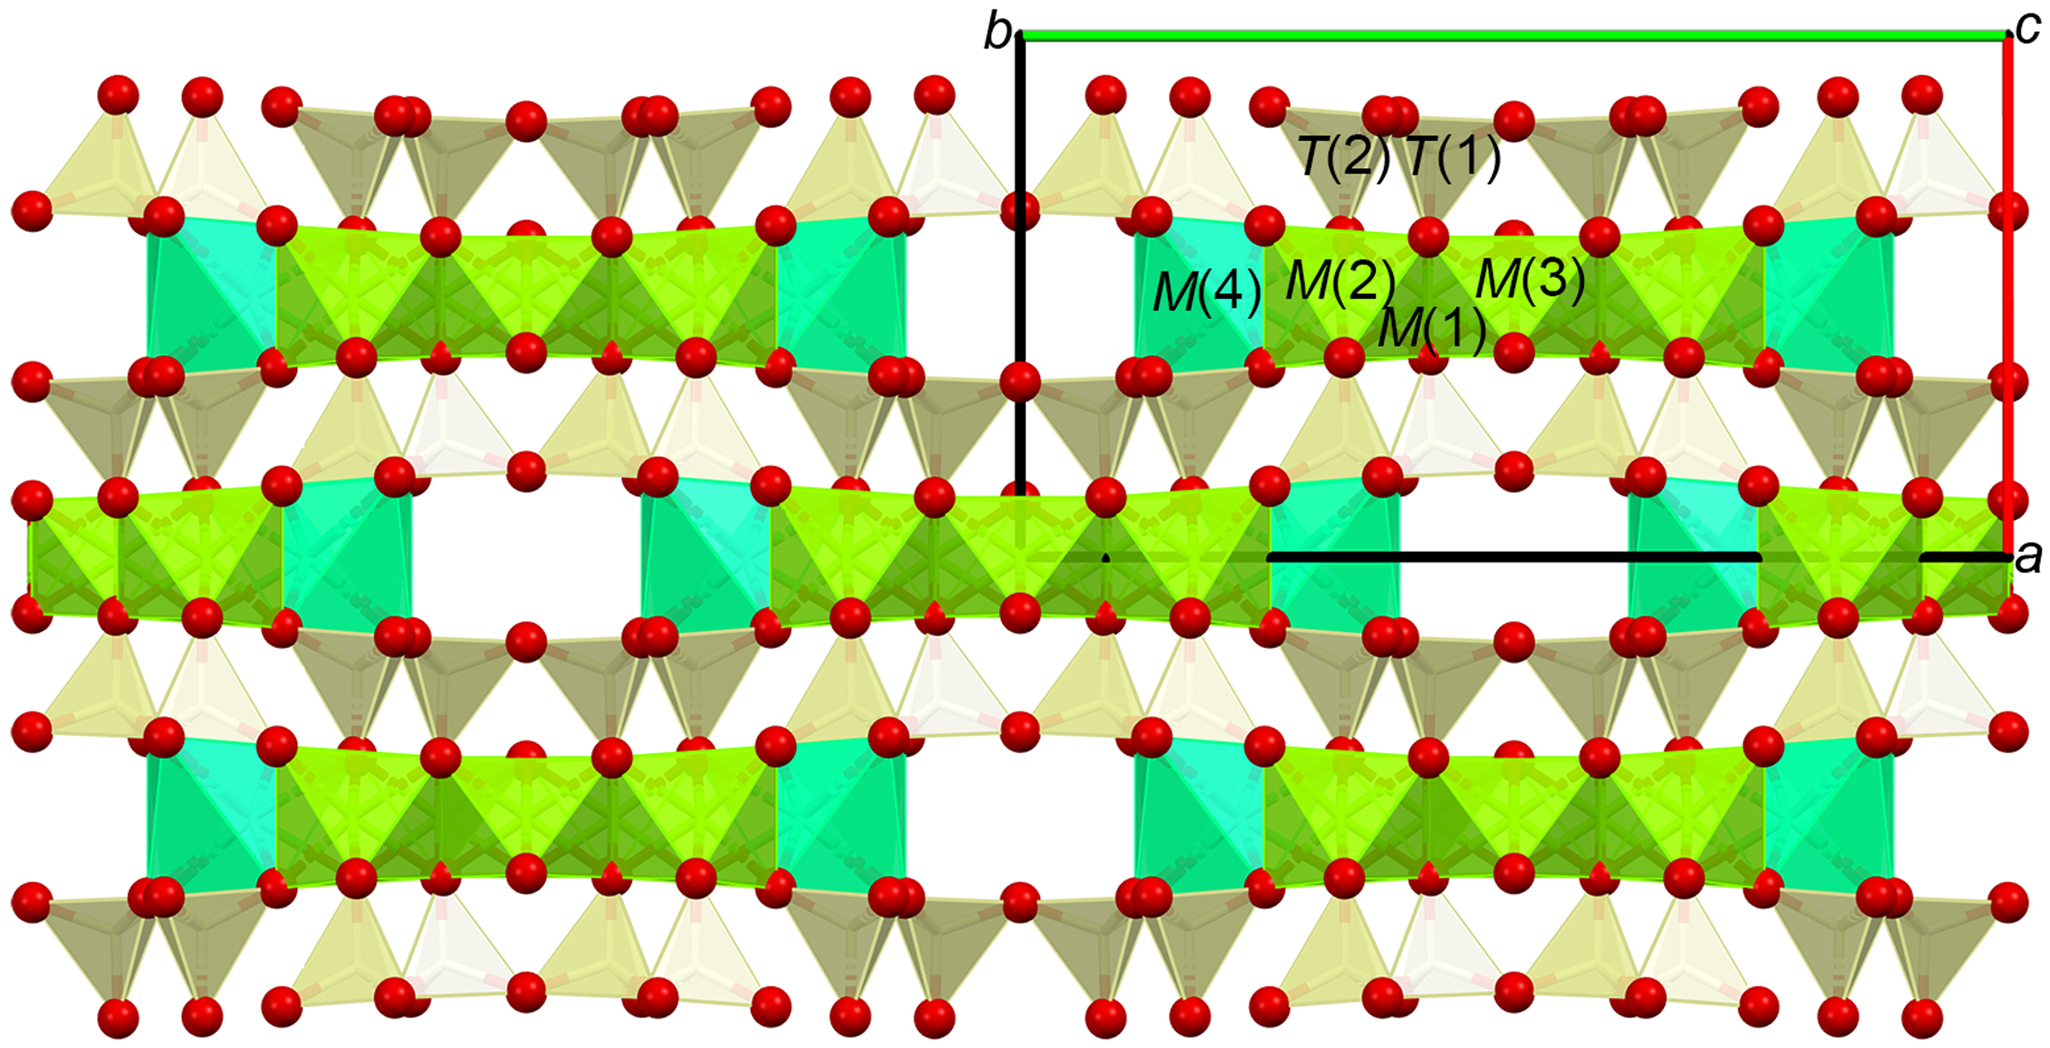
This equation indicates the (prevailing) splitting of the double-chain structure of tremolite (Fig. 1) into the single-chain structure of two pyroxenes. According to Rietveld refinement, most Fe3+ of tremolite was incorporated into the newly formed diopside structure at both the tetrahedral and octahedral cation sites. Moreover, a significant amount of silica-rich amorphous material was observed from transmission electron microscopy (TEM) images. It is important to note that, from the morphological point of view, at low magnifications the heated sample appeared very similar to the pristine one, with well-preserved fibrous habit and size. However, at higher magnification, it was observed that fibrils actually consisted of different nanometric phases, both crystalline and amorphous, thus indicating the occurrence of pseudomorphic transformations.
Structure of tremolite as seen along the c axis. The strip of octahedra centred by M(2), M(1) (removed, not shown) and M(3) cations are represented in olive green. The M(4)-centred square antiprism (cyan) contains easily removable cations upon leaching (Ca in the case of tremolite) resulting in M(2) and M(1) being exposed at the surface. The A sites are located within the wide cavities delimited by the edges of the square antiprisms and the bases of the tetrahedra.
In the present work we focus on the in situ analysis of the structure modifications occurring in tremolite fibres upon heating using the same well-characterised sample from Maryland, USA analysed by Pacella et al. (Reference Pacella, Andreozzi and Fournier2010) and Pacella et al. (Reference Pacella, Tomatis, Viti, Bloise, Arizza, Ballirano and Turci2020). This sample, owing to its relatively high iron content (~5 wt.% of FeOtot), potentially offers the possibility of monitoring the onset of Fe2+ oxidation, the corresponding deprotonation of OH– and the possible occurrence of crystal-chemical changes, similar to those observed in riebeckite. Particular attention will be devoted to the analysis of Fe topochemistry due to its primary role in inducing asbestos toxicity (Fubini et al., Reference Fubini, Mollo and Giamello1995). This study is expected to provide useful information to researchers involved in the evaluation of the safety of thermally decomposed tremolite-containing ACMs, in particular in the case of incomplete structural breakdown.
Experimental
In the present investigation we used the sample of fibrous tremolite from the ophiolitic complex of Montgomery County, Maryland, USA, fully characterised from the crystal chemical and structural point of view by Pacella et al. (Reference Pacella, Andreozzi and Fournier2010). Its chemical formula, obtained from coupled electron microprobe analysis (EMPA) and Mössbauer spectroscopy, is B(Ca2.00Mn0.02Na0.01)Σ2.03C(Mg4.48Fe2+0.44 Fe3+0.08)Σ5.00T[Si7.95Al0.02]Σ7.97O22O3[(OH)1.98F0.01].
Fe2+ was found to be distributed over the M(1), M(2) and M(3) sites of the strip of octahedra, whereas Fe3+ was found only at M(2) (Pacella et al., Reference Pacella, Andreozzi and Fournier2010). The same sample was investigated structurally by Pacella et al. (Reference Pacella, Tomatis, Viti, Bloise, Arizza, Ballirano and Turci2020), which reported a slightly different Fe distribution at RT [Fe3+ prevalently allocated at M(2) and subordinately at M(1)] as a result of a more advanced site partition procedure (Vignaroli et al., Reference Vignaroli, Ballirano, Belardi and Rossetti2014).
In situ high-temperature powder X-ray diffraction (HT-PXRD) data were collected on a Bruker AXS D8 Advance operating in θ/θ geometry in transmission mode. Samples were prepared as capillaries using SiO2-glass tubes of 0.7 mm diameter kept open at one side. The instrument is fitted with focussing Göbel mirrors along the incident beam and Soller slits on both incident (2.3° opening angle) and diffracted (radial) beams. Data were acquired using a position sensitive detector (PSD) VÅntec-1 set to an opening angle of 6°2θ. A heating chamber for capillaries, developed by MRI and Bruker AXS, is placed along the beam path. Details regarding the chamber characteristics and its thermal calibration can be found in Ballirano and Melis (Reference Ballirano and Melis2007).
Diffraction patterns were collected in the 7–145°2θ angular range, 0.022°2θ step-size and 3–4 s counting time. Five different heating runs were performed: (1) heating of pristine sample to 1223 K; (2) heating of a new pristine sample to 848 K; (3) heating of sample (2), recovered upon cooling (rate of ca. 20 K min−1), up to 873; (4) heating of sample (3), recovered upon cooling (rate of ca. 20 K min−1), up to 1173 K; and (5) heating of a new pristine sample to 1073 K.
At the end of each heating run a measurement was performed on the sample; it was placed outside the chamber and cooled back at RT. Heating run (1) provided information about the thermal behaviour of tremolite up to the temperature of structure breakdown. Heating runs (2–4) were performed to obtain information about the process of oxidation of tremolite, whereas run (5) was carried out to obtain, in a controlled way, a fully oxidised tremolite sample to be analysed at RT.
Diffraction data were evaluated by the Rietveld method using Topas 6 (Bruker AXS, 2016) and the Fundamental Parameters Approach (FPA: Cheary and Coelho, Reference Cheary and Coelho1992) to describe the peak shape. Absorption effects were approximated with the formalism of Sabine et al. (Reference Sabine, Hunter, Sabine and Ball1998) for a cylindrical sample and the approach of Ballirano and Maras (Reference Ballirano and Maras2006) for handling the correlation existing between displacement parameters and absorption was applied. Isotropic displacement parameters were constrained as follows: BT (1) = BT (2); and BO(1) = BO(2) = BO(3) = BO(4) = BO(5) = BO(6) = BO(7); BM (1) = BM (2) = BM (3); and BH = 1.2 × BO(3). It is important to realise that the relevant information required to describe the structural modifications induced by heating rely on small variations of variables, such as displacement parameters and cation site occupancy, that are mutually correlated and are correlated to sample absorption as well. Therefore, particular care was used to handle those correlations. Preferred orientation was modelled using spherical harmonics (4th-order, eight refinable parameters) by selecting the number of appropriate terms as suggested by Ballirano (Reference Ballirano2003). Parameters refined to small values, as expected for data collected in transmission mode on samples prepared as capillaries. Starting structural data were those of Pacella et al. (Reference Pacella, Tomatis, Viti, Bloise, Arizza, Ballirano and Turci2020) and each refined structure at a given non-ambient T was used as input for the subsequent one. The dependence of cell parameters and volume from T was analysed using EoSFit7-GUI (Gonzalez-Platas et al., Reference Gonzalez-Platas, Alvaro, Nestola and Angel2016) and the equation of Berman (Berman, Reference Berman1988) was employed for fitting the data. This equation permits accommodation of non-linear thermal expansion and is expressed as XT =  $X_0\left[ {1 + a_0\left( {T-T_{ref}} \right) + \displaystyle{1 \over 2}a_1{\left( {T-T_{ref}} \right)}^2} \right]$ with X = V, a, b and c. Miscellaneous information regarding the refinements are listed in Table 1 and a representative example of Rietveld plots is shown in Fig. 2. The crystallographic information files have been deposited with the Principal Editor of Mineralogical Magazine and are available as Supplementary material (see below).
Miscellaneous data of the Rietveld refinements. Definition of the statistical indicators as indicated in Young (Reference Young and Young1993).

Representative example of the Rietveld plots of the diffraction pattern collected at 423 K. Blue: experimental; red: calculated; grey: difference; vertical bars: position of calculated Bragg reflections of tremolite.

Results and discussion
Breakout products of tremolite
Heating run (1) suggests that, under the present experimental conditions, the structural breakdown of tremolite starts at 1173 K. At this temperature the relevant reflections of clinopyroxenes become apparent and at 1223 K the conversion is almost completed. The quantitative phase analysis (QPA) of the sample cooled down at RT indicates the occurrence of ~2:1 weight ratio subcalcic diopside and associated calcium-rich clinoenstatite plus traces of hematite. Those results agree with the ex situ findings of Pacella et al. (Reference Pacella, Tomatis, Viti, Bloise, Arizza, Ballirano and Turci2020) for the breakdown products of the same sample heated at 1473 K. The only exception is represented by the absence of cristobalite among the reaction products of our experiment. We may hypothesise that, in the present experiment, excess SiO2 occurs under the form of silica-rich amorphous material, which has been, in effect, observed by Pacella et al. (Reference Pacella, Tomatis, Viti, Bloise, Arizza, Ballirano and Turci2020) in the TEM images of the same sample treated thermally at 1473 K (see fig. 2 of Pacella et al., Reference Pacella, Tomatis, Viti, Bloise, Arizza, Ballirano and Turci2020). This hypothesis is confirmed by the occurrence in the diffraction pattern of an ‘amorphous’ band, centred at ~21°2θ (by default occurring due to the SiO2-glass capillary contribution), stronger than that found in the pristine sample (Fig. 3). Slightly different results between the two experiments are justified by the different heating conditions. In fact, in the case of Pacella et al. (Reference Pacella, Tomatis, Viti, Bloise, Arizza, Ballirano and Turci2020) a steady heating rate of 10 K min–1 was adopted whereas it was of 6 K min–1 in the present investigation and, most importantly, HT-PXRD experiments implied the permanence of the sample at each T for ~5.5–7.5 hours depending on the counting time used during the measurements.
Magnified 7–80°2θ view of the Rietveld plots of the products of breakdown of tremolite. Blue: experimental; red: calculated; grey: difference; vertical bars: position of calculated Bragg reflections of (from above to below) sub-calcic diopside, pigeonite (calcium-rich clinoenstatite) and hematite.

Thermal expansion and HT structure modifications
The evolution of cell parameters and volume of tremolite as a function of T is shown in Fig. 4a–e. These data indicate that thermal expansion is not linear, and a discontinuity is clearly apparent at 773 K. Corresponding to this T, cell parameters deviate from the previous, regular trend, showing a reduced rate of increase. This behaviour suggests the onset of Fe2+ oxidation and the corresponding deprotonation of OH– at O(3). In fact, riebeckite, which is characterised by a relevant Fe2+ content, experiences a strong contraction of cell parameters when such processes occur (Oberti et al., Reference Oberti, Boiocchi, Zema, Hawthorne, Redhammer, Susta and Della Ventura2018). Note that several investigations (Della Ventura et al., Reference Della Ventura, Susta, Bellatreccia, Marcelli, Redhammer and Oberti2017; Reference Della Ventura, Galdenzi, Cibin, Wei, Macis and Marcelli2018b; Pacella et al., Reference Pacella, Tomatis, Viti, Bloise, Arizza, Ballirano and Turci2020) have indicated that oxidation and deprotonation in amphiboles occur at different temperatures, typically differing by as much as 100 K. However, owing to kinetics and analytical technique sensitivity, in situ HT-PXRD is unable to separate the two processes. In the present case, the contraction induced by oxidation of the small Fe2+ content only partially counterbalances the effect of thermal expansion. At 1023 K the trend of thermal expansion re-aligns with the starting one suggesting the end of the oxidation process.
Dependence of cell parameters and volume of tremolite with temperature (T) observed in heating run (1): (a) a parameter; (b) b parameter; (c) c parameter; (d) β angle; and (e) cell volume. The area highlighted in grey indicates the thermal range in which both oxidation/deprotonation and cation migration occur.

The variation of cell parameters and volume with temperature was modelled up to 723 K, i.e. before the onset of oxidation, using the Berman equation (Berman, Reference Berman1988). Table 2 reports the relevant parameters of the fitting procedure. MTECs are also listed and compared with reference data of Sueno et al. (Reference Sueno, Cameron, Papike and Prewitt1973). These data were obtained for an almost iron-free tremolite sample using only three analytical points (at 297, 673 and 973 K). Regardless of the extended thermal range investigated by Sueno et al. (Reference Sueno, Cameron, Papike and Prewitt1973) (justified by the absence of any oxidation process) the MTECs are reasonably similar, the largest difference being shown by the a parameter (present work: 0.9 × 10⁻⁵ K–1; reference data: 1.2 × 10⁻⁵ K–1). Heating run (1), (2) and (5), carried out on pristine samples, provide slightly different X 0, a 0 and a 1 parameters of the Berman equation. This fact is caused by the reported small chemical variability typical of the tremolite sample from Maryland (Pacella et al., Reference Pacella, Andreozzi and Fournier2010, Reference Pacella, Tomatis, Viti, Bloise, Arizza, Ballirano and Turci2020), and of amphibole fibres in general (Gianfagna et al., Reference Gianfagna, Andreozzi, Ballirano, Mazziotti-Tagliani and Bruni2007; Andreozzi et al., Reference Andreozzi, Ballirano, Gianfagna, Mazziotti-Tagliani and Pacella2009). The behaviour of the re-heated samples will be discussed below.
Relevant parameters of the fitting procedure by the Berman equation of the cell parameter and volume vs. T data.

Notes: Thermal ranges for the various heating run were as follow: (1) 303–723 K; (2) 303–723 K; (3) 303–798 K; (4) 303–873 K; and (5) 303–723 K. Mean Thermal Expansion Coefficients (MTEC: see text for definition) of Sueno et al. (Reference Sueno, Cameron, Papike and Prewitt1973) (S73) are reported for comparison purposes. Temperature of reference T ref: present work = 303 K; S73 = 297 K.
Analysis of the variation of the normalised cell parameters and volume (X/X 0) with T (Fig. 5) shows that, in contrast to riebeckite (Oberti et al., Reference Oberti, Boiocchi, Zema, Hawthorne, Redhammer, Susta and Della Ventura2018), the b parameter is softer than the a parameter against temperature. This is explained by the significantly different cation population of both the strip of octahedra and the M(4) site of the two amphiboles. This fact is confirmed by re-evaluation of the original data of riebeckite using the Berman equation. The dependence of cell parameters and volume from T is linear (a 1 = 0). However, regardless of the a 0 value, the volume is fully consistent with that observed in the various heating runs of tremolite (2.28(14) × 10–5 K–1 as compared to 2.16–2.39 × 10⁻⁵ K–1) (Table 2), the contributions of the axial thermal expansions to the volume thermal expansion of riebeckite are different as b and c parameters show a smaller and a parameter a larger axial thermal expansion.
Change of normalised cell parameters and volume with temperature (T) for tremolite.

As far as the structural modifications are referred to, the geometry of the T(1) and T(2) tetrahedra is constant throughout the analysed thermal range (Table 3) and the individual <T–O> bond distances are in reasonable agreement with those reported by Sueno et al. (Reference Sueno, Cameron, Papike and Prewitt1973).
<T–O> bond distances obtained from the data of heating run (1). Data of Sueno et al. (Reference Sueno, Cameron, Papike and Prewitt1973) are reported for comparison purposes (S73).

The dependence of isotropic displacement parameters from T is shown in Fig. 6. Trends are regular and are reasonably close to those reported in reference data (BA data not shown to avoid excessive flattening of the graph as significantly higher (ca. 3×) than the others). The most relevant difference is observed for BT (1) = BT (2) that is slightly higher than reference data.
Variation of B iso displacement parameters with temperature (T) of tremolite for refinements from heating run (1). Data of Sueno et al. (Reference Sueno, Cameron, Papike and Prewitt1973) (S73) are reported for comparison purposes.

The analysis of the site scattering (s.s.) of M(1), M(2) and M(3) is intriguing and of relevant interest. Occupancy of M(1), M(2) and M(3) sites was refined using the scattering power of Mg whereas that of M(4) using the scattering power of Ca. In the following, we will discuss the variation of the occupancy of the sites instead of that of the corresponding s.s. owing to the different multiplicity of the various M sites. This approach allows the data of all M sites to plot in the same graph using the same scale, thus producing a clearer representation of the relative modifications. The variation of the occupancy of the M sites of tremolite with T is shown in Fig. 7. The trends show their limited variance up to 923 K (<occ>: M(1) = 1.071(4); M(2) = 1.053(4); M(3) = 1.084(7); M(4) = 0.994(4)). Values higher than one indicate the occurrence of Fe (heavier scatterer) substituting for Mg. Therefore, iron content exhibits the following site-specific occupation preference: M(3) > M(1) > M(2). However, at 923 K the occupancy of M(1) starts to grow significantly and this increment is counterbalanced by a proportional reduction acting preferentially at M(2) and, to a lesser extent, at M(3). This fact is indicative of the onset of a cation exchange process involving Fe that migrates at M(1) whereas Mg enters at M(2) and at M(3). Note that at 1073 K the occupancy of M(2) reduces to ~0.98, apparently suggesting the occurrence of minor cation vacancies. The occupancy further reduces to ~0.96 at 1123 K. Nevertheless, those values have to be evaluated with caution, keeping in mind that the absolute value of occupancies may be influenced by the correlations indicated in the Experimental section above. As a check for internal consistency of the data set, the calculated < total s.s. at M(1) + M(2) + M(3) > was constant and equal to 64.1(3) e – throughout the investigated thermal range. This value corresponds to an average content of 0.29(3) Fe atoms per formula unit (apfu), in good agreement with the RT structural data of Pacella et al. (Reference Pacella, Tomatis, Viti, Bloise, Arizza, Ballirano and Turci2020).
Variation of the occupancy of M sites of tremolite with temperature (T) as calculated from data of heating run (1). Occupancy of M(1), (2) and (3) was refined using the scattering power of Mg whereas that of M(4) was using Ca. Dashed lines represent the average occupancy values calculated in the 303 K ≤ T ≤ 873 K thermal range for the various M sites.

The formation of vacancies at M sites as a result of oxidation/deprotonation processes and cations migration has been reported for riebeckite (Oberti et al., Reference Oberti, Boiocchi, Zema, Hawthorne, Redhammer, Susta and Della Ventura2018) but in that case the sites involved were M(3) and M(4). The onset of the complex mechanism was observed in riebeckite, from SREF, though at 523 K, and implied the partial migration of Fe2+ (and to a lesser extent of Mg) from M(3) to M(4) and of Na from M(4) to A sites. In contrast, as can be seen in Fig. 7, the tremolite occupancy of M(4) is substantially unchanged throughout the analysed thermal range possibly experiencing a very marginal increase only. Moreover, the occupancy at A(m) is extremely small and characterised by relatively large variance [<occ. A(m)> = 0.020(16)]. Therefore, the mechanisms of cations exchange/Fe2+ oxidation/OH– deprotonation act in a different way in the two amphiboles.
The evolution of the <M–O> bond distances is shown in Fig. 8. Data points are fairly scattered, in particular those of M(3), and, in general, variations are small and of the order of a few standard deviations of the individual values. In the case of <M(1)–O>, bond distances are nearly constant, possibly showing a marginal increase in correspondence of 723 K i.e. the temperature of onset of the oxidation process. A more detailed analysis of the individual bond distances (Fig. 9) indicates that M(1)–O(2) regularly increases from RT to 1123 K. Differently, M(1)–O(1) shows very small variation. Therefore, it is essentially M(1)–O(3) that modulates the behaviour of <M(1)–O> bond distances. In fact, M(1)–O(3) expands up to 723 K and then contracts significantly up to ~ 2.02 Å. In the case of <M(2)–O>, bond distances increase in an almost regular way with no appreciable differences among M(2)–O(1), M(2)–O(2) and M(2)–O(4). Variation of <M(3)–O> bond distances is less regular and possibly M(3)–O(3) follows a behaviour similar to that of M(1)–O(3). This is not surprising as OH–, allocated at the O(3) site, simultaneously experiences a partial deprotonation to maintain the overall charge neutrality of the structure. Trends are similar to those observed in riebeckite (Oberti et al., Reference Oberti, Boiocchi, Zema, Hawthorne, Redhammer, Susta and Della Ventura2018) regardless of the very different Fe2+ content.
Variation of <M–O> bond distances of tremolite with temperature (T) from refinements of heating run (1).

Variation of M(1)–O bond distances of tremolite with temperature (T) from refinements of heating run (1). The area highlighted in grey indicates the thermal range in which both oxidation/deprotonation and cation migration occur.

Heating run (2) was limited to a maximum T of 848 K in order to induce a partial oxidation/deprotonation of the sample. Cell parameters and structure variations are fully consistent with those observed during heating run (1). As can be seen in Fig. 10, the trend of the evolution of cell parameters testify the occurrence of a certain degree of oxidation/deprotonation nearing the upper temperature. The measurement at RT, performed after cooling down the sample, indicates a moderate shrinking of the unit-cell volume (ca. 3 Å3). All cell parameters shorten and the β angle increases in agreement with the predictive equation, based on the chemical formula of Hawthorne and Oberti (Reference Hawthorne, Oberti, Hawthorne, Oberti, Della Ventura and Mottana2007, table 12), and also pointing towards the occurrence of (partial) oxidation. The predicted cell parameters of the pristine sample and those of the corresponding fully oxidised sample are reported in Table 4. There is a reasonable agreement between predicted and experimental cell parameters of the pristine sample, the largest discrepancy being observed for the β angle. However, the same discrepancy has been observed by Hawthorne and Oberti (Reference Hawthorne, Oberti, Hawthorne, Oberti, Della Ventura and Mottana2007) by comparing the predicted and the experimental cell parameters of Gottschalk et al. (Reference Gottschalk, Andrut and Melzer1999) for tremolite. Heating run (3) was performed, up to 873 K, on the sample cooled down after heating run (2). The cell parameters (Fig. 10) show trends similar to those obtained during runs (1) and (2) except for the onset of further oxidation, which is observed at higher T, i.e. 823 K, than that found in (2). The similarity of the trends is confirmed by the nearly identical a 0 and a 1 parameters of the Berman equations used to fit the dependence of the cell parameters from T (Table 2). The Rietveld refinement of the sample cooled down to RT after run (3) provides cell parameters only slightly smaller than those of the sample after run (2), indicating the production of minor extra oxidation during run (3). Progressive shrinking of the M(1)–O(3) bond distance with respect to the pristine sample supports this hypothesis. Heating run (4) was performed on the same sample and was extended up to a maximum T of 1173 K, the aim being to induce the complete oxidation of the sample. Coherently with run (3) the onset of the extra oxidation was found at a still higher T, i.e. 923 K, and the re-alignment of the variation of the cell parameters to the original trend is attained at 1073 K signalling the end of oxidation. The trend of the cell parameters of runs (3) and (4) are almost superimposable within the common thermal range. Final cell parameters, M sites population and M–O bond distances are fully consistent with those obtained in run (1). Heating run (5) was aimed at producing a fully oxidised sample, under controlled conditions, exploiting the information obtained in the previous experiments. The maximum T was set to 1073 K. The evolution of cell parameters and structure are coherent with those observed in run (1).
Variation of cell parameters and volume of tremolite during subsequent heating runs (2), (3) and (4). (a) a parameter; (b) b parameter; (c) c parameter; (d) β angle; and (e) cell volume.

Comparison between predicted (Hawthorne and Oberti, Reference Hawthorne, Oberti, Hawthorne, Oberti, Della Ventura and Mottana2007) and experimental cell parameters for pristine and oxidised samples of tremolite.

Notes: Δ corresponds to the differences between cell parameters of pristine and fully oxidised samples. Predicted cell parameters were calculated using the chemical data of Pacella et al. (Reference Pacella, Andreozzi and Fournier2010) and hypothesising a full oxidation following the dehydrogenation reaction Fe2+ + OH− = Fe3+ + O2– + ½ H2 (Phillips et al., Reference Phillips, Popp and Clowe1988): pristine (apfu): B(Fe,Mn) = 0.02; BNa = 0.01; CFe3+ = 0.08; CFe2+ = 0.44; TAl = 0.02; WF = 0.01; oxidised: (apfu): B(Fe,Mn) = 0.02; BNa = 0.01; CFe3+ = 0.52; TAl = 0.02; and WO2– = 0.44; WF = 0.01.
Structure modifications of the fully oxidised sample cooled down to RT
At the end of run (5) the sample was cooled down to RT and analysed. Cell parameters are reported in Table 4; note minor reacted clinopyroxenes were observed at RT. The difference (D) between the cell parameters of pristine tremolite at RT and those after run (5) are very similar to the differences between the corresponding predicted ones, confirming the completion of the oxidation process. By simple proportionality, based on D, we may estimate that the partly oxidised sample(s), obtained at the end of runs (2) and (3), are characterised by ~ 40–50% Fe2+ oxidation.
It is worth noting that Giacobbe et al. (Reference Giacobbe, Wright, Di Giuseppe, Zoboli, Zapparoli and Gualtieri2018) reported a very different behaviour for a sample of fibrous tremolite from Val d'Ala, Turin, Italy. The sample characterised by the chemical formula (Ca1.91Na0.06K0.01)Σ1.98(Mg4.71Fe2+0.22Fe3+0.08Mn2+0.02)Σ5.03[Si8.01Al0.02]Σ8.03O22.14(OH)1.86 was analysed by synchrotron nano-diffraction at RT before and after heating at 1073 K. Surprisingly, not only did cell parameters increase and the β-angle decrease after heating but also all <M–O> bond distances were found to expand. Finally, no s.s. modifications at the various M sites were observed indicating a very different thermal behaviour as compared to the present sample, possibly due to the different iron content.
Relevant structural data at RT of the fully oxidised sample obtained after run (5) are listed in Table 5. By evaluation of Fig. 7 and Table 5 it may be inferred that s.s. at the M sites are fully consistent with those obtained in situ at HT during run (5). In particular, ~85% of Fe3+ is allocated at M(1) while the remaining 15% is found at M(3). Those assignments are further supported by the very good agreement between the aggregate sizes of the constituent cations (rM), calculated from the Rietveld refinement with the procedure described in Vignaroli et al. (Reference Vignaroli, Ballirano, Belardi and Rossetti2014), and those calculated from the proposed sites partition. Moreover, M(1)–O(3) and M(3)–O(3) are significantly shortened compared to the pristine sample indicating the onset of OH– deprotonation at O(3). A peculiar feature was observed at the M(2) site. In fact, a s.s. value of 23.25(8) e –, consistent with the occurrence of 0.06 □ apfu, was refined, similar to the results obtained in situ at HT during run (5). A good agreement between rM (2) from the Rietveld refinement and that from the proposed site partition was obtained by considering a ‘cation radius’ of 0.75 Å for VI□, a value commonly used in the case of the crystal-chemical modelling of spinels (Lavina et al., Reference Lavina, Salviulo and Della Giusta2002), apparently confirming this hypothesis. It should be noted that in pristine tremolite Fe3+ is preferentially, if not completely, allocated at M(2) (Pacella et al., Reference Pacella, Andreozzi and Fournier2010, Reference Pacella, Tomatis, Viti, Bloise, Arizza, Ballirano and Turci2020) and its content is similar to the quantity of vacancies possibly occurring at M(2). Therefore, it is tempting to suggest that the HT (≥1073 K) complete removal of Fe3+, occurring during run (5), is not counterbalanced by the migration of Mg from M(1) and M(3) because such Fe3+ was not produced by oxidation and corresponding deprotonation of OH– at O(3). In fact, dehydrogenation is promoted by the presence of two Fe2+ at M(1,3) sites as in this case their oxidation forces the proton detachment from O(3). This fact suggests the occurrence of some Fe2+ clustering at those sites in the pristine sample. The excess iron could be possibly removed from the structure under the form of oxides, as reported in the case of grunerite (ex. magnetite: Ghose and Weidner, Reference Ghose and Weidner1971; Phillips et al., Reference Phillips, Popp and Clowe1991). However, the occurrence of magnetite was observed in the case of extended oxidation leading to the coexistence of both reacted and unreacted products arising from incipient thermal decomposition. A coherent behaviour has been described for the present sample heated at 1373 K i.e. above the temperature of structure breakdown. In fact, 0.20(2) wt.% of hematite was observed among the products, recovered at RT, of the complete structure breakdown of tremolite from Maryland, coexisting with pyroxenes, cristobalite and amorphous material (Pacella et al., Reference Pacella, Tomatis, Viti, Bloise, Arizza, Ballirano and Turci2020).
Relevant structural data of the RT refinement of the fully oxidised sample obtained after run (5). The s.s. derived from structure refinement (ref.) and those arising from considering M(2) as fully occupied by Mg (idealised) are reported. For comparison purposes, data of the pristine sample by Pacella et al. (Reference Pacella, Tomatis, Viti, Bloise, Arizza, Ballirano and Turci2020) are also reported (P20).

Notes: rM ref. and rM part. refer to aggregate size of constituent cations (rM) obtained from Rietveld refinement and the proposed site partition. * Calculated as <M–O> – 1.36 Å (Vignaroli et al., Reference Vignaroli, Ballirano, Belardi and Rossetti2014); ** Calculated as in table 7 of Hawthorne and Oberti (Reference Hawthorne, Oberti, Hawthorne, Oberti, Della Ventura and Mottana2007).
No reflections of iron oxides were observed in the diffraction pattern of the present tremolite sample after run (5). However, a different, more plausible explanation of the reduced s.s. at M(2) may be proposed.
In fact, Gianfagna et al. (Reference Gianfagna, Andreozzi, Ballirano, Mazziotti-Tagliani and Bruni2007) and Vignaroli et al. (Reference Vignaroli, Ballirano, Belardi and Rossetti2014) observed that s.s. of M sites from Rietveld refinements, on data collected in transmission mode, are consistently smaller than those from EMPA according to the regression equation (R 2 = 0.990)
 $${{\rm s}{\rm .s}.\ } {\rm EMPA} = - 13\lpar 3 \rpar + 1.22\lpar 4 \rpar {\rm s}{\rm .s} .\,ref.$$
and that the reduction of s.s. is mainly taken up by M(2). This small mismatch may arise from an imperfect absorption correction. According to the regression equation, an underestimation of ~1 e – is expected for a refined total site scattering at M(1) + M(2) + M(3) of 64 e –, as in the case of the present sample. This hypothesis is confirmed by the fact that EMPA and Mössbauer spectroscopy suggested the occurrence at the C sites of [Mg4.48(12)Fe0.52(9)] (sum s.s. = 64.7(4) e –: Pacella et al., Reference Pacella, Andreozzi and Fournier2010) whereas Rietveld refinement pointed to [Mg4.70(2)Fe0.30(2)] (sum s.s. = 64.29(19) e –: Pacella et al., Reference Pacella, Tomatis, Viti, Bloise, Arizza, Ballirano and Turci2020).
Therefore, it is impossible to state with certainty if the reported slightly low s.s. at M(2) is due to underestimation or by the occurrence of vacancies, albeit it seems reasonable to favour the former hypothesis. Table 5 reports the s.s. obtained from the structure refinement and those obtained by considering the M(2) site fully occupied by Mg. As can be seen, the differences are minor.
Conclusions
In this study the thermal behaviour of fibrous tremolite from Maryland has been investigated in situ up to the temperature of breakdown. The products of structure breakdown are subcalcic diopside and calcium-rich clinoenstatite in a 2:1 weight ratio plus minor hematite in substantial agreement with the result obtained ex situ by Pacella et al. (Reference Pacella, Tomatis, Viti, Bloise, Arizza, Ballirano and Turci2020). The only difference is the absence of cristobalite that has been possibly replaced by silica-rich amorphous material in the present work owing to different heating conditions. By evaluation of the data measured during different heating runs it is possible to observe that thermal expansion follows a regular trend up to 723 K before the onset of Fe2+ oxidation. This process partly counterbalances the effect of thermal expansion, as it is expected to produce a cell contraction, and is completed at 1023 K. At 923 K, a further process takes place, the migration of Fe3+ towards M(1) and the corresponding counter-migration of Mg to M(2) and M(3). Therefore, in the 923 ≤ T ≤ 1023 K thermal range both processes, Fe2+ oxidation/OH– deprotonation and cation exchange, are acting. At T approaching that of the structure breakdown, M(2) experiences a significant s.s. reduction, apparently consistent with the occurrence of a limited amount of vacancies or, more probably, with a full occupancy of the site by Mg. However, in the case of riebeckite, vacancies at M(3) and M(4) have been reported for thermally treated samples (Oberti et al., Reference Oberti, Boiocchi, Zema, Hawthorne, Redhammer, Susta and Della Ventura2018). In order to maintain charge neutrality, the population at O(3) is (OH–)1.75(O2–)0.25 in the case of M(2) fully occupied by Mg or (OH–)1.90(O2–)0.10 in the case of a partly vacant M(2) site.
Very recently, Pacella et al. (Reference Pacella, Tomatis, Viti, Bloise, Arizza, Ballirano and Turci2020) has highlighted that not only iron oxidation and coordination, but also lattice position of iron ions, drive the surface reactivity of amphibole asbestos and that iron migration/partition during heating directly influence the Fenton-like reactivity of the mineral surface. Present data indicate that in fully oxidised tremolite Fe3+ is allocated prevalently at M(1) and very subordinately at M(3). It is noteworthy that M(1), along with M(2), is the most exposed octahedral site at the surface (Pacella et al., Reference Pacella, Andreozzi and Fournier2010). Moreover, M(1) has a site multiplicity which is double that of M(3). Therefore, in the case of oxidised tremolite fibres most of the Fe3+ is available for participating in the Fenton-like reactivity rendering this material still potentially dangerous for human health. This piece of information is extremely important and should be properly taken into account by researchers involved in the evaluation of the safety of thermally decomposed tremolite-containing ACMs, in particular in the case of accidentally incomplete treatments.
Acknowledgements
This work was supported by the Ministero Italiano dell'Università e della Ricerca (MIUR) under Grant Progetti di Interesse Nazionale (PRIN) Italy 20173X8WA4.
Supplementary material
To view supplementary material for this article, please visit https://doi.org/10.1180/mgm.2020.89


 Open access