

INTRODUCTION
In 2009, The Netherlands faced two large, immediate health threats caused by infectious diseases. First, a novel influenza A virus subtype H1N1 was identified in Mexico, causing influenza A(H1N1)pdm09 [A(H1N1)pdm09], which was eventually declared a pandemic by the WHO [Reference Chan1]. Second, 2009 was the peak year of a large outbreak of Q fever (caused by the zoonotic pathogen Coxiella burnetii) [Reference van der Hoek2], with 2317 notified acute cases [Reference Fraser and Spiteri3]. A preliminary estimate of the A(H1N1)pdm09 pandemic, measured in terms of disability-adjusted life years (DALYs), was shown to be comparable to seasonal influenza [Reference Wielders4]. There is no such estimate available for Q fever.
When several public health threats occur at the same time, such as in The Netherlands in 2009, public health officials need evidence-based tools for prioritizing public health interventions. Using disease-specific models to calculate DALYs, a common health measure, provides a powerful evidence-based tool that allows comparison of different diseases within the same framework. For infectious diseases such a framework was developed in the Burden of Communicable Diseases in Europe (BCoDE) project [Reference Kretzschmar5]. Q fever and seasonal influenza are two of these infectious diseases being investigated within the BCoDE project. In this paper comparable methodology will be applied [Reference Kretzschmar5].
The limited number of cases in The Netherlands before 2007 meant that Q fever was little more than an exotic disease for public health policy. Farmers and veterinarians are known to come into contact with the bacteria as it is frequently found in ruminants in almost every country in the world [Reference Marrie6]. The large rise in goat farming close to highly populated areas in The Netherlands is probably to be related to the outbreak [Reference Schimmer7]. The acute illness is self-resolving in most cases in combination with relatively low mortality in Q fever cases (only six registered deaths in more than 2300 notified cases in 2009 [Reference van der Hoek2]). Until the large outbreak in The Netherlands, the medical literature was based primarily upon isolated outbreaks and incidental cases resulting in an incomplete understanding of the disease. One of the new insights from the Dutch outbreak is that asymptomatic cases can develop chronic Q fever. Two complications, referred to as sequelae, years after the initial infection currently affect hundreds of patients in The Netherlands. Many patients retain untreatable post-infectious fatigue symptoms that severely disrupt their daily lives, up to 44% in a short term (12–26 months) follow-up study [Reference Morroy8]. Moreover, a treatable chronic Q fever infection resulting in culture-negative endocarditis or infectious vasculitis has a high mortality if not recognized early and extensively treated [Reference Maurin and Raoult9]. The purpose of this study is to quantify the burden, in DALYs, of Q fever and A(H1N1)pdm09, two emerging infectious diseases in The Netherlands, using new, standardized methodology.
METHODS
Data sources
For this study Q fever notification data was obtained from the RIVM and extracted by gender (1407 men, 906 women), and age, with date of symptom onset between 1 January 2009 and 31 December 2009. Seasonal influenza is not a notifiable disease but influenza A(H1N1)pdm09 virus became notifiable from 29 April 2009. The RIVM's notification criteria changed on 15 August when only laboratory-confirmed cases admitted to a hospital or deceased required notification. Inconsistent notification for influenza A(H1N1)pdm09 made direct comparison with Q fever notification data impractical. Therefore, the Dutch Sentinel General Practice Network for influenza-like-illness (ILI) from NIVEL Netherlands Institute for Health Services Research, was used for A(H1N1)pdm09. This network of General Practitioners (GPs) covers a sample of ∼0·8% of the Dutch population that is nationally representative by distribution of age, gender, region and population density [Reference Heijnen10]. To obtain a 12-month period for both diseases, ILI symptoms from 27 April 2009 (the week of the first notified case) until 26 April 2010 were extracted by gender (1219 men, 1508 women), and age. Based upon the surveillance laboratory testing, raw ILI incidence data were considered to be 24% influenza positive [Reference Dijkstra11], which is within a range of previous influenza seasons [Reference Dijkstra12].
Composite health measure
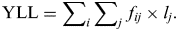
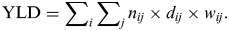
The DALY is a composite health measure that represents one lost year of healthy life between the current health status and that of an ideal health situation. The DALY methodology is used by the World Health Organization (WHO) in its Global Burden of Disease (GBD) project [Reference Murray, Lopez and Jamison13] and also in the BCoDE project of ECDC. The DALY combines illness mortality, measured in terms of years lost due to premature death (YLL), and morbidity, the number of years lost due to disability (YLD).
The BCoDE project methodology, which was used for this paper, attributes DALYs of an infectious disease to the year the acute infection occurs. This allows for the attribution of long-term sequelae, which may generate a higher number of DALYs, to the causative infection rather than only the initial acute illness [Reference Wielders4]. We used 2009 Dutch life expectancy to calculate the YLL to increase comparability with other studies in The Netherlands [Reference Wielders4, 14]. The total YLL is the sum of the number of fatal cases (f) in 5-year age groups (j) multiplied by the remaining life expectancy (l) at the age of death over all health outcomes (i) with mortality [Reference Kretzschmar5]:
 $${\rm YLL} = \sum\nolimits_i {\sum\nolimits_j {\,f_{ij}}} \times l_j. $$
The total YLD is the sum of the number of cases (n) in all age groups (j) multiplied by the duration of the health outcome (d) and by a disability weight (w) over all health outcomes (i). A disability weight represents the magnitude of disability of a health outcome and is between 0 and 1, representing perfect health and death, respectively [Reference Murray and Acharya15].
 $${\rm YLD} = \sum\nolimits_i {\sum\nolimits_j {n_{ij}}} \times d_{ij} \times w_{ij}. $$
Total DALY count provides a measure of how a population is affected while DALYs/1000 symptomatic cases provides a measure of how a symptomatic individual is affected. DALY estimates in our study do not incorporate time or age discounting [Reference Murray and Acharya15].
Outcome tree
An outcome tree is a visual representation of the disease progression from infection, through health outcomes to an end state; recovery, death or disability for the remaining life expectancy (Fig. 1). To attribute long-term sequelae to a pathogen there must be a quantifiable, evidence-based causal relationship between infection and sequelae or, if lacking, consensus of disease experts. The total probability of entering a health outcome from a previous health outcome is the transition rate between the two health outcomes. Health outcomes are not mutually exclusive but each health outcome can have multiple, mutually exclusive health states, which take different severities of the health outcome into account. The health outcomes for Q fever and A(H1N1)pdm09 are taken from the published literature (Table 1). An extensive description of transition parameters and derivation are available in the Supplementary online material.
Outcome trees for (a) Q fever and (b) influenza A(H1N1)pdm09. * Severe health state is included because acute Q fever has higher pneumonia hospitalization rate than influenza. † Severe health state has a duration of 10 years while mild has only a duration of 1·5 years. ‡ Severe health states include patients that develop acute respiratory distress syndrome (ARDS), pneumonia, otitis media and sepsis, and visit a General Practitioner. § Of the severe cases a proportion will develop complications and risk permanent disability.

Health outcome transition rates and mortality rates for Q fever and influenza A(H1N1)pdm09

* Only one point estimate was found in the literature. To reduce artificial certainty a distribution range was taken between 90% and 110% values of the point estimate.
Adjustment for underreporting
Notified incidence data does not catch all cases and requires adjustment to account for asymptomatic infections, misdiagnosed cases or diagnosed cases not reported. Van der Hoek et al. published a study comparing serological incidence and notified cases of Q fever during the A(H1N1)pdm09 outbreak. They found that there were 12·6 times [95% confidence interval (CI) 6–26] more infected cases than notified cases [Reference van der Hoek16]. For the multiplication factor for A(H1N1)pdm09 we used the range 4·42–5·59 (ILI cases visiting a GP varied from 17·9% to 22·6%) [Reference Friesema17].
Uncertainty in parameter estimates
Uncertainty was incorporated into the model to account for uncertainty surrounding model parameters pertaining to transition probabilities and underreporting. Variability of the clinical presentation of the disease was not addressed as calculations measure how a population is affected. Depending on available information on parameter estimates either a uniform distribution or a programme evaluation and review technique (PERT) distribution was used [Reference Kerzner18]. A PERT distribution, frequently used in risk assessment, is defined by a minimum, a maximum and a mode value [Reference Clark19]. With a single estimate from the literature, uncertainty was incorporated by using a PERT distribution with the single estimate as the mode and its 90% and 110% as the minimum and maximum, respectively. With two estimates a uniform distribution was used. With three estimates a PERT distribution was used with the lowest estimate as the minimum, the highest as the maximum and the remaining as the mode.
Model parameters
To calculate DALYs the model requires not only information regarding the transition from one health outcome to the next (Table 1) but also information about the duration and disability weight of each health outcome of Q fever and A(H1N1)pdm09 (Table 2). The models used disability weights taken from the WHO GBD study if available, otherwise from Stouthard et al. [Reference Stouthard20], with the exception of permanent disability after sepsis [Reference Korosec Jagodic, Jagodic and Podbregar21]. Detailed information is included in the Supplementary online material.
Disability weights and durations for Q fever and influenza A(H1N1)pdm09

* Stouthard et al. assumed a single infection per year and the disability weight represents the disability of a single, yearly infection.
For some outcomes no disability weights were available in the literature. In such instances proxy disability weights were used if the health outcomes were assumed to be similar in severity. In instances where health outcomes were more severe than proxy health outcomes, health states were used. Acute Q fever has no disability weight but is comparable to, although more severe than, an acute influenza infection for which there is a disability weight. The percentage of Q fever acute illness presenting with pneumonia is higher (61·5% [Reference Dijkstra22]) than for A(H1N1)pdm09 (34·3% of hospitalized cases (2·2% of symptomatic) [Reference van ‘t Klooster23]). The acute Q fever health outcome is comprised of a mild health state, using the seasonal influenza disability weight, and a severe health state, using a pneumonia disability weight for the additional proportion (61·5%) developing pneumonia. Clinical literature provided durations for the health outcomes of Q fever and seasonal influenza (Table 2). For Q fever's post-infectious fatigue syndrome, the proxy disability weight for ‘major depression, mild episode’ was used [Reference Stouthard20], although this is likely to be an under-estimation. A study of 85 patients with chronic fatigue syndrome [Reference Myers and Wilks24] showed a higher disability than the proxy disability weight when measured with a standardized instrument. For symptomatic chronic Q fever endocarditis, where death is frequently due to congestive heart failure [Reference Rubinovitch and Pittet25], the disability weight for ‘congestive heart failure’ was used [Reference Gami26]. For symptomatic chronic Q fever vascular infection no information regarding duration or disability was available so proxy parameters from symptomatic chronic Q fever endocarditis, a similar health state, were used.
There are disability weights available for influenza acute illness [Reference Stouthard20], deafness from otitis media [Reference Murray, Lopez and Jamison13] and permanent disability due to sepsis [Reference Korosec Jagodic, Jagodic and Podbregar21]. However, for permanent disability due to acute respiratory distress syndrome (ARDS), a disability weight for ‘mild-moderate COPD’ was used [Reference Stouthard20].
Scenarios
The literature provided conclusive information for most parameters of the models but to answer certain questions additional scenarios were required. For the Q fever baseline scenario, using parameters from Tables 1 and 2, the parameter values are well documented except for the transition rate from asymptomatic cases developing chronic Q fever. For the Q fever baseline scenario we assumed, in the absence of evidence to the contrary, that the transition rate is the same rate as the rate for symptomatic cases developing chronic Q fever. It is plausible that the rate for asymptomatic cases is lower than that of symptomatic cases so for Q fever scenario 2 we assumed that chronic Q fever from asymptomatic cases does not occur. In the literature a larger under-ascertainment multiplication factor was reported from a cohort of high-risk patients screened for Q fever. In Q fever scenario 3 we used this larger multiplication factor observed by Kampschreur et al. in the centre of an outbreak catchment area [Reference Kampschreur27].
For A(H1N1)pdm09 a baseline scenario was calculated using parameters from Tables 1 and 2 with mortality estimates divided equally between the genders as reported by Wijngaard et al. [Reference Wijngaard28]. Mortality is a large contributor to the total DALY estimate and A(H1N1)pdm09 affected younger age groups more than seasonal influenza in previous years. For A(H1N1)pdm09 scenario 2 the mortality age distribution for seasonal influenza replaced the A(H1N1)pdm09 distribution although the number of cases did not change [Reference Wijngaard28]. For A(H1N1)pdm09 scenario 3 the reported average case-fatality rate from the USA, Denmark, The Netherlands, New Zealand and England was used to observe how the baseline scenario compared to observed data [Reference Dawood29].
Software
The models were implemented in Microsoft Excel 2003 (Microsoft Corp., USA). Uncertainty was incorporated into the model using @Risk (Palisade Corp., USA). For all scenarios 10 000 simulations were performed using a random seed. Outcomes are reported as means of the posterior distribution and 95% error bounds were taken.
RESULTS
Q fever
The total number of Q fever-infected cases was estimated at 18 392 men (95% CI 15 361–21 812) and 11 987 women (95% CI 9956–14 231). The incidence in the population was 225 cases/100 000 men and 143 cases/100 000 women in The Netherlands. The baseline scenario for Q fever estimated 5797 DALYs for 2009 1771 DALYs from acute illness and 4027 DALYs from sequelae (Table 3, Fig. 2). Mortality comprised 29% of the total burden with 29 deaths from acute illness and 19 deaths from chronic Q fever. Post-infectious fatigue syndrome contributed 3331 DALYs and comprised 57% of the total burden. The 45–49 years age group has the largest burden in the population (Fig. 3).
Disability-adjusted life years (DALYs) breakdown by health outcome for baseline scenarios for (a) Q fever and (b) influenza A(H1N1)pdm09.

Baseline scenario, disability-adjusted life years (DALYs) per age group for (a) Q fever and (b) influenza A(H1N1)pdm09. YLD, Years lost due to disability; YLL, years lost due to premature death.

Results breakdown for scenario analyses

YLD, Years lost due to disability; YLL, years lost due to premature death; DALY, disability-adjusted life years.
Values in parentheses are 95% confidence intervals.
Q fever scenario 2, assuming no asymptomatic cases develop chronic Q fever, reduced the number of deaths by 12, reduced DALYs by 440, and lowered the mortality proportion of total burden to 19%, (Fig. 4). Scenario 3, using under-reporting factors from a second study, increased the number of Q fever cases to 1 52 017 DALYs by 23 212 but mortality remained the same compared to the baseline scenario (Table 3).
Scenarios for (a) Q fever and (b) influenza A(H1N1)pdm09. Sc3, Scenario 3; Sc2, scenario 2; BSc, baseline scenario; YLD, years lost due to disability; YLL, years lost due to premature death.

Influenza A(H1N1)pdm09
The number of A(H1N1)pdm09 cases was estimated to be 183 058 (95% CI176 561–189 625) men and 226 457 (95% CI219 085–233 841) women. The incidence in the population was 2244/100 000 men and 2719/100 000. The A(H1N1)pdm09 baseline scenario had a total of 24 484 DALYs with 21 451 DALYs (88%) from acute illness, and 3033 DALYs from sequelae (Table 3). A total of 611 deaths from acute illness are predicted (71% of total burden, 81% of acute burden) and none from long-term sequelae.
A(H1N1)pdm09 scenario 2, a calculation providing a reference to seasonal influenza, reduced the total DALYs by 9693 and reduced the contribution of mortality to 52% of the total burden. Scenario 3, with data from later in the outbreak, calculated a larger number of deaths (1927, 95%CI 493–4225), doubled the total number of DALYs compared to the baseline scenario, and the contribution of mortality to total burden increased to 86%.
DISCUSSION
To our knowledge, this is the first DALY calculation for Q fever in The Netherlands during the large outbreak in 2009. This is also the first use of BCoDE methodology to compare two concurrent emerging infectious disease outbreaks in a single country. The scenarios provide additional references for comparisons and interpretation. Comparing the baseline scenarios for the 2009 Q fever outbreak with A(H1N1)pdm09, the total number of DALYs in the Dutch population is larger for A(H1N1)pdm09. However, on a per case basis Q fever is more severe per case in all scenarios. The severity of Q fever is not well represented by acute illness as there is a low mortality and cases are predominantly self-resolving.
The scenario analyses for the diseases allowed for within-disease comparison and quantifying of the role of specific parameters in the model. A(H1N1)pdm09 scenario 2 shows that A(H1N1)pdm09 was 1·65 times worse than seasonal influenza, due mainly to mortality in younger age groups. A(H1N1)pdm09 scenario 3 shows that the case-fatality rate doubled the DALY estimate although the difference is not significant. Q fever scenario 2 shows that removing chronic Q fever cases from asymptomatic cases reduces DALYs only by 8% and is not the major contributor to the total burden. Q fever scenario 3 shows the importance of the effect of under-reporting factors, as the burden is five times larger than the baseline scenario.
Comparing Q fever to A(H1N1)pdm09 in terms of the ratio of the composite health measures, Q fever infections are 8·28 times worse than A(H1N1)pdm09 infections for each symptomatic infection and 13·81 times worse than seasonal influenza, which is estimated in A(H1N1)pdm09 scenario 2. Moreover, for A(H1N1)pdm09 the major contributor is acute mortality while for Q fever the contribution is largely due to long-term sequelae up to 10 years after the initial infection.
Some limitations concerning the model and DALY calculations that may affect the calculations should be discussed. The model is dependent upon accurate estimations of incidence and subsequent estimates are highly sensitive to under-reporting factors. Heterogeneity in different study populations can lead to different transition parameters. Vascular infections occurred more frequently in The Netherlands Q fever outbreak [Reference Kampschreur30] than in endemic regions where endocarditis was the most common complication of chronic Q fever [Reference Maurin and Raoult9]. Healthcare-seeking behaviour may also affect Q fever reporting or A(H1N1)pdm09 ILI sentinel data. Comorbidity, which avoids over-estimation of concurrent infections in one patient remains an issue, but during an outbreak with two relatively short illnesses it may not affect estimates as much as with other chronic illnesses.
Although much of the information required for these outcome trees was not available during the outbreak, combining the information gathered and analysing these outbreaks retrospectively provides a reference for the next time one of these infectious diseases poses a health threat. Disease burden models can be used in three ways; (i) to estimate the burden of an outbreak retrospectively, (ii) as a template for burden estimation during a future outbreak with the same pathogen, where some parameters may have changed, or (iii) as a point of reference in an outbreak caused by a new or different pathogen. In the latter case, one needs to consider differences and similarities in the course of infection and sequelae between the different diseases. Information over sequelae and parameter values is usually not available for new pathogens, but may be partially collected during the outbreak. Further, comparison with related pathogens may give some indications as to what may possibly contribute most to the future burden.
Q fever is an example of an infectious disease with low variability of the pathogen; however, differences between countries in contributions of sequelae to disease burden have been observed [Reference Maurin and Raoult9]. Using the A(H1N1)pdm09 model for estimating the burden of seasonal influenza is an example of a situation where the pathogen and its virulence vary between seasons. The model requires adjustment of parameters to be able to reflect the impact of changing virulence on disease burden.
Finally, for other or newly emerging pathogens, the A(H1N1)pdm09 model could be used as a qualitative template for diseases with a similar acute illness presentation. For example, for infections such as the severe acute respiratory syndrome (SARS) or Middle East respiratory syndrome (MERS CoV) collecting information on acute infection and case-fatality rates during an outbreak indicate whether the expected burden will be higher or lower than the one caused by A(H1N1)pdm09. In this way, other pathogens can be ranked in terms of their impact on population health. Those rankings can then be refined as more information becomes available in the course of an outbreak. In a similar vein, the burden of two concurrent outbreaks may be ranked and compared with that of A(H1N1)pdm09. However, those estimates and rankings necessarily remain crude as information on the number of cases that will be affected and long-term sequelae will only become available over a much longer time scale.
The information could also be combined with economic data to perform a cost-effective analysis. Quantifying diseases in total burden, burden per symptomatic case and proportion attributable to mortality are measures that provide insight into each disease's profile with regard to the immediate as well as the long-term effects on a population. The A(H1N1)pdm09 burden has a high total burden with a large proportion due to mortality and little in long-term sequelae. Q fever, however, has a lower total burden with little mortality but the long-term sequelae contribute a high burden and the burden per symptomatic case is also larger. Interventions for A(H1N1)pdm09 would not need to retain resources to address long-term consequences while interventions for Q fever should take the long-term effects on the livelihood of patients into account when addressing the disease burden in the population.
Intervention prioritization for influenza should target services that support patients in a critical condition while for Q fever it should target immediate interventions for containment and support for patients with long-term sequelae. The characterization of the disease burden provides evidence for future outbreaks of Q fever, a template for seasonal influenza based upon the A(H1N1)pdm09 model, and points of reference to compare with burden of other, possibly emerging pathogens.
SUPPLEMENTARY MATERIAL
For supplementary material accompanying this paper visit http://dx.doi.org/10.1017/S0950268813003531.
ACKNOWLEDGEMENTS
We thank Roel Coutinho for advice and input for the article. Part of this work was done in the context of the Burden of Communicable Diseases in Europe (BCoDE) study, which was funded by the European Centre for Disease Prevention and Control (Specific agreement No. 1 to Framework Partnership Agreement GRANT/2008/003). We thank all members of the BCoDE Consortium for their contributions to the project.
DECLARATION OF INTEREST
None.


