

1. Introduction
The transition of most Organisation for Economic Co-operation and Development (OECD) countries to negative population growth raises interesting questions about fertility in the developed world.Footnote 1 Many middle- and high-income countries display persistent differences in fertility unexplained by differences in per capita income or by women's labor force participation. Are these due to persistent differences in preferences and norms or a response to local economic and social conditions? How much do local conditions influence intimate decisions like family size? The apparent assimilation of local fertility rates by immigrants [Ford (Reference Ford1990), Blau (Reference Blau, Borjas and Freeman1992), Woldemicael and Beaujot (Reference Woldemicael and Beaujot2012)] provides apparent evidence that they do. Yet, assimilation is hard to distinguish from self-selection; perhaps similar types migrate in search of child-friendly environments.
In this paper, we pursue an economic theory of immigrant self-selection on fertility, based on intergenerational altruism [Becker (Reference Becker1981)]. We view migration as a human capital investment in which the welfare of descendants is considered. In the face of migration costs, and returns disproportionately realized by descendants, intergenerationally altruistic families are more likely to migrate. The importance of intergenerational altruism in migration decisions has appeared in the study of Borjas (Reference Borjas1993), Tcha (Reference Tcha1996), and Gardner (Reference Gardner2020).Footnote 2 Our innovation is to observe that immigrant families self-selected on altruism may have more children (or less, higher “quality” children, depending on relative prices). Thus, self-selection of immigrants on fertility is suggested by theory.
Figure 1 illustrates the fertility of countries at different income levels, graphing total fertility rates (TFRs)Footnote 3 against per capita income for a sample of countries with GDP per capita above $10,000 in 2018. The line illustrates the well-established negative correlation of income and fertility, fitted here as a linear regression of the logarithm of fertility on the logarithm of per capita GDP (for all countries). The negative time series correlation within individual countries, the “fertility transition” is also well established. The figure also illustrates that all European countries are below replacement fertility (except for Greenland and the Faroe Islands) and that the same is true of the most developed countries. Among these wealthier countries, predominantly Muslim countries are disproportionately above the curve,Footnote 4 whereas historically Catholic countries tend to be below [Chou (Reference Chou2011), Berman et al. (Reference Berman, Iannaccone, Laurence and Ragusa2018)].
Fertility and income across countries, 2018. Note: Sample restricted countries with at least US$10,000 of GDP/capita in 2018. To preserve resolution four countries were excluded from the graph: Luxembourg (TFR = 1.41, GDP/capita = $114k), Lichtenstein (1.61, $165k), Equatorial Guinea (5.79, $10k), and Seychelles (3.63, $16k), leaving 66 countries. The curve represents a fitted regression of ln(fertility) on ln(GDP/capita) for (all) 185 countries (R 2 = 0.60, elasticity = −0.23).
Source: World Development Indicators.
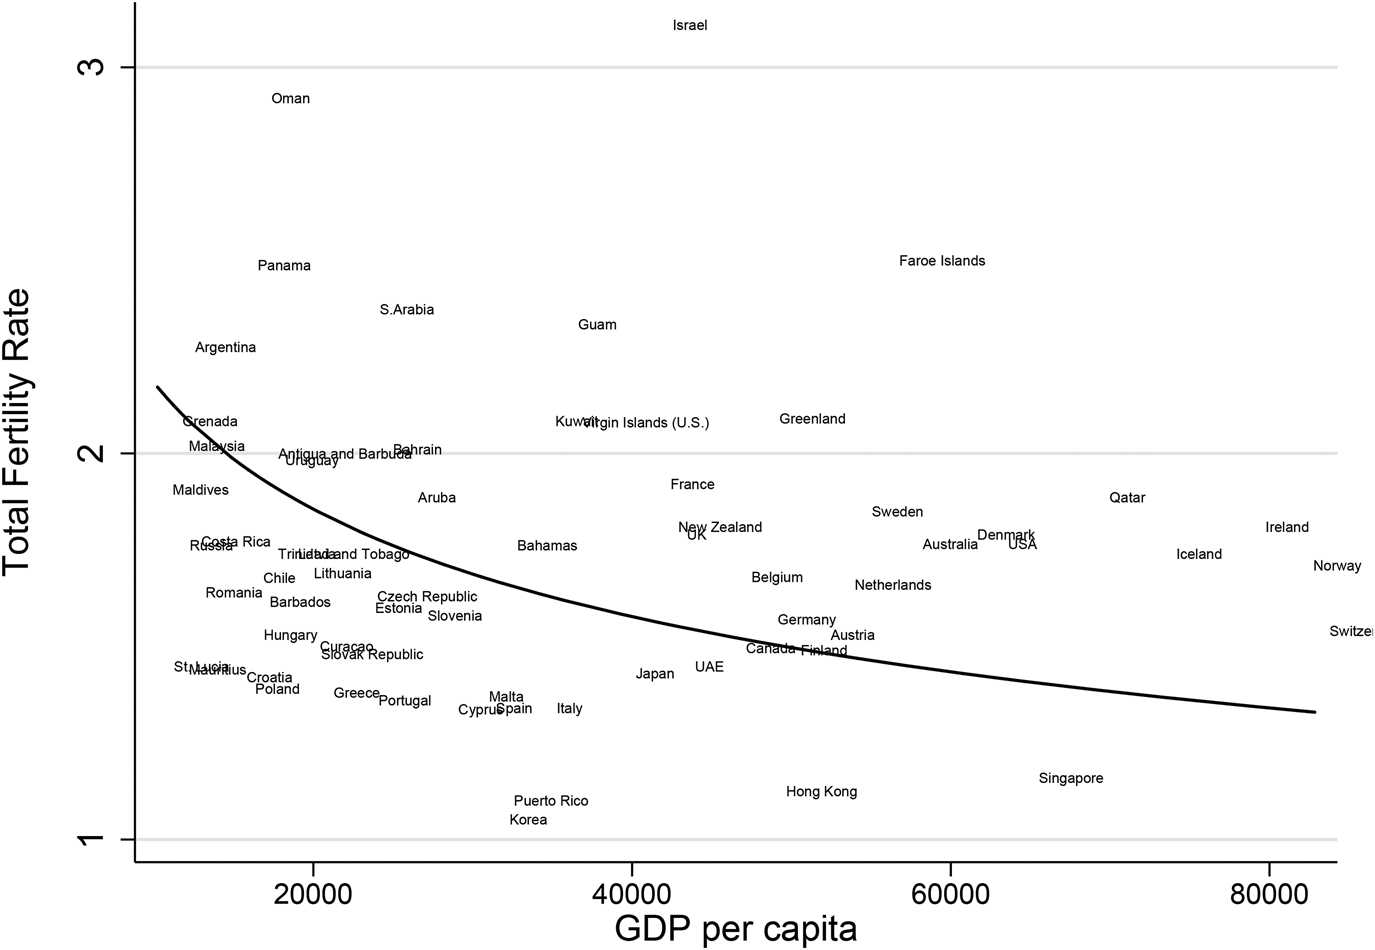
Figure 1 also illustrates a subtler finding: in this wealthier sample of countries, those which have historically absorbed voluntary migration tend to be above the curve, such as the United States (TFR = 1.77), Argentina (2.28), Australia (1.77), New Zealand (1.81), and Uruguay (1.98). Canada is an exception, sitting just below the curve with TFR = 1.50. The majority of historically emigrant-sending European countries tend to be below the curve, including all of southern and eastern Europe. If these differences persist, which they seem to do,Footnote 5 they imply strong divergence in long-term native-born population levels (even in the absence of future migration). Positive correlation between historical immigrant-absorption and fertility motivates our investigation.
Is that positive correlation due to the effects of living in a particular place, or to selection? Migration between countries with differing fertility rates can provide information about selection. Immigrants from low income, high fertility countries to the United States who arrive as young women have fertility rates very similar to those of American women [Blau (Reference Blau, Borjas and Freeman1992)]. This is often interpreted as assimilation. Yet, those immigrant women often also have observable characteristics that predict negative selection on fertility such as high education and income, when compared with women who remain in their country of birth.
In studying self-selection Jewish immigrants to Israel from Eastern Europe and Russia are interesting for three reasons.Footnote 6 First, they come from countries which have already experienced fertility transition, and actually have unusually low fertility considering their relatively low income per capita, as shown in Figure 1. Second, Soviet Jewish women had high rates of educational attainment. This may reduce possible positive self-selection of migrants on education (the focus of much of the literatureFootnote 7), implying possible negative selection on fertility.
Third, and most important, these immigration waves provide large samples of individuals who experienced vastly different migration costs but come from the same birth cohorts. The first wave migrated at very high (and uncertain) cost in the 70s and early 80s, whereas the second wave exploited a surprise opportunity to migrate at relatively low cost from 1989 onward. This allows us to test a key implication of our model: that selection on intergenerational altruism increases when migration costs are high (i.e., the net present value of the migration investment is low).Footnote 8 Note that in comparing these arrival cohorts the usual “natural” experiment practice of arguing that treatment and comparison groups should have similar observable characteristics (as they would under random assignment) does not apply. In this case the opportunity to migrate at low cost (beginning in 1989) allows us to estimate the degree of self-selection among the early arrivals, as opposed to a treatment effect.
Israel, a historically immigrant-absorbing country, is a positive outlier in the figure, with extremely high fertility (TFR = 3.11) conditional on income. Friedlander and Feldmann (Reference Friedlander and Feldmann1993) point out that among Israeli Jews this high fertility rate is due mainly to the fertility of the Orthodox and Ultra-Orthodox communities, who average 4.5 and 7 births per woman, respectively. Israel's non-Orthodox Jewish majority averages about 2.1 births per woman (still well above the curve).Footnote 9
The seeds for this enquiry were planted in the summer of 1976, when one of the authors visited the family of his grandmother's long lost half-brother, who had immigrated to Israel from the (former) Soviet Union in 1973, reuniting strands of a family separated for two generations. The immigrant family spanned three generations, two grandparents, three children—two of whom had spouses, and two grandchildren. The adults, struggling with Hebrew, told lovely, nostalgic stories about beloved cousins, but also about the parks, orchestras, architecture, and libraries of Kiev, whereas a toddler played on a little patch of grass, in a public park on the edge of a vast dusty desert in the hot Israeli summer.
The same author gently pointed out that the town they were resettled in seemed to scarcely compete with the cultural richness of Kiev. Which begged the question: Did they have any regrets? No, they answered as one. The little boy playing in the grass, they proudly proclaimed, would grow up in the West!
Seven adults had migrated for the sake of two grandchildren; that family might be selected on intergenerational altruism. That same child-loving altruism might imply higher fertility, as we argue formally below (even if that particular family did not demonstrate it).
Empirically, the Israeli data support that argument, though a little background is necessary before we can separate estimated selection from treatment effects on fertility. Women emigrating from Eastern Europe to Israel differ from typical immigrants to the United States in three ways: first, their fertility increases as they move from a low to a high-fertility country. Second, earlier waves of Eastern European immigrants do much better than “assimilating” the local fertility rate. They eventually “overtake” natives in fertility, averaging 2.5 children per woman, as opposed to 2.1 (for secular Jewish women). [That contrast recalls Chiswick (Reference Chiswick1978), in which immigrants to the United States overtake natives in earnings.] Third, in the recent wave of immigrants we observe the fertility of women originally left behind. Consider two arrival cohorts, both born around 1950. Those who arrived in the 1970s and 1980s, spending some fertile years in Israel, had 2.5 children by the 1990s. Women from the same birth cohort who arrived in the 1990s, after spending their fertile years abroad, have 1.7 lifetime children (which is close to the urban Soviet TFR of 1.7).Footnote 10
Can we interpret this 0.8 child difference in fertility between arrival cohorts as the treatment effect of moving to a Western economy? That effect size is plausible, since housing is less cramped and basic household goods are more affordable. But if so, that migration effect on fertility would have implied a large baby boom in former communist countries when their economic transition is finally complete, which does not seem to be occurring.
We use as a comparison group women who migrate early (during the high cost period) who are too old to experience a treatment effect, allowing us to separately identify treatment and selection effects. That (difference in difference) method reveals that the 0.8 child difference in fertility is mostly (87%) due to self-selection (0.73 children).
To check that estimated selection effect on fertility, we develop an alternative estimation method which separately identifies treatment and selection by imposing a functional form on years since migration and “fertile” years since migration. This second method allows us to gain precision by using more data and to gain accuracy by using more controls. The literature has stressed the importance of country of birth in measuring selection effects in wages [Borjas (Reference Borjas1987, Reference Borjas1994), Friedberg (Reference Friedberg2000)]. This method allows us to control for both country of birth and birth cohort effects. Like the first approach, it also yields large estimated selection effects on lifetime fertility: 0.44 to 0.57 children, depending on specification.
Evidence for positive self-selection of migrants in fertility is consistent with intergenerational altruism playing an important role in migration decisions. Selection on altruism implies, in turn, that populations in immigrant-absorbing countries will tend to behave like doting parents, should those preferences be passed to the next generation. They would invest more in the welfare of their children either through faster accumulation of human and physical capital, or through higher fertility, or both. That mechanism would suggest permanent differences in population growth or per capita income, or both, between the immigrant-absorbing regions and other regions.
Altruism may not be the only source of self-selection on eventual fertility. In this particular setting, early emigrants may have been selected on a desire for religious preservation, for instance, which would also have a natural link to fertility. To distinguish selection on altruism from other causes we also examine other testable implications of the altruism mechanism, finding that in the United States immigrants are more likely to spend time with grandchildren (even conditional on income) and somewhat more likely to believe that bequests are important (depending on specification). Those effects are robust to the inclusion of controls for the shadow value of time and other socioeconomic characteristics.
Section 2 presents a theory linking migration and altruism, a straightforward extension of Becker (Reference Becker1981). Section 3 describes waves of Soviet migration to Israel, and presents our data source. In section 4 we estimate selection and treatment effects on fertility for Soviet immigrants to Israel, and probe alternative interpretations. Section 5 examines separate evidence on altruism of U.S. immigrants. Section 6 concludes.
2. Self-selection of immigrants on altruism and fertility
Migration is at least partially an investment in human capital. Even the wealthiest immigrants can hardly ignore the economic aspects of a migration decision for themselves and their children. Migration is expensive and expensive to reverse, especially for immigrants from Eastern Europe before 1989. Therefore, the appropriate investment horizon is arguably intergenerational.
To illustrate how altruism links fertility and migration, consider a two-period maximization problem for a family of potential immigrants. Two parents have an intergenerational utility function in the tradition of Becker (Reference Becker1981), Razin and Ben-Zion (Reference Razin and Ben-Zion1975), and Becker and Barro (Reference Becker and Barro1988)Footnote 11

where the couple has f children. The parents consume c 0 each in period 0. They and the children consume c 1 each in period 1. The function v(.) is assumed to be concave and identical for all family members. Note that ρ represents both intergenerational altruism toward utility of children and a discount factor for future (parental) utility—we call it altruism for short.
The couple can increase future utility by investing in migration, m, or by having children at cost k per child. Investment cost m includes both pecuniary and nonpecuniary costs of migration, including language acquisition and loss of country-specific human capital. That migration investment has a return r for both parents and children, all of whom will realize a higher wage in the destination country. Parents work in the first period at wage w 0 and all family members work in the second period, at wage w 1 (1 + rm) (i.e., w 1 for nonmigrants), yielding consumption


To illustrate the nature of the solution we allow both the migration investment m and the number of children n to be nonnegative real numbers, though both are discrete by nature. (Alternatively, we could imagine a continuum of places to migrate to, or family members who would work some proportion of the second period, with a linear envelope of costs and returns.)
Parents maximize utility by making two choices, the number of children, f, and investment in migration, m, yielding first-order conditions:


That is, the cost of a child in foregone utility equals the discounted benefit, and investment in migration is equal to its discounted return.
Now consider heterogeneity in altruism, ρ.Footnote 12 In the neighborhood of the maximum (assuming an interior solution), second-order conditions can be shown to yieldFootnote 13
The result is intuitive: immigrants self-select on altruism and altruistic couples prefer more children, implying positive selection of immigrants in fertility. Thus heterogeneity in altruism and self-selection combine to generate a positive correlation between fertility and the decision to migrate.Footnote 14
The prediction that emigrants have higher fertility than those who choose not to emigrate comes with two caveats. First, not all emigrants are self-selected. In particular, with low enough migration costs (or high enough returns) everyone will choose to migrate, regardless of ρ. Second, in a more general model that allows for other forms of saving or for investment in child quality that positive correlation can be dampened or reversed, depending on the returns to investments in quality, number of children, and migration.Footnote 15 Our intention is not to argue that immigrants necessarily have higher fertility than families choosing not to migrate, but rather to point out that self-selection on intergenerational altruism (or taste for children, in footnote 14) links migration and fertility decisions. That link motivates our empirical analysis.
3. The institution: high and low cost waves of East Block migration
Changes in emigration policy in the Soviet Union allow us to compare immigrants to Israel in high and low migration cost regimes. In that sense they provide a “natural experiment” (i.e., a plausibly exogenous source of variation) to study how migration costs affect self-selection on fertility. Figure 2 illustrates the time series of immigration to Israel from the (former) Soviet Union from 1960 through 1996. This is voluntary migration. It occurred in spurts, responding to changes in the home country policy toward migration on the one hand and changes in the perceived risk of staying, on the other. Over time, Israel became a more attractive destination, as per capita income surpassed that in the Soviet Union and her security stabilized. Exit permits began to be granted in significant numbers in the early 1970s. From 1982 until 1989 the flow of immigrants shifted to the United States, which temporarily expanded its definition of refugee status to include Soviet Jews. In late-1989, the post-Soviet Commonwealth of Independent States (CIS), conducted a major policy shift, removing restrictions and allowing free migration of Jews to Israel, whereas the United States reduced access (refusing refugee requests). That sudden policy shift resulted in the surge of emigration to Israel which Figure 2 illustrates, beginning in 1990.
(a) Adult immigrants from former USSR: 1945–1996. (b) Adult immigrants from Eastern Europe: 1945–1996. Note: The figures represent the distribution of arrival years for immigrants aged 25 and over in 1996. Eastern Europe includes the former Soviet Union, Poland, Romania, the former Yugoslavia, Bulgaria, Albania, and the former Czechoslovakia.
Source: Israel Labor Force Survey (1996).

It is important to stress that migration from the Soviet Union (and the other East Block countries) before 1989 was a fairly expensive venture: an applicant's right to work was often suspended; fees were imposed; imprisonment, or even exile to Siberia were possible [Rosenstein (Reference Rosenstein2018), p. 413]. In contrast, migration to Israel since 1989 has been much easier: restrictions in the countries of origin were eased, immigrants experienced surprisingly rapid economic assimilation in Israel [Friedberg (Reference Friedberg2000)]. Cultural assimilation might have also been eased for the late arrivals by the presence of earlier arrival cohorts, though not necessarily: earlier immigrant cohorts were more likely to share a language, Yiddish, with Ashkenazi Jews in Israel.
3.1 Data
The Israel Labor Force Survey (LFS) randomly samples approximately 22,000 households per year, surveying household members aged 15 and older to generate about 100,000 annual observations. We pool LFS incoming survey cohorts (migrants and natives) from 1974 through 1996 to generate 32,308 observations of Eastern European immigrants for analysis. Our measure of fertility is the number of children currently at home, which is available in the LFS by grouped age category, as we explain below.
4. Migration and selection: Eastern European migration to Israel
Conceptually, we are interested in two separate effects on the fertility of immigrants. The first is the “treatment” effect of spending time in the destination country. The second is the effect of self-selection of people with high planned fertility into immigration. The framework above predicts that self-selection on high planned fertility will be stronger the higher the cost of migration: when the net return to migration is low only the very altruistic will choose to migrate.
We turn first to identifying separate treatment and selection effects, then to estimation results, and then discuss alternative possible explanations for selection.
In this section, we use two different methods to separately identify treatment and self-selection. The first deploys a simple difference in difference design, contrasting early to late arrivals and young to older cohorts, including cohorts of women who arrived too old to have children in Israel to identify the selection effect. The second method estimates the treatment effect as a function of time in Israel and fertile years in Israel (and identifying the selection effect as the complement) to allow for treatment intensity.
To illustrate our first identification strategy, and the necessary assumptions, consider a concrete example, using a 1950 birth cohort with arrival cohorts in 1980 and 1990. The 1980 arrival cohort faces high costs whereas the 1990 cohort faces low costs, so the model predicts higher intergenerational altruism for the early arrivals. Some women born in 1950 immigrate early, at age 30, in 1980. The rest arrive late, at age 40, in 1990. The difference in their observed fertility at age 40, in 1990 is

That difference can include both a treatment effect of 10 years residence in Israel during their (fertile) thirties and a selection effect due to differing costs of migration.
Now consider the older, 1940, cohort who migrated in the same two periods, some at age 40 in 1980 and others at age 50 in 1990. These women could not have experienced a treatment effect, as they were essentially past their fertility window in 1980 before arriving in Israel. Differences in the fertility of these two groups would be due only to selection and can be measured by
Now assuming that the selection effect is the same for the young and old cohorts, we can identify the treatment effect by “differences in differences” as (1) − (2).
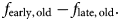
Unfortunately, the data do not quite allow this method, as the late, old group (arrived in 1990, born in 1940) is not observed until arrival at age 50, by which time we have a very poor measure of their fertility. (Below we explain our use of children currently at home as a fertility measure.) Fortunately, Russian (urban) fertility during this period is apparently stable across birth cohorts. If we assume that fertility of late arrivals is the same for young and old

we can identify both treatment and selection effects. We offer evidence below to support that assumption, showing that fertility rates were stable for these cohorts in Russia.
Restated as an estimating equation,

Here β is the effect of selection. The parameter δ is the treatment effect of spending a fertile period in Israel (i.e., the effect that would have been observed had early migration been randomly assigned among eventual immigrants). Both can be identified if the birth cohort effect, γ, is assumed to be zero, as in assumption (3).
To increase precision we will define early and late arrivals and young and old women more broadly than in this example. Early arrivals immigrate by 1982. Late arrivals immigrate between 1989 and 1996. We ignore the few immigrants in the 1983–88 period to avoid the possible confounding effects of selection between the United States and Israel as destinations. Young women are born in 1948–52. Old are born in 1938–42.
To separate the gap in children at home into treatment and selection effects we adopt an alternative to the simple old/young classification above. Treatment effects are posited to be a monotonic function of years since migration and of fertile years since migration,

Years since migration, y, capture the effects of assimilation of local culture, increased lifetime income and access to higher wages through accumulation of local human capital, such as language. Fertile, or childbearing, years since migration, h, are measured as the number of years between ages 17 and 42 spent in Israel. (At these ages the birth rate exceeds 1% for the early arrival cohort.) It should capture the (treatment) effect of local prices, wages, and other environmental conditions on childbearing decisions during the years at which a woman is most at risk of having children. It seems plausible that these effects will be monotonic.
Fertility is then estimated as

In the second term, β measures the effect of early migration on children at home, conditional on treatment, which we interpret as selection on altruism, through ρ. The third term is the treatment effect of residence in Israel on immigrant fertility. X is a matrix of demographic characteristics, including decade of birth and country of origin. All these can be identified using repeated cross-sections assuming no year (of observation) effects, which is plausible since we count a stock of children generally born in other years.
4.1 Measuring fertility
The LFS allows us to draw large samples of immigrants from different cohorts, but unfortunately does not ask how many births a woman has had in her lifetime. The survey does ask how many children a woman has currently at home between the ages of 0 and 17, with subcategories for 0–1, 2–4, 5–9, 10–14, and 15–17 (10–13 and 14–17 before 1987).Footnote 16, Footnote 17 Children aged 18 and older are not reported as they are usually in the military. The age of persons aged 18–24 is suppressed.
To estimate lifetime fertility we use the distribution of children aged 0–17 currently at home. Let f(a) be the number of children (so far), for a woman of age a. Let g(a) be the number of children aged 0–17 at home, which we can measure. Assume that the youngest age of mothers at first birth is 16 (there are very few at age 15 in the sample), so that children begin to outgrow our measurement when their mother is 34. Therefore


We approximate g(a − 18) by using information from the closest birth cohort available for women aged 34 and over, calculate its mean and add it to the reported number of children aged 0–17 to approximate f(a).Footnote 18
Figure 3 illustrates this procedure, graphing the means of observed number of children and predicted children f(a) for East Block immigrants aged 25 and older. f(a) should increase monotonically, but actually decreases sometimes, mostly due to difficulty distributing children to ages within age brackets. Fertility levels off at around age 38 at 97% of its eventual level. The slight drop after age 40 reflects a weakness in the procedure, which may be due to a small cohort effect in fertility or simply to measurement error. We exploit that flat portion of the distribution and use the predicted number of children at ages 38–47 to estimate lifetime fertility.
Estimated fertility using children at home. Note: Children at home are aged 0–17. “Children” is estimated for mothers aged 33 and older by adding their observed children at home to an estimate of unobserved children based on observed children at home for younger mothers. See section 4.1 for details.
Source: Israel Labor Force Survey (1974–1996).

4.2 Results—differences in differences
Table 1 compares descriptive statistics for early and late arrivals from the former Soviet Union, both young and old. Women in the “young” group were born, on average, in 1950. The average early arrival dated 1977–78, whereas the average late arrival was in 1990. In this table we have restricted attention to arrivals from the former Soviet Union to allow comparability with the “late” migration, which is 98% Soviet.Footnote 19
Characteristics of late and early arrivals (women aged 38–47 born in former Soviet Union, observed in Israel)

Source: Israel Labor Force Survey micro data 1974–96. Sample includes immigrant women from the former U.S.S.R.
Weighted with sampling weights.
a Based on 132 observations.
The table allows us to illustrate restricted differences in differences estimator. The difference in predicted children between early, young immigrants and late, old is

This large 0.75 child difference in fertility between arrival cohorts potentially includes both treatment and selection effects. Assuming no cohort effect on fertility in the Soviet Union for these birth cohorts [equation (3)], we can isolate the selection effect by comparing the fertility of old, early arrivals (assuming that they arrived too old to have a treatment effect) to that of old, late arrivals:

This is a very large selection effect. Almost the entire 0.75 child difference in fertility by arrival cohort is due to self-selection. The difference between these two yields an estimated treatment effect of

which is quite small.
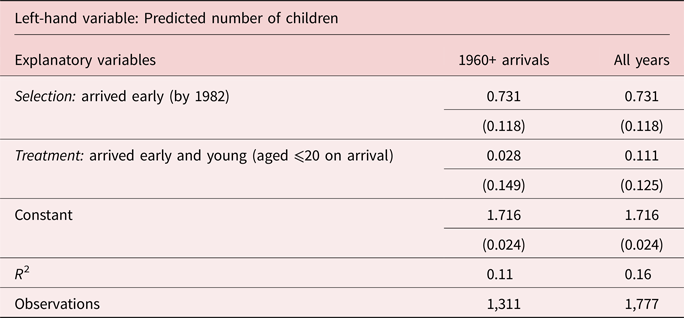
Table 2 reports that analysis in the regression format of equation (4), allowing us to include standard errors. In the first column of results, for post-1960 arrivals, the selection effect of 0.73 children is estimated with a standard error of 0.12, which is enough precision to dramatically reject the hypothesis of no selection. The column to the right reports the result of allowing for earlier arrival cohorts (dating back to 1955), which has no effect on this estimate. The estimated treatment effect is positive but statistically zero in both samples. [Our statistical testing throughout the paper is robust to clustering standard errors by country of origin × decade of birth (36 clusters), or republic of origin × decade of birth (104 clusters) when available.]
Treatment and selection effects on fertility (post-1989 Soviet immigrants compared with pre-1982 immigrants)
Source: See Table 1 for a description of the sample.
Note: Estimating equation (4) is described in text. Intercept reflects fertility of women who arrived between 1989 and 1996 aged 38 or more on arrival. Identification requires assuming that the main effect of being a member of the “young” birth cohort is zero, following the discussion of equation (3) in text. Heteroskedasticity-consistent standard errors in parentheses. All specifications weighted using sampling weights.
The selection effect is quite large. A 0.7 child difference exceeds the difference between the TFR of the United States (1.77) and the European average (1.6).Footnote 20 For societies with TFRs in the neighborhood of the replacement rate of two, that selection effect is enough to make the difference between stable and rapidly shrinking population in the long run.
Are there other observable differences between arrival cohorts in Table 1 that could account for differences in fertility? Note that in comparing cohorts the usual “natural” experiment practice of arguing that the treatment and comparison groups should have similar observable characteristics does not apply. The estimated selection effect could not have occurred under random assignment of early migration, by construction. Earlier arrival cohorts are more likely to be (self-classified as) Jewish, more likely to be married, less educated (by about 1.5 years for the later birth years), and slightly more likely to be Ultra-Orthodox. All of these differences are associated with higher fertility for the earlier arrival cohort, but are unlikely to be the cause of the gap in fertility. The differences are either too small to explain the large difference in fertility (in the case of education, Ultra-Orthodoxy, or Jewish) or more likely to reflect a higher preference for children (more currently married and fewer years of education).
These estimates rely on the assumption that there was no cohort effect in Soviet Jewish fertility for 38–47 year olds between the pre-82 and post-88 periods [i.e., that γ = 0 in equation (4)]. To investigate that assumption we examine cohort-specific fertility for urban Russians. We think of them as a proxy for Soviet Jews, who were mostly urban and highly assimilated into (officially secular) Soviet culture. Table 3 reports observed fertility for urban Russians in both 1982 and 1992. Reported is the number of children born so far for cohorts aged 35–39 and 40–44.Footnote 21 Reading across rows reveals that fertility was stable for these cohorts from the late-70s to early-90s at 1.9–2.0 children per woman.Footnote 22 The fertility rate of urban Russians in 1992 is similar to that of Jews of the same age immigrating from the CIS in 1989–96. We read this as evidence supporting the assumption that there was no cohort specific decline in fertility in the 1980s for Soviet Jews.
Observed fertility of urban Russians (children per woman through reported age)
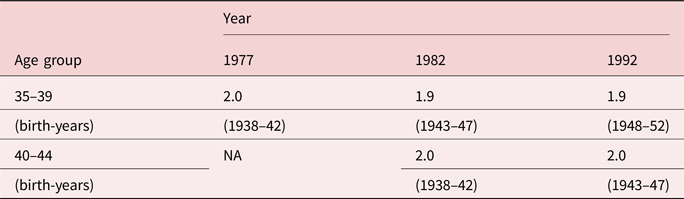
Authors' calculation of observed fertility for synthetic cohorts. Based on age-specific fertility rates reported at 5-year intervals, beginning at ages 15–19 in Vishnevsky (Reference Vishnevsky, DaVanzo and Farnsworth1996), Figure 1.1. For example, 1982 figure for 35–39 year-olds calculated by adding age specific fertility recorded in 1962, 1967, 1972, 1977, and 1982.
Overall, this method provides strong evidence of large selection effects in fertility by arrival cohorts of immigrants. High cost immigrants have between 0.76 and 0.84 more children in this sample and most of that difference is due to self-selection.
4.3 Predicting fertility using mothers of all ages: an alternative approach
An alternative to predicting eventual fertility using current children at home is to estimate fertility using children at home for mothers of different ages. This method allows us to use additional observations from younger women that will add precision, free us of assumptions about cohort effects, and estimate effects of treatment intensity (using years since migration, and an estimate of fertile years since migration). We will spend some of that additional precision on age and geographic indicators.
Figure 4 illustrates the difference in children at home between early and late arrival cohorts from all East Block countries, by age, pooling observations across 23 years of data. Early arrivals have more children at almost all ages. Averaged over ages, the gap is 0.376 children.
Children at home by arrival cohort. Note: Children at home are aged 0–17, so they underestimate lifetime fertility. “Early” (high cost) cohorts arrive by 1982. “Late” (low cost) cohorts arrive beginning in 1989. Immigrants from the former USSR, Poland, Romania, the former Yugoslavia, Bulgaria, Albania, and the former Czechoslovakia.
Source: Israel Labor Force Survey (1974–1996).

To interpret that gap and the results that follow we require a way to recalibrate, by using observed children at home to predict lifetime fertility. We use the identity

where g(a) is the count of children at home at mother's age a, p(a) is the sample probability that the average child will be at home at maternal age a, and f is lifetime fertility.
Summing over all ages, $\sum\nolimits_a {p\lpar a \rpar = d}$ , where d is the average duration of residence at home for children. Therefore, summing the identity over ages and dividing by duration, lifetime fertility can be calculated as

We observe g in most sample years only for women aged 25 and older, but know that 92.6% of the stock of children-years at home is spent with mothers aged 25–60.Footnote 23 Assuming that children spend all 18 initial years of life at home (of which we observe 92.6%) over the 36 years between 25 and 60 (inclusive) we can convert the average number of children at home into an estimate of lifetime fertility:

Therefore, a 0.376 child gap in children at home, g (which represents an average across ages), translates into an estimated gap of 0.376 × 2.16 = 0.812 lifetime children. This figure is reassuringly close to the estimated difference in predicted lifetime children between early and late arrival cohorts (0.84 = 0.73 + 0.11) reported in Table 2 (rightmost column) for immigrants from the former Soviet Union only in our simple difference in difference estimate.
Using this prediction method for lifetime fertility, f, allows us to use data from mothers at all ages (over 25), greatly increasing precision. It also allows controls for birth cohorts and country (or even republic) of birth, freeing us of the identifying assumptions above.
4.4 Estimation results
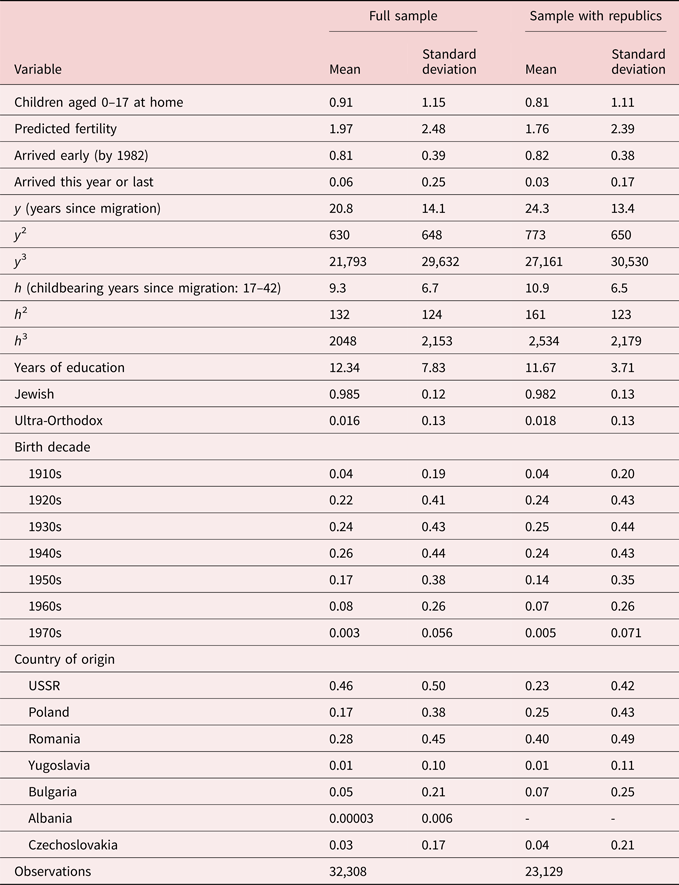
Table 4 reports descriptive statistics for the data available for this exercise. Columns labeled “full sample” describe a sample of 32,308 observations of women aged 25–42 years old, from the LFS, of which 81% arrived in the early (high cost) period.Footnote 24 These women average 0.91 children at home, which corresponds to predicted fertility of 1.97 lifetime children, using the method described in the previous section. Six percent of immigrants are sampled in the year of arrival or in the following year. The population of immigrants displays considerable variance in age and in country of origin. Fully 46% of arrivals are from the former Soviet Union, 17% from Poland and 28% from Romania. Birth cohorts date back to the 1910s, but some are as recent as the 1970s. Since birth cohorts and country of origin could predict fertility and be correlated with arrival time, it will be important to include these as covariates in estimation.
Summary statistics for predicting fertility
Source: Israel Labor Force Survey (1974–1996).
Children at home are “own children” aged 0–17, living at home, for women aged 25–42. In 1974–79 “own children” is not reported, but children in household is reported instead. For that period “own children” is predicted using the coefficient estimated from regression of “own children” on household children in the later period (a = −0.008, b = 0.98, R 2 = 0.96.) Predicted fertility is calculated by multiplying the variable children at home by 2.16, as discussed in section 4.3. Weighted using sampling weights. The LFS has a—2 quarter in, 2 quarter out, 2 quarter in—rotation group structure. The “full sample” includes all households once, resulting in an oversampling of the initial survey year, 1974, and draws incoming rotations for 1975–1996. Full sample has 32,134 nonmissing observations of the schooling variable, and 20,786 of the Ultra-Orthodox indicator. The sample with republic information has the same structure but includes only survey years 1995 and 1996 for immigrants from USSR, and oversamples 1995 (when republic information is available) while not sampling survey year 1994 and the fourth quarter of 1993 to include households only once. It has 22,897 nonmissing observations of schooling and 14,171 of Ultra-Orthodox.
The right two columns report on a sample available only in survey years 1995 and 1996, which includes information on republic of origin within the former Soviet Union. That smaller sample includes only 23,129 observations of women aged 25–42, as it excludes observations of immigrants from the Soviet Union in previous sample years. As the table reports, the smaller sample differs in coming disproportionately from Romania and Poland, rather than from the former Soviet Union. Women in the smaller sample, on average, have been in Israel 3.5 years longer (24.3 years since migration, rather than 20.8). In that sample women average 0.81 children at home, which predicts lifetime fertility of 1.76 children.
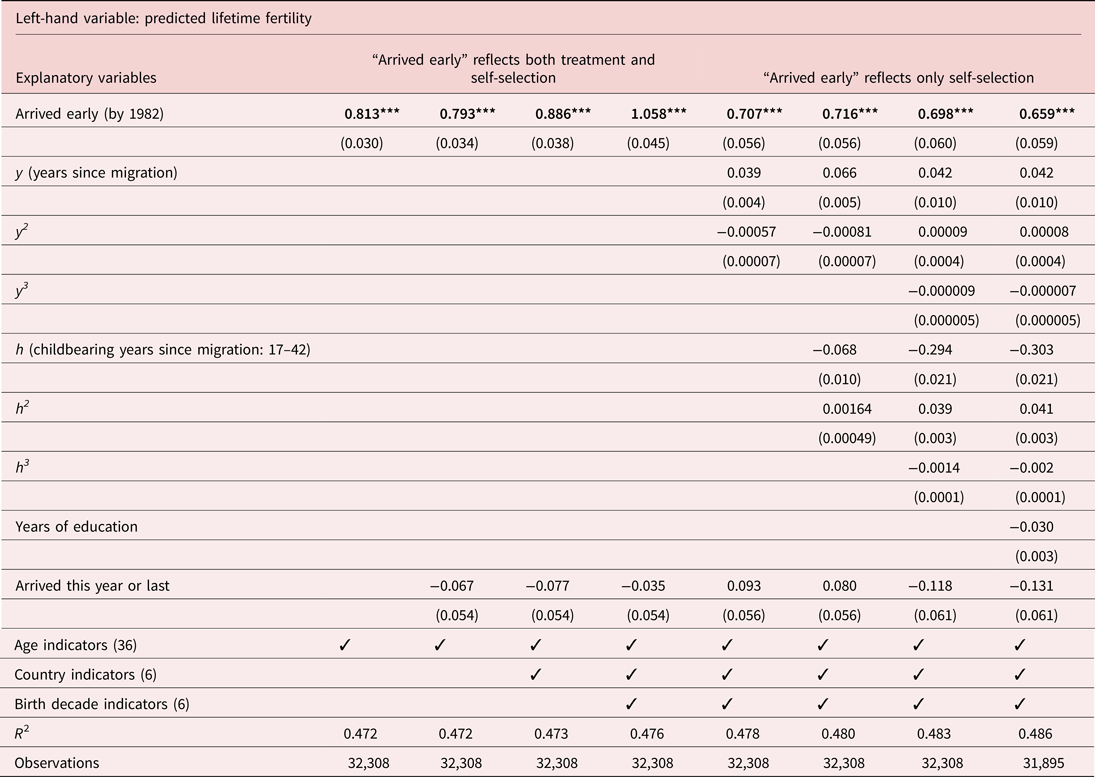
Table 5 reports the results of estimating the effect of early arrival on fertility in equation (5), using the predicted lifetime fertility. The left four columns report the coefficient on the “early” arrival indicator for the high migration cost era (arrival by 1982) which reflects both treatment and selection effects. Age effects on “children at home” are estimated nonparametrically using a full set of age indicators for g(a). The age-adjusted coefficient on early arrival, reported in the leftmost column of results, is 0.813 children. That estimate is statistically the same as the simpler differences in differences estimate of Table 2 (0.842, adding estimated selection and treatment effects in the rightmost column). Recall that the estimate in Table 2 draws on a much smaller sample, as it uses only emigrants from the Soviet Union and restricts the “young” arrivals to women aged less than 20 years old on arrival.
Treatment and selection effects on fertility
Source: Israel Labor Force Survey (1974–1996). Includes all observations in 1974 and incoming rotations in other years. See note to Table 4 for a description of sample.
Note: The left-hand variable is predicted lifetime fertility, constructed by multiplying children at home by 2.16 (as explained in section 4.3). The seven birth decades are 1910s through 1970s. The seven country groups are USSR, Poland, Romania, Yugoslavia, Bulgaria, Albania, and Czechoslovakia.
Heteroskedasticity-consistent standard errors in parentheses. * Significant at 10% ** Significant at 5% *** Significant at 1%. All specifications weighted using sampling weights.
The following column adds an indicator for arrival in the year of observation or in the previous year, to allow for a possible “impact” effect of transition on fertility. The literature has reported a propensity of immigrants to delay childbirth till after they settle in the new country [Blau (Reference Blau, Borjas and Freeman1992)]. If ignored, that transition effect could potentially bias our estimates, as late arrivals are disproportionately sampled soon after arrival. Estimated transition effects are generally negative, as expected, but very small. Their inclusion has little effect on the estimated early arrival effect, reducing it slightly to 0.793.
Additionally allowing for country of origin and birth cohort only increases the estimated fertility advantage of early arrivals, as they tend to come from relatively low fertility countries and relatively low fertility birth cohorts (third and fourth columns). Thus the age, country, and birth-cohort controlled estimate of the early-late arrival gap in fertility is 1.058 lifetime children. This is our preferred estimate of the combined treatment and selection effects, as it allows for cohort and country of origin effects, is fairly robust, and is based on a larger sample of immigrant women, compared to the estimate in Table 2. At 1.058 children, that estimate is quite large relative to the current Israeli TFR of 3.11.
4.5 Selection vs. treatment
The next three columns report the decomposition of the fertility gap between early and late arrivals, 1.058 children, into selection and treatment effects, using years since migration, y, and childbearing years since migration, h, to represent treatment. Years since migration is the most important predictor, with a large and concave relationship to fertility, accounting for a third of the difference in fertility by itself (column 5), leaving an estimated selection coefficient of 0.707 children. Once years since migration are accounted for, including childbearing years since migration turn out to yield a small further omitted variable bias on the early arrival coefficient (column 6), increasing it slightly to 0.716 children. These results are essentially unchanged by adding quartic terms in years since migration and childbearing years since migration, yielding a selection coefficient of 0.698 children and a treatment effect of (1.058 − 0.698 = ) 0.360 children.
Given the important role of female human capital accumulation in childbearing decisions, the differential net return to education in the country of origin and Israel may create an additional treatment effect, which would argue for including mother's education as an additional covariate. Yet, the ease of intergenerational transmission of human capital would incentivize education particularly among altruistic families, which would argue for education reflecting selection rather than treatment. The rightmost column includes mother's education, finding that doing so reduces the estimated selection effect slightly, to 0.659, which we may view as an underestimate, given the potential for education reflecting selection rather than the treatment effect of time in Israel.
In summary, Table 5 provides clear evidence of both large selection and treatment effects of migration on fertility, both significantly different from zero. Selection is about twice as important as treatment, even controlling for country of origin. In terms of lifetime children, these results, which are quite robust, can be interpreted as follows: migration is associated with just over one child of additional lifetime fertility for Jewish women migrating from the former East Block (i.e., the former Soviet Union and Eastern Europe). Of that additional fertility, about two-thirds is due to selection into migration of women who were predisposed to have higher fertility, as predicted by selection on intergenerational altruism, and one-third is a treatment effect of migration to Israel.
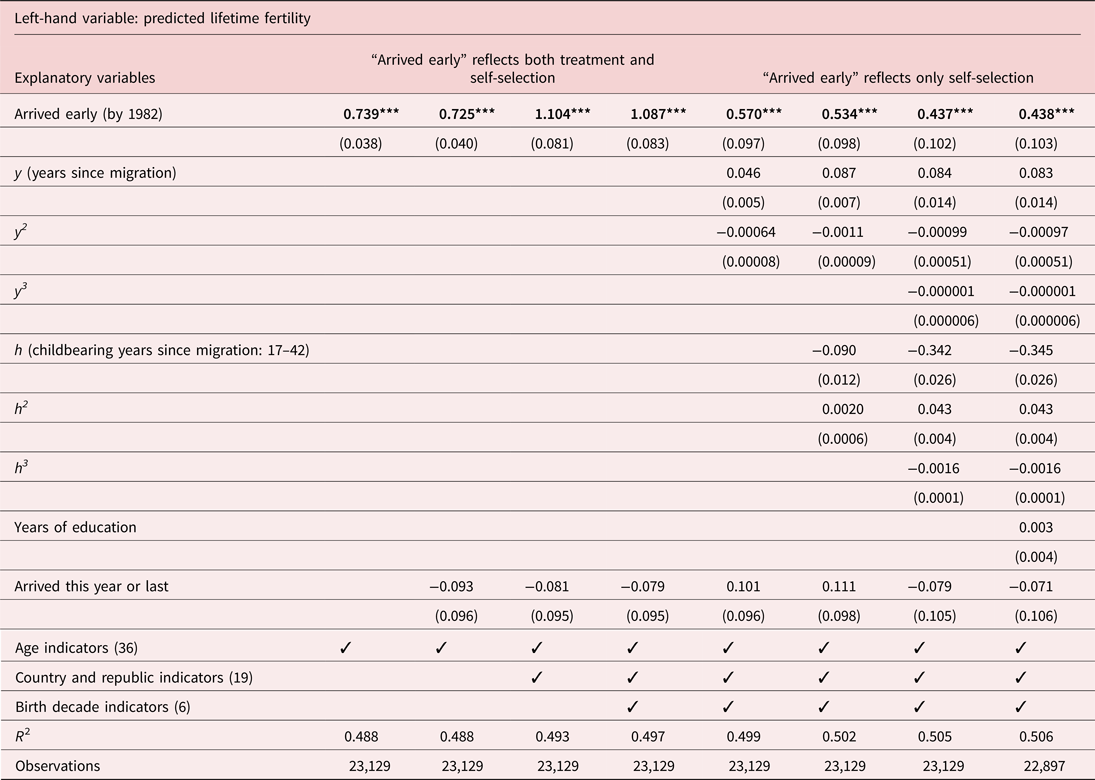
As a robustness check, we also examine a smaller sample with additional information about Republic of origin within the Soviet Union. The former Soviet Union included Russia and 12 republics, including central Asian republics that tend to high fertility and European republics with lower fertility. The 1995 and 1996 LFS identify each, allowing us to control for potential biases due to a shift of migration from high to low fertility republics over time. Table 6 reports estimates of equation (5) using only the 1995 and 1996 data for the USSR and Poland, though including all survey years for other countries. (A full list of republics is included in the note to Table 6.) Summary statistics for these data are reported in the right panel of Table 4.
Treatment and selection effects on fertility including Republic effects
Source: Israel Labor Force Survey (1974–1996). See note to Table 4 for a description of sample.
Note: The left-hand variable is predicted lifetime fertility, constructed by multiplying children at home by 2.16 (as explained in section 4.3). Seven birth decades are 1910s through 1970s. The six country groups are USSR, Poland, Romania, Yugoslavia, Bulgaria, and Czechoslovakia. The 13 republics are Lithuania, Latvia, Estonia, Belorussia, Ukraine, Russia, Moldavia, Azerbaijan, Kazakhstan, Turkmenistan, Tajikistan, Uzbekistan, and Kirgizstan.
Heteroskedasticity-consistent standard errors in parentheses. * Significant at 10% ** Significant at 5% *** Significant at 1%. All specifications weighted using sampling weights.
The first four columns of Table 6 report adjusted coefficients on “early” for the subsample of data with information on Soviet republics. Once adjusted for age, transition effects of early arrival, place of origin, and birth cohort, the coefficient on early arrival rises to 1.087 children, slightly more than in the larger sample. In this subsample, estimated selection effects are smaller and less robust, ranging from 0.570 children (52%) and 0.437 (40%), though they are statistically indistinguishable. Adding mother's years of education as a covariate (in the rightmost column) increases the estimated selection effect only slightly, to 0.438.
The difference in the effects of years since migration between the two samples seems to be due to the exclusion of early Soviet immigrants (for whom we lack information on republics) rather than to omit variable bias in republics of origin. It may be that either treatment or selection work somewhat differently for more recent Soviet immigrants than for previous cohorts.
To summarize the estimation results across methods and samples, Tables 2, 5, and 6 consistently reveal large, statistically significant estimates of lifetime fertility associated with migration of women from the East Block to Israel, ranging from 0.75 to 1.09 children. Decomposing those into self-selection and treatment effects, the self-selection component ranges from 40% of the high fertility estimate (0.44 children in Table 6) to 98% of a low estimate (0.73 children in Table 2). Although the two methods disagree on the size of the treatment effect, we are more convinced by those in Tables 5 and 6 as they allow a much richer set of controls and require less restrictive assumptions. If the early/late gap could be properly adjusted for age and origin controls the (noisy) estimates of treatment effects in Table 2 may not be statistically smaller than those in Tables 5 and 6. We conclude that the age and origin-adjusted fertility gap between high and low migration cost arrival cohorts is extremely large, likely more than a child, of which at least half is due to selection and the rest to treatment. This large selection effect is consistent with the hypothesis that immigrants self-select on intergenerational altruism.
4.6 Alternative explanations for selection on fertility
Self-selection of migrants on fertility may have explanations other than intergenerational altruism, some of which we can explore with data. One possible explanation is cultural preservation, which may well be salient for cohorts whose parents were faced both the threat of annihilation by Nazis and forced secularization by Soviets. One could think of that as a particular type of other-regarding behavior both for future generations of one's own family and of other Jewish families. Therefore, it could be consistent with a preference for high fertility, assuming that the progeny will share the preservation motive. Heterogeneity in a desire for cultural preservation seems plausible, as would a stronger desire to avoid forced assimilation in the Soviet Union among earlier cohorts of immigrants, even in the absence of greater intergenerational altruism. That would provide an alternative explanation for our findings.
Another possible explanation is religiosity, following a well-established pattern of high fertility among stricter denominations, which is particularly evident among Ultra-Orthodox (Haredi) Jews [Eaton and Mayer (Reference Eaton and Mayer1953), Berman (Reference Berman2000)]. Given active suppression of religious life during the Soviet period, Jews with high levels of religiosity might have constituted a disproportionate number of early migrants, providing an additional alternative explanation for the self-selection of high fertility families into early migration evident in Tables 2, 5, and 6, even in the absence of differential intergenerational altruism among the early immigrants.
The Israel LFS provides some information on both religious identification and religiosity. The self-reported religion of the head of household is recorded for each woman in the data. As reported in Table 1 (for the restricted sample), all early arrivals self-identify as Jewish (heads of household), whereas only 93% of the later arrivals do. For the larger sample Table 4 reports that 98.5% live in households in which the head self-identifies as Jewish. We note that Jewish has many possible interpretations for Israelis, the respondent could be thinking of a national, ethnic, cultural, or religious identity.
Our religiosity measure is indirectly obtained. The LFS asks the type of last school attended for men. Households were any man answers “Yeshiva” we classify as Ultra-Orthodox, following Berman and Klinov (Reference Berman and Klinov1997) and Berman (Reference Berman2000), who validate this measure. That survey question appeared in 1979, so that we can measure religiosity using it only since then. Table 4 reports that 1.6% of our full sample of immigrants are classified as Ultra-Orthodox.
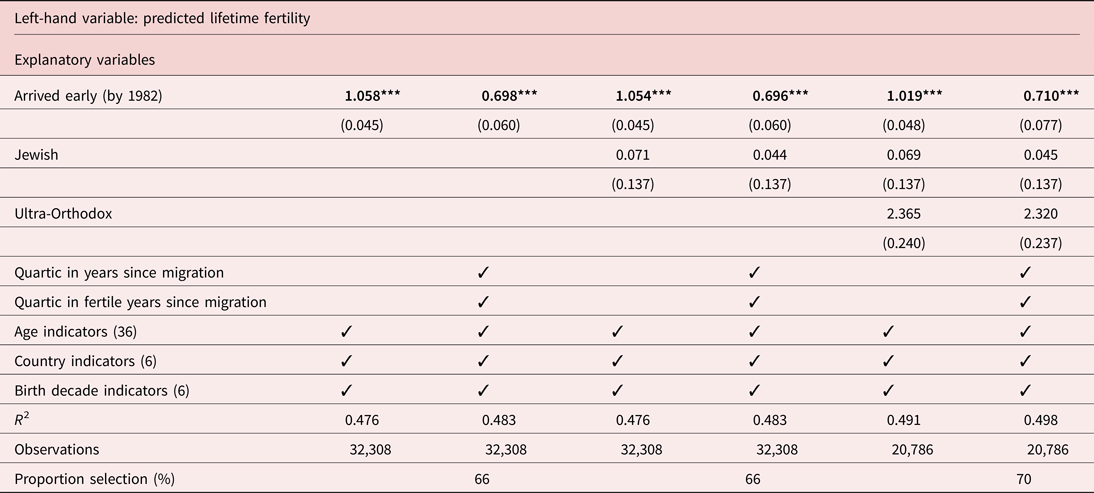
Table 7 reports the robustness of the estimated selection and treatment effects in Table 5 to including measures of Jewish identification and Ultra-Orthodox religious practice. The two leftmost columns replicate columns 4 and 7 of Table 5 (our preferred specification with a full set of age, country, and birth decade controls), in which the selection effect of 0.698 children constitutes 66% (= 0.698/1.058) of the differential in fertility.
Jewish self-identification and Ultra-Orthodoxy
Source: Israel Labor Force Survey 1974–1996. Includes all observations in 1974 and incoming rotations in other years.
Note: See note to Table 4 for a description of sample. The left-hand variable is predicted lifetime fertility, constructed by multiplying children at home by 2.16 (as explained in section 4.3). All specifications include an indicator for arrival this year or last. Ultra-Orthodox is an indicator of whether any male in the household reports last school attended as Yeshiva. See Berman (Reference Berman2000) for details. Since that variable is reported only from 1979 onward, the sample size shrinks in the right two columns. Seven birth decades are 1910s through 1970s. The seven country groups are USSR, Poland, Romania, Yugoslavia, Bulgaria, Albania, and Czechoslovakia. Heteroskedasticity-consistent standard errors in parentheses. * Significant at 10% ** Significant at 5% *** Significant at 1%. All specifications weighted using sampling weights. “Proportion selection” is the ratio of coefficients on the “early” indicator with and without “years since migration” covariates (e.g., 66% = 0.698/0.1058).
Moving to the right, the following two columns report the result of adding an indicator for Jewish self-identification, to test the cultural preservation hypothesis. Adding that indicator to the regression yields a small positive but statistically negligible coefficient on the “Jewish” indicator. For our purposes, the important insight is that the coefficients on early arrival hardly change at all, from 0.698 to 0.696 for the selection coefficient in column 4, and from 1.058 to 1.054 for the coefficient on early arrival (without allowing for selection). Therefore, although the test has low power due to the very small number of households identifying as not Jewish, it yields no evidence of omitted variable bias due to Jewish identification in estimating a selection effect.
The two rightmost columns introduce our religiosity measure, which identifies Ultra-Orthodox households. Remarkably, though this sample shrinks due to the loss of many early arrival cohorts (by over a third, to 20,786 observations), the coefficient on the early arrival is not much changed in column 5 (as compared to column 3), estimated at 1.019 children. The Ultra-Orthodox indicator yields a fairly precise indication of higher fertility, at 2.36 more children per woman.Footnote 25 The selection estimate, at 0.710 children, is also remarkably close to that estimated in the larger sample (in column 4), in the specification that includes both a Jewish indicator and an Ultra-Orthodox indicator. Therefore, controlling for religiosity hardly changes the proportion of the estimated early arrival effect assigned to selection, increasing it slightly to 70% (= 0.710/1.019).
Although these measures are incomplete, measuring only the extreme tails of the identification and religiosity distributions, they provide no evidence that the basic finding of Tables 5 and 6, self-selection on desired fertility, is due to religiosity or identification with being Jewish. We turn now to evidence from migrants facing lower migration costs, to probe intergenerational altruism among immigrants to the United States.
Finally, in considering evidence from Tables 2, 5, and 6, it is worth bearing in mind that many women who arrived young came as children whose parents made the migration decision. To the extent that these children were less altruistic than their parents (perhaps because of regression to the mean) our estimates would underestimate the true immigrant self-selection effect on fertility. Alternatively, if altruism (or other factors influencing fertility) were fully inherited this would not be a source of bias. We return to the implications of heritable altruism in conclusion below.
5. Altruism of immigrants: bequests and doting grandmothers in the United States
We have shown so far that self-selection by immigrants has a fertility effect, as predicted by the model, but have not provided any direct evidence that the mechanism is altruism. We can further test our approach by examining its implications for more direct indicators of intergenerational altruism. The U.S. Health and Retirement Study (HRS) provides two such indicators: attitudes about bequests and about time spent with grandchildren. The 1992 wave interviewed a representative sample of 7,600 persons aged 51–61 in 1992, and spouses (12,600 persons in all). It asked questions designed to analyze interrelationships between retirement, health, income, and wealth.Footnote 26
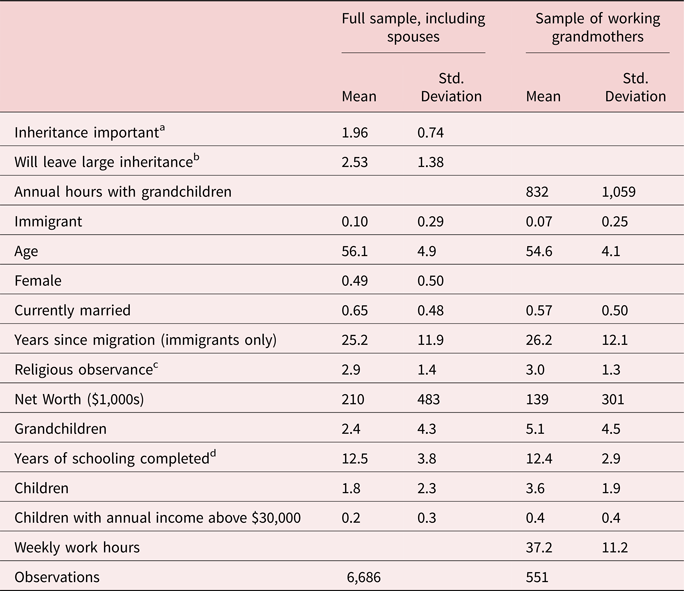
Table 8 reports descriptive statistics for our two measures of altruism and a set of possible predictors. The left panel reports means and standard deviations for the 6,686 observations for which the full set of variables are available. Respondents were asked to choose if leaving an inheritance was (1) “not important,” (2) “somewhat important,” or (3) “very important.” The mean is 1.96. A total of 10% of respondents are immigrants, 49% are women, and average net worth is $210,000. The right panel reports on the 551 working grandmothers who reported nonzero hours worked per week and answered all these questions. They averaged 832 annual hours with their grandchildren and 7% were immigrants.
Immigrants and indicators of altruism: descriptive statistics (U.S. HRS)
Source: U.S. Health and Retirement Survey (HRS), 1992 wave.
a “Inheritance important” is coded as 1—“not important,” 2—“somewhat important,” or 3—“very important.”.
b “Will leave large inheritance” coded from 1 to 5 in increasing inheritance. 6,709 observations.
c Religious observance is an index with values ranging from 1 to 5 in ascending order of observance.
d Years of schooling completed is recorded for years 0–16, with postgraduate study recorded as 20.
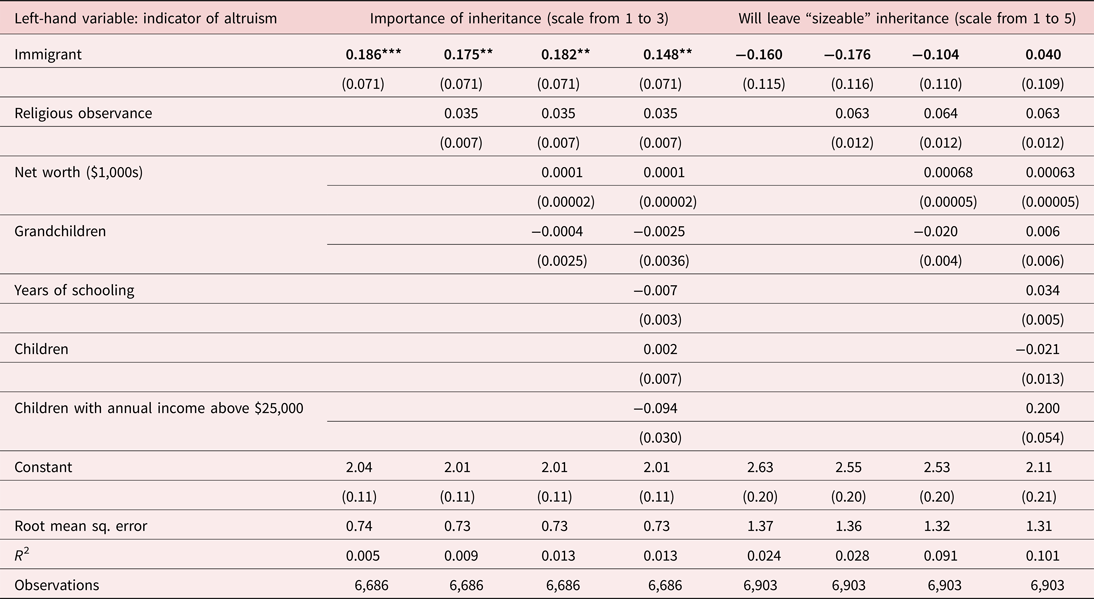
The left panel of Table 9 reports a linear regression of the bequest measure on a set of predictors, including an indicator of immigrant status. [All specifications include age, years since migration (zero for native born), and indicators of marital status and gender.] The first specification reports the estimated coefficient on the immigrant indicator, 0.186, which is statistically significant. To get an impression of the size of this effect, immigrant status predicts more altruism (according to this noisy measure) than does a shift from the lowest to the highest category of religious observance, reported in the second column.Footnote 27 Including measures of wealth, schooling, and the wealth of children does little to change the coefficient on immigrant status. It is also robust to including the number of children and grandchildren. Note that bequests are at best a flawed indicator of altruism, as altruists may make transfers in vivo. As such, the positive coefficients reported may underestimate the propensity of immigrants to make transfers to their children.
Predictors of altruism: inheritance (U.S. HRS)
Source: U.S. Health and Retirement Survey, 1992 wave. See Table 8 for descriptive statistics. All specifications include age, years since migration and indicators of marital status and gender. * Significant at 10% ** Significant at 5% *** Significant at 1%.
The HRS also asks individuals if they will leave a large inheritance. Answers are coded in the order of increasing inheritance from one to five. This is a problematic measure of intergenerational altruism as it will be influenced by wealth and children's anticipated wealth, which we do not fully observe. The model suggests that immigrant families will have faster asset accumulation across generations than others in both human and physical capital. Intergenerational consumption smoothing in that case may imply pecuniary transfers from children to parents rather than inheritance. Nevertheless, in the interests of full disclosure, the right panel of Table 9 reports similar regressions predicting the answer to the inheritance question. For comparability, these results are reported in the same format as those in the left panel. Though the coefficient on immigrant is negative in the leftmost column of the right panel, it becomes less so when net worth is included and becomes positive when a measure of children's wealth is included. Nowhere is it statistically significant.
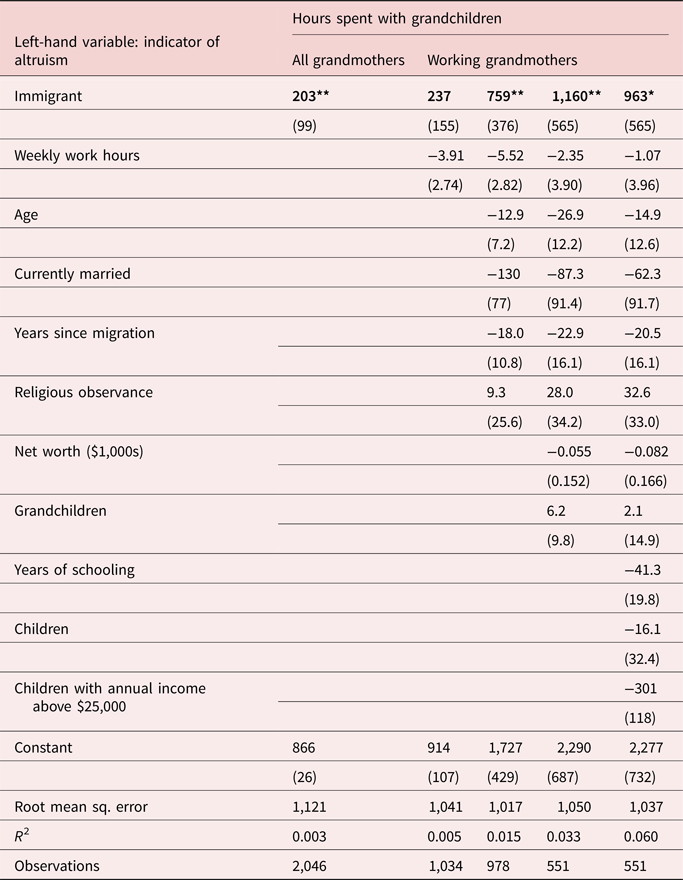
Table 10 reports on our favorite measure of altruism, the hours a grandmother spends with her grandchildren. The leftmost column reports that immigrant grandmothers average 203 more annual hours with grandchildren than do native grandmothers. That estimate is robust to conditioning on hours worked, for the subsample of grandmothers reporting work hours.
Predictors of altruism: time with grandchildren (U.S. HRS)
Source: HRS, 1992. See Table 8 for descriptive statistics. * Significant at 10% ** Significant at 5% *** Significant at 1%.
Adding age, marital status, and especially “years since migration” increases that estimate to 761 h a year more with grandchildren, which is reduced by 18 h in each year since migration. The years since migration coefficient is important, as a possible alternative explanation for immigrant grandmothers spending time with grandchildren is that they tend to live with their children in the first years after arrival. An 18-h reduction per year since migration implies that only after 40 years since arrival would the new immigrant living arrangement effect wear off, which is implausibly long. Accounting for net worth and grandchildren increases the estimate to 1,168 h per year (in the first year), whereas adding schooling, children, and especially children's wealth, reduces the estimate to 927 h per year. Schooling has a negative coefficient, perhaps reflecting higher shadow value of time. Children's wealth also has a negative coefficient, suggesting specialization within the family in child care. Overall, the table indicates that no matter what controls are used, immigrant grandmothers spend much more time with their grandchildren than do native grandmothers. Estimates in the first, third, and fourth columns are significantly positive at the 5% level.
An important shortcoming of these HRS results is that not all immigrants are self-selected. If the net present value of migration is high enough, even people with high discount rates will invest in migration. That may be the case for forced migration of refugees or migration under the reunification of families criteria, for example. That would allow inclusion of the high discount (low altruism) individuals that will tend to mute evidence of self-selection on altruism in the aggregate.
The evidence in Tables 9 and 10 cannot be interpreted as irrefutable proof that immigrants are disproportionately altruistic since we cannot rule out the possibility that some key variable has been omitted. Most reasonable candidates have been included, though, so we find these results to be highly suggestive. They are consistent with images of immigrant parents saving for their children and of immigrant mothers moving into college dormitories to cook and clean at exam time. This HRS evidence also complements the evidence of self-selection on fertility by immigrants, by offering more direct measures of intergenerational altruism.
6. Interpretation and conclusion
We have argued that intergenerational concerns are relevant to migration decisions and that heterogeneity in intergenerational altruism induces self-selection of immigrants on fertility, since both fertility and immigration are affected by altruism. Our estimates report large positive selection effects. The estimated selection effect, at half a child, is robust to controlling (as much as our data allow) for identifying as Jewish and for religiosity. The estimate more than explains the current fertility gap between the rapidly shrinking native born populations of Southern and Eastern Europe and the more stable native populations of immigrant-absorbing countries of the Western hemisphere and Australia. The selection on the altruism model is also supported by evidence that immigrants to the United States are more likely than natives to value inheritance and that immigrant grandmothers are more likely to spend time with their grandchildren.
The literature on immigrant fertility has pointed out that immigrants assimilate the fertility pattern of destination countries. Considering that Eastern European immigrants to Israel arrived with a very secular background, a fertility increase from 1.7 children to the two child fertility levels of nonreligious Jewish Israelis would be predicted by the assimilation model. This is roughly consistent with our estimated treatment effects, which range from 0.4 to 0.6 children in our preferred specifications. Self-selection implies overshooting [in the Chiswick (Reference Chiswick1978) sense] by the early immigrants, who migrated despite high costs. We find strong evidence of self-selection of immigrants on fertility, with estimates ranging from 0.44 to 0.73 children. These estimated selection effects are very large relative to current TFRs of women in high income countries, which are almost all below two children.
These estimated selection effects are large. To investigate their plausibility a reference point for comparison would be useful, though none suggests itself. We know of no estimates based on a selected subpopulation which responded to this unusual migration choice, which we can contrast to the behavior of individuals who did not respond. Comparing these results to those contrasting fertility of early participants in a migration wave to that of later participants might be a fruitful future research topic.Footnote 28 Surely cross-family variation in realized fertility is large, though seldom does part of that distribution self-select into migration.
If self-selection on altruism and intergenerational concerns are truly central to migration decisions then how can we explain the lack of overshooting reported in the rest of this literature? A possible explanation is that for immigrants to the United States countervailing effects are at play. First, there is evidence of positive selection on predictors of low fertility such as wealth and education [Blau (Reference Blau, Borjas and Freeman1992)]. Second, the transition also involves a large increase in women's wages. Jewish immigrants from the former East Block are for the most part not selected on education or wealth and experience a smaller increase in wages. Once those effects are muted, selection on altruism may become the dominant phenomenon.
Self-selection of immigrants on intergenerational altruism provides an alternative explanation for Chiswick's classic finding that earnings of immigrants rise over time to eventually overtake the earnings of natives [Chiswick (Reference Chiswick1978)]. Overtaking would also be a straightforward prediction of the Ben Porath human capital investment model [Ben Porath (Reference Ben Porath1967)] where investment is increasing in patience, if immigrants self-select on patience. Selection on altruism is also consistent with Borjas (Reference Borjas1987), which finds a positive correlation between the eventual income of individuals in the United States and average income in the country of origin (conditional on measured skills). The lower the net return to migration the greater the altruism (low discount rate) required to justify migration. The cohort of Soviets who immigrated to the United States during the high cost period of the 1980s also assimilated economically quite successfully [Chiswick (Reference Chiswick1993b)]. Conditions of migration matter that foster selection, as in the Roy model, may matter as much as country of origin.
Heterogeneity in intergenerational altruism has three important implications if that altruism is heritable in families.Footnote 29 First, since natural selection favors high fertility dynasties, their growing proportion in the population would increase aggregate fertility, as has long been recognized in evolutionary biology [Cavalli-Sforza et al. (Reference Cavalli-Sforza and Feldman1981)]. Whether more altruistic dynasties invest more in quantity or quality of children is ambiguous, though, as it depends on the net return to education, which is increasing [de la Croix (Reference de la Croix2013)].
A second implication of altruistic dynasties is that countries who received voluntary immigrants over the last century would have higher average levels of altruism therefore might have higher long-term fertility rates (holding income and the net return to education constant). This observation is consistent with the current gap between the TFRs of the United States (1.77) and the European Union (1.6).
Finally, in the Ramsey growth model a high level of intergenerational altruism implies more patient dynasties. In a conventional growth model with fixed population growth, that would imply greater income per capita in the steady state and faster convergence to steady state levels of per capita income.Footnote 30 Our results suggest that this should be true of countries who received voluntary immigrants over the last century, and is consistent with income levels above the OECD average for Australia, Canada, and especially the United States. Thus Solow convergence in per capita income across counties may be limited by differences in the distribution of altruism (patience) in national populations. Selective migration implies that the distribution of altruism is in turn due to historic differences in per capita income, which induced sorting of patient parents into higher-income locations. A small historical advantage in per-capita income could thus be amplified by self-selected altruistic immigrants to yield a permanent gap in income and perhaps also in population growth rates.
Acknowledgements
This paper was inspired by a conversation Berman had with his great uncle, the late Rafuel Grinspun, shortly after the latter migrated from the Soviet Union to Israel. We appreciate the helpful comments of Lawrence Katz, Kevin Lang, Shlomo Yitzhaki, and seminar participants at Boston University, the Hebrew University, Maryland, Yale, Michigan, MIT, UC San Diego, and an NBER Labor Studies session. We thank the Maurice Falk Institute, Jerusalem, for financial support, the expert editing of the late Maggie Eisenstadt, and data access through the Hebrew University Social Sciences Data Archive. Sameem Siddiqui provided excellent research assistance. We thank the editor and an anonymous referee for detailed and insightful suggestions. All mistakes are of course our own.
Appendix
Proof: Effects of Altruism on Fertility and Migration

such that m ⩾ 0, f ⩾ 0.
Substituting constraints into the utility function, couples choose (f, m) to solve


The first two second-order conditions of a maximum will always hold:


A third (second-order) condition,

where

is required (to eliminate saddle points).
That condition can be restated v ′(c 1)2 < (2/ρ)(f + 2)k 2v ′′(c 0)v ′′(c 1), by solving a quadratic. It requires that v(.) be sufficiently concave at the maximum. For instance, the function v(c) = ln(c) is sufficiently concave if k = c 0/2, for all 0 < ρ < 1 and f ⩾ 0.
To solve the comparative static effects of changing ρ, we use the following simplifying result:

and

so substituting from first-order conditions, Ufρ = kUmρ.
Applying Cramer's rule to the full derivatives of first-order conditions, we find positive effects of intergenerational altruism, ρ, on both f and m in the neighborhood of a maximum.


These are the results reported in section 2.
Note that if the additional assumption above were reversed, so would both comparative static derivatives. Thus our empirical test (section 4) is of the model with the additional assumption of the third second-order condition, Δ > 0.


 Open access