

One of the most prominent etiological models of depression is Beck's cognitive theory (Beck, Reference Beck1967, Reference Beck1987), which posits that depressogenic schemas confer vulnerability to depression. Beck defined the latent schemas as stored bodies of knowledge (i.e., mental representations of the self and prior experiences) that affect how the individual perceives, encodes, and retrieves information. Beck posited that depressogenic schemas are typically represented as sets of dysfunctional attitudes such as ‘If I fail at something, it means I'm a total failure’, or ‘I am nothing if a person I love doesn't like me’. Beck's cognitive theory proposes that dysfunctional schemas confer individual vulnerability to depression, especially in the occurrence of negative events. Moreover, dysfunctional schemas are presumed to endure beyond the depressive episode, representing stable vulnerability factors for depression onset and recurrence.
Beck's (Reference Beck1967, Reference Beck1987) theory is supported by earlier research in adults that demonstrates dysfunctional attitudes mainly or interacting with stress prospectively predicting an episode of major depression (Alloy et al., Reference Alloy, Abramson, Smith, Gibb and Neeren2006a; Otto et al., Reference Otto, Teachman, Cohen, Soares, Vitonis and Harlow2007) or increase in depressive symptoms (Brown et al., Reference Brown, Hammen, Craske and Wickens1995; Dykman & Johll, Reference Dykman and Johll1998). Subsequently, studies have provided evidence for the applicability of Beck's theory to adolescents (Abela & Hankin, Reference Abela and Hankin2008). More specifically, several prospective studies of Western samples have shown that adolescents who possess a high level of dysfunctional attitudes are more likely than other adolescents to experience increase in depressive symptoms or onset of clinical depression, especially following the occurrence of negative events (Abela & Skitch, Reference Abela and Skitch2007; Hankin, Reference Hankin2008a; Hankin et al., Reference Hankin, Wetter, Cheely and Oppenheimer2008; Lewinsohn et al., Reference Lewinsohn, Joiner and Rohde2001; Young et al., Reference Young, LaMontagne, Dietrich and Wells2012). Moreover, two recent studies of Chinese adolescents also reported that higher levels of dysfunctional attitudes were associated with greater increase in depressive symptoms following the occurrence of negative events (Abela et al., Reference Abela, Stolow, Mineka, Yao, Zhu and Hankin2011; Cui et al., Reference Cui, Shi and Oei2013). Despite the importance of dysfunctional attitudes in the development and maintenance of depression, little is known about the etiological origin of dysfunctional attitudes. Identifying these causes is an important step toward understanding and preventing depression.
Beck (Reference Beck1987) proposed that adverse experiences during childhood might contribute to the development of dysfunctional attitudes. Extant empirical studies that have examined causes of dysfunctional attitudes have mainly focused on social and interpersonal factors (Hankin et al., Reference Hankin, Oppenheimer, Jenness, Barrocas, Shapero and Goldband2009). More specifically, several studies have shown that emotional maltreatment (Gibb et al., Reference Gibb, Alloy and Abramson2003), verbal peer victimization (Gibb et al., Reference Gibb, Abramson and Alloy2004), negative feedback from parents (Alloy et al., Reference Alloy, Abramson, Whitehouse, Hogan, Panzarella and Rose2006b), and negative life events (Young et al., Reference Young, LaMontagne, Dietrich and Wells2012) are associated with a higher level of dysfunctional attitudes. Lee and Hankin (Reference Lee and Hankin2009) reported that dysfunctional attitudes mediate the association between insecure attachment and an increase in symptoms of depression and anxiety during adolescence.
An alternative explanation that has not received much attention is the role of genes. Several lines of evidence have already indicated the trait-like characteristics and genetic bases for dysfunctional attitudes. First, in a short-term prospective multi-wave study, Hankin (Reference Hankin2008b) showed that dysfunctional attitudes in early and middle adolescence exhibit moderate stability over time. Further study supported dysfunctional attitudes as a stable trait across late adolescence to early adulthood (Wang et al., Reference Wang, Halvorsen, Eisemann and Waterloo2010). Second, several high-risk studies demonstrated that a history of depression is associated with elevations in dysfunctional attitudes (Farmer et al., Reference Farmer, Harris, Redman, Mahmood, Sadler and McGuffin2001; Wang et al., Reference Wang, Halvorsen, Eisemann and Waterloo2010), even when sub-clinical depressive symptoms are controlled (Otto et al., Reference Otto, Teachman, Cohen, Soares, Vitonis and Harlow2007). Finally, the main or interactive effects of some specific genetic loci (e.g., BDNF Val66Met and 5-HTTLPR) are involved in dysfunctional attitudes (Wells et al., Reference Wells, Beevers and McGeary2010; Whisman et al., Reference Whisman, Johnson and Smolen2011). However, to date, no empirical studies have quantitatively assessed the magnitude of genetic influence on dysfunctional attitudes (i.e., heritability). Thus, the first aim of the present study was to quantify the genetic and environmental influences on adolescent dysfunctional attitudes using a classic twin design.
Previous studies examining the mean level of dysfunctional attitudes showed no significant gender differences (Abela & Skitch, Reference Abela and Skitch2007; Abela et al., Reference Abela, Stolow, Mineka, Yao, Zhu and Hankin2011). However, several studies have indicated that the interacting effect between dysfunctional attitudes and life stress on depressive symptoms is stronger in females compared with males (Dykman & Johll, Reference Dykman and Johll1998; You et al., Reference You, Merritt and Conner2009). Several behavioral genetic studies have also suggested gender differences in genetic and environmental etiologies of depression (Bierut et al., Reference Bierut, Heath, Bucholz, Dinwiddie, Madden, Statham, Michael and Martin1999; Kendler et al., Reference Kendler, Gardner, Neale and Prescott2001; Rice et al., Reference Rice, Harold and Thapar2002). Thus, beyond estimating genetic and environmental influences on dysfunctional attitudes in the entire sample, we were also interested in whether or not there is a gender difference in the etiological model.
Another interesting issue pertains to age differences. From the developmental perspective, research has shown that cognitive vulnerabilities, such as dysfunctional attitudes, probably emerged in late childhood and stabilized during adolescence (Abela & Hankin, Reference Abela and Hankin2008). Furthermore, dysfunctional attitudes exhibit more trait-like components across time in middle adolescence compared with early adolescence (Hankin, Reference Hankin2008b). In addition, D'Alessandro and Burton (Reference D'Alessandro and Burton2006) reported that the dysfunctional attitudes–stress interaction only predicted an increase in depressive symptoms in older children (aged ≥ 11–12 years) who have formal operational cognitive skills, but not in younger children (aged 7–10 years). Finally, behavioral genetic research has shown that the heritability of anxious/depressive symptoms and general cognitive ability increase with age (Haworth et al., Reference Haworth, Wright, Luciano, Martin, Geus, Beijsterveldt and Davis2009; Lamb et al., Reference Lamb, Middeldorp, van Beijsterveldt, Bartels, van der Aa, Polderman and Boomsma2010). These findings highlight the need to examine age differences with respect to the impact of genetic and environmental factors on dysfunctional attitudes.
In sum, the purpose of the present study was to estimate the contribution of genetic and environmental factors to variation in adolescent dysfunctional attitudes using a classic twin study. Then we examined gender differences in the genetic and environmental etiologies of adolescent dysfunctional attitudes. Lastly, we examined how the genetic and environmental contributions to adolescent dysfunctional attitudes differ by age.
Materials and Method
Participants
This study was part of the Beijing Twin Study (BeTwiSt), a longitudinal study examining the genetic and environmental influences on psychological development and mental health problems among Chinese children and adolescents. The BeTwiSt sample was recruited from 620 elementary and secondary schools randomly selected from 18 districts and counties in the Beijing municipality. Detailed information about the recruitment process was described in a previous study (Chen et al., Reference Chen, Li, Zhang, Natsuaki, Leve and Harold2013).
The sample for the current study included 674 same-gender twin pairs with complete measures, among which 439 pairs were monozygotic (MZ) twins and 235 pairs were dizygotic (DZ) twins. Females accounted for 53.7% of the sample. The age of the study sample ranged from 11 to 17 years, with a mean (M) of 14.03 years and a standard deviation (SD) of 1.9 years. Ninety-two per cent of the participants were Han Chinese, and the rest were minorities. Regarding the educational level of the fathers of the participants, 6.8% attended primary school, 32.8% attended junior high school, 31.8% attended senior high school, 26.1% attained a college degree, and 2.5% had a graduate degree. For the education level of the mothers of the participants, the proportions for the above five academic qualifications were respectively 5.4%, 35.3%, 29.5%, 25.2%, and 4.6%. The representativeness of the twin sample was described in the prior study (Chen et al., Reference Chen, Li, Zhang, Natsuaki, Leve and Harold2013).
Measures
Dysfunctional attitudes
The Dysfunctional Attitudes Scale for Children (DAS-C; D'Alessandro & Burton, Reference D'Alessandro and Burton2006) was used to measure the dysfunctional attitudes of the participants. For each item, children were asked to rate how much they agree by choosing from a 5-point Likert scale (1 = strongly disagree; 2 = mostly disagree; 3 = agree a bit; 4 = mostly agree; 5 = strongly agree). Past research has shown DAS-C to be reliable and valid; the 3-week test–retest reliability was 0.80 (D'Alessandro & Burton, Reference D'Alessandro and Burton2006; Rawal et al., Reference Rawal, Collishaw, Thapar and Rice2013). The Chinese version of the DAS-C was developed using the back-translation method. The internal consistency of the scale in our sample was satisfactory, with a coefficient alpha (α) of 0.82.
Zygosity determination
For the 674 pairs of same-gender twins, 89.5% of the zygosity of the pairs was determined by DNA analyses. The zygosity of the remaining pairs (10.5%) was determined by a valid questionnaire method (Chen et al., Reference Chen, Li, Chen, Yang, Zhang and Ge2010) because the saliva samples yielded insufficient DNA. For DNA analyses, nine short tandem repeat (STR) loci, which are highly heterogeneous in the Chinese population, were used. Same-gender twins with at least one different genetic marker were classified as DZ twins, otherwise the twins were classified as MZ twins. The posterior probability of being MZ for same-gender twins with the same genotype in all nine loci was estimated to be 99.99%. The validity of the questionnaire method was examined through comparison with the results of DNA analyses. The predictive accuracy of the questionnaire method used in this study reached 91% (Chen et al., Reference Chen, Li, Chen, Yang, Zhang and Ge2010).
Procedures
All twins and their parents signed informed consent before participation. During the survey of the second wave of BeTwiSt, two research staff members visited each family in their home to administer the assessments. Twins reported their dysfunctional attitudes and depressive symptoms by DAS-C and Children's Depression Inventory (CDI) independently. The participants were assured of the confidentiality of their responses and the voluntary nature of their participation. All procedures were approved by the Institutional Review Board.
Statistical Analyses
The twin design relies on different levels of genetic relatedness between MZ twin pairs who are genetically identical, and DZ twin pairs who share one-half of the additive genetic effects. This difference was used to estimate the contribution of additive genetic (A), shared environmental (C), and non-shared environmental (E) influences to the individual differences in the phenotype of interest. Shared environmental influence is defined as a non-genetic influence that results in similarity within the twin pairs, while non-shared environmental influence results in differences within the twin pairs, which also includes measurement error.
Structural equation modeling packages (Mx) utilize maximum likelihood estimation procedures on raw data to estimate variance components. The fit statistics provided by Mx for raw data modeling is minus twice the log likelihood (-2LL) of the observations. This is not an overall measure of fit, but provides a relative measure of fit because differences in -2LL between models are distributed as chi-square (χ2). Therefore, to examine the overall fit of the genetic model, it is necessary to compare the -2LL with that of a saturated model. Consistent with the principle of parsimony, the fit of sub-models was assessed by χ2 difference tests and the Akaike's information criterion (AIC = χ2 - 2df), with lower χ2 values and more negative AIC values suggesting a better fit. Confidence intervals of parameter estimates were obtained by maximum likelihood.
The statistical significance of genetic, shared, or non-shared environmental effects was tested by checking whether or not the confidence interval of parameters included zero. Quantitative gender and age differences were examined by comparing the saturated model with freely estimated A, C, and E parameters across gender or age group and the restricted model, where A, C, and E parameters were equated for males and females, or for younger (aged 11–13 years) and older groups (aged 14–18 years). The difference in -2LL between the saturated model and the restricted model is χ2-distributed with degrees of freedom equal to the difference in degrees of freedom. The likelihood ratio test (LRT) was applied to evaluate the significance of the constraint. If the difference in -2LL was significant, the constraint was rejected; if the difference is non-significant, the constraint was accepted and the parsimonious model (with fewer estimated parameters) was approved.
Results
Descriptive Statistics and Pearson Correlations
The mean values and SDs of dysfunctional attitudes are shown in Table 1. There were no significant differences in the mean level of dysfunctional attitudes between males and females, t(629) = -0.33, p = .74, and between the younger (aged 11–13 years) and older (aged 14–17 year) groups, t(629) = -0.56, p = .58. The interaction between gender and age was also non-significant, F(1, 627) = 0.15, p = .93. No significant mean difference was found between MZ (M = 55.66, SD = 12.44) and DZ (M = 56.57, SD = 12.00) twins, t(629) = -0.88, p = .38. The phenotypic variance was homogeneous across zygosity groups (F = 0.81, p = .37), gender (F = 3.00, p = .08), and age group (F = 3.22, p = .07). We also compared the mean levels of dysfunctional attitude between our sample (aged 11–17 years, N = 674, M = 55.97, SD = 12.29) and the sample of Canadian children (aged 7–14 years, N = 241, M = 55.01, SD = 16.02), in which the DAS-C scale was originally developed and validated (D'Alessandro & Burton, Reference D'Alessandro and Burton2006). Results showed that there was no significant mean difference (t = -0.85, p = .20).
Descriptive Statistics and Pearson Correlation Within Twin Pairs

All Pearson correlation coefficients were significant at the 0.05 level.
Before estimating the parameters of genetic and environmental effects in model-fitting analyses, Pearson correlation coefficients of DAS-C scores within twin pairs were computed in MZ and DZ twins. For the entire sample, the magnitude of the correlation coefficient in MZ twins (r = 0.39) was greater than the magnitude of the correlation coefficient in DZ twins (r = 0.25), but less than twice the correlation coefficient in DZ twins. Similar patterns were noted when the Pearson correlations were computed separately by gender or age groups (aged 11–13 years vs. 14–17 years; see the third row in Table 1). These results suggest additive genetic, and shared and non-shared environmental influences on adolescent dysfunctional attitudes (i.e., ACE model).
Model-Fitting Analyses
The results of model-fitting across genders are shown in Table 2. The difference in fit between models 1 and 2 was not significant, Δχ2 (7) = 0.05, p = 1.0, suggesting that the mean levels of dysfunctional attitude are equal across genders. Moreover, equating the A, C, and E parameters between females and males also resulted in a non-significant difference in model fit (model 2 to model 3), Δχ2 (3) = 1.65, p = .65, indicating that the magnitudes of genetic and environmental influences on dysfunctional attitude were equal across genders.
Parameter Estimates With 95% Confidence Intervals and Fit Indices Across Genders
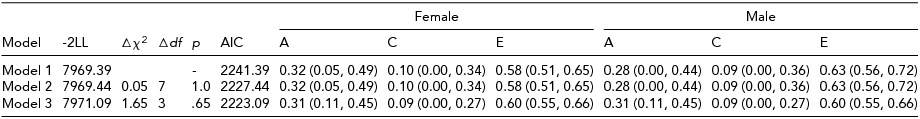
Model 1: A, C, and E parameters and mean values were freely estimated. Model 2: A, C, and E parameters were freely estimated but mean values were equated. Model 3: A, C, and E parameters and mean values were equated across genders.
The results of model-fitting across age groups, as shown in Table 3, demonstrated similar patterns. The difference in fit was not significant between models 1 and 2, Δχ2 (7) = 0.01, p = 1.0, as well as between models 2 and 3, Δχ2 (3) = 0.70, p = .87, suggesting that both mean level and magnitudes of genetic and environmental influences on dysfunctional attitudes did not differ between the younger (aged 11–13 years) and older (aged 14–17 years) groups. Thus, we found that across gender and age, the magnitudes of genetic, shared, and non-shared environmental influences on adolescent dysfunctional attitudes were 31% (95% CI: 11%, 45%), 9% (95% CI: 0%, 27%), and 60% (95% CI: 55%, 66%), respectively.
Parameter Estimates With 95% Confidence Intervals and Fit Indices Across Age Groups
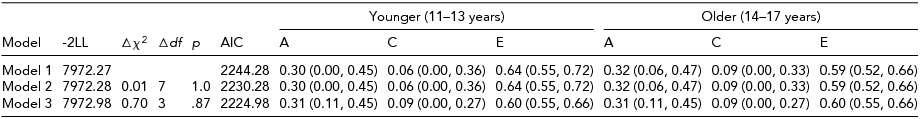
Model 1: A, C, and E parameters and mean values were freely estimated. Model 2: A, C, and E parameters were freely estimated but mean values were equated. Model 3: A, C, and E parameters and mean values were equated across age groups.
Discussion
Even though dysfunctional attitude has been demonstrated as a vulnerability to adolescent and adult depression, little is known about the genetic and environmental origins of dysfunctional attitudes. The present study, for the first time, quantitatively investigated genetic and environmental influences on individual differences in dysfunctional attitudes using a twin design.
Our results showed that genetic factors play an important role in the etiology of adolescent dysfunctional attitudes, which accounted for approximately 31% of variation. The moderate heritability of dysfunctional attitude was slightly lower than that found for depressive symptoms in Western (Rice & Thapar, Reference Rice, Thapar and Yong-Kyu2009) and East Asian youth (Hur, Reference Hur2008). However, the genetic effect in dysfunctional attitude is very similar to the findings from twin studies of other cognitive vulnerabilities in depression. Specifically, Lau et al. (Reference Lau, Rijsdijk and Eley2006) demonstrated that the heritability of adolescents’ attributional style (i.e., attributing negative events to internal, stable, and global causes) was 35%. Eley et al. (Reference Eley, Gregory, Lau, McGuffin, Napolitano, Rijsdijk and Clark2008) showed that genetic factors accounted for 30% of variation in children's interpretation bias (i.e., interpretating ambiguous information as threatening). Moderate genetic effects were also reported for cognitive bias associated with anxiety and depressive symptoms in adolescents, which are referred to as sensitivity to symptoms of anxiety (attentional bias) and the belief that these are harmful (Zavos et al., Reference Zavos, Rijsdijk, Gregory and Eley2010, Reference Zavos, Helena, Gregory and Eley2012). Together with our findings, accumulating evidence suggests that cognitive vulnerabilities to depression have genetic roots and may function as an endophenotype to identify risk genes for depression. Indeed, several prior studies have indicated that several specific genetic loci (e.g., BDNF Val66Met and 5-HTTLPR) are associated with dysfunctional attitudes (Wells et al., Reference Wells, Beevers and McGeary2010; Whisman et al., Reference Whisman, Johnson and Smolen2011).
The results of the present study also indicated differential effects of shared and non-shared environmental factors in the etiology of dysfunctional attitudes. Shared environmental influence was small, only accounting for 9% (0%, 27%) of variation, whereas non-shared environmental influence was large, accounting for 60% (55%, 66%) of variation. These findings are consistent with estimates in studies of depression and anxiety (Rice & Thapar, Reference Rice, Thapar and Yong-Kyu2009). These findings also indicated that the environmental factors associated with dysfunctional attitudes, such as emotional maltreatment, verbal peer victimization, and negative feedback from parents, may exert influences through a non-shared environmental mechanism. Future studies using an MZ twin difference design may test this hypothesis empirically.
We found no significant difference in the mean level of dysfunctional attitudes across gender or age groups, which is consistent with prior findings (Abela & Skitch, Reference Abela and Skitch2007; Abela et al., Reference Abela, Stolow, Mineka, Yao, Zhu and Hankin2011). Moreover, the magnitude of genetic and environmental influences on adolescent dysfunctional attitudes did not differ significantly between females and males, and between the younger (aged 11–13 years) and older (aged 14–17 years) groups. However, there were some interesting trends. Specifically, the genetic effects were stronger in females (32%) than in males (28%), and stronger in older adolescents (32%) than in younger adolescents (30%). These differences were not statistically significant and might be due to the relatively smaller sample size of this study. Thus, future research with a larger sample size may provide more definitive conclusions.
The present study had several limitations. First, we used the classic twin design to partition genetic, shared, and non-shared environmental influences on dysfunctional attitudes. Twin studies are susceptible to a violation of the equal environments assumption, which overestimates the importance of genetic effects. Fortunately, several studies have provided evidence of the validity of the equal environments assumption (Derks et al., Reference Derks, Dolan and Boomsma2006; Eriksson et al., Reference Eriksson, Rasmussen and Tynelius2006; Klump et al., Reference Klump, Holly, Iacono, McGue and Willson2000). Second, this study was based on participants from the general population. It remains to be seen whether the results can be generalized to clinical populations. It is noteworthy that the general population, rather than clinical samples, may be more appropriate for quantitative genetic studies, as the latter may restrict the variance of measures, and therefore reduce statistical power (Waldman, Reference Waldman2005). Third, as this finding was based on data collected in Chinese Han adolescents, the results may not be generalized to other ethnic groups. Nevertheless, we found no significant mean difference of dysfunctional attitudes between our sample and a European sample. Future studies are needed to investigate whether there are some culture-specific negative attitudes in the Chinese population.
Despite these limitations, the present study has potential implications. Previous studies have demonstrated dysfunctional attitudes as cognitive vulnerability to depression. The finding of moderate heritability in this study provides additional evidence indicating dysfunctional attitudes to be an endophenotype for depression. Future studies can use dysfunctional attitudes to identify risk genes for depression. Moreover, evidence of genetic influence on dysfunctional attitude and other cognitive vulnerabilities has reframed the traditional view of cognitive model of depression. The traditional view proposes that the formation of dysfunctional schemas is due to early adverse experiences. The dysfunctional schemas can be activated by later stressful events, and schema activation then influences individual's perceiving, encoding, and retrieving information, thus generate other cognitive vulnerabilities such as attention bias, interpretation bias, and negative attribution styles. The current study and previous findings of genetic influences on other cognitive vulnerabilities suggest that genes do play an important etiological role in the development of cognitive vulnerability to depression.
Acknowledgments
This study was supported by the Knowledge Innovation Program of the Chinese Academy of Sciences (KSCX2-EW-J-8), funds for young scholars of the Institute of Psychology, Chinese Academy of Science (Y0CX351S01), and the National Natural Science Foundation of China (31170993, 91132728, and 31300841). This research was also supported by the Key Laboratory of Mental Health, Institute of Psychology, Chinese Academy of Sciences, and the BeTwiSt of Institute of Psychology, Chinese Academy of Sciences. The original principal investigator, Dr Xiaojia Ge, passed away during the course of this study and the authors dedicate this paper to his memory and for his great contribution in founding the BeTwiSt. We are also grateful to participating twin families and schools.


