

1. Introduction
The Yukon—Alaska border hosts the highest concentration of surge-type glaciers in North America, with 136 out of the 204 surge-type glaciers identified in western North America by Post (1969) occurring in the St Elias Mountains (Clarke and Reference Clarke, Holdsworth, Williams and FerrignoHoldsworth, 2002). Examples include the extensively studied Variegated Glacier in Alaska (e.g. Reference KambKamb and others, 1985; Raymond and Reference Raymond and HarrisonHarrison, 1988; Reference HarrisonHarrison and others, 2008) and Trapridge Glacier in the Yukon (e.g. Reference Clarke, Collins and ThompsonClarke and others, 1984; Reference Fischer, Clarke and BlatterFischer and others, 1999; Frappé-Sénéclauze and Reference Frappé-Sénéclauze and ClarkeClarke, 2007). Other surge-type glaciers in the region include Steele Glacier (Reference StanleyStanley, 1969), Donjek Glacier (Reference JohnsonJohnson, 1972), Malaspina Glacier (Reference Muskett, Lingle, Tangborn and RabusMuskett and others, 2003), Dusty Glacier (Reference MillerMiller, 1971), a small unnamed glacier adjacent to Kaskawulsh Glacier (Reference De Paoli and FlowersDe Paoli and Flowers, 2009; Reference Flowers, Roux, Pimentel and SchoofFlowers and others, 2011), and Lowell Glacier (Clague and Reference Clague and RamptonRampton, 1982; Reference Clarke, Holdsworth, Williams and FerrignoHoldsworth and others, 2002). Surge-type glaciers are characterized by (semiregular) alternations between periods of fast and slow motion, typically known as the active and quiescent phases, respectively. In Yukon–Alaska there is typically a net buildup of ice at high elevations in the accumulation area of the glacier during the quiescent phase that causes a steepening of the glacier surface (e.g. Reference Meier and PostMeier and Post, 1969). When the build-up of ice attains a threshold, the active phase is initiated and ice is transferred down-glacier to a receiving area, typically accompanied by dramatic advance of the glacier terminus and rapid ice motion (e.g. Reference Meier and PostMeier and Post, 1969; Reference KambKamb and others, 1985).
Two main subglacial mechanisms have been identified as controls on the surge cycle. The first, the thermal switch, reflects an alternation between cold- and warm-bed conditions on soft-bedded polythermal glaciers. It is most commonly found in Svalbard (Murray and Reference Murray and PorterPorter, 2001; Reference Murray, Strozzi, Luckman, Jiskoot and ChristakosMurray and others, 2003), but has also been reported for glaciers in other locations such as the Yukon (Reference ClarkeClarke, 1976; Reference Clarke, Collins and ThompsonClarke and others, 1984), East Greenland (Jiskoot and Reference Jiskoot and JuhlinJuhlin, 2009) and the Karakoram (Reference Quincey, Braun, Glasser, Bishop, Hewitt and LuckmanQuincey and others, 2011). With this mechanism, it is hypothesized that the glacier is frozen to its bed when ice is thin, but that the bed reaches the pressure-melting point when the ice thickens due to increased insulation from low atmospheric temperatures. The second mechanism, the hydrological switch, relates to a reorganization of the subglacial drainage system beneath temperate glaciers, driven by the collapse of subglacial channels due to the weight of overlying ice as the reservoir area builds, and consequent increase in basal water pressure (Reference KambKamb and others, 1985; Reference KambKamb, 1987; Björnsson, 1998). The active phase of surge-type glaciers with the thermal switch is typically 3–10 years and quiescent phases can be 50–100+ years (Reference Dowdeswell, Hamilton and HagenDowdeswell and others, 1991). There is also evidence that small valley glaciers with a thermal switch can undergo ‘slow’ surges, during which the active phase may last for 20 years or more (Frappé-Sénéclauze and Reference Frappé-Sénéclauze and ClarkeClarke, 2007; De Paoli and Reference De Paoli and FlowersFlowers, 2009). In contrast, surge-type glaciers with the hydrological switch typically experience short active phases (<1–2 years) and relatively short quiescent phases (~10–20 years) (Reference Eisen, Harrison and RaymondEisen and others, 2001; Reference HarrisonHarrison and others, 2008). Surges driven by the hydrological switch typically initiate in the upper part of a glacier (Reference KambKamb and others, 1985), while those driven by the thermal switch have been shown to initiate both in the terminus region if they are tidewater (Reference Murray, Strozzi, Luckman, Jiskoot and ChristakosMurray and others, 2003) and upper regions if they are land-terminating (Reference Clarke, Collins and ThompsonClarke and others, 1984; Frappé-Sénéclauze and Reference Frappé-Sénéclauze and ClarkeClarke, 2007; Jiskoot and Reference Jiskoot and JuhlinJuhlin, 2009).
In this study we identify and characterize the recent surges of Lowell Glacier and place the most recent 2009–10 surge event in a historical and climatic context. Specifically, we quantify changes in glacier geometry, velocity and surface elevation, and the differences in surge duration and timing of surge initiation and termination for the five observed surges since the late 1940s. This includes an assessment of how the glacier length and area have varied over time in relation to long-term changes in mass balance, and whether Lowell Glacier is likely to block the Alsek River in the future, as it did repeatedly in the 19th century and before.
2. Study Site
Lowell Glacier (60017’ N, 138013’ W) is a large valley glacier in Kluane National Park and Reserve near the eastern limit of the St Elias Mountains, Yukon, Canada (Fig. 1). The glacier is ~65 km long, ~5 km wide and covers an area of ~220 km2. It flows to the east from the St Elias Icefields (~1500 m a.s.l.), with an accumulation region that is shared by both Fisher Glacier and Hubbard Glacier. It terminates in Lowell Lake, an iceberg-filled proglacial lake at 480 m a.s.l., which is supplied and drained by the north–south-flowing Alsek River. The climate is sub-arctic and continental, with measurements at Haines Junction (615 m a.s.l., ~60 km north-northeast of the glacier terminus) indicating a mean annual temperature of –4.20C between 1990 and 2007 and mean annual precipitation of 189 mm between 1985 and 2007 (http://climate.weather.gc.ca/climate_normals/index_e.html).
Overview of Lowell Glacier, with numbers indicating locations referred to in the text. 1: icefall from Dusty Glacier; 2, 4, 6: upper, middle and lower north arm; 3, 5, 7: upper, middle and lower south arm; 8: nunatak. CRL: common reference line used to reference changes in glacier length over time. Snowline is derived from late-summer Landsat imagery and is assumed to approximate the equilibrium line (base image: Landsat 7 ETM+, 14 September 2010).

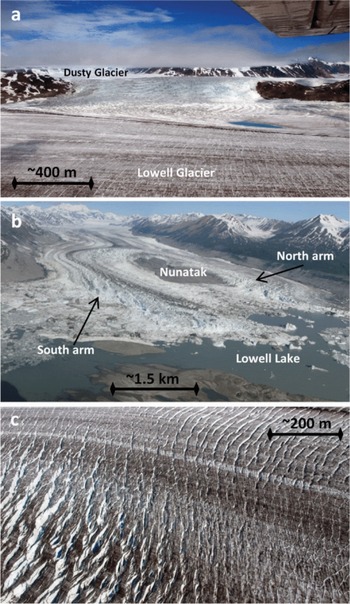
Lowell Glacier is divided along its central axis by a large medial moraine, with the two arms having different ice sources. The south arm begins in a large high-elevation accumulation basin to the south, whereas the north arm joins the main glacier via an icefall ~200 m in height (location 1 in Fig. 1; Fig. 2a). This icefall originates from the upper parts of Dusty Glacier, which is ~250 km2 in area and is also a surge-type glacier (Clarke and Reference Clarke, Holdsworth, Williams and FerrignoHoldsworth, 2002). Near the terminus, the main trunk of Lowell Glacier is split in two by a large central nunatak that has in the past become ice-covered during large surges (location 8 in Fig. 1; Fig. 2b). In addition, Lowell Glacier displays an impressive tapestry of looped surface moraines, which provide evidence of past surge activity. During the active phase of the surge cycle, the lower portion of the glacier is covered by numerous large crevasses (up to ~40 m deep and ~5–10 m wide), creating extensive seracs (Fig. 2c).
Photographs of Lowell Glacier from the 2009–10 surge: (a) icefall from the upper Dusty Glacier (Fig. 1, location 1; 20 July 2010); (b) glacier terminus pushing into Lowell Lake, viewed from Goatherd Mountain (Laura Gorecki/Parks Canada, 14 June 2010); and (c) extensive new surface crevassing (Fig. 1, location 5; 20 July 2010).
Lowell Glacier is of particular interest to local inhabitants because of evidence that it has pushed up against Goatherd Mountain during previous surges and dammed the Alsek River (Fig. 1), causing the formation of neoglacial Lake Alsek. Clague and Rampton (1982) used a combination of geomorphological evidence (e.g. raised beaches, mega-dunes), radiocarbon dating and historical evidence to indicate that this process has occurred many times over the past several thousand years, most recently in the late 1800s. The maximum depth of Neoglacial Lake Alsek was 200 m and it would have inundated the present town site of Haines Junction and the adjacent Alaska Highway (Clague and Reference Clague and RamptonRampton, 1982).
3. Data and Methods
3.1. Aerial photographs and satellite images
To determine the timing and characteristics of past advance and quiescent phases of Lowell Glacier we used aerial photographs and satellite images from 1948 to 2013 to measure temporal changes in ice surface area and terminus position and to determine variability in surface motion. From the pre-satellite-image era (<1972), we used six panchromatic aerial photographs obtained from the National Air Photo Library, Ottawa, Canada (Table 1). The photographs taken between 1948 and 1956 were scanned at a resolution of 900 dpi. The 1948 images were mosaicked to obtain full coverage of the glacier terminus. All aerial photographs were georeferenced to a Landsat 7 Enhanced Thematic Mapper Plus (ETM+) image from 10 October 2002 using 15–20 tie points on stable terrain, resulting in a root-mean-square error (RMSE) of <15 m.
Details of the aerial photographs and satellite imagery used in this study

For the satellite-image era, a total of 108 Landsat images of Lowell Glacier with little or no cloud cover were used (Table 1). These were acquired from the United States Geological Survey Earth Explorer website as orthorectified L1T data (earthexplorer.usgs.gov). Late-summer imagery was chosen whenever possible to minimize snow cover and enable clear viewing of the glacier surface properties, and to easily distinguish ice from surrounding bedrock. Once surge phases had been identified, additional Landsat scenes from the advance phases were selected regardless of season to quantify subannual variations in ice area and surface velocity. Owing to a failure of the ETM+ scan-line corrector in 2003, images from Landsat 7 acquired after 2003 were striped with missing data. Fortunately, the size of Lowell Glacier allowed accurate interpretation of the glacier boundary even when these image stripes were present. Colour composite images were created for all 108 satellite scenes to improve identification between surface features (e.g. glacier ice, moraine, bedrock). Upon visual inspection, some of the older Landsat images required improved georeferencing beyond that provided by the L1T data. These scenes were georeferenced against the Landsat 7 ETM+ image from 10 October 2002, using 15–20 tie points. This produced an RMSE for the older Landsat scenes that varied between <15 and 60 m due to their lower resolution than modern scenes. Using the error assessments outlined by White and Copland (2013) for similar Landsat-based area measurements, area estimates are considered to be accurate to ~0.1 km2.
For the most recent 2009–10 surge, oblique aerial photographs and observations were taken by the authors and local pilot Donjek Upton in July 2009, February 2010, May 2010, July 2010 and July/August 2011. Flights were made in a Helio Courier aircraft operating from Kluane Lake Research Station, at altitudes of ~50–500 m above the glacier surface. To quantify changes in ice surface area, outlines of Lowell Glacier were traced as polygons in Environmental Systems Research Institute (ESRI) ArcGIS 10.1 for all suitable images between 1948 and 2013. The area was calculated for each of the polygons and normalized to the first data point from 14 June 1948. To quantify changes in glacier length, the relative terminus positions of both the north and south arms of Lowell Glacier were measured as polylines in ESRI ArcGIS 10.1 between the glacier terminus and a common reference line (CRL; between 60.3108 N, 137.9428 W and 60.2658 N, 137.9428 W; Fig. 1), for a total of 78 images between 1948 and 2013. All data were projected in Universal Transverse Mercator (UTM) zone 7N with the World Geodetic System 1984 ellipsoidal elevation (WGS84) datum.
Surface velocity variations in the ablation area were quantified via manual tracking of distinctive ice surface features such as looped moraines, crevasses and supraglacial lakes, similar to the methods of Holdsworth and others (2002) and Jiskoot and Juhlin (2009). In our method, polylines were created in ESRI ArcGIS 10.1 of surface features that were present in time-separated image pairs. The distance that a feature travelled over the time between image acquisitions then provided an estimate of average surface motion. To assess spatial variability in velocities, the lower part of Lowell Glacier was separated into north and south arms, and velocities determined for the upper, middle and lower portions of each (locations 2–7 in Fig. 1). Both the active and quiescent phase velocities were measured using this technique. Velocities could only be derived for the lower part of the ablation area due to the lack of distinctive surface features to track in the frequently snow-covered upper ablation and accumulation areas.
The dates provided here for the initiation of surging are based on abrupt advance of the glacier terminus, with confirmation provided by features such as extensive new crevassing and accelerated surface velocities. Surge termination was determined from retreat of the glacier front, with confirmation provided by reductions in surface motion and closure of crevasses. Terminus advances provide the only way to consistently identify surges on Lowell Glacier since 1948 due to the lack of any velocity data from the upper ablation and accumulation regions, and sparse temporal and spatial coverage in the lower ablation region, particularly prior to 1980. This method of surge identification differs from the one based on changes in surface motion that is often used (e.g. Reference KambKamb and others, 1985; Reference Murray, Strozzi, Luckman, Jiskoot and ChristakosMurray and others, 2003) and means that the dates presented here should be considered as the latest possible timing of surge initiation and termination. So that this difference is explicit, we refer to ‘advance’ phases of Lowell Glacier when they were derived from area changes, rather than ‘active’ phases. Measurements from the 2009–10 surge suggest that up-glacier velocities may increase up to 1 year prior to terminus advance (Section 4.2), although this dating is poorly constrained.
3.2. Digital elevation models
To derive changes in surface elevation and ice volume across the ablation zone over time, digital elevation models (DEMs) from the Canadian Digital Elevation Dataset (CDED) were compared with elevation values derived from three Advanced Spaceborne Thermal Emission and Reflection Radiometer (ASTER) DEMs. The CDED data were derived from 1: 50 000 aerial photograph surveys completed between 1976 and 1977 and resampled to a 30 m x 30 m grid. The ASTER DEMs were produced by NASA from imagery acquired on 11 September 2003, 17 July 2006 and 15 March 2011. All three ASTER DEMs were produced using the NASA Silcast model, but the 2011 DEM also formed part of Global DEM 2 (GDEM2). The Silcast-derived DEMs were produced from satellite scenes with 10–30% cloud cover, with surface elevations unable to be derived for cloudy regions. In addition, large errors were present over Lowell Lake, so this region was excluded from analysis. Ice surface elevation changes were calculated by differencing the DEMs using the Raster Calculator in ESRI ArcGIS 10.1. Regions with elevation differences >100 m were assumed to be erroneous and omitted from analysis. DEMs were not derived for the upper ablation and accumulation areas due to the snow cover there, which precluded accurate calculation of surface elevation values.
The DEMs were co-registered using the method of Nuth and Kääb (2011), which computes the required three-dimensional shift vector between DEM pairs based on elevation difference residuals and the derivatives of slope and aspect. Once co-registered, a comparison of elevations over stable bedrock areas adjacent to the north side of the glacier was used to quantify the uncertainties associated with the DEM analysis. These uncertainties were computed using the Zonal Statistics tool in ArcGIS. The mean elevation difference calculated on stable terrain was +5.4 ± 10.2 m between 1976 and 2003, –13.5 ± 21.0 m between 2003 and 2006 and +6.6 ± 7.2 m between 2006 and 2011 (± = 1SD).
The CDED DEM was used to create an outline of the estimated size of Lake Alsek under different scenarios, should Lowell Glacier dam the Alsek River. The ice surface elevation used for the 2009–10 surge was measured on 31 May 2010 using the altitude determined from a helicopter barometric altimeter (calibrated to the airport at Haines Junction), and the height between the aircraft and terrain determined by the helicopter radar altimeter (Reference LipovskyLipovsky, 2012). To undertake the Lake Alsek calculations, six 1: 50 000 CDED DEMs were mosaicked in ESRI ArcMap 10.1.
4. Results
4.1. Identification of surges
Based on our observations and those of previous authors, it is apparent that there have been five surges of Lowell Glacier since the late 1940s. Their advance phases occurred in ~1948–50 (A1, noted by Reference KindleKindle, 1953), ~1968–70 (A2, noted by Reference Clarke, Holdsworth, Williams and FerrignoHoldsworth and others, 2002), 1983–84 (A3, studied by Reference Clarke, Holdsworth, Williams and FerrignoHoldsworth and others, 2002), 1998–99 (A4) and 2009–10 (A5). We used the aerial photographs and satellite images (Table 1) to bracket the duration of the advance and quiescent phases for each of these five surges (Table 2). The initiation and termination of surge activity can be narrowed down to the period between satellite image pairs for the three most recent surges (A3–A5), so the duration of these phases and intervening quiescent periods, Q3 and Q4, are provided with minimum and maximum values. For the earlier periods less imagery is available, so only general dates can be provided for the duration of these advance and quiescent phases.
Transition dates and duration of the advance (A) and quiescent (Q) phases of Lowell Glacier since 1948. The listing of two dates indicates that the transition occurred between a pair of satellite images. Date format is dd/mm/yyyy

The A1 surge was determined from aerial photography taken in 1948 and 1953. In 1948 the terminus of Lowell Glacier was ~1.5 km from Goatherd Mountain, and in 1953 the glacier terminus had fully advanced (Fig. 3). During a winter expedition down the Alsek River in 1950, Kindle (1953) observed that ‘the north side of Lowell Glacier had advanced to within 100 feet [30 m] of the rock bluffs of Goatherd Mountain’ (i.e. it had fully or nearly fully surged). This suggests that the surge began in ~1948–49 and reached its maximum in ~1950–51. We estimate duration and uncertainty of A1 to be up to ~2 years. The A2 surge also predates satellite imagery and no vertical aerial photographs are available until 1972. However, an oblique aerial photograph from 25 August 1969, taken by Austin Post (USGS photograph No. 69R1–287), shown in Holdsworth and others (2002), records the glacier in an advanced position at that time. This surge was estimated by Post and others (1976) to have initiated in 1968 and terminated in 1970. The initiation of the A3 surge was first identified from the advance of the terminus seen in a satellite image from 25 June 1983, and was also discussed by Holdsworth and others (2002). An image acquired on 9 June 1983 showed few signs of terminus advance, allowing the uncertainty associated with the initiation of the surge to be bracketed to 16 days. Termination of the surge was first apparent from terminus retreat observed in a satellite image from 28 July 1984, allowing the termination to be bracketed to a 32 day period since the previous image on 26 June 1984. For surge A4, satellite imagery allowed the start to be bracketed between late summer and early fall 1997, with termination in June 1998.
Maximum extent of Lowell Glacier for every surge since 1948 (base image: Landsat 7 ETM+, 10 October 2002).

Surges A1 and A2 are estimated to be up to ~2 years in duration, although this timing is poorly constrained. The durations of surges A3, A4 and A5 are much better constrained and lie between 0.80 and 1.09, 0.66 and 0.96, and 0.88 and 0.94 years, respectively, with an average of 0.89 years. All surges with good dating control (A3–A5) saw rapid terminus advance initiate in the summer to early fall (late June to early October), continue through the winter and terminate the following June or July.
The quiescent phases of Lowell Glacier have been measured in the same way as the advance phases, with the end (start) of one surge taken as the start (end) point of the next quiescent period. The durations of Q1 and Q2 are estimated to be about 18 and 13 years, while Q3 and Q4 are between 12.93 and 13.28 years, and 11.09 and 11.18 years, respectively. The overall average for Q1–Q4 is 13.8 years. Lowell Glacier remains in quiescence at the time of writing (August 2013), so the duration of Q5 is currently unknown. The results are summarized in Table 2.
4.2. Characteristics of the 2009–10 surge
The most recent surge of Lowell Glacier (A5) is well characterized due to the abundance of satellite imagery and ground observations. It was first identified in satellite imagery from an advance of the terminus between 18 July 2009 and 3 August 2009 (Table 2). Extensive new crevassing of the glacier surface was also apparent during the surge (Fig. 2b). Over the entire surge, the north and south arms advanced by 1.28 ± 0.2 and 2.85 ± 0.2 km, respectively, between 3 August 2009 and 27 June 2010 (Figs 3 and 4a; Table 3). This represents an average rate of terminus advance of 3.9 m d–1 for the north arm and 8.6 m d–1 for the south arm. Over the same period the net area of the glacier increased by 5.1 ± 1.3 km2 (Fig. 4a; Table 3), representing an average rate of area increase of 15 000 m2 d–1.
(a) Relative area and length of Lowell Glacier, 1948–2013, derived from aerial photography, satellite imagery (Landsat) and selected publications; (b) surface velocities for the north arm; and (c) surface velocities for the south arm. Note log scale. See Figure 1 for location of measurement regions.

Relative changes in length and surface area of Lowell Glacier, 1948–2010. Changes are provided in relation to the previous surge phase. Date format is dd/mm/yyyy

In August 2008, during quiescent phase Q4, average velocities in the upper portion of the ablation area were 0.26 and 0.21 m d–1 for the north and south arms of the glacier, whereas in the lower portion they were 0.09 and 0.11 m d–1, respectively (Fig. 4b and c). Between 14 August 2008 and 17 July 2009, immediately prior to the terminus advance, average velocities in the upper portion of the glacier had increased to 0.65 and 0.35 m d–1 for the north and south arms, whereas in the lower portion they were 6.18 and 1.35 m d–1, respectively. Between 17 July 2009 and 14 October 2009 velocities increased in the lower portion to 9.3 and 10.2 m d–1 for the north and south arms, respectively, and then remained relatively constant until 19 June 2010 (Fig. 4b and c). After 19 June 2010 the glacier front started retreating (particularly the south arm), and velocities averaged <0.50 m d–1 between 19 June 2010 and 25 September 2011. Quiescent phase velocities before and after the 2009–10 surge were lowest in the lower parts of Lowell Glacier and highest in the upper parts.
Elevation changes between 2006 and 2011 capture the 2009–10 surge of Lowell Glacier (Fig. 5c and d). The entire ablation area increased in elevation over this 5 year period, with the main trunk (excluding the terminus) increasing by an average of 12 m. The terminus region experienced elevation increases of ~20–80 m, with the biggest increases focused on the lower south arm. There is also some evidence for localized increases of up to ~60–80 m in the upper ablation area, although the greater snow cover in this region means that confidence in these patterns is more equivocal than at the terminus. The terminus changes represent rates of surface elevation increase of ~4.0–16.0 m a–1 over the 5 year period, although most of this likely occurred during the 2009–10 surge.
Difference between DEMs of the ablation area of Lowell Glacier: (a) 1976–2003 (encompassing Q2–Q4); (b) 2003–06 (encompassing Q4); (c) 2006–11 (encompassing A5); (d) centre-line profiles (following dashed line in (a)). Cloud label indicates areas where elevation changes could not be derived reliably due to cloud cover.

4.3. Characteristics of surges since 1948
The position of the terminus of Lowell Glacier has decreased over the five surges observed since 1948 (Figs 3 and 4a; Table 3). For quiescent phases Q2–Q4 with well-constrained data, the minimum terminus position retreated overall by 1.12 km for the north arm and 1.73 km for the south arm. Similarly, for advance phases A1–A5, the maximum terminus position decreased by a total of 2.80 km for the north arm and 1.58 km for the south arm (Fig. 3). For the past three surges (A3–A5), the fluctuations in terminus length of the south arm have been greater than those of the north arm due to the presence of a narrow flow unit that extended a considerable distance into Lowell Lake from the south side of the nunatak (Fig. 2b).
The maximum and minimum relative area of the glacier during the advance and quiescent phases has also decreased over time (Fig. 4a; Table 3). During the quiescent phases, minimum area decreased by a total of 24.8 km2 between Q0 and Q4. Similarly, maximum area during advance phases progressively decreased by a total of 26.8 km2 between A1 and A5. In terms of the change in glacier size between quiescent and advance phases, advance phase A3 of 1983–84 was the largest recorded since 1948, with an increase in terminus area of 12.1 km2 and average increase in terminus length of 2.09 km, compared with the quiescent phase before it (Fig. 4a). The 2009–10 surge resulted in the smallest increase in area on record, with a change of only 5.1 km2 from the quiescent phase preceding it. The bathymetry of Lowell Lake may also influence temporal changes in the length and area of Lowell Glacier, although glacier dynamics appear to be the primary driver.
Surface velocities for the early part of the study period are poorly constrained, with average motion for A1 only able to be derived for the lowest portion of the glacier at 1.7 m d–1 (Fig. 4b and c). However, this value likely grossly underestimates the actual peak, as this surge lasted for up to ~2 years, but the velocities were derived over a 5 year period between the 1948 and 1953 aerial photographs. No velocities could be measured for the 1968–70 A2 surge as no images were available. However, velocities for the A3–A5 surges are well constrained, with peaks typically >10 m d–1 in the terminus region and the fastest-recorded motion of ~30 m d–1 occurring in the lowest part of the south arm during the 1983–84 A3 surge (Fig. 4c). Quiescent-phase velocities in the upper part of the ablation area (locations 2 and 3 in Fig. 1) varied between 0.24 and 0.36 m d–1 during Q2 and 0.38 and 0.49 m d–1 during Q4 (Fig. 4b and c). In contrast, quiescent-phase velocities remained low and nearly constant at the terminus (locations 6 and 7 in Fig. 1), from 0.03 to 0.04 m d–1 during Q2 to 0.02 to 0.03 m d–1 during Q4.
In terms of surface elevation changes, the 1976 DEM represents the surface topography of Lowell Glacier ~6 years after the termination of surge A2, while the 2003 DEM represents the surface topography ~5 years after the termination of surge A4. If we assume they represent the glacier at comparable stages of the surge cycle, it is apparent that long-term thinning of 40–60 m (1.5–2.2 m a–1) occurred over the main ablation area of Lowell Glacier during this period, with localized thinning of 60–100 m (2.2–3.7 m a–1) near the terminus (Fig. 5). Comparison of the 2003 and 2006 DEMs indicates surface elevation changes that are representative of quiescent phase Q4 (Fig. 5b and d). Most regions over the ablation area thinned during this time, although there is a bulge up to ~20 m high that formed between the middle and upper parts of the ablation area over this period. As discussed above, widespread increases in surface elevation occurred across the ablation area between 2006 and 2011 (Fig. 5c and d), which encompassed the most recent A5 surge. There were no major differences apparent in the elevation changes between the north and south arms in any of the DEM comparisons.
5. Discussion and Conclusions
From this study it is apparent that Lowell Glacier has surged five times between 1948 and 2013 (Table 2; A1–A5), the largest number of repeated surges documented for any Yukon glacier. Lowell Glacier fits the picture of a typical Alaskan-type surge glacier, with rapid surge initiation and termination, and relatively short advance and quiescent phases, compared with Svalbard-type surge glaciers (Reference Harrison and PostHarrison and Post, 2003; Reference Murray, Strozzi, Luckman, Jiskoot and ChristakosMurray and others, 2003). The average interval between successive surges on Lowell Glacier is 15.25 years since 1948, remarkably similar to the 15 years between surge initiations recorded for Variegated Glacier over the past century (Reference Eisen, Harrison, Raymond, Echelmeyer, Bender and GordaEisen and others, 2005).
The past three surges of Lowell Glacier (A3–A5) have been identified from terminus advances between June and October, with surge termination identified from terminus stagnation the following June or July (Table 2). Several previous observations of Alaskan glaciers have shown that surges initiated in the winter, such as Roush and others (2003), who described accelerated flow of upper Bering Glacier in March 1993 prior to terminus advance in August 1993. Similarly, Kamb and others (1985) recorded an increase in motion near the top of Variegated Glacier in October 1982 that took until the following June to reach the terminus. Since our method of dating a surge is based on the identification of rapid terminus advance, it is possible that the surges described here initiated in the upper parts of Lowell Glacier the previous winter. Indeed, our velocity measurements for the 2009–10 surge indicate that the lower north arm increased in motion from 0.09 m d–1 in August 2008 to 6.18 m d–1 between August 2008 and July 2009, prior to the main terminus advance between July and August 2009.
Previous studies on Variegated Glacier suggest that Alaskan-type surges are triggered by a switch in the subglacial drainage system from an efficient channelized system to an inefficient distributed system in the upper accumulation area (Reference KambKamb and others, 1985). We do not have direct observations of the bed or subglacial drainage system of Lowell Glacier, but if all surface velocities measured on Lowell Glacier since 1948 are grouped by whether they were recorded during the active or quiescent phase, it becomes apparent that the patterns are very different between phases (Fig. 6). Besides the fact that active phase velocities are one to two orders of magnitude higher than quiescent phase velocities, they also increase in the down-glacier direction during a surge (Fig. 6a). In contrast, during quiescent periods the spatial pattern is reversed, with velocities decreasing in a down-glacier direction and becoming almost stagnant near the terminus (Fig. 6b). This pattern has also been observed on other surge-type glaciers (e.g. Reference KambKamb and others, 1985; Reference Murray, Dowdeswell, Drewry and FrearsonMurray and others, 1998), and supports the contention of Meier and Post (1969), among others, that surges are related to a flow instability caused by insufficient motion in the lower ablation area during quiescent periods to transport ice out of the glacier system, resulting in ice build-up in the upper reservoir area.
Box plot of all measured surface velocities of Lowell Glacier grouped by sector during (a) advance phases of the surge cycle and (b) quiescent phases of the surge cycle (see Fig. 1 for location of sectors). On each box, the central mark is the median, the bottom and top of the box are the 25th and 75th percentiles, respectively, the whiskers extend to the most extreme data points not considered outliers, and outliers are plotted individually.

The comparison between the 1976 and 2003 DEMs suggests there have been strongly negative mass-balance trends on Lowell Glacier, with thinning of up to 2.2 m a–1 across the main ablation area and 3.7 m a–1 near the terminus. This is similar to changes measured on other glaciers in this region, such as Kaskawulsh Glacier ~60 km to the north, which thinned at an average rate of 0.4–0.5 m w.e. a–1 across its ablation zone over the period 1977–2007, and locally up to 5 m a–1 near the terminus over 1995–2000 (Reference Foy, Copland, Zdanowicz, Demuth and HopkinsonFoy and others, 2011). On a regional basis, Berthier and others (2010) recorded an area average mass balance of –0.47 ± 0.09 m w.e. a–1 from 1968 to 2006 for the Wrangell–St Elias Mountains. Lowell Glacier has undergone significant reductions in area and length since 1948, with each surge extent smaller than the previous one (Figs 3 and 4), very likely due to these negative mass-balance conditions. For example, the A5 maximum surge area was smaller than the Q2 and Q1 quiescent minimums. Maximum lengths have not reduced as much as maximum areas, particularly for the south arm, due to the long narrow tongue of ice that is pushed out from this region during surges (Fig. 2b). However, this tongue only survived for a few months in summer 2010 before disintegrating into Lowell Lake, compared with a survival of several years in previous surges (Fig. 4). Model simulations by Flowers and others (2011) for a small surge-type valley glacier ~65 km northwest of Lowell Glacier suggest that surging would stop there if mass balance was more negative than –0.635 m w.e. a–1. These simulations cannot be applied directly to the much larger Lowell Glacier, but they do illustrate the importance of mass balance in controlling glacier surging in this region.
Some previous studies have argued that area and length changes of surge-type glaciers should be excluded from assessments of the impacts of climate change (e.g. Yde and Reference Yde and PaaschePaasche, 2010). However, the records from this study suggest that they can be used if long-term trends in glacier length and area are known, and if the stage in the surge cycle is taken into account when analyzing the measurements. This supports previous observations (Sigurðsson and Jónsson, 1995; Reference Citterio, Paul, Ahlstrøm, Jepsen and WeidickCitterio and others, 2009) and theoretical arguments (Reference OerlemansOerlemans, 2001) that surge-type glaciers can provide useful information about long-term climatic trends. Indeed, several studies have indicated that changes in glacier mass balance can result in changes in the frequency of glacier surging. For example, Dowdeswell and others (1995) stated that a marked reduction in the occurrence of glacier surging (from 18 to 5) in Svalbard between 1936 and 1990 occurred due to negative mass-balance conditions, while Copland and others (2011) argued that a doubling of the number of glacier surges in the Karakoram in the 14 years after 1990 compared with before was related to a sustained period of positive mass balance. On Lowell Glacier it appears that the length of the surge cycle is decreasing over time, from ~20 years (A1 + Q1) to ~15 years (A2 + Q2), then ~14 years (A3 + Q3) and most recently ~12 years (A4 + Q4). However, we do not have sufficient data to determine whether this is a significant trend. Studies on Variegated Glacier indicate that surges occur after a specific mass has built up in the accumulation area (Reference Eisen, Harrison and RaymondEisen and others, 2001). However, there are no accumulation data available for Lowell Glacier, so we are unable to evaluate whether changes in surface mass balance or some other factor has played a role in the apparent recent decrease in duration of the surge cycle.
A major concern for local residents and Parks Canada is whether future surges of Lowell Glacier might block the Alsek River and flood the town of Haines Junction and the adjacent highway, as previously occurred in the 1800s and before (Clague and Reference Clague and RamptonRampton, 1982). To assess this risk, we used the surface elevation of 530 m a.s.l. measured at the terminus in May 2010 to determine the size of the lake that would have formed if the glacier had made contact with Goatherd Mountain during surge A5 and blocked the river (Fig. 7). This lake would have had an area of 22 km2 and perimeter of 78 km, and extended almost 30 km up the Alsek Valley. However, it would not have reached Haines Junction or the highway.
Reconstructed outline of neoglacial Lake Alsek required to flood Haines Junction (following the 615 m a.s.l. contour), and the predicted outline of Lake Alsek should Lowell Glacier dam the Alsek River at the maximum ice terminus elevation of 530 m a.s.l. reached during the 2009–10 surge (base map: Canadian Digital Elevation Dataset).

Using the same DEM, we can also determine what the height of the glacier must have been when the town site of Haines Junction flooded in the past, as well as the size of the resulting lake. Haines Junction lies at 615 m a.s.l., some 135 m above the current elevation of Lowell Lake and 85 m above the 2010 ice surface (Fig. 7). The lake required to flood Haines Junction would have had a shoreline 230 km long and an area of 195 km2, some 173 km2 greater than what would be produced by the 2009–10 ice thickness. Based on these results, a flood of Haines Junction is very unlikely under present ice conditions and climatic trends. Lowell Glacier has not advanced far enough during surges to create a dam for at least the last century, and with current thinning rates it is increasingly unlikely that a dam will occur again in the future.
Acknowledgements
We thank the Natural Sciences and Engineering Research Council of Canada, Polar Continental Shelf Program, Northern Scientific Training Program, University of Ottawa, Canada Foundation for Innovation and Ontario Research Fund for assistance with funding to complete this project. We also thank Champagne and Aishihik First Nations for permission to work in Kluane National Park, and Parks Canada and the staff and pilots of Kluane Lake Research Station for their hospitality and assistance in completing field observations. Comments by Hester Jiskoot and an anonymous reviewer greatly improved the manuscript. Help and support from the IGS is also greatly appreciated.


