

Introduction
DNA, or deoxyribonucleic acid, is the molecule that encodes the genetic instructions essential for the growth, function, and reproduction of all living organisms and many viruses. While traditionally depicted as the B-form double helix, DNA can adopt a variety of alternative structures. These include single-stranded formations such as guanine-rich G-quadruplexes and cytosine-rich i-motifs, as well as multi-stranded assemblies like triplexes and junctions. In the cellular environment, a diverse array of proteins interacts specifically with these specialised DNA structures. Targeting such structures with small molecules holds therapeutic promise and provides valuable tools for probing DNA structure and function.
The overall negative charge of DNA due to the phosphate backbone makes cationic species in general of particular relevance in considering DNA binding, specifically for the development of new therapeutics and photoluminescent probes for the presence of DNA (Heinemann et al., Reference Heinemann2017). Among transition metal complexes, d6 octahedral complexes, such as ruthenium (II), osmium(II), rhodium(III), and iridium(III) polypyridyl complex cations are continuing areas of study because of their high stability, inertness to racemisation, and photochemical and electrochemical properties (Cardin et al., Reference Cardin2017). While first-row transition metals (e.g., Mn, Fe, Co, and Cu) also form octahedral complexes, with [Fe(bpy)3]2+ as one of the first studies demonstrating enantiomeric selectivity towards the chiral duplex DNA, they are often more labile and less kinetically inert than second- and third-row analogues, which can increase the likelihood of stereochemical racemisation under experimental conditions (Nordén and Tjerneld, Reference Nordén and Tjerneld1976). In addition, many first-row octahedral complexes have limited long-lived photophysical behaviour compared with heavier counterparts. These factors can reduce their utility in some structure–function studies and photoactive applications; nevertheless, notable first-row systems (including Fe-based helicates) demonstrate powerful DNA recognition in specific contexts (Cerasino et al., Reference Cerasino2007). Studies and applications of ruthenium polypyridyl metal complexes as DNA probes have been extensively investigated since the observation of luminescence obtained from [Ru(bpy)2(dppz)]2+ cations (where bpy = 2,2′-bipyridine and dppz = dipyridophenazine) upon DNA binding and the subsequent observation that double helical DNA was able to discriminate between the two enantiomers of the [Ru(phen)3]2+ metal complex (Bender and Ginger, Reference Bender and Ginger1959; Barton, Reference Barton1983; Friedman et al., Reference Friedman1990). Of special interest is correlating these photophysical and electrochemical properties with the structural insights gained from the X-ray crystal structures, giving some insight into sequence, enantiomeric, substituent, and structural specificity of the binding between DNA and metal complex (McQuaid and Cardin, Reference McQuaid and Cardin2020).
X-ray crystallography has long been the most reliable method for determining the binding modes of transition metal complexes, particularly ruthenium polypyridyl complexes. While for rhodium polypyridyl complexes the first crystal structure showing major groove intercalation was already published in the early 2000s (Kielkopf et al., Reference Kielkopf2000; Pierre et al., Reference Pierre2007; Zeglis et al., Reference Zeglis2009b), numerous crystal structures of ruthenium polypyridyl complexes deposited in the Protein Data Bank (PDB) have provided valuable structural insights into how these complexes typically intercalate from the DNA minor groove. Recent studies have led to the first crystal structures demonstrating ruthenium polypyridyl complex intercalation from the major groove, and engagement with consecutive double mismatches in DNA (Prieto Otoya et al., Reference Prieto Otoya2024b, Reference Prieto Otoya2024c). An essential complement to X-crystallographic studies is the NMR method, for the many cases where crystals cannot be obtained and for dynamic systems (Feigon, Reference Feigon2025). It is unsuitable for studying many systems in which ligands are rapidly exchanged, as this phenomenon causes peak broadening and significantly hampers the interpretation of such spectra, and for the work described here, it could only define the nucleic acid component. The ligand sites in such structures are often derived from modelling studies (Wilson et al., Reference Wilson2013). Normally, the structure derived from crystallography can be applied to the interpretation of solution spectroscopic data, for cases where only a single species is present in solution. By extension, the structural data can be useful for understanding more complicated equilibria. A specific section of this review concerns the development of rhodium(III) complexes as probes for DNA mismatches, as a study of designing for binding specificity, and the importance of structure to understanding luminescence behaviour in Ru(II) complexes bound to such sites (Zeglis et al., Reference Zeglis2009b).
A specialised resource for nucleic acid structures is the Nucleic Acid Knowledge Base (NAKB) (Berman et al., Reference Berman2022; Lawson et al., Reference Lawson2024). All the structures here are also available in the PDB and use the same four-letter code system, with search tools and analytics for detailed structural analysis. Literature references to the structures are available from the home page for each structure, unless there is no associated publication. For example, at the time of writing, this database contains 176 structures classified as ligand binding by intercalation to DNA. Of these, 46 contain ruthenium. A separate classification, ‘metal ion coordinating (Pt, Rh, Ru)’ gives 113 structures. In this review, platinum-containing compounds, which are always square planar in geometry, will mainly be included as comparisons, since this area is already well documented and analysed (Neidle and Sanderson, Reference Neidle and Sanderson2021). The binding modes are typically different, with ligand loss and direct Pt-guanine covalent linkage. The importance of the cisplatin cancer drugs means that this area is already of great economic and societal value.
The octahedron and the helix – introductory comments
At first glance, the octahedral metal complex and the DNA double helix may seem like an unlikely pairing. However, their shared chirality establishes a crucial point of interaction. Octahedral complexes of the general formula [M(N–N)₃]ⁿ⁺ exist as separable enantiomers, a property that plays a pivotal role in molecular design. Given that DNA itself is chiral, it can distinguish between these enantiomers, often resulting in markedly different binding affinities and modes of interaction (Figure 1). When bound, the enantiomers of photoactive complexes have distinct spectroscopic signatures in the absorption and emission spectra, first recognised many years ago, before structural data were available (Pyle et al., Reference Pyle1989b). The complex [Ru(phen)3]2+ is now known to bind in the DNA duplex minor groove by kinking the DNA bases (Cardin et al., Reference Cardin2017), where the metal centre lies in the groove, ~5 Å from the helix axis, with the enantiomers having distinct binding constants. This is a key feature of octahedral complex binding – the metal is sited in a groove, non-covalently bound, and principally stabilised by hydrophobic stacking interactions. In this review, we cover only complexes containing a single metal centre, but there is a second important category of complexes containing two metal centres linked by an extended conjugated π-system. The work of the Thomas group has advanced our understanding of the potential of these complexes, particularly in relation to their antibacterial properties (Gill et al., Reference Gill2009; Baggaley et al., Reference Baggaley2014; Smitten et al., Reference Smitten2019a, Reference Smitten2019b; Raza et al., Reference Raza2020), leading to the recent establishment of a company focused on their development. The term ‘theranostics’ has been introduced to describe complexes that combine both therapeutic and diagnostic capabilities: here, the luminescence properties of these complexes enable them to serve dual roles as both therapeutic agents and imaging probes (Poynton et al., Reference Poynton2017). Despite this promising functionality, no X-ray diffraction studies have yet reported DNA-bound structures of this class of complexes. However, an important paper reports NMR structure determinations of the binding of two enantiomers, ΛΛ and ΔΔ, to the antiparallel basket (Na+) form of the human telomeric G-quadruplex forming sequence (Wilson et al., Reference Wilson2013). Our recent review of metal complex binding to G-quadruplexes places this key study in that context (Prieto Otoya et al., Reference Prieto Otoya2024a).
(Top): Chemical structures of the enantiomers of tris(phenanthroline)ruthenium(II), (a) Λ-[Ru(phen)₃]2⁺ and (b) Δ-[Ru(phen)₃]2⁺, illustrating the octahedral geometry and chiral arrangement of the phenanthroline ligands around the ruthenium centre. (Bottom) Schematic representations of the Λ- and Δ-enantiomers intercalated into duplex DNA (in practice there will be DNA kinking). The models highlight how each enantiomer interacts with the chiral DNA helix in a distinct spatial orientation. Red starbursts indicate steric clashes between the Λ-enantiomer and the DNA backbone, which are absent in the Δ-enantiomer, illustrating the enantioselective nature of DNA binding by octahedral metal complexes.

A DNA intercalating ligand is typically defined as a planar aromatic cation with an extended chromophore, such as an acridine derivative or ethidium. The classic ruthenium ‘light switch’ complex exemplifies this design, featuring a single extended ‘intercalating ligand’ based on the dipyridyl skeleton, accompanied by two ‘ancillary ligands’. In this structure, the positive charge is localised at the metal centre, while the ligands themselves are neutral, hydrophobic species whose solubility is facilitated by the metal ion. Over time, a diverse range of such complexes has been developed, expanding the scope of intercalative DNA binding agents (Letizia et al., Reference Letizia, Pietro, Ganga, Nastasi and Puntoriero2021). When bound by intercalation to duplex DNA, the photophysical properties are determined by the intercalation geometry, again, enantiomer-dependent. The ancillary ligands sit in the DNA groove and interact with the adjacent DNA phosphate-sugar backbone (Cardin et al., Reference Cardin2017).
For a comprehensive introduction to nucleic acid structure and interactions, the revised edition of Stephen Neidle’s classic text is recommended (Neidle and Sanderson, Reference Neidle and Sanderson2021). It serves as a necessary background to the following discussion of metal complex binding modes. The NAKB has an introduction to nucleic acid structure.
Specific aspects of DNA structure related to metal complex binding
Torsion angles
The model described by Watson and Crick is a right-handed helix (B-DNA). In this model, the two strands rotate in a clockwise or right-handed manner, held together by H-bonding between the bases (in anti-conformation) in an antiparallel fashion. This means that one strand is oriented in the 5′ → 3′ direction and the other in the 3′ → 5′ direction, linked by Watson–Crick hydrogen bonding.
The conformation of each nucleotide residue is defined by 12 torsion angles per residue, and there are characteristic values for the B-DNA helix (Figure 2). The NAKB serves as the reference source for individual structures, including torsion angles.
(a) Schematic representation of the B-DNA double helix highlighting key structural parameters, including the helical pitch (36.0 Å), axial rise per base pair (3.6 Å), and groove dimensions. (b) Detailed diagram of the DNA sugar–phosphate backbone. Each nucleotide, enclosed in brackets, consists of three components: a phosphate group (red), a deoxyribose sugar (blue), and a nitrogenous base (tan). The 5′ to 3′ directionality of the strand is indicated.

Thus, in B-DNA, characteristic ranges of torsion angles define its overall geometry (Figure 3). These parameters can be perturbed by structural changes such as binding by an intercalating agent. In addition to backbone torsion angles, a set of geometric step parameters provides a detailed description of base pair positioning and deformation. For example, intercalation involves the insertion of a planar aromatic ligand between adjacent DNA base pairs, resulting in a substantial increase in the axial rise parameter, typically from approximately 3.6 Å–7.2 Å, effectively inserting an additional ‘step’ into the helical ‘ladder’. DNA flexibility is primarily constrained by two key factors: the mutual repulsion of charges along the DNA backbones and the attractive interactions resulting from the stacking of bases. The stacking energy of a given base step represents one of the major determinants of flexibility in DNA. The higher the stacking energy, the lower the flexibility (Campbell et al., Reference Campbell2008).
(a) Schematic representation of a DNA nucleotide unit showing the standard torsion angles (from α to ζ and χ) and their positions along the sugar-phosphate backbone. (b) The table defines each torsion angle by its constituent atoms.

Binding energetics
Since the aromatic bases are planar, they can stack nicely on one another. Hydrophobic and Van der Waals forces are involved in the stacking interaction, estimated at 5–15 kcal/mol per dinucleotide. Differences between the characteristics of base stacking and hydrogen bonding energies contribute to the heterogeneity of the DNA helix structure (Kool, Reference Kool2001). Helix stability depends mainly on the base geometry and strength of hydrogen bonding. On the other hand, base stacking energies depend on the DNA sequence; in particular, Frank-Kamenetskii and coworkers, by studying DNA molecules with solitary nicks and gaps, determined the stacking energy for the 10 possible steps in B-DNA (Protozanova et al., Reference Protozanova2004; Yakovchuk et al., Reference Yakovchuk2006). These numbers suggest that intercalation should be favoured at steps with low stacking energy (Table 1). In general, GC base pairs are more electron-rich than AT base pairs, which is important for strong stacking interactions by electron-poor intercalators, and for photooxidation by ruthenium complexes, with guanine being the most easily oxidised base, to 8-oxoguanine.
Total base stacking energies (in kJ) for the 10 possible nearest-neighbour dimers in B-DNA

These values reflect the relative stability contributed by base stacking interactions, with GC/GC exhibiting the strongest interaction and TA/TA the weakest. Negative values indicate stabilising interactions; larger negative values correspond to more favourable stacking.
DNA grooves
In most forms of DNA, including the higher-order junctions and quadruplexes, the stacking of bases in the presence of the sugar-phosphate backbone generates grooves of varying dimensions and with varying degrees of exposure of the DNA base. When studying bonding interactions, both the groove dimensions and the DNA sequence create specificity. A bound octahedral metal complex will typically have the metal in a groove, and for many years, the groove location of intercalating ruthenium polypyridyl complexes was controversial (Niyazi et al., Reference Niyazi2012).
In B-DNA, the major and minor grooves are characteristic (Figure 4). In the major groove, the G:C base pair has a hydrogen bonding pattern (acceptor, acceptor, donor), different from the C:G base pair (donor, acceptor, acceptor). A:T and T:A base pairs do not have this difference. They have identical major groove acceptor and donor patterns, but the presence of the 5-methyl group on thymine gives steric bulk in the major groove. In the minor groove, the presence of the 2-NH2 group on guanine gives an additional recognition site and steric bulk compared to adenine (Figure 4). A key factor influencing the availability of hydrogen bonds for interactions with functionalised ligands of octahedral complexes is that the minor groove is notably narrower, making it improbable for it to present all three functional groups found in GC and CG base pairs, as well as the two in AT and TA pairs, for direct hydrogen bonding. Sequences rich in AT have a narrower minor groove compared to regions rich in GC.
Hydrogen-bonding patterns and groove accessibility of the Watson–Crick base pairs. (a) Thymine–adenine (T•A) base pair and (b) guanine–cytosine (G•C) base pair, showing the relative orientation of key functional groups exposed to the major and minor grooves. Red shaded circles highlight atoms involved in hydrogen bonding or groove recognition.

Backbone conformations
Hartmann and colleagues elucidated how DNA sequence and phosphate backbone conformation can influence DNA binding recognition by proteins (Oguey et al., Reference Oguey2010). The authors observed that the dimensions of the DNA major and minor groove (width and depth) of free and protein-bound DNA are intrinsically coupled to the BI and BII backbone conformational state, and the ability to go BI ↔ BII is highly sequence-dependent (Hartmann et al., Reference Hartmann1993). These two types of backbone conformations differ in the two torsion angles ɛ and ζ, which are in BI (ɛ – ζ = − 90˚) and in BII (ɛ – ζ = + 90˚) (Heddi et al., Reference Heddi2009).
From the structural point of view, the BI and BII equilibria are influenced by the twist angle, roll angle, and base pair displacement (or X-disp) related to the winding, curvature, and groove dimension, respectively (Figure 5). These three parameters are abbreviated as TRX factors. Physically, the steps with high TRX scores explore a larger conformational space than those with low TRX scores. Compared to the BI steps, BII steps shift the base pairs towards the major groove, inducing a widening of the minor groove and a shallower major groove. Therefore, BII segments, characterised by negative rolls and base pairs displaced towards the major groove, are associated with deeper and wider minor and shallow major grooves. Changes in these torsion angles have been seen on intercalative binding and determine the luminescence intensity of bound ‘light-switch’ complexes, by modifying the extent of water access to the organic ligands (Hall et al., Reference Hall2013b).
(a) Illustration of the change in the site of the major and minor grooves based on the BI and (b) BII regions. BI and BII phosphate groups are in blue. (Top) DNA molecule showing the difference in size of the major and minor grooves between BI- and BII-rich structures. (Bottom): different views of the different sizes between the grooves. BI-rich sequence (PDB: 1EHV) and BII-rich sequence (PDB: 3GGI). For most PDB codes, the correct literature will be available directly from the home page of the structure as a clickable link.

Hydration
High-resolution X-ray crystal structures reveal layers of ordered water structure, which have been analysed in detail, e.g., for the original Drew-Dickerson dodecamer (DDD) sequence (Tereshko et al., Reference Tereshko1999). Any form of binding to any DNA topology must displace bound water, and so hydration as a topic has been extensively analysed (Privalov et al., Reference Privalov2007).
A groove binding preference for major or minor groove can be explained thermodynamically based on groove hydration. DNA major groove binding is mainly enthalpic, whereas binding to the minor groove is mainly entropic, due to the well-ordered ‘spine of hydration’, as illustrated in Figure 6. Based on the assumption that the major groove is characterised by a non-ordered array of water molecules, compared to the well-ordered molecules across the minor groove, especially in the A + T-rich DNA sequence, the removal of water molecules from the minor groove results in an increase in entropy.
Structural visualisation of B-form DNA highlighting the characteristic spine of hydration. Water molecules localised in the minor groove are depicted as blue spheres, forming a well-ordered hydrogen-bonded network that stabilises the helical conformation. (a) DNA duplex from PDB: 355D, and (b) from PDB: 3U2N, both illustrating the conserved pattern of hydration along the minor groove. The DNA is shown in cartoon representation with surface shading to emphasise groove topology and hydration sites.

Recent work by Peterson and colleagues demonstrated that the chiral DNA double helix imposes a chiral twist on the arrangement of water molecules surrounding it in solution (McDermott et al., Reference McDermott2017). The chiral structure of DNA is imprinted on the solvation structure, resulting in a chiral spine of hydration surrounding DNA. That means that the chiral water superstructure exhibits an extensive range of different hydrogen bonding strengths, reflecting the significant heterogeneity of the water structure and dynamics in the solvation shell of DNA. Petersen and colleagues showed that this is the case using the spectroscopic technique of sum-frequency generation (SFG). This phenomenon is not confined to a specific sequence. However, a study conducted on two different sequence-specific duplexes, (GC)12 and (AT)12, showed that sequence-specific differences occur. Non-hydrogen-bonded waters occur at the (AT)12 duplex, compared to the (GC)12. This result is consistent with the idea that a narrow minor groove would confine the water more and limit the availability of hydrogen-bonding partners. They showed that such structural water molecules exist in solution at ambient temperature and form a chiral superstructure: a chiral spine of hydration in the minor groove.
Metal complex–DNA interaction
Understanding how small molecules interact with DNA is critical for the development of gene therapy agents (Chaires, Reference Chaires2006; Hamilton and Arya, Reference Hamilton and Arya2012). DNA-binding small molecules can broadly be classified into two categories: covalent and non-covalent binders. Covalent interactions are exemplified by platinum-based compounds, such as the complex shown in Figure 7a. Non-covalent interactions, on the other hand, encompass a diverse array of binding modes, including minor groove binders (Figure 7b), electrostatic binders (Figure 7c), metallo-intercalators (Figure 7d), semi-intercalators (Figure 7e), and metallo-insertors (Figure 7f).
Representative examples of the major binding modes between metal complexes and DNA. (a) Covalent binding: Intrastrand cross-link formed by cisplatin, covalently bonding to adjacent guanine bases within the DNA strand (PDB: 3LPV). (b) Groove binding: Lexitropsin occupies the minor groove, forming hydrogen bonds and van der Waals contacts along the DNA edge (PDB: 1LEX). (c) Electrostatic (phosphate clamp) interaction: Triplatin NC complex associates with the negatively charged DNA backbone through charge-assisted electrostatic contacts and N–H···O=P hydrogen bonding (PDB: 2DYW) (Komeda et al., Reference Komeda2006). (d) Intercalation: The Δ-enantiomer of [Ru(bpy)₂(dppz)]2⁺ shows planar dppz ligand intercalation between base pairs, stabilising the duplex (PDB: 4E1U) (Song et al., Reference Song2012). (e) Semi-intercalation: The TAP ligand of Λ-[Ru(TAP)₂dppz]2⁺ kinks the DNA at a GG/CC step from the minor groove. (f) Metallo-insertion: The Δ-[Rh(bpy)₂chrysi]3⁺ inserts into a single base mismatch from the minor groove, ejecting the mismatched base and replacing it in the stack (PDB: 2O1I) (Pierre et al., Reference Pierre2007). DNA bases use the conventional colour scheme of adenine – red, thymine – blue, guanine – green, cytosine – yellow.

Covalent binding
This mode of interaction requires a covalent bond between the ligand and the DNA molecule. Nonspecific covalent binding can take place on the phosphodiester backbone or sugar residues. There has been particular emphasis on studies of binding to particular sites on DNA bases by drugs that undergo nucleophilic reactions. Purines are the most susceptible to covalent attack, with guanine being preferred over adenine. Particularly favoured sites are O6 (guanine), N6 (adenine), and N7 in the major groove and N1, N2 (guanine), and N3 in the minor groove. These site preferences result from the differing electronic charge distributions in bases and base pairs. The square planar cis-[Pt(NH3)2Cl2], or cisplatin, is one of the most well-known small molecules capable of binding DNA through covalent bonds (Figure 7a), forming the basis of some of the most widely used and effective anticancer drugs today (Ohndorf et al., Reference Ohndorf1999).
Groove binding
Minor groove binders are a distinct category of organic ligands, binding by hydrophobic association in the minor groove of the helix via hydrogen bonding to the base pair edges, electrostatic interactions, or van der Waals interactions with the minor groove walls (Figure 7b). They generally show a preference for binding to A/T regions of DNA, and they do not significantly perturb DNA structure, as shown by the interaction with the DDD sequence and its variants. For a very recent example, see PDB code 9FT8. These molecules bind exclusively in the minor groove of B-DNA duplexes, and they can function as simple blockers of transcription or as inhibitors of DNA topoisomerase enzymes.
Electrostatic interaction
The binding force behind this mode is the electrostatic attraction between the positive charge of a complex and the negatively charged DNA polyanion. As an example, Triplatin NC (Figure 7c) is a multifunctional DNA ligand featuring three cationic platinum centres that engage in electrostatic interactions with phosphate oxygen atoms, thereby associating primarily with the DNA backbone (Komeda et al., Reference Komeda2006). This binding mode is the least common but has also been proposed as the method of interaction for small compounds such as [Ru(bpy)3]2+ with duplex DNA. Other examples of molecules that can bind through electrostatic interaction are polyamines such as spermine and spermidine, metal ions such as Mg2+, Ca2+, and Mn2+, and histones.
Metallo-intercalation, semi-intercalation, and metallo-insertion will be further discussed in more detail in the following sections.
Intercalative binding by octahedral metal complexes
This binding mode requires the intercalation of generally planar cationic polycyclic aromatic systems between the stacked base pairs of DNA, as shown in Figure 7d, here as part of an octahedral metal complex, with the cationic charge at the metal centre. Representative three-dimensional structures of metallo-intercalators, specifically ruthenium polypyridyl complexes, are shown in Figure 8. Intercalation increases the separation of adjacent base pairs from ~3.4 Å to ~6.8 Å, and the resulting helix distortion is compensated by adjustment in the sugar-phosphate backbone and by a local unwinding of the duplex (Hall et al., Reference Hall2013b).
Structural representations of two related ruthenium polypyridyl complexes. (a) Λ-[Ru(bpy)2dppz]2+ and (b) Λ [Ru(phen)2dppz]2+. Both complexes feature the dppz (dipyrido[3,2-a:2′,3′-c]phenazine) ligand, which serves as the intercalating unit. The ancillary ligands differ in their hydrophobic surface area: bpy (2,2′-bipyridine) has a smaller and more flexible hydrophobic surface, while phen (1,10-phenanthroline) is more rigid and planar, contributing to a larger hydrophobic surface and stronger stacking interactions with DNA components.

A sub-category of intercalation is semi-intercalation (kinking), shown in Figure 7e. We first demonstrated this type of non-covalent interaction for ruthenium complexes using X-ray crystallography by crystallising the Λ-[Ru(TAP)2dppz]2+ with the d(TCGGCGCCGA) oligonucleotide (Hall et al., Reference Hall2011). TAP (tetraazaphenanthrene) is the photooxidising but isostructural phen analogue. In this structure, the TAP ligand semi-intercalates at the GG/CC step, kinking the DNA by 51˚. The overall structure is stabilised by a barium ion and its interactions with the N7 of guanine of G3 and O6 of guanine G4 in the major groove. We later showed this binding mode for the phen analogue (Niyazi et al., Reference Niyazi2012) and for the delta enantiomer (Hall et al., Reference Hall2016a).
Prior solution studies
The binding mode for rac-[Ru(bpy)2dppz]2+ and rac-[Ru(phen)2dppz]2+ complexes was assumed to be intercalation, and two binding orientations of the dppz complexes were initially proposed: head-on and side-on intercalation. The DNA major groove for these metallo-intercalators was initially proposed as the intercalation site (Hartshorn and Barton, Reference Hartshorn and Barton1992; Jenkins et al., Reference Jenkins1992). Investigations led by Nordén provided clarification regarding the binding mode between [Ru(phen)3]2+ and DNA, where semi-intercalation was demonstrated as the more accurate term to denote this interaction (Lincoln and Nordén, Reference Lincoln and Nordén1998). This group has put considerable effort into unravelling the binding geometry and specific binding groove of [Ru(LL)dppz]2+ and enantiomers (Hiort et al., Reference Hiort1993; Tuite et al., Reference Tuite1997).
Nordén et al. reported the first high-yield synthesis of the enantiomerically pure Δ- and Λ-enantiomers of [Ru(phen)2dppz]2+ (Hiort et al., Reference Hiort1993). These enantiomers were investigated by spectroscopic techniques such as circular dichroism, confirming intercalative binding by the observation of increased hyperchromicity and red shift in the intra-ligand π → π* transition of the dppz chromophore. The higher binding affinity compared to the parent compound [Ru(phen)₃]2⁺ further supported intercalation as the predominant binding mode. A second important result, from linear dichroism, revealed that each enantiomer exhibited either a single binding geometry or, if multiple binding modes were present, they occurred in similar proportions, as determined by titration. Subsequent titration studies demonstrated similar DNA binding for both enantiomers, while luminescence experiments revealed different quantum yields in the presence of calf thymus (CT) DNA. The Δ-enantiomer gave a quantum yield 6–10 times larger than that of the bound Λ-enantiomer, and this phenomenon has been subsequently seen in many experiments using fixed-sequence oligomers such as those used in X-ray crystallographic work (Hall et al., Reference Hall2013b).
Further studies employing modified phage T4-DNA were carried out to investigate the [Ru(phen)2dppz]2+ binding site (Tuite et al., Reference Tuite1997). Phage T4-DNA (wild type) variant, featuring 5-hydroxymethyl cytosine instead of cytosine, exhibited glycosylation at the 5-CH2-OH position (Figure 9a). This modification leads to significant hindrance in the major groove, creating a significant obstruction to intercalation from that groove.
(a) DNA modification in phage T4 showing C-containing DNA (left), HMC-containing DNA (middle), and glc-HMC DNA (right). (b) Emission titration graph of Δ- and Λ-[Ru(phen)2dppz]2+ in the presence of T4-DNA and CT-DNA. DNA concentration was fixed at 7.5 μM in 5 mM phosphate buffer (pH 6.9), with samples equilibrated for 10 minutes prior to measurement. Excitation was at 480 nm, and emission was recorded at 618 nm at 30 °C. The results indicate enantioselective differences in binding affinity and luminescence enhancement depending on DNA composition (Tuite et al., Reference Tuite1997).

Emission titration experiments showed comparable saturation points for the Δ-enantiomer with both nucleic acids (CT-DNA and T4-DNA), suggesting that the complex does not bind from the major groove of T4-DNA (Figure 9b). While saturation of the Λ-enantiomer was less distinct, the curves display similar changes in slope at similar [Ru]/[DNA] ratios as those of the Δ-enantiomer. Consequently, this experiment conducted by Nordén et al. strongly indicated that [Ru(phen)2dppz]2+ interacts with the minor groove rather than the previously assumed major groove. These findings contradicted the results of 1H-NMR experiments conducted by Barton et al. to determine the binding groove of ruthenium polypyridyl complexes (Dupureur and Barton, Reference Dupureur and Barton1994).
Given the high level of interest in metal complexes containing the dppz organic ligand, Thomas et al. undertook an initial exploration of the photophysical and DNA binding properties of the dppz ligand alone (Phillips et al., Reference Phillips2004). The use of absorption titrations and viscosity measurements suggested an intercalative binding mode for this aromatic organic ligand. In particular, it exhibited an intercalative binding preference for poly(dG)•poly(dC) DNA sequences compared to CT-DNA and poly(dA)•poly(dT) DNA. Next, isothermal titration calorimetry allowed a comparison of the binding affinity of this organic moiety against [Ru(bpy)2dppz]2+ and [Ru(phen)2dppz]2+, showing the dppz ligand alone to have ~100-fold weaker binding strength, as shown in Table 2. In this example, and more generally, there is experimental evidence for the assumption that one role of the Ru(+2) positive charge is to neutralise the phosphate negative charge of the DNA backbone. This charge neutralisation effect is a key characteristic of strong intercalators. By analogy with the known Actinomycin D structure, it was suggested that intercalation should be from the minor groove.
Summary of thermodynamic parameters derived from ITC studies for binding of 1 (dppz ligand alone) and Δ- and Λ-[Ru(phen)2dppz]2+ (data for metal complexes)

Data reflect differences in binding affinity and thermodynamic driving forces between the organic ligand and the enantiomeric metal complexes.
Structural studies
Ru-dppz complexes. In 2011, our research group (the Cardin group, in collaboration with John Kelly in Trinity College Dublin) determined the first X-ray crystal structure detailing the interaction between a ruthenium(II) polypyridyl complex and DNA (Hall et al., Reference Hall2011). Specifically, the crystallisation process involved Λ-[Ru(TAP)2dppz]2+ in conjunction with the palindromic sequence d(TCGGCGCCGA), as seen in Figure 10. Here, each ruthenium complex is bound simultaneously to two duplexes through two non-covalent different binding modes in a 1:1 (complex: single strand) stoichiometry. These crystallographic analyses showed in atomic detail the DNA intercalation binding mode exhibited by the dppz ligand, precisely at the G9-A10 bases. The outcomes corroborated the findings from preceding spectroscopic investigations conducted by Nordén, Lincoln, and collaborators. Notably, it was observed that at the site of intercalation, the T1-A10 base pair displayed a reverse Watson–Crick hydrogen bonding pattern (Figure 10a). Interestingly, the way the molecule inserted itself (intercalated) into the DNA structure was unusual since, in this initial study, there was base flipping at the intercalation base pair by the terminal adenine. Nonetheless, this was the first time crystallographic evidence showed that a Ru-bound dppz ligand could intercalate from the minor groove of DNA. A notable feature of the structure was the semi-intercalation binding mode induced by the TAP ligand at the G3-G4 step. This interaction resulted in a pronounced kink of the DNA by ~51˚. The presence of barium cations, found to be coordinated to the N7 of guanine G3 and O6 of guanine G4 in the major groove, was a clear early requirement for crystal growth in this system, but subsequent work showed that it was not generally necessary.
Crystal structure of the DNA–metal complex formed between the decamer sequence d(TCGGCGCCGA) and Λ-[Ru(TAP)₂dppz]2⁺, illustrating a unique semi-intercalative binding mode (PDB: 3QF8) (Hall et al., Reference Hall2011). (a) Overall view of the duplex showing the base pairing at the termini, particularly the reversed Watson–Crick hydrogen bonding between A10 and T1. (b) View into the minor groove of the assembly, highlighting semi-intercalation. The flipped-out adenine A10 can be seen stacking onto the dppz ligand. Base colouring scheme: thymine (blue), adenine (red), cytosine (yellow-orange), and guanine (green).

In the same way as the intercalation by Λ-[Ru(TAP)2dppz]2+, Λ-[Ru(phen)2dppz]2+ binds at the corresponding site when interacting with two distinct self-complementary sequences: d(CCGGTACCGG) and d(CCGGATCCGG). This investigation, conducted within our laboratory, yielded crystallographic evidence illustrating the manner in which ‘light-switch’ complexes engage in intercalation from the minor groove through two distinct binding modes: head-on (specifically at the central TA/TA step) and side-on intercalation, and confirmed that, for structural purposes, the phen and TAP ligands can be treated as isostructural. Additionally, the study highlighted the occurrence of semi-intercalation facilitated by the phen ligand with the same kinking geometry as seen with TAP (Niyazi et al., Reference Niyazi2012). Thus, phen and TAP are isostructural as far as DNA kinking is concerned, too.
The dppz ligand was found to intercalate with a perpendicular orientation – sometimes called head-on intercalation- at the TA/TA central step within the d(CCGGTACCGG) sequence (Figure 11a).
Assembly of duplexes. (a) Structure of d(CCGGTACCGG) with Λ-[Ru(phen)2dppz]2+. From left to right: Top and side view of TA/TA intercalation site (head-on intercalation) (PDB: 3 U38) (Niyazi et al., Reference Niyazi2012). (b) d(CCGGATCCGG) duplex containing ruthenium complex intercalated at the C1C2/G9G10 (side-on intercalation) and semi-intercalated at the G3G4/C7C8 step (PDB: 4E7Y) (Niyazi et al., Reference Niyazi2012).

At the TA/TA step, the dppz ligand exhibited deep intercalation into the DNA, with the ruthenium atom approximately 5 Å distant from the helix axis, protruding into the major groove. This is illustrated in Figure 11a, where thymine is shown in blue and adenine in red. An increase in the local base pair twist angle was noted, arising from the natural B-DNA value of 36˚–40˚ at this specific interaction site. In subsequent unpublished work, it was found that, taking all 10 possibilities for the central step in these decamer sequences, binding in the crystal was only found at this TA/TA step; therefore, this is a unique example of perpendicular (head-on) intercalation. No interaction was observed at the AT/AT steps of d(CCGGATCCGG), as shown in Figure 11b.
In later work, intercalation at the CC/GG step was seen to be shallower, with the ruthenium atom being 6 Å distant from the helix axis. The 2-NH2 substituent of the guanine base limits intercalation, and a ‘side-on’ intercalation is observed (Figure 11b). This type of interaction is identical for both palindromic sequences, resulting in a 10˚ untwisting of the helix and showing the consistency of binding. An important contribution to the angle of intercalation is determined by a secondary stacking interaction between the phen or TAP ancillary ligand and the 2´-deoxyribose sugar of one of the four bases forming the intercalation cavity. The bpy analogue does not crystallise, suggesting, as pointed out earlier, that the large flat surface of the phen ligand plays an unexpectedly important role in binding. Another shared characteristic was the observed semi-intercalation of the phen ligand at the G3G4/C7C8 step (Figure 11a), already mentioned.
Since then, many crystal structures of ruthenium polypyridyl complexes binding to DNA have been determined, recently extended to G-quadruplex DNA. This aspect is summarised in our recent review of metal complex binding to G-quadruplexes (Prieto Otoya et al., Reference Prieto Otoya2024a). These later studies collectively show a consistent mode of minor groove intercalation as the preferred groove of binding in the crystal. Subsequent structural investigations enable a detailed comparative analysis of the binding modes exhibited by the two enantiomers, Λ and Δ, of the ‘light-switch’ complex [Ru(phen)2dppz]2+.
In the first of these follow-up studies in the Cardin group, using a racemic mixture, crystallisation involving the d(ATGCAT) palindromic sequence revealed for the first time, and still the only example, of distinct binding orientations for each enantiomer, with intercalation from the minor groove at the two TG/CA steps within the duplex, as shown in Figure 12 (Hall et al., Reference Hall2013b). Notably, these angular differences made the Λ-enantiomer more accessible to water than the Δ-enantiomer.
Comparison of the intercalation geometries adopted by the Δ- and Λ-enantiomers of the ruthenium polypyridyl complex [Ru(phen)₂dppz]2⁺ when bound to the self-complementary DNA sequence d(ATCGAT) (PDB: 4JD8) (Hall et al., 2013b). The Δ-enantiomer is depicted in blue, and the Λ-enantiomer in grey. Both enantiomers have a dppz ligand intercalated between base pairs, but their orientation relative to the DNA grooves differs significantly. (a) Δ and (b) Λ-[Ru(phen)₂dppz]2⁺: Top, front, and side views illustrating the intercalative geometry and base stacking interactions. Base colouring: thymine (blue), adenine (red), cytosine (yellow-orange), guanine (green). This comparison highlights the stereoselectivity of DNA binding for enantiomeric metal complexes.

This structure allowed a direct comparison between the binding geometries for the Λ- and Δ-enantiomers. The former exhibited an almost perpendicular yet asymmetrical intercalation, while the latter displayed an intercalation with an angled orientation. Furthermore, given that this intercalation originates from the minor groove, one influential factor governing the depth of intercalation is seen to be the presence of the 2-NH2 functional group of guanine. In this structure, the two metal complexes are close enough that we can say that they are not independent of each other, because of the interaction between the phen ancillary ligands. This effect could well be minimised if the bpy analogues were used, but no crystals could be obtained to verify this.
These different binding geometries are important to explain the luminescence lifetime and intensity of the ‘bright’ state of the MLCT excited state. This lifetime was first proposed to be inversely related to the number of hydrogen bonds that the dppz pyrazine nitrogen atoms are able to form with solvent molecules (Olofsson et al., Reference Olofsson2004a, Reference Olofsson2004b). Thus, no luminescence is observed when either of the nitrogen is H-bonded to the solvent. The luminescence is, therefore, sensitive to changes in the orientation of the complex and the solvent environment of the compound.
While several X-ray crystallographic structures containing the Λ-enantiomer are available, only two structural studies showing how the Δ-enantiomer on its own can bind to well-matched DNA in the absence of an adjacent Λ complex are available (Hall et al., Reference Hall2016a). These structures show the Δ-[Ru(phen)2dppz]2+ bound to d(TCGGCGCCGA), which mainly differ in the presence either of Ba2+ or hexamine cobalt at the semi-intercalation site.
Substituted dppz derivatives. Upon realising that the typical binding mode for these complexes involves angled intercalation from the minor groove, particularly at the CG/CG steps for both enantiomers, a series of studies was undertaken to investigate asymmetrically substituted dppz ligands. In this way, the chirality of the metal centre is combined with asymmetry in the intercalating ligand.
The initial study aimed to crystallise the palindromic sequence d(TCGGCGCCGA) with the 11-Cl substituted dppz complex of Λ-[Ru(TAP)2dppz]2+(Hall et al., Reference Hall2013a). The resulting X-ray crystal structure was close to that previously seen, with the influence of the chlorine substitution evident in two ways: the Cl substituent was disordered unequally over the two possible sites, and there was a distinct water network associated with the Cl. The electronic effect of chloro substitution on the pyrazine N makes it a better electron-pair donor to bound water, perhaps.
As a follow-up study, different patterns of methyl substitution on the terminal dppz ring (positions 10–13) were examined, and in this case, there was complete ordering and very high-quality X-ray data (Figure 13). The pattern was straightforward: the Me group was always in the more hydrophobic site (Hall et al., Reference Hall2015).
(left) Structure of Λ-[Ru(TAP)2(dppz)]2+ illustrating the TAP and dppz numbering schemes (top) and positions of methyl substitution on the dppz group for the complexes reported here (bottom). Methyl-substituted variants of Λ-[Ru(TAP)2(dppz)]2+: (a) dppz-10-Me; (b) 10,12-Me2; (c) dppz-11-Me; and (d) dppz-11,12- Me2. In each panel, the methyl groups are shown in yellow, and the other residues are coloured as: thymine, blue marine; adenine, red; cytosine, yellow-orange; and guanine, green. Nitrogen atoms are shown in blue.

The crystal structures of these derivatives are isomorphic, displaying intercalation and semi-intercalation at the same base pair sites when compared to both the parent compound and the 11-Cl-dppz analogue. Notably, all four structures reinforce the message that intercalation is through the minor groove of DNA, maintaining an orientation and intercalation depth very close to the non-methylated parent compound. The introduction of methyl groups removes the twofold (spectroscopic C2) axial symmetry of the metal complex when placed asymmetrically along the dppz axis. Luminescence behaviour was not examined for [Ru(TAP)2dppz]2+, but the structural findings offer insight into how they might impact the behaviour of the structurally isomorphous ‘light-switch’ complex derivatives of [Ru(phen)2dppz]2+. Thus, the methyl substitution at position 10 of dppz shields the dipyridophenazine nitrogen from water quenching, while exposing the opposing N. Substitution at positions 10 and 12 of dppz generates the same layout. Conversely, methylation at position 11 of dppz does not provide this protective effect. Instead, it directs the dppz towards the purine side of the DNA cavity. In each case, the overall effect is determined by the hydrophobicity of the methyl group.
In 2004, 7 years before any structural information was available, Lincoln and coworkers had studied the luminescence properties of the enantiomers of both [Ru(phen)2(10-Medppz]2+ and of [Ru(phen)2(11,12,diMedppz]2+, to account for the remarkable luminescence enhancement bound to poly(dA-dT) and in organic solvents (Olofsson et al., Reference Olofsson2004b), showing that this effect could be ascribed to entropy, in this case, an assumed disruption of the ordered water around the bound complex compared to the unsubstituted dppz. Indeed, in our structural work, despite having some of the highest resolution data ever measured on oligonucleotide crystals, there was no ordered water around the intercalated ligand, even though 91 water molecules per DNA strand could be located.
The intercalation binding site and the binding geometry are completely consistent with the parent compound, and the completely ordered binding is in contrast to that seen with both halide and cyano substitution. With [Ru(TAP)2(11-Cl-dppz)]2+, as already seen, the chloro substituent is disordered over two sites with only partial directional preference. Subsequently, the analogous Λ-11-nitrile(=cyano) derivative of the parent compound Λ-[Ru(TAP)2dppz]2+ was crystallised with the self-complementary sequence d(TCGGCGCCGA) (McQuaid et al., Reference McQuaid2018). This crystal structure gives the first example of a complete TC/GA cavity at this terminal intercalation step, suggesting that the addition of the cyano group generates additional favourable π-orbital overlap, stabilising the intercalation cavity generated by the TA step. The electro-withdrawing effect of the -CN group on the ligand presumably polarises the dppz, relocating π-electron density away from the interacting π orbitals and generating a stronger donor–acceptor interaction with the adjacent purine bases. The analogue Λ-[Ru(TAP)2(11-Br-dppz)]2+ was crystallised with the same sequence seen previously (PDB: 6GLD). Its structure was found to be isomorphous to that of the Λ-[Ru(TAP)2(11-Cl-dppz)]2+, featuring a flipped-out A10 base stacked upon a symmetrical equivalent dppz ligand. However, unlike the effect observed with the -Cl substituent, no water network is present around the -Br position in this structure. Additionally, Λ-[Ru(TAP)2(11,12-diCN-dppz)]2+ was also crystallised with the same self-complementary sequence. In this case, the -CN groups protrude into the solvent cavity from the major groove of DNA without overlapping with the DNA bases, and the nitrile groups are not contained within the DNA base stack.
We include a list of structures deposited in the Protein Data Bank (PDB) featuring ruthenium polypyridyl complexes bound to various DNA sequences. The table includes PDB ID, entry title, release date, and resolution (in Ångströms).
In summary, even quite small and simple substitutions produce clear structural differences and should affect solution behaviour. These structures distinguish the hydrophobic effect of the methyl group, which leads to clear ordering, from that of the electron-withdrawing and polar -Cl, -Br, and -CN substituents in the same 11-position, which give partial ordering only and, depending on the resolution limit of the X-ray data, some useful information about water ordering around these polar substituents. For a complete list of structures related to this topic, see Table 3. Any structure of interest can be immediately retrieved from the PDB or NAKB using the four-letter code. The resolution limit can be a useful guide to the quality of the data – a lower number means the X-ray data were measured to a higher degree of precision, usually increasing the information content of the data. The PDB website allows the recalculation of the deposited density on-the-fly, allowing detailed inspection of ligand binding sites, as in the example already mentioned of the 11-Br derivative, which is an otherwise unpublished piece of work from the Cardin group, yet a readily accessible structural result for those interested, with complete measured X-ray intensities.
Summary of X-ray crystal structures of ruthenium complexes bound to DNA

Major groove interaction
Two crystal structures of octahedral metal complexes metallo-intercalated from the DNA major groove in fully matched duplex DNA are available: the rhodium complex Δ-α-[Rh(Me₂trien)phi]3⁺ and the ruthenium complex Λ-[Ru(phen)₂phi]2⁺ (PDB: 454D and 8OYR), shown in Figure 14 (Kielkopf et al., Reference Kielkopf2000; Prieto Otoya et al., Reference Prieto Otoya2024b). Both metal complexes contain the phi (9,10-phenanthrenediimine) as an intercalating ligand.
Structural Comparison of Major Groove Intercalators: Rh(III) versus Ru(II) Complexes Depiction of Λ-[Ru(phen)₂phi]2⁺ (a) and Δ-α-[Rh(Me₂trien)phi]3⁺ (b) intercalated in the major groove of DNA, highlighting the distinct binding modes, ligand orientations, and major groove interactions (bottom, seen from the minor groove).

The ruthenium complex, Λ-[Ru(phen)₂phi]2⁺, represents the first documented example of major groove intercalation by a polypyridyl metal complex reported by the Cardin group. The complex intercalates symmetrically at TA/TA steps within a self-complementary DNA decamer d(CCGGTACCGG) (PDB: 8OYR). Unlike classical minor groove intercalators, the Λ-Ru complex positions itself in the major groove at the central TA/TA step, where the phi ligand stacks between thymine and adenine base pairs without forming direct hydrogen bonds, compared to the rhodium complex. Instead, the binding is driven primarily by π-stacking interactions, effectively guiding the planar phi ligand into the relatively low-stacking-energy TA steps.
Interestingly, the ruthenium complex demonstrates a preference for TA-rich sequences, particularly TATA motifs, which are known for their conformational flexibility and lower thermal stability. Biophysical studies showed that the Λ-[Ru(phen)2phi]2+ complex increased the melting temperature (TM) of DNA duplexes containing TATA sequences by nearly 20 °C, indicating significant stabilisation through π-stacking interactions. This sequence-selective stabilisation is noteworthy as it suggests a potential strategy for targeting promoter regions and transcriptional regulatory elements that are TA-rich (TATA-box).
In contrast, the rhodium complex, Δ-α-[Rh(Me₂trien)phi]3⁺, demonstrates a distinct binding strategy that relies on hydrogen bonding to achieve sequence selectivity, as shown in Figure 14b (PDB: 454D). Unlike the ruthenium complex, which intercalates without forming direct base contacts, the Rh complex utilises its axial amine groups to form specific hydrogen bonds with guanine O6 atoms at the 5’-TGCA-3′ step. This site is characterised by GC-rich flanking sequences, which provide optimal hydrogen bond acceptors for the axial amine groups, stabilising the complex through directed base interactions.
The rhodium complex intercalates at the TGCA site with a notably different geometry compared to the ruthenium complex. Rather than inserting symmetrically, it adopts a more canted orientation, with the phi ligand slightly angled relative to the base pairs. This angled insertion facilitates hydrogen bonding while maintaining stacking interactions with the flanking base pairs. The DNA helix undergoes minimal overall distortion, maintaining its B-form conformation with slight unwinding at the intercalation site.
Moreover, the photoreactivity of the [Rh(phen)2phi]3+ complex further distinguishes it from its ruthenium counterpart (Sitlani et al., Reference Sitlani1992; Turro et al., Reference Turro1998). Upon exposure to UV light, the rhodium complex can abstract a hydrogen atom from the 5′-carbon of the deoxyribose ring at the intercalation site, leading to site-specific DNA strand scission. This photochemical cleavage capability provides a mechanism for DNA modification that is both sequence-specific and spatially controlled, using the high binding affinity and precise hydrogen-bonding network established within the major groove. In contrast, the Ru(phen)2phi]2+ complex is not inherently photoactive, instead stabilising DNA through non-covalent interactions without inducing strand cleavage.
The contrasting modes of interaction observed for these two metallo-intercalators underscore the impact of structural modifications on groove selectivity and DNA binding geometry. While both complexes employ the phi ligand as the intercalating moiety, their ancillary ligands – phenanthroline in the Ru complex and Me₂trien in the Rh complex – determine the distinct modes of groove interaction and sequence selectivity. The planar intercalation of the ruthenium complex at TA sites, driven primarily by π-stacking, highlights the potential for sequence-selective stabilisation of TA-rich promoter regions. In contrast, the Rh complex exemplifies the capacity for base-specific recognition through hydrogen bonding, reminiscent of protein-DNA recognition motifs.
These findings collectively illustrate the versatility of phi-containing metallo-intercalators as DNA-targeting agents, for therapeutic applications and structural probes. By selectively targeting distinct DNA sequences and grooves, these complexes suggest designs of next-generation metallo-intercalators capable of sequence-specific recognition and stabilisation of DNA duplexes. This dual approach – π-stacking for structural stabilisation and hydrogen bonding for sequence recognition – is a rational one for the design of DNA-targeted therapeutic agents.
Metallo-insertion
The degradation or wrong placement of nucleotide bases, due to chemical processes or errors in polymerase reactions, can result in the formation of defective double-stranded DNA. Such defects, comprising damaged nucleotides and mismatched base pairs, foster the emergence of non-standard structures that lead to genetic mutations and subsequent genetic disorders. The development of molecules capable of identifying DNA mismatches was, therefore, an attractive idea, with the detection of mismatched base pairs within DNA by luminescence enhancement as one goal. Over the past two decades, considerable efforts have been dedicated to designing, synthesising, and analysing metal complexes intended to target mismatched sites within DNA. Structural data can aid the process by highlighting the key interactions.
The specific binding mode discovered between the DNA mismatch site and an octahedral metal complex is now called metallo-insertion (Figure 15). Metallo-insertors, similar to metallo-intercalators, possess a planar aromatic ligand that becomes part of the base stack upon binding to DNA. However, unlike metallo-intercalators that unwind and cause an increase in the DNA rise parameter, metallo-insertors bind from the minor groove of a double-stranded DNA, displacing the bases of a single base pair and acting as their π-stacking replacement. Thus, the overall length of the stack is not increased. Structural analyses are essential to understanding the structural changes, since they reveal in atomic detail the structural basis for recognising the sites in DNA. Crystal structures can also illustrate how mismatched versus matched sites may be distinguished and the difference between these two binding modes.
Comparison of the structural geometries of three distinct DNA-binding modes involving metal complexes: (a) semi-intercalator, (b) metallo-intercalator, (c) metallo-insertor. Each panel shows dimensions (in Å) of the intercalating ligand’s planar system and the spatial arrangement of the ancillary ligands, highlighting the steric and electronic differences that influence DNA recognition and binding specificity.

Currently, only five crystal structures with octahedral metal complexes bound to DNA mismatches are accessible on the Protein Data Bank (PDB) website, typically of the Δ enantiomer. One of the main reasons is that X-ray crystallography requires the growth of high-quality single crystals for diffraction, which can be challenging due to factors such as solubility, purity, and ability to form a well-ordered lattice (Table 4).
Reported X-ray crystallographic structures of monomeric ruthenium complexes bound to single DNA mismatch base pairs by metallo-insertion

The search for a metal complex which recognises DNA mismatches
The earliest observations of small organic molecules engaging in an ‘insertion’ interaction with DNA were conducted by L. S. Lerman and colleagues in 1960 (Lerman, Reference Lerman1961). They pioneered the recognition of intercalation with acridine-DNA and postulated an alternative mode of non-covalent binding termed insertion. This binding mechanism results in the displacement and separation of the single mismatched base pair. Initial investigations into the binding of metal complexes to DNA mismatches were primarily conducted using complexes of rhodium and ruthenium. The design principle of these complexes, diverging from traditional metallo-intercalators, was based on the use of bulkier ligands. In this context, a wider variant of the phi ligand (Figure 15b) was used, based on chrysene, the chrysi ligand (Figure 15c). Chrysi is dimensionally larger, being 0.5 Å wider than a standard base pair and 2.1 Å broader than the phi ligand. Consequently, this increased size should prevent intercalation at well-matched DNA sites due to spatial conflicts with the DNA’s sugar rings. However, this characteristic size should make it ideally suited for the recognition of mismatched sites in the DNA sequence.
Solution studies
An initial exploration into the design of octahedral metal complexes specifically aimed at targeting singular DNA mismatches used a rhodium-based complex ion [Rh(bpy)2(chrysi)]3+ (Jackson et al., Reference Jackson1999a; Jackson and Barton, Reference Jackson and Barton2000). Rh(III) complexes were known to identify and cleave CA and AA mismatches through an insertion mechanism originating from the DNA minor groove, but had the disadvantage of being non-emissive. Consequently, despite these bulky complexes showing high specificity in targeting these lesions, they are not useful as luminescent probes for single DNA mismatches. Following on, the strategy of using bulky ligands to identify thermodynamically and kinetically destabilised base pairs was adapted for the well-established ruthenium polypyridyl complexes (Ruba et al., Reference Ruba2004). Some of the ligands used are illustrated in Figure 16. The aim was to develop a luminescent octahedral metal complex with a specific affinity for single DNA mismatches. Ideally, fluorescent small molecules could be engineered to target single-base mismatches preferentially, even in living cells.
Structures of representative ruthenium polypyridyl complexes and associated ligands used for selective recognition of DNA mismatches. (a) [Ru(bpy)₂tpqp]2⁺ and (b) [Ru(bpy)₂tactp]2⁺ incorporate extended aromatic ligands that enhance base-pair selectivity through steric and π-stacking interactions. These ligands are designed to exploit structural distortions at mismatched sites within the DNA duplex. (c) Core structures of commonly used bulky ligands, chrysi, pqp, tpqp, and tactp, varying in size, planarity, and hydrophobic surface area.

Ruthenium complexes incorporating phenanthrenequinone diimine (phi) do not exhibit luminescence at ambient temperature, a characteristic similarly observed in ruthenium complexes containing chrysi. Consequently, this led to the strategic selection of ligands that coordinate to the metal centre via a phenanthroline moiety, chosen for their favourable luminescence properties. In the context of this study, ligands such as Tpqp, Pqp, and Tacp were utilised (Figure 16). It was observed that the complex [Ru(bpy)2(pqp)]2+ exhibited no detectable luminescence, irrespective of the presence or absence of DNA. However, the Tpqp and Tacp ligands demonstrated specificity in targeting CC mismatch sites. Nonetheless, challenges were encountered concerning their luminescent properties. For instance, the complex [Ru(bpy)2(tpqp)]2+ displayed only a marginal enhancement in luminescence upon binding, so it probably does not intercalate. In contrast, the luminescence enhancement observed in [Ru(bpy)2(tactp)]2+ appeared to be correlated not solely with binding to DNA but also with its tendency to self-stack in aqueous environments. Despite these pioneering ruthenium complexes engineered for the detection of single DNA mismatches, there remains a necessity for further improvements.
This concept of employing bulky ligands was integral to the design of one of the first ruthenium complexes investigated for targeting DNA single mismatches, specifically [Ru(bpy)2(eilatin)]2+ (Zeglis and Barton, Reference Zeglis and Barton2008) (Figure 17). This complex, characterised by its incorporation of a bulky ligand, eilatin, which is 2.0 Å wider than the chrysi ligand, was empirically demonstrated to have the capability to bind to CC mismatch sites, determined by photocleavage competitive experiments. However, the selectivity exhibited by [Ru(bpy)2(eilatin)]2+ was found to be lower than that of [Rh(bpy)2chrysi]3+.
Representative structures of bulky rhodium(III) metal complexes specifically designed for the selective recognition and binding of single-base mismatches in DNA duplexes. These complexes feature large planar aromatic ligands that facilitate insertion at mismatched sites by stabilising extruded bases through π-stacking interactions. Shown are the extended ligands chrysi, phi, phzi, and eilatin, along with their corresponding Δ-[Rh(bpy)₂(L)]3⁺ complexes (L = chrysi, phi, phzi, or eilatin). The large surface area of these ligands, as well as their rigid geometry, enables them to discriminate between matched and mismatched base pairs, particularly by insertion into thermodynamically unstable sites.

These experiments demonstrated that the mere incorporation of bulky ligands into the design of metal complexes does not, on its own, give the specificity needed for reliable mismatch recognition. [Ru(bpy)2dppz]2+, recognised as the initial ‘light-switch’ ion, was examined for this purpose (Lim et al., Reference Lim2009). Notably, the dppz ligand, characterised by its narrow and elongated structure in comparison to the chrysi ligand, appears to be an unconventional choice given that its dimensions do not seem conducive to metallo-insertion. Luminescence investigations conducted on 27-mer oligonucleotide duplexes, encompassing fully matched sequences as well as those containing a single mismatch or an abasic site, have elucidated the behaviour of [Ru(bpy)2dppz]2+. It was observed that this complex demonstrates a marked enhancement in luminescence upon binding to these specific nucleic acid structures, in contrast to its interaction with well-matched DNA strands. Notably, both the Δ and Λ isomers of the complex exhibited a pronounced increase in luminescence in the presence of DNA defects, as shown in Figure 18. The scope of this investigation was extended to include short hairpin oligonucleotides with intentional base mismatches.
(a) Titrations of [Ru(bpy)2dppz]2+ with DNA containing defects. Top: DNA sequences of matched, mismatched, and abasic 27-mer duplex DNA (R denotes a tetrahydrofuranyl abasic site). Bottom: plots of the integrated emission intensity (λex = 440 nm) of rac-(left), Δ- (middle), and Λ-[Ru(bpy)2dppz]2+ (right) (100 nM) upon increasing the concentration of DNA in 50 mM NaCl, 5 mM Tris, pH 7.5. Error bars indicate standard deviations in the measurements. (b) Titrations of [Ru(bpy)2dppz]2+ with hairpin DNAs containing different mismatches. Top: hairpin DNA sequences. Bottom: plots of the integrated emission intensity (λex = 440 nm) of Δ-Ru (100 nM) with increasing concentrations of hairpin DNA containing mismatches: GG(○), GT (□), AT (●), AG(x), TT (+), CT (purple solid triangle), AC (green solid circle), AA (blue solid diamond), and CC (red solid square) in 50 mM NaCl, 5 mM Tris, pH 7.5. Error bars indicate standard deviations in the measurements (Lim et al., Reference Lim2009).

Experimental results indicated a threefold enhancement in luminescence intensity when the complex interacted with AA, AC, and CC mismatches, as shown in Figure 18. Intriguingly, the observed luminescence intensity of the complex in the presence of DNA containing a single mismatch appears to correlate directly with the thermodynamic destabilisation induced by the mismatch. In any case, the parent dppz complex does not bind selectively, so another approach is necessary. The functionalisation of the phen ligand with methyl groups gives the bulkier TMP (3,4,7,8-tetramethyl-1,10-phenanthroline). This modification enabled the synthesis of the [Ru(TMP)2dppz]2+ complex, illustrated in Figure 19a (Boynton et al., Reference Boynton2016). Notably, this complex, even as a racemic mixture, exhibited a preferential luminescence enhancement when interacting with mismatches, attributable to two key factors: firstly, the complex, even as a racemic mixture, demonstrates a significantly heightened binding affinity towards mismatches, quantified at 1.8 × 10⁶ M−1, in contrast to its affinity for well-matched base pairs, measured at 6.8 × 10⁴ M−1. Second, the excited-state emission lifetime of the ruthenium when bound to a DNA mismatch is notably prolonged, being 160 ns, compared to a substantially shorter duration of 35 ns when the complex is bound to a matched site.
(a) DNA sequences used in this study are shown on top. Bottom left: schematic of [Ru(Me4phen)2dppz]2+ and steady-state luminescence spectra of rac-[Ru(Me4phen)2dppz]2+ with the well-matched (blue) duplex and with the duplex containing a single base pair CC mismatch (red). (b) Samples were in 5 mM tris, 200 mM NaCl, pH 7.5. [Ru] = 2 μM, [DNA duplex] = 2 μM, λex = 440 nm. Plot of integrated emission intensity of [Ru-(Me4phen)2dppz]2+ (2 μM) with DNA hairpins (2 μM) containing a variable XY base pair. ‘R’ denotes a tetrahydrofuranyl abasic site. λex = 440 nm. Samples were prepared in 5 mM tris, 50 mM NaCl, and pH 7.5. Error bars indicate standard deviations of three replicates (Boynton et al., Reference Boynton2016).

Subsequent investigations show that the highest luminescence intensity is seen in the presence of the most destabilised CC mismatch, followed by the CA mismatch (Figure 19b). Conversely, only a marginal enhancement in luminescence is observed for the AA mismatch, which is inherently more stable compared to the mismatches mentioned above. Consequently, by incorporating methyl groups into the ancillary ligands of the [Ru(phen)2dppz]2+ framework, a luminescent ‘light switch’ complex that exhibits improved selectivity in identifying DNA mismatches has been synthesised. This heightened selectivity is attributed to a dual mechanism: a substantially increased binding affinity towards mismatched DNA and an extended excited-state emission lifetime when the complex interacts with a mismatch.
The findings of this study not only demonstrate the potential of ancillary ligand modification in crafting mismatch-specific transition metal complexes but also highlight the promising application of this complex as a diagnostic tool, particularly in the early detection of mismatch repair-deficient cancers. Although the result of this work was promising, no experiments to evaluate the enantiospecificity of such complexes have been done. In the next section, the role of the crystallographer in this area is highlighted, and a careful analysis of the structures could lead to new design ideas.
Structural studies towards understanding mismatch recognition
CA mismatches – The idea of recognising single mismatches by insertion and subsequent DNA cleavage has been well developed using rhodium and ruthenium polypyridyl complexes. The first structural information obtained of an octahedral metal complex and DNA mismatch upon binding was achieved by Barton et al. (Pierre et al., Reference Pierre2007). For this experiment, the delta enantiomer of an extended version of the phi ligand, chrysi, − Δ-[Rh(bpy)2chrysi]3+- was crystallised with the self-complementary sequence d(CGGAAATTCCCG), containing two CA mismatch sites, shown in Figure 20.
(a) structure of [Rh(bpy)2chrysi]3+, and (b) complete structure assembly of structure PDB: 2O1I (Pierre et al., Reference Pierre2007). Colour code used: Adenine, red; thymine, blue marine; cytosine, yellow-orange; and guanine, green.

In this crystal structure, two distinct modes of binding are clear: first, metallo-insertion via the minor groove, resulting in the ejection of the single mismatched base pair, and secondly, intercalation of the rhodium complex from the major groove at the matched site. The binding of Δ-[Rh(bpy)2chrysi]3+ through metallo-insertion from the minor groove leads to the displacement of both mismatched bases from the double helix, with the cytosine base protruding into the major groove, where it is positioned close to and perpendicular to the π-stacked bases of the helix, whereas the adenosine base forms a π-stacking interaction with one of the bipyridine ancillary ligands of the rhodium complex. Such a flipping out and stacking of bases is only possible geometrically with the delta enantiomer, an aspect deserving of greater attention, given that much solution work in the area has been done with racemic mixtures of the complex. The chrysi ligand is so deeply inserted into the DNA that it extends into the major groove, with the rhodium atom positioned 4.7 Å from the helix axis. What the authors did not expect at the time of the study was that an additional delta complex would intercalate at the central AT step occurs on the major groove side. Here, each bipyridine ligand π-stacks with the terminal CG base pair of two crystallographically related oligonucleotides. Later work would show that such mixed binding modes to a single duplex are the norm, and not the exception, as shown below (Song et al., Reference Song2012). In fact, intercalative binding to DNA by metallo-intercalators typically necessitates the insertion of a planar aromatic ligand into the DNA base stack.
There is a further lesson in this particular case. The independent ‘small molecule’ analysis of the crystal structure of a bound chrysi cation shows distinct geometry differences, notably the non-planar chrysi ligand (Komor and Barton, Reference Komor and Barton2014). The oligonucleotide-bound complex in the crystal structure shows planar ligands with shorter Rh-N distances, strongly suggesting the deprotonation of the coordinated chrysenediimine under the crystallisation conditions. A more detailed analysis is included as a separate section below, for those interested. It now seems clear that the intercalation at the well-matched site AT/AT in all structures is due to the deprotonation of one of the -NH imine groups of chrysi. This structural characteristic of Rh(III) containing chrysi complexes results in their lower pKa values when compared to their phi complex counterparts of Rh(III), as shown in Table 5. In every instance, the pKa value recorded for the chrysi-containing complexes was found to be between 0.6 and 1.2 units lower than that of the corresponding phi complex.
pKa values for phi and Chrysi complexes of Rh(III) determined by spectrophotometric titrations

aTitrations were performed at ambient temperature (˷25˚C) in deionised water. Errors in the reported values are estimated at +/− 0.2 by comparison of repeated trials (Jackson et al., Reference Jackson1999b).
The lower pKa value of [Rh(bpy)2chrysi]3+ facilitates the deprotonation of one of the hydrogen atoms of the chrysi ligand at pH 7, the pH used as the crystallisation condition for this complex, reported thus:
Conditions: SrCl2 40 mM, MgCl2 10 mM, Na-cacodylate 20 mM, spermine-4HCl 6 mM, MPD 5% (v/v) equilibrated against 35% MPD, pH 7.0, Vapour diffusion, sitting drop, temperature 298 K.
This phenomenon is evident in the previously mentioned crystal structure, where the chrysi intercalating ligand is observed in its deprotonated form as [Rh(bpy)2chrysi]2+, which differs from the original species [Rh(bpy)2chrysi]3+. In this structure, hydrogen bonding between the deprotonated form and a water molecule is noted (Figure 21). This situation contrasts with that for the mismatch site, where the chrysi complex is deeply embedded and shielded by the DNA structure from water molecules (Figure 21).
Selected views of intercalation by Δ-[Rh(bpy)₂chrysi]3⁺ at a well-matched AT/AT site (left) and a CA mismatch site (right) (PDB: 2O1I) (Pierre et al., Reference Pierre2007). At the well-matched site, the chrysi ligand intercalates from the major groove and is more exposed to surrounding water molecules, facilitating hydrogen bonding that can lead to its deprotonation. In contrast, metallo-insertion at the mismatch site shields the chrysi ligand from solvent exposure, offering greater protection against deprotonation.

AA mismatches – Δ-[Ru(bpy)2chrysi]3+ was subsequently crystallised in two separate instances with the self-complementary oligonucleotide sequence d(CGGAAATTACCG), which encompasses two adenine-adenine mismatch sites (Figure 22) (Zeglis et al., Reference Zeglis2009b). Both crystallisations were conducted under identical conditions, including temperature and environmental parameters. The key variables that differed between the two experiments were the concentration of the metal complex and the type of salt utilised. Despite utilising identical DNA sequences and complexes for crystallisation, a comparative analysis revealed several structural distinctions between Structures 1 and 2.
Complete structure assembly of Δ-[Rh(bpy)2chrysi]3+ interacting with the same self-complementary sequence containing two AA mismatch sites. (left) The structure highlights the ions sodium and chloride containing in the crystallisation condition for structure 1 (Zeglis et al., Reference Zeglis2009b).

Structure 1: 20 mM sodium cacodylate, 6 mM spermine, 4HCl, 40 mM KCl, 5% MPD, pH 7, Vapour diffusion.
Structure 2: 20 mM sodium cacodylate, 6 mM spermine, 4HCl, 40 mM NaCl, 5% MDP, pH 7, Vapour diffusion.
The principal difference between the two structures is the presence or absence of Δ-[Ru(bpy)2chrysi]3+ intercalated at the central 5′-AT-3′ step. This intercalation may cause the slight bending observed in the DNA structure, particularly in the former (3GSJ).
A second difference is the positioning of an adenosine within the AA mismatch base pair. In structure 2, one adenosine is observed protruding into the major groove, situated proximally and perpendicularly to the π-stack of the helix. On the other hand, adenosine engages in a π-stacking interaction with the bipyridine ancillary ligand of the rhodium complex. A similar configuration is observed in one of the insertion sites of structure 1. However, in the insertion site of structure 1, an ejected adenosine is π-stacked between the bipyridine ancillary ligand of the rhodium complex and the ejected adenosine in an intermolecular interaction.
The crystallographic studies illustrate the architectural hallmarks of metallo-insertion: irrespective of the mismatch type, the metal complex consistently approaches the DNA via the minor groove, ejects the bases from the helix, and substitutes the extruded base pair in the base stack with its own bulky ligand. This interaction results in minimal perturbation of the DNA structure beyond the immediate vicinity of the mismatch site.
Rhodium cation crystal structures and protonation states
The variations in structural and chemical properties, particularly in pK a values between the chrysi and phi ligands on rhodium complexes, explain why Δ-[Rh(bpy)2chrysi]3+ undergoes deprotonation at the AT/AT well-matched site. Given that the pKa of this complex is 5.7, and an equilibrium exists in solution (pH of the crystallisation condition used is 7) between deprotonated (2+) and protonated (3+) forms, the rhodium ion is more likely to be found in its deprotonated state in solution and at that specific binding site. Ruthenium complexes generally have higher pKa values than rhodium complexes (Table 5) and are not so affected.
This deprotonated state can be demonstrated by examining the bond lengths of the rhodium ion intercalated at the well-matched and mismatched sites and comparing those values to the bond lengths obtained from the crystal structure of the small molecule cation, rac-[Rh(bpy)2chrysi]3+ itself (Figure 23a).
Stick representation for Δ-[Rh(bpy)2chrysi]3+ in a) small molecule crystal (CCDC deposition number – 1241912) (Jackson et al., Reference Jackson1999b); b) as Δ-[Rh(phen)2chrysi]2+ intercalated at the well-matched AT/AT site of d(CGGAAATTCCCG)2; c) the same species inserted into the mismatched CA/CA site (PDB: 2O1I) (Pierre et al., Reference Pierre2007).

CA mismatch site (PDB: 2O1I) – the geometry of the bound complexes
Given the high data quality for structure PDB: 2O1I (data to 1.1 Å), the Rh-N distances of the rhodium complexes interacting at the CA mismatch site and at the AT/AT well-matched site can be compared.
Comparing the Rh-N2 and Ru-N4 bond lengths (Figure 23b,c, Tables 6 and 7), there is a decrease in such bond lengths of 0.2 Å and 0.185 Å, for Rh-N2 and Ru-N4, when the rhodium ion is intercalated at the well-matched site (Figure 23b and Table 7). This decrease in length, of approximately 10%, can be assigned to the loss of one proton from the imine NH-group of the chrysi ligand. Indeed, this proton has a pKa value of 5.2 in aqueous solution (determined by NMR), and the pH of crystallisation was 7.0, at which pH there will be more than 98% of the deprotonated form. Deprotonation of the -NH imine group of chrysi removes the steric hindrance to planarity, allowing intercalation.
Selected bond lengths from the small molecule dataset for Δ-[Rh(bpy)2chrysi]3+

Selected bond lengths (Å)

Δ-[Rh(bpy)2chrysi]3+ at (top) the well-matched AT/AT site and (bottom) the mismatched CA/CA site.
This decrease in bond length (around 3.5%) is less evident for the rhodium ion inserted at the CA mismatch site (Figure 23c, Table 7). Here, there is a decrease of approximately 0.071 Å and 0.085 Å for Ru-N2 and Ru-N4, respectively. The chrysi ligand would be expected to be nonplanar if still protonated at this site, but has been modelled as flat in the deposited structure (compare Figure 23a with Figure 23c).
AA mismatch site (PDB: 3GSJ and 3GSK) – the geometry of the bound complexes
For Δ-[Rh(bpy)2chrysi]2+ + d(CGGAAATTACCG), the resolution of the data is only 1.8 Å and 1.6 Å, but a similar pattern is seen (Table 8).
Selected bond lengths at the well matched site (Å)

Δ-[Rh(bpy)2chrysi]2+ at well-matched site AT/AT.
At the AT/AT well-matched site, there is a decrease in the bond length of Rh-N2 and Rh-N4 of the rhodium cation upon intercalation of approximately 10% (Figure 24, Table 9), comparable with that seen in the previous example.
Stick representation for Δ-[Rh(phen)2chrysi]2+ a) intercalated at the well-matched AT/AT site of d(CGGAAATTACCG). PDB: 3GSJ (Zeglis et al., Reference Zeglis2009b); b) inserted at the mismatch AA site of d(CGGAAATTACCG). PDB: 3GSJ (Zeglis et al., Reference Zeglis2009b). Red dots show the hydrogen bond between a water molecule and the N2 of the chrysi ligand; c) inserted at the mismatch AA site of d(CGGAAATTACCG). PDB: 3GSK (Zeglis et al., Reference Zeglis2009b). Yellow dots show the hydrogen bond between a water molecule and the N2 of the chrysi ligand.

Selected bond lengths at the AA mismatched site (Å)

Δ-[Rh(bpy)2chrysi]2+ at mismatched site AA.
Furthermore, in this crystal structure, it is possible to identify a hydrogen bond at the AA mismatch site. Such hydrogen bonding can be described as the N2 (hydrogen bonding acceptor) in its deprotonated form and the hydrogen of an ordered bound water molecule (hydrogen bonding donor) (Figure 24b).
Crystal structure of Ruthenium polypyridyl complex as metallo-insertor
No structural information was available until 2012 regarding the binding mechanisms of ruthenium polypyridyl complexes to DNA single mismatches. These metal complexes, endowed with distinct physical and electrochemical properties, are notably advantageous for use as ‘light-switch’ probes in detecting DNA mismatches only because the luminescence is enhanced. The binding towards mismatched sites is not specific.
The initial ruthenium polypyridyl complex utilised for this purpose was [Ru(bpy)2dppz]2+. This complex, subject to extensive scrutiny for its ‘light-switch’ capabilities, demonstrates markedly enhanced luminescence upon binding to DNA, an effect further amplified in the presence of DNA defects, such as mismatches, and attributable to the enantiospecific encapsulation of the ligand by flipped-out bases. Consequently, considerable research efforts have been directed towards understanding the structural change when this metal complex interacts with DNA mismatches.
This structural information was obtained in 2012 by Barton et al. when the Δ-[Ru(bpy)2dppz]2+ was co-crystallised with the self-complementary sequence d(CGGAAATTACCG) (Song et al., Reference Song2012), illustrated in Figure 25. This is a crystallographic analysis of Δ–[Ru(bpy)2dppz]2+ binding to a single AA DNA mismatch. It highlighted dppz intercalation at well-matched sites and insertion at mismatched sites, thus providing crucial insights into the interaction of ruthenium complexes with DNA. Note, again, that the insertion binding mode must be enantiospecific for the delta enantiomer in a way that intercalation is not.
Structure representation of [Ru(bpy)2dppz]2+ (a) Complete structure assembly of Δ-[Ru(bpy)2dppz]2+ interacting with the self-complementary sequence d(CGGAAATTACCG) containing two AA mismatch sites. (b) Frontal and (c) lateral view of the AA mismatch site (PDB: 4E1U) (Song et al., Reference Song2012).

Although dppz is a much narrower intercalating ligand than chrysi, previously utilised for mismatch recognition, the binding mechanism of this ligand at the mismatch site exhibits remarkable similarity to that of Δ-[Rh(bpy)2chrysi]3+. Specifically, at the mismatch site, Δ-[Ru(bpy)2dppz]2+ engages through metallo-insertion from the minor groove, resulting in the extrusion of the mismatched bases. In this process, the dppz ligand is inserted in a head-on fashion, effectively shielding both phenazine nitrogen from aqueous exposure and accounting for the enhanced luminescence. This binding mode has been previously observed with Δ-[Ru(bpy)2chrysi]3+ at both AC and AA mismatched sites. However, this particular structure conclusively demonstrates that a narrower ligand such as dppz can also bind to mismatches through metallo-insertion, but only as the delta enantiomer. The original paper does not highlight this key point. The PhD thesis of Dr Hang Song is well worth consulting for further insight into the specificity of metallo-insertion even in the absence of mismatches (Song, Reference Song2012). Beyond metallo-insertion, two distinct intercalation binding modes are discernible: one occurring at the central AT steps and the other presenting as end-capping. Analogously, at sites exhibiting perfect base pairing, ruthenium complexes engage in intercalation from the minor groove of the DNA in a head-on orientation. Luminescence assays, employing both mismatched and well-matched sequences of d(CGGXAATTXCCG), reveal that Δ-[Ru(bpy)2dppz]2+ bound to mismatched DNA manifests a luminescence intensity threefold higher than that observed with the equivalent 12-mer canonical duplex.
Consecutive double mismatches
The first crystal structure of a small molecule binding to a DNA consecutive double mismatch was obtained in our laboratory (Prieto Otoya et al., Reference Prieto Otoya2024c). Here, the crystal structure – illustrated in Figure 26 - of the Pribnow box consensus sequence d(CGCTATAATGCG) was determined when mispaired in the presence of rac-[Ru(phen)2phi]2+. The non-complementary Pribnow box sequence 50 -TATAAT-30 is incorporated into a modification of the classic Dickerson–Drew dodecamer self-complementary sequence d(GCGGAATTCGCG). The resulting assembly contains both enantiomers of the complex, whose synthesis and DNA binding properties were reported many years ago.
Structural representation of Λ-[Ru(phen)₂phi]2⁺ (cartoon -blue-light)and Δ-[Ru(phen)₃phi]2⁺ (blue marine – spheres) bound to DNA (PDB: 8CMM) (Prieto Otoya et al., 2024c). (a) Cartoon representation showing two Λ-[Ru(phen)₂phi]2⁺ complexes interacting with a double mismatch site from the DNA major groove. (b) View illustrating the Δ-[Ru(phen)2phi]2+ represented as a sphere. (c) Visualisation of the stacking interactions between the complexes within the crystal lattice, depicted as sticks with interplanar distances labelled.

Condition: 0.01 M MgCl2, 0.05 M HEPES sodium, 0.004 M LiCl.
The complex crystallised is one member of this well-studied class of DNA binders (see above), with this structure containing both enantiomers of the complex, although only the lambda enantiomer really interacts with the DNA. The crystal structure presented here shows 80° bending of the DNA at each complex binding site, and the binding mode seems not to have been previously characterised, being closer to bulge binding than the previously described metallo-insertion. It is distinguished by the high degree of bending from the major groove side. DNA bending is believed to be a key feature by which base mismatches or base insertions/deletions are recognised (Sharma et al., Reference Sharma2013). Understanding the atomic details of the structure of such small molecule/DNA complexes can help uncover their specific binding mechanisms and open up new opportunities for structure-based drug design to target specific disease-related DNA structures (Granzhan et al., Reference Granzhan2014).
Summary of mismatch and bulge recognition
The idea of recognising single mismatches by insertion and subsequent DNA cleavage has been most well developed using the rhodium analogue of the complex used here, [Rh(phen)2phi]3+ (Pyle et al., Reference Pyle1989a). An extended version of the phi ligand, chrysi, has been shown to recognise C-C and A-A mismatches by insertion from the DNA minor groove (Pierre et al., Reference Pierre2007). This recognition is specific for delta enantiomers and is driven by the stacking of the ejected bases, in a syn conformation, onto the phen ligands (Zeglis et al., Reference Zeglis2009b). Here, we see insertion from the minor groove and intercalation from the major groove using the self-complementary d(CGGAAATTACCG) sequence. Insertion from the minor groove, at an A-A mismatch, is also known for Δ-[Ru(bpy)2dppz]2+ using the same sequence, but now, all the binding is from the minor groove (Song et al., Reference Song2012). Here also, the binding mode is enantiospecific for the delta enantiomer. These binding modes do not cause overall curving or kinking of the helix.
A key structural difference between 2O1I and 4E1U is in the mismatch binding site (Figure 27). It is represented by the position of the displaced bases upon metallo-insertion. In 2O1I (left panel), the rhodium complex, with its bulky chrysi ligand, displaces the mismatched AC base pair in two different directions: The adenine base pair, illustrated in red, is displaced onto the minor groove, whereas the cytosine (yellow) is displaced into the major groove. In 4E1U (centre panel), the Δ-[Ru(bpy)2dppz]2+ metal ion displaces both adenine mismatch bases into the minor groove.
Intercalation, insertion, and mismatch recognition. (Left) The mismatched sequence d(CGGAAATTACCG)2 crystallised with the complex Δ-[Rh(bpy)2chrysi]2+ (PDB: 2O1I) (Zeglis et al., Reference Zeglis2009b). (Middle) The same sequence crystallised with Δ-[Ru(bpy)2dppz]2+ (PDB: 4E1U) (Song et al., Reference Song2012). (Right) The structure reported shows only the Λ-[Ru(phen)2phi]2+ complex for clarity, bound to a DNA consecutive double mismatch (PDB: 8CMM) (Prieto Otoya et al., Reference Prieto Otoya2024b).

In contrast, the Λ-[Ru(phen)2phi]2+ complex used with the double mismatch (8CMM, right-hand panel) neither intercalates nor inserts, but recognises the ‘bulge’ at A5. It binds from the major groove with the stacking of the bulged adenine as well as the two base-paired adenines to create a kink whose angle is primarily determined by the approximately octahedral geometry at Ru to give an approximately 80° kinking. As there are two such sites, overall, the helix is bent, and the phen ligands are here one driver of the interaction, with the hydrogen bond formation by the phi ligand to the already base-paired A7 the second driver. The common feature linking insertion and what could be called the bulge recognition seen here is the role of the adenine base stacking on the phen ligands of each metal complex, possibly related to the absence of a polarising carbonyl group in adenine. Bulge recognition using Δ-[Rh(bpy)2chrysi]3+ has been explicitly studied for single base bulges (Zeglis et al., Reference Zeglis2008, Reference Zeglis2009a). These authors assessed the thermodynamics of bulge binding and the specific DNA cleavage made possible by such recognition, which they suggest is by a similar mechanism to that seen for the insertion mode from the minor groove. They highlight the enantiospecificity of recognition, which suggests that the binding mode might have some similarity to that seen here, and they also point out that DNA bending is known to be a feature of bulged sites. The crystal structures of the d(GCGAAGC) and d(GCGAAAGC) duplexes also show bending, here at double and triple mismatched sites (Sunami et al., Reference Sunami2004).
Overall perspective
The interaction of ruthenium polypyridyl complexes with DNA has been of great importance and debate for several decades. Since the 1980s, to understand the interactions between these classes of metal complexes with DNA, many different spectroscopic techniques have been employed. For example, combined 1H NMR and molecular modelling studies have been used to localise selective binding of dinuclear Ru polypyridyl complexes at adenine bulge sites and to infer minor-groove recognition in solution (Morgan et al., Reference Morgan2006). In 2011, CJC and Dr James Hall provided the first crystallographic evidence that these metal ions bind to duplex DNA from the minor groove.(Hall et al., Reference Hall2011). The following year, the journal Nature Chemistry published back-to-back reports confirming this result, by Dr James Hall and CJC, along with Dr Hang Song and Professor Jackie Barton. (Niyazi et al., Reference Niyazi2012; Song et al., Reference Song2012). Notably, the work from the CJC laboratory had used the lambda (Λ) enantiomer, whereas the Barton group had used the delta (Δ) enantiomer. The structure highlighted the possible use of delta enantiomers for mismatch recognition. Since then, a range of analogues have been synthesised and crystallised with a series of DNA sequences (mostly decamers and dodecamers). All of these structures have shown intercalation from the minor groove by both enantiomers.
Before and throughout this period, the use of metal complexes to target DNA single mismatches continued to be of interest (e.g., Komor and Barton, Reference Komor and Barton2014). Only a few crystal structures showing this type of interaction (metallo-insertion) are available. The mode of binding for all these metal complexes targeting single DNA mismatches is the same: insertion from the minor groove and displacement of the base pair, and the structural data make clear that this mode of binding must be enantiospecific for the delta enantiomer. (Hall et al., Reference Hall2016b). To date, the general aim of developing a mismatch-specific luminescent probe remains only partly achieved, though work continues. (Tiley, Reference Tiley2022).
Despite all the progress in the field, no structural information regarding intercalation from the major groove by ruthenium polypyridyl complexes or interaction towards a consecutive DNA double mismatch was available. (Prieto Otoya et al., Reference Prieto Otoya2024b, Reference Prieto Otoya2024c) These represented clear gaps that could only be filled by X-ray crystallography and described in detail in this review.
For the future, the work of several groups to use this class of compound as probes in living cells and as cancer therapeutics ensures that octahedral metal complexes will continue to excite researchers keen to use all the Periodic Table in the search for useful molecules to contribute to human health.
Acknowledgements
We very much appreciate the kindness of our colleague Dr Michael Piperakis, who read the whole draft and made many useful suggestions, from the perspective of one as a relatively new entrant to this fascinating area. We also acknowledge helpful discussions with Professor David Cardin, and also would like to thank the reviewers for their time and trouble. Their perspectives have informed the final version.
Financial support
We are grateful for financial support from the European Union’s Horizon 2020 research and innovation programme (Marie Skłodowska-Curie grant agreement No. 861381), and from BBSRC grant no. BB/T008342/1.
Competing interests
We hereby declare that we have no conflict of interest in respect of the work described here.


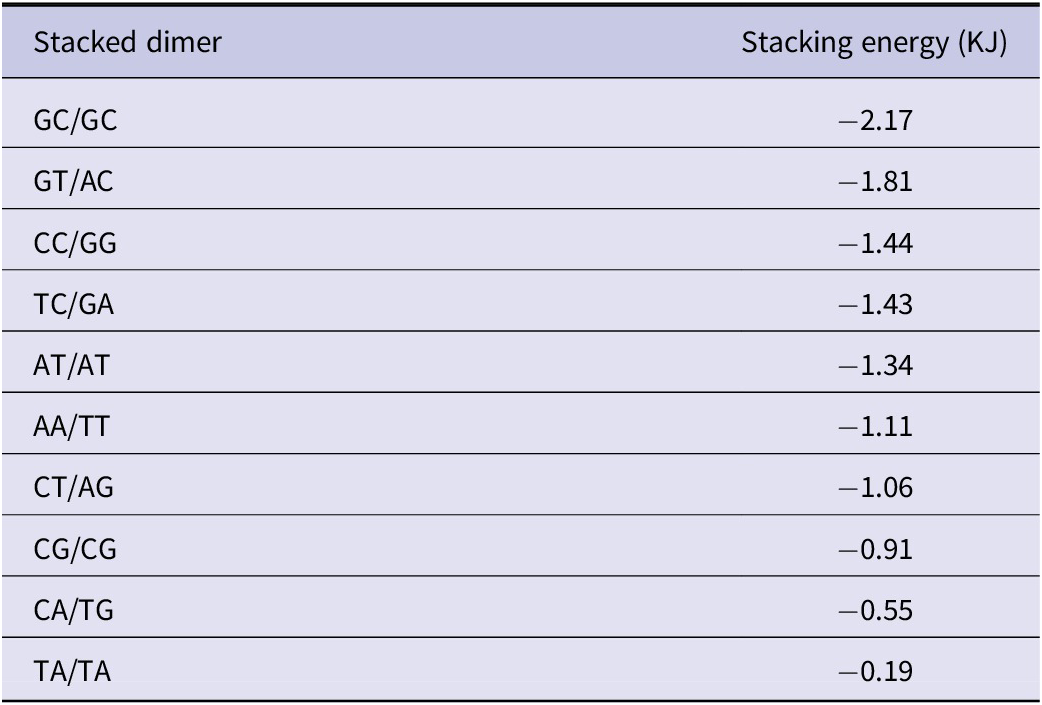
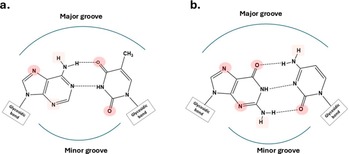


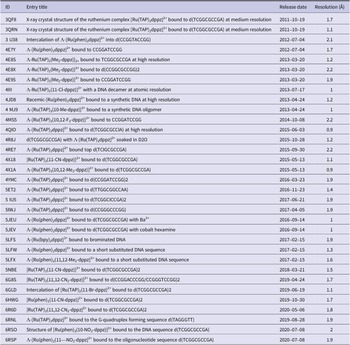


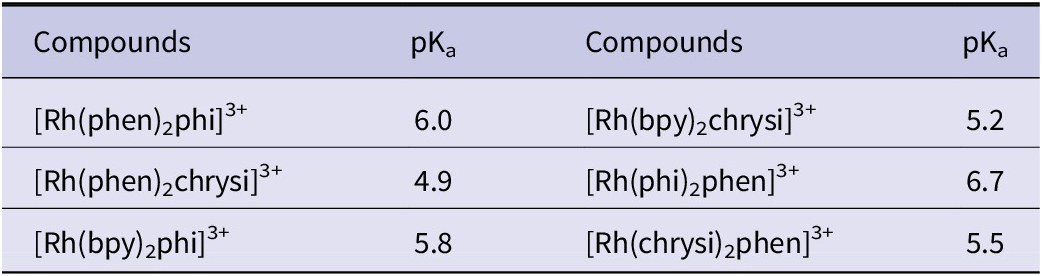





 Open access

