

Introduction
Kenomicrolite, ideally □2Ta2[O4(OH)2] □, is a new mineral (IMA 2024-097) from the Volta Grande pegmatite, Nazareno, Minas Gerais, Brazil. The general formula of pyrochlore-supergroup minerals is A 2–mB 2X 6–wY 1–n, where m (0–1.7), w (0–0.7) and n (0–1) represent the number of vacancies at each site (Lumpkin and Ewing, Reference Lumpkin and Ewing1995). A refers to a site with eight-fold coordination that can accommodate Na, Ca, Sr, Ba, Pb2+, Sn2+, Sb3+, Y3+, U4+, H2O, Sc, REE3+, Ag, Mn2+, Fe2+, Cr, Th or is partially vacant. The B site has six-fold coordination and hosts high-field strength elements such as Ta, Nb, Ti, Sb5+, W, V5+, Sn4+, Zr, Hf, Fe3+, Mg, Al, P and Si. The X site mainly contains O and subordinate OH, F and/or vacancies, and the Y site is typically occupied by OH, F, O, □ (vacancy), H2O or large cations such as K+, Cs+ and Rb+ (Ercit et al., Reference Ercit, Černy and Hawthorne1993). Kenomicrolite is the first mineral belonging to the pyrochlore supergroup having both A and Y dominated by vacancy and the B site dominated by Ta, making it, ideally, a tantalum oxyhydroxide. Kenomicrolite was allegedly observed at the María Elena pegmatite, Sierra de San Luis, Argentina (Galliski et al., Reference Galliski, Márquez-Zavalía and Roquet2021) and at the São João Del Rei Pegmatite Province, Minas Gerais, Brazil (Menezes da Silva, Reference Menezes da Silva2018; Alves et al., Reference Alves, Neumann, Ávila, Ferreira, de S. Assumpção, Carneiro and Garcia2021), where the present sample was also found; however, none of those authors provided exhaustive data. The chosen name complies with the currently approved nomenclature system for pyrochlore-supergroup minerals (yaroot rule, Atencio et al., Reference Atencio, Andrade, Christy, Gieré and Kartashov2010; Atencio, Reference Atencio2021). The root name is microlite, as Ta dominates B; both tunnel sites (A and Y) are dominated by structural vacancy, thus the prefix ‘keno-’. Where the first and second prefixes are equal, then only one prefix is applied. The recommended mineral symbol is Kmic (Warr, Reference Warr2021).
Holotype material, consisting of two small kenomicrolite crystals, is deposited in the mineralogical collection of the Museo di Storia Naturale, Sezione di Mineralogia e Litologia, Università di Firenze, Firenze (Italy), under catalogue number MSN-MIN 3747-I.
Kenomicrolite was discovered during a systematic study of hydrokenomicrolite crystals with the aim of investigating their ion-exchange capacity. Indeed, pyrochlore minerals and their synthetic analogues exhibit significant ion-exchange properties (Möller et al., Reference Möller, Clearfield and Harjula2002; Zoppi, Reference Zoppi2004; Han et al., Reference Han, Jiao, Xu, Pang and Feng2014; Taddei et al., Reference Taddei, Bindi, Lepore, Skogby and Bonazzi2024), due to the easy leachability of the A and Y species, especially when they are large and have low charge (K+, Cs+, Tl+, etc.) and/or highly mobile (H2O). This property has significant environmental implications, as pyrochlores can represent promising candidates as sinks for toxic metals such as Tl or Pb. The number of possible exchangers at the tunnel sites in kenomicrolite is very limited, given that both sites are vacancy-dominated, and they are mainly represented by aqueous species (H2O + OH– or H3O+); for this reason, kenomicrolite should not be regarded as the best choice for heavy metals immobilisation. Nonetheless, the incorporation mechanism involving Tl+ in the structure of kenomicrolite was hereby investigated in order to have more insights on the limits of critical features of the crystal structure of pyrochlore minerals.
Occurrence
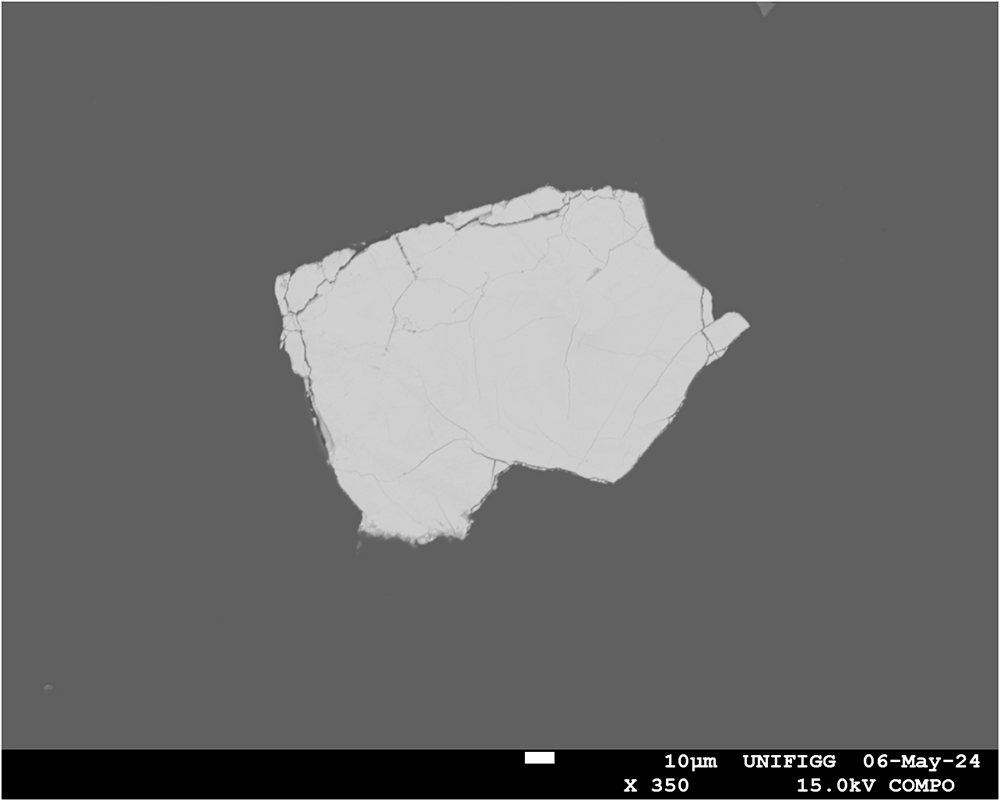
The new mineral (Fig. 1) occurs at the Volta Grande pegmatite (21°10′08.6′′S, 44°36′01.3′′W), Nazareno, Minas Gerais, Brazil as an accessory phase. The pegmatite belongs to the Sn-Ta-rich São João del Rei Pegmatite Province (Heinrich, Reference Heinrich1964; Lagache and Quéméneur, Reference Lagache and Quéméneur1997). The Volta Grande granitic pegmatite is associated with Transamazonian granites (Early Proterozoic) hosted by the Archean greenstone belt of the Rio das Mortes Valley, which is situated at the southern border of the São Francisco Craton, in Minas Gerais, Brazil (Lagache and Quéméneur, Reference Lagache and Quéméneur1997). The pegmatite bodies, which are usually large (up to 1200 m × 40 m), show a dominant intermediate zone containing spodumene, microcline, albite and quartz, with an irregular border of an aplitic facies surrounded by an extensive metasomatic aureole with ‘zinnwaldite’, phlogopite and holmquistite. The spodumene-rich core zone is continuous or segmented and also contains lenses of ‘lepidolite’. The main rock type that hosts the pegmatite is an amphibole schist. This pegmatite is characterized by high Rb and Li contents (Lagache and Quéméneur, Reference Lagache and Quéméneur1997). The paragenetic position of the mineral could not be determined, as it was found in a large octahedral fragment collected in a heavy mineral concentrate (see Andrade et al., Reference Andrade, Atencio, Chukanov and Ellena2013a). The octahedral fragments are formed by an association of kenomicrolite and hydrokenomicrolite together with Na-rich fluorcalciomicrolite, pointing to a possible secondary origin of kenomicrolite. The leaching of Ca, Na and F from primary fluorcalciomicrolite can be a consequence of weathering (Lumpkin and Ewing, Reference Lumpkin and Ewing1992), followed by a subsequent limited uptake of locally enriched cations (in this case, Ba, Ce, U, Pb, Mn, Sr) as well as water molecules. Depending on the extent of the hydration process, either hydrokenomicrolite or kenomicrolite can form this way.
Back-scattered electron image of the kenomicrolite fragment investigated.

Figure 1 Long description
The fragment is irregularly shaped and has been isolated in the sample with no other minerals present. It has a medium bright grey appearence with cracks but no other features. The fragment in the image is approximately 160 by 120 micrometres. The energy level was 15.0 kV.
Other associated minerals within the pegmatite are albite, fluorapatite, beryl, bityite, cassiterite, epidote, fluorite, ‘garnet’, gahnite, hydroxycalciomicrolite, ‘lepidolite’, magnetite, microcline, monazite-(Ce), muscovite, quartz, rutile, spodumene, tantalite-(Mn), ‘tourmaline’ and zircon.
Nazareno is the type locality for hydrokenomicrolite (Andrade et al., Reference Andrade, Atencio, Chukanov and Ellena2013a), fluorcalciomicrolite (Andrade et al., Reference Andrade, Atencio, Persiano and Ellena2013b), hydroxycalciomicrolite (Andrade et al., Reference Andrade, Yang, Atencio, Downs, Chukanov, Lemée-Cailleau, Persiano, Goeta and Ellena2017) and oxycalciomicrolite (Menezes da Silva et al., Reference Menezes da Silva, Ávila, Neumann, Faulstich, Alves, de Almeida, Cidade and Sousa2020).
Appearance, physical and optical properties
Kenomicrolite forms small areas in hydrokenomicrolite euhedral octahedral crystals, probably pseudomorphs after fluorcalciomicrolite, up to 200 µm in size (Fig. 1). The colour is pale orange, with a white streak; the crystals are transparent with an adamantine to resinous lustre, and they have an altered appearance, scarcely distinguishable from hydrokenomicrolite grains. Kenomicrolite is brittle and displays a conchoidal fracture, while no cleavage or parting are observed; the estimated Mohs hardness is 6. It shows no fluorescence under UV light. The density was not measured because of the size of available grains. The calculated value of 5.599 g·cm–3 was obtained on the basis of the empirical chemical formula and the unit-cell volume obtained from single-crystal X-ray diffraction data (see below).
Kenomicrolite is isotropic, with n calc = 1.880 (from the Gladstone–Dale relationship for the empirical formula; Mandarino, Reference Mandarino1981). Other optical data were not collected given the availability of only two small crystals.
Chemical data
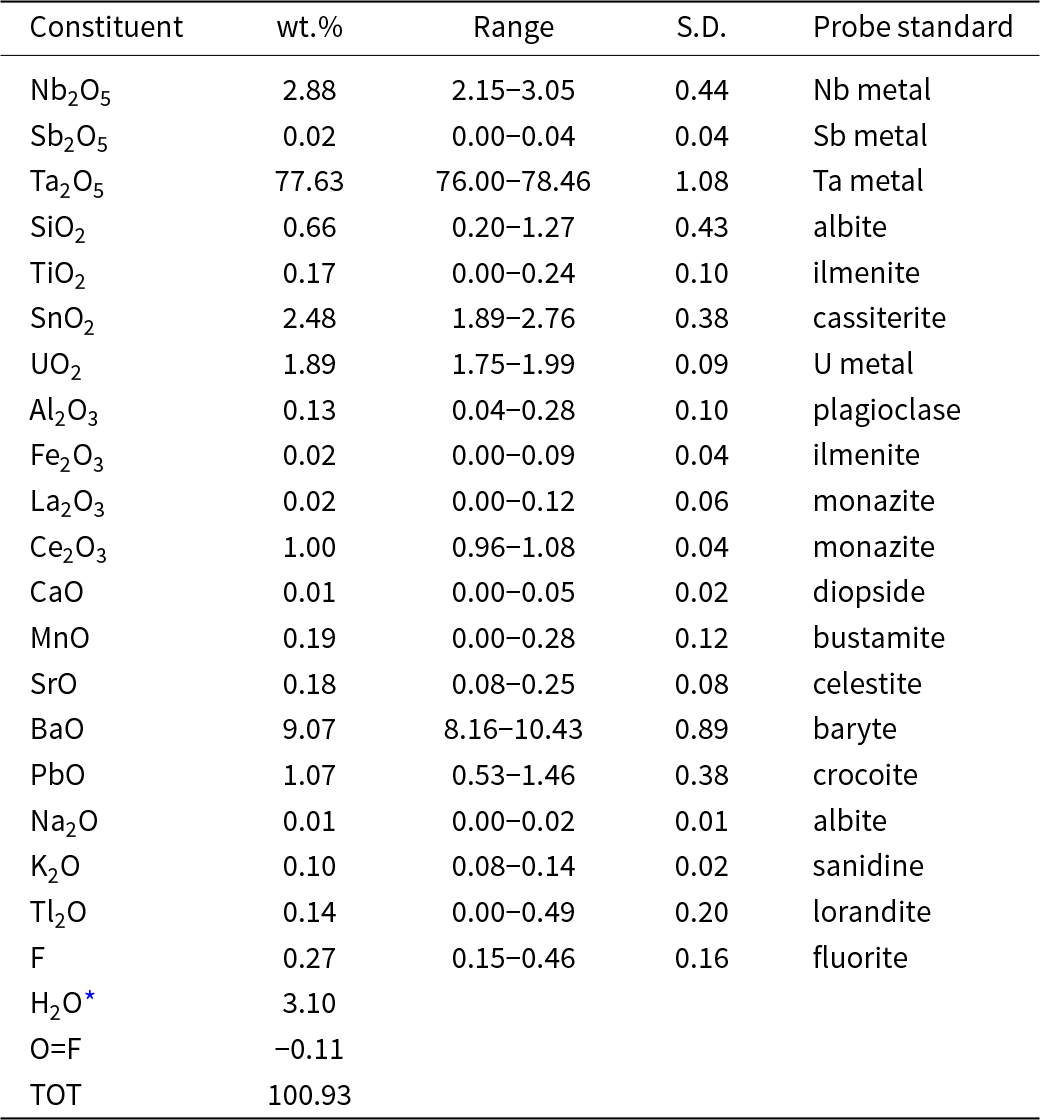
Chemical analyses were carried out on the fragment from which the crystal used for the structural study was extracted, using a Jeol JXA-8230 electron microprobe (EMPA; tungsten cathode) in wavelength dispersion mode (WDS) at 15 kV acceleration voltage, 10 nA beam current and 2 µm beam size. The total number of spot analyses on the investigated crystal was 5. Based on standard deviation values, the crystal was found to be homogeneous (with slightly variable degrees of hydration from point to point). The occurrence of H2O was confirmed by infrared spectroscopy and was calculated in accordance with the results of the crystal structure refinement; a direct measurement was prevented by dearth of material. All Fe was assumed to be Fe3+ and all Sn to be Sn4+. Th and Zr were measured but were found to be below the detection limit (0.01 wt.%). Mean analytical results are given in Table 1.
Analytical data (wt.%) for kenomicrolite

Table 1 Long description
The table presents the analytical data in weight percent for various constituents of kenomicrolite. Ta2O5 is the most abundant oxide at 77.63 wt.%, followed by BaO at 9.07 wt.% and H2O at 3.10 wt.%. Other significant constituents include Nb2O5 at 2.88 wt.% and SnO2 at 2.48 wt.%. The range and standard deviation for Ta2O5 is 76.00 to 78.46 wt.% with a standard deviation of 1.08. Minor constituents with less than 0.1 wt% are Sb2O5, Fe2O3, La2O3, CaO and Na2O. The total weight percent is 100.93. The probe standards used are listed
* Calculated from structural formula – the value in atoms per formula unit (apfu; 1.35 at X + 0.35 at Y) was converted to H2O wt.% as follows: the value in apfu was divided by the normalization parameter (ΣB = 2) and then multiplied by two to obtain H2O mol.%. The latter was then multiplied by the molecular weight of H2O, resulting in H2O wt.%. S.D. – standard deviation.
The empirical formula, calculated on the basis of 2 B cations pfu, can be written as A(□1.61Ba0.29Ce0.03U0.03Pb0.02Mn0.01Sr0.01)Σ2.00B(Ta1.74Nb0.11Sn0.08Si0.05Al0.01Ti0.01)Σ2.00X[O4.65(OH)1.35]Σ6.00Y[□0.57(H2O)0.35F0.07K0.01]Σ1.00 (where pfu = per formula unit). The ideal chemical formula of kenomicrolite is thus □2Ta2[O4(OH)2]□, which requires Ta2O5 96.09, H2O 3.91, total 100.00 wt.%.
X-ray diffraction
Single-crystal data
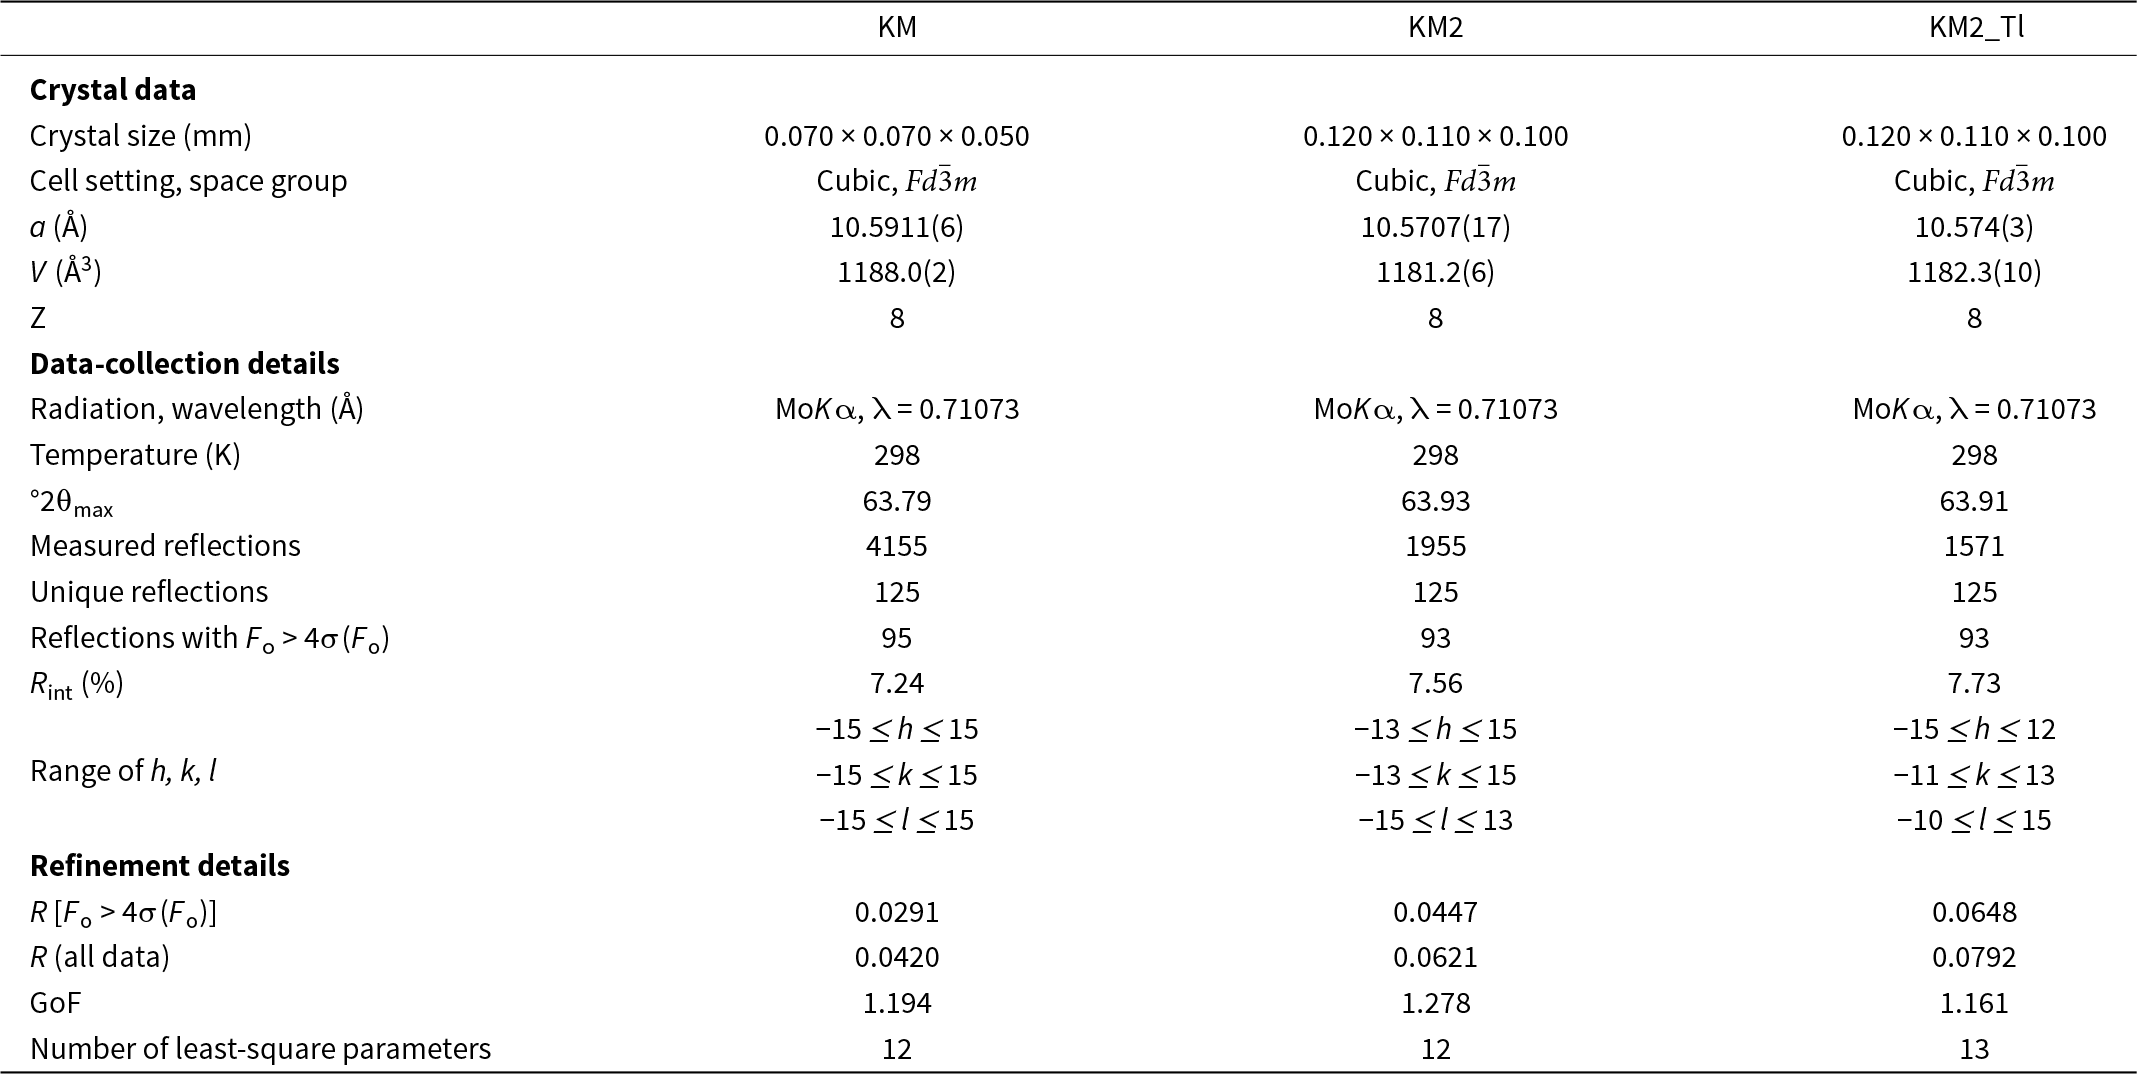
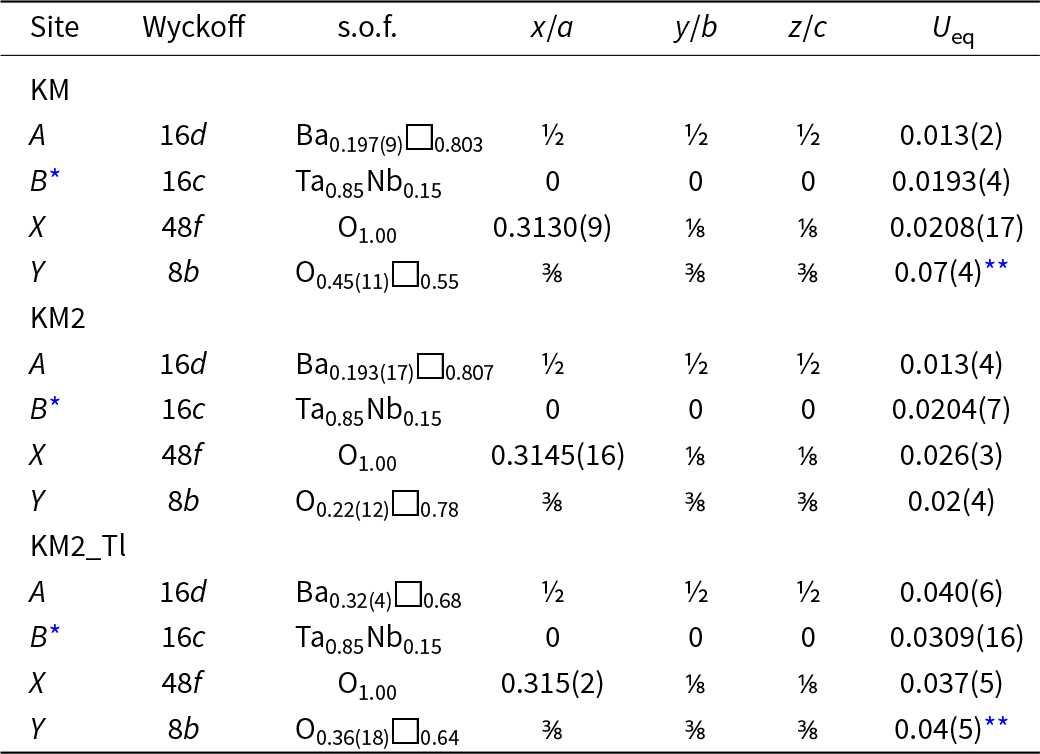
Single-crystal X-ray diffraction (SC-XRD) investigations were performed on two single crystals (labelled KM and KM2) extracted from the fragment in Fig. 1, with a Bruker D8 Venture diffractometer equipped with a Photon III detector. Unit-cell parameters and intensity data were collected using graphite-monochromatized MoKα radiation (λ = 0.71073 Å). Crystal data and experimental conditions are listed in Table 2. Intensity data were integrated by means of the APEX5 software suite (Bruker, 2023) and corrected for Lorentz-polarization effects and for absorption (multi-scan method – SADABS). Given the close relation to other cubic pyrochlore minerals, the structure was refined in the space group  $Fd\bar 3m$ (origin choice 2) using the program SHELXL (Sheldrick, Reference Sheldrick2015). The refinement was carried out starting from the atomic coordinates reported for hydrokenomicrolite (Andrade et al., Reference Andrade, Atencio, Chukanov and Ellena2013a) for A, B, X and Y. All these sites are located at special Wyckoff positions: A = 16d, B = 16c, X = 48f and Y = 8b. Site occupancy factors (s.o.f.s) were refined using the following scattering curves for neutral atoms (from the International Tables for Crystallography; Wilson, Reference Wilson1992): Ba vs □ (A), Ta vs Nb (B), O (X), O vs □ (Y). The s.o.f. value of the B site was fixed to EMPA values. Final coordinates and equivalent isotropic displacement parameters are given in Table 3, while selected interatomic distances are reported in Table 4. More details are included in the crystallographic information files (CIFs), available as supplementary material.
Crystal data, experimental details and refinement details for kenomicrolite and Tl-treated kenomicrolite
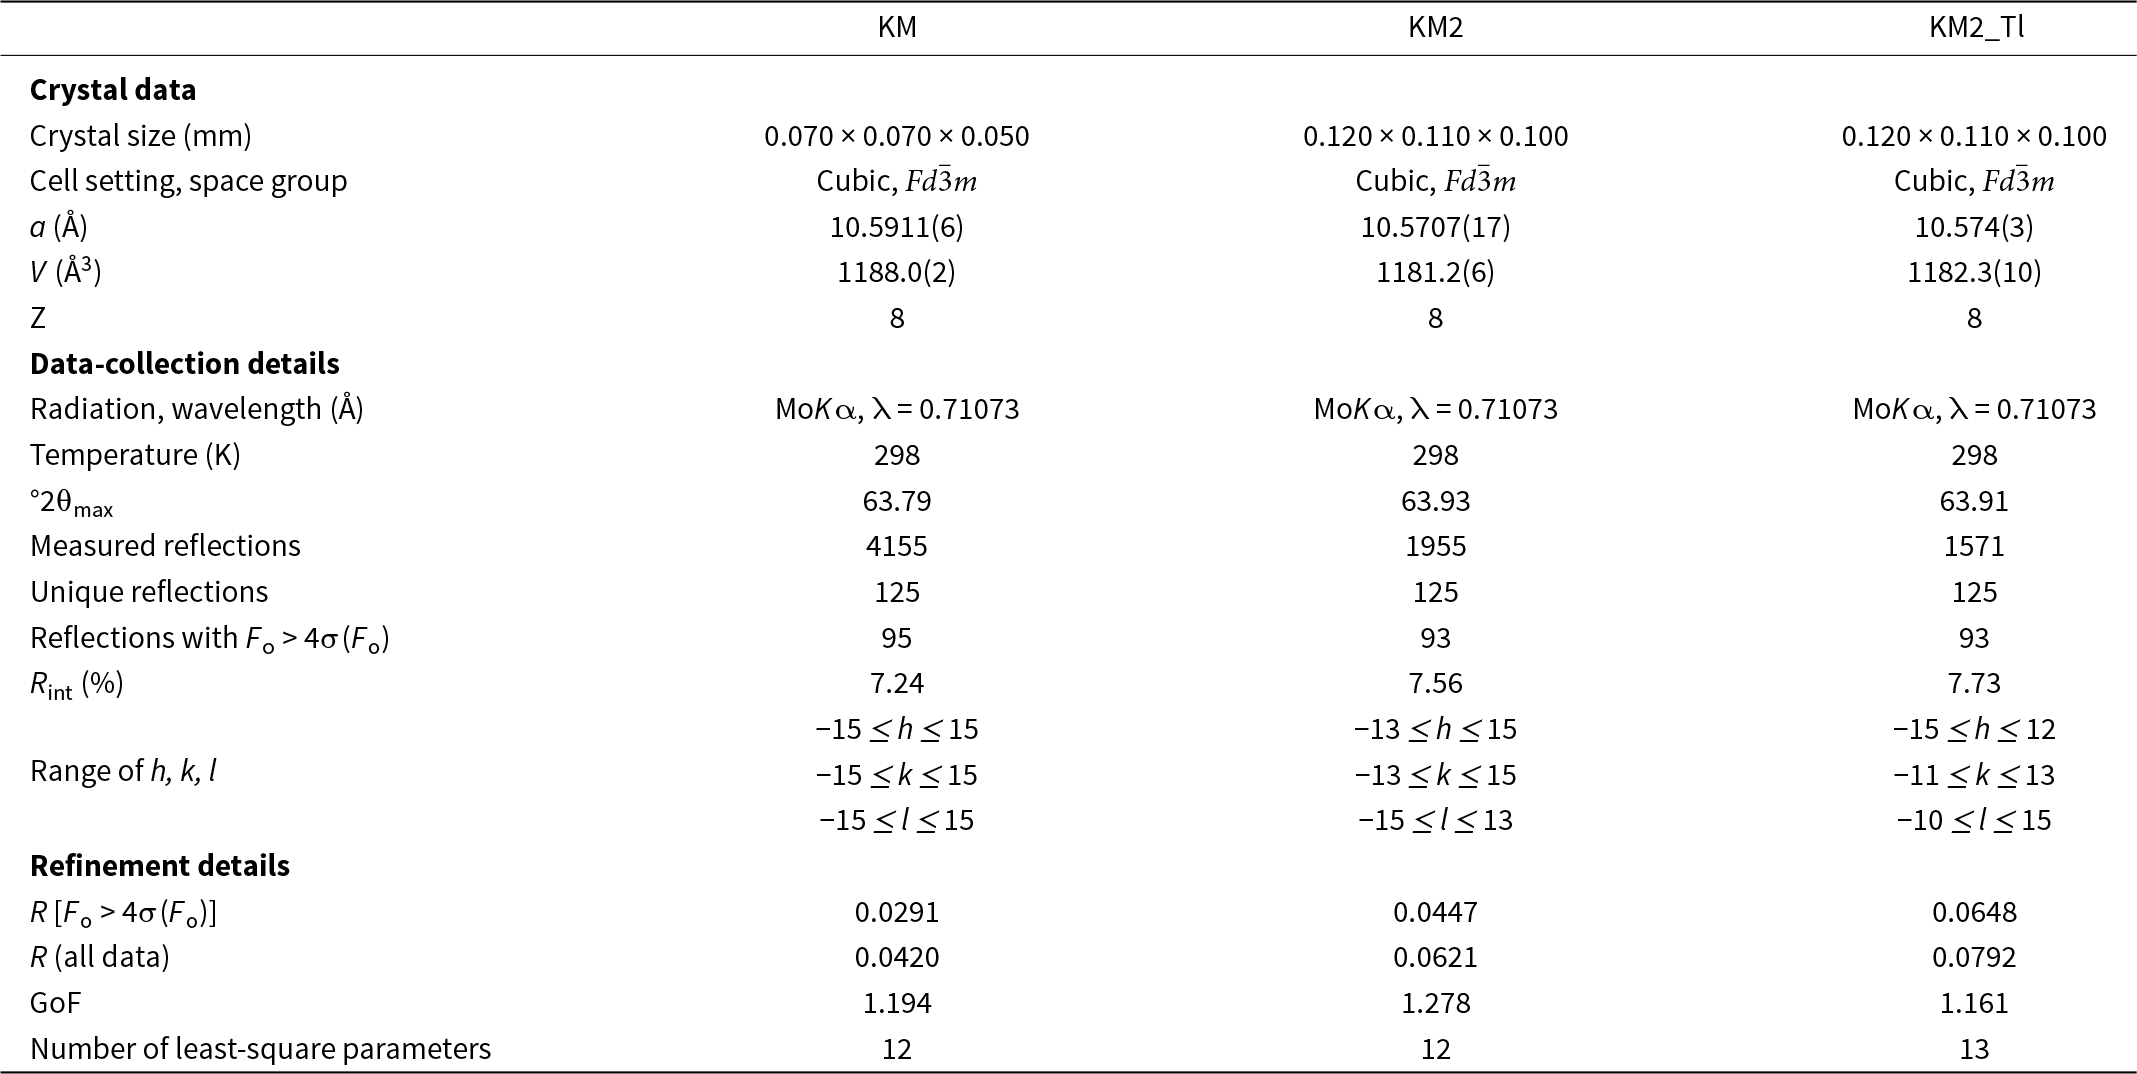
Table 2 Long description
The table lists crystal data, experimental conditions, and refinement results for kenomicrolite (KM) and thallium-treated kenomicrolite (KM2_Tl). All samples have a cubic crystal structure with the same space group. Crystal size is up to 120 micrometres in longest length. The lattice parameter 'a' is 10.5911(6) for KM and is slightly smaller in KM2 and KM2_Tl. The volume is 1188.0(2) for KM and similar for the others. Data collection was carried out using molybdenum K-alpha radiation at 298 K. KM shows the highest number of measured reflections at 4155, though all samples have the same number of unique reflections. In refinement results, KM has the lowest R values of 0.0291 and goodness of fit of 1.194. The number of least-squares parameters is 12 for KM and KM2, and 13 for KM2_Tl.
Atomic coordinates, Wyckoff positions, site occupancy factors (s.o.f.) and thermal parameters (Å2) for kenomicrolite and Tl-treated kenomicrolite
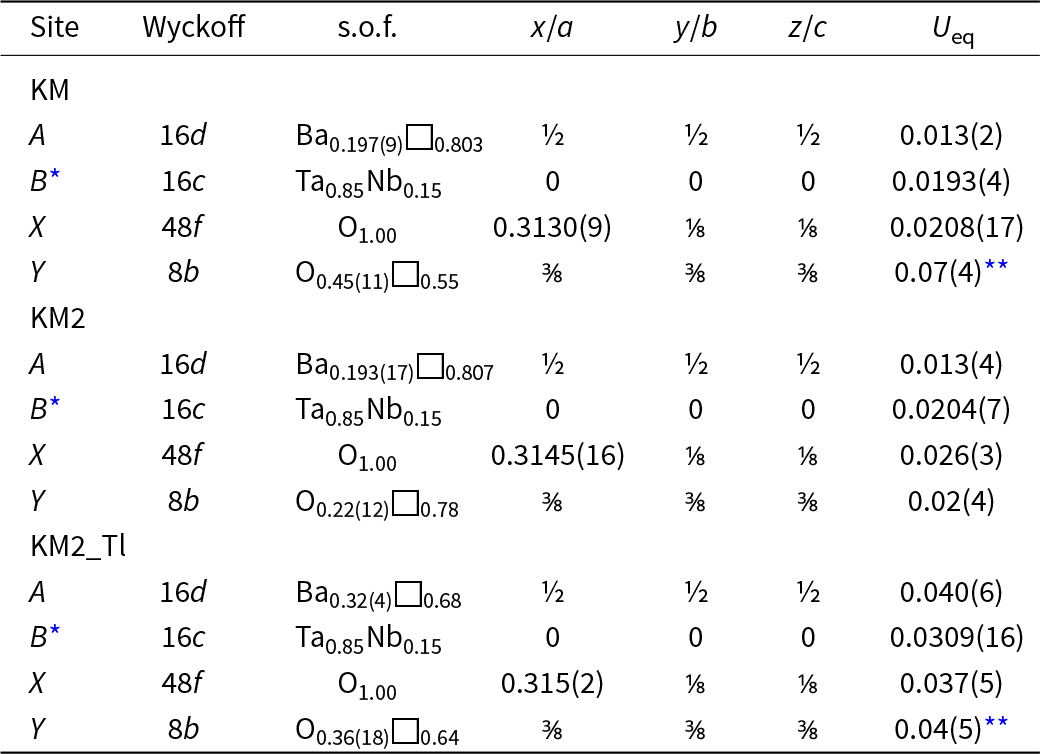
Table 3 Long description
The table details atomic coordinates, Wyckoff positions, site occupancy factors, and thermal parameters for kenomicrolite and Tl-treated kenomicrolite. Key data points include the site occupancy factors for Ba and vacancies at site A, with Ba occupancy increasing in the Tl-treated sample. Thermal parameters (Ueq) vary, with the highest values observed in the Tl-treated sample, particularly at site A. The B site is fixed to the EMPA data so it has the same Ta0.85Nb0.15 composition across all samples. The X site maintains full oxygen occupancy, while the Y site has 0.45 oxygen and 0.55 vacancy in the KM sample, 0.22 O and 0.78 vacancy for sample KM2, and 0.36 O and 0.64 vacancy for the Tl-treated sample.
* The site occupation factors for the B site have been fixed to the EMPA values.
** U iso.
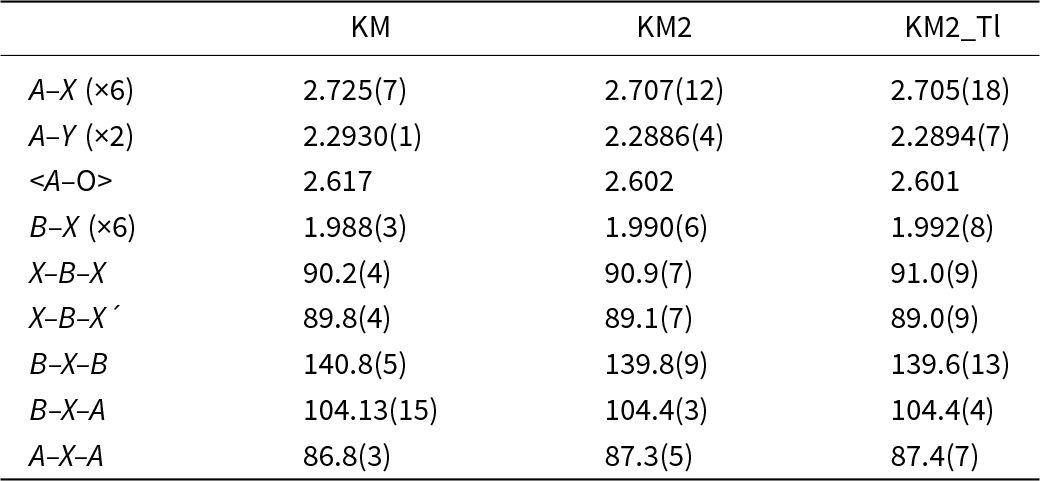
Selected interatomic distances (Å) and angles (°) for kenomicrolite and Tl-treated kenomicrolite
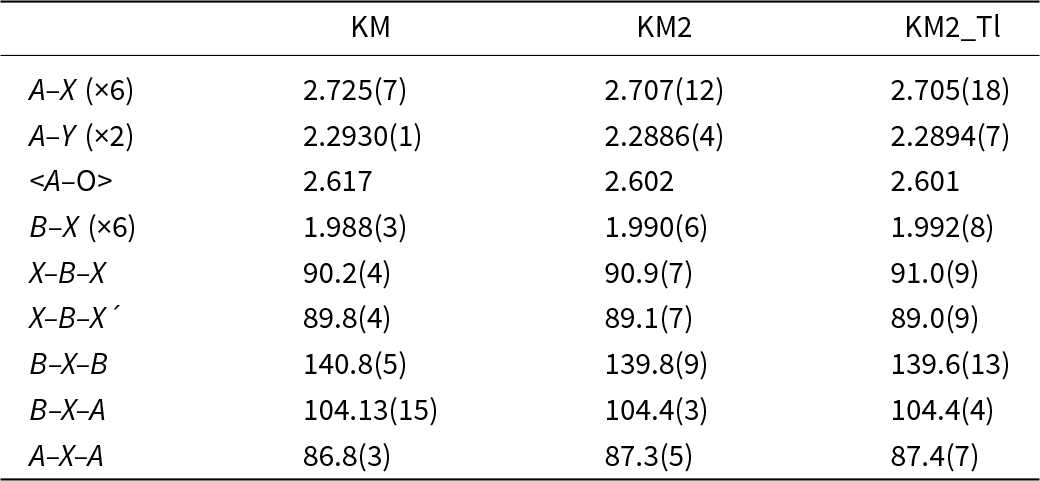
Table 4 Long description
The table presents selected interatomic distances in angstroms and angles in degrees for kenomicrolite and Tl-treated kenomicrolite. A–X distancesare 2.725 Å in KM, 2.707(12) A and 2.705 Å in KM2_Tl. B–X–B angles are 140.8° in KM, 139.8 in KM2 and 139.6° in KM2_Tl. The A–Y distances and <A–O> averages show minimal changes across the samples. Angles such as X–B–X and X–B–X´ exhibit minor variations.
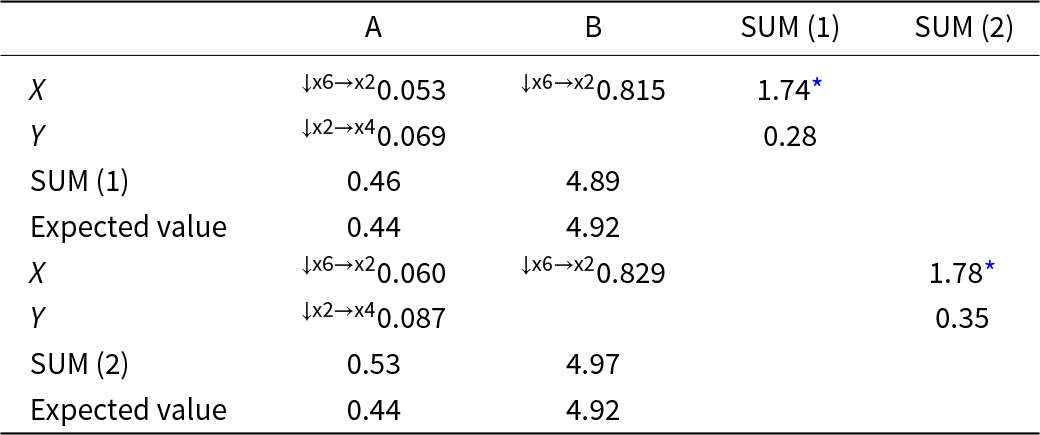
The bond valence sums (BVSs), calculated for the KM crystal considering the site populations as obtained from microprobe data and using the parameters given by Brese and O’Keeffe (Reference Brese and O’Keeffe1991), are reported in Table 5; lastly, Table 6 contains a comparison between the electron numbers calculated from microprobe data and those obtained from the structural model of sample KM.
Bond valence sums (BVS) for kenomicrolite (sample KM), calculated considering populations as calculated using EMPA (1) and the structure refinement (2)

Table 5 Long description
The table presents bond valence sums for kenomicrolite, comparing results from EMPA and structure refinement methods. The bond valence sum of 1.74 for X using EMPA and 1.78 using structure refinement. Y values show a bond valence sum of 0.28 with EMPA and 0.35 with structure refinement. The expected values for SUM (1) and SUM (2) are 0.44 and 4.92, closely matching the calculated sums of 0.46 and 4.89 for SUM (1), and 0.53 and 4.97 for SUM (2).
* In agreement with the partial substitution of O for OH at X.
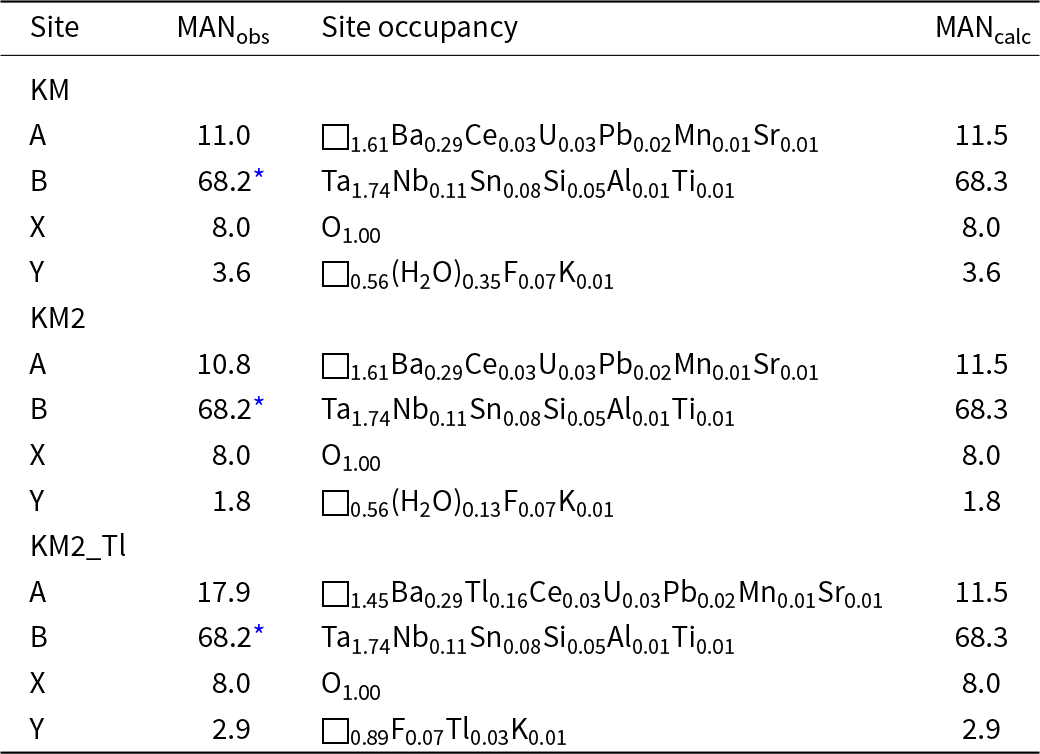
Comparison between the observed and calculated mean atomic number (MAN, in number of electrons per site) for kenomicrolite and Tl-treated kenomicrolite

Table 6 Long description
The table compares the observed and calculated mean atomic number (MAN) for different sites in kenomicrolite and Tl-treated kenomicrolite. MANobs for site A in KM2_Tl is 17.9, compared to 11.0 in KM and 10.8 in KM2, while the calculated MAN (MANcalc) remains constant at 11.5 for all. Site B is a fixed occupancy. Sites X and Y have the same Manobs and Mancalc values for all three samples of 8.0, 2.9 for X and Y respectively.
* Fixed occupancy. MANcalc always refers to the whole kenomicrolite fragment before imbibition experiments.
Powder diffraction data
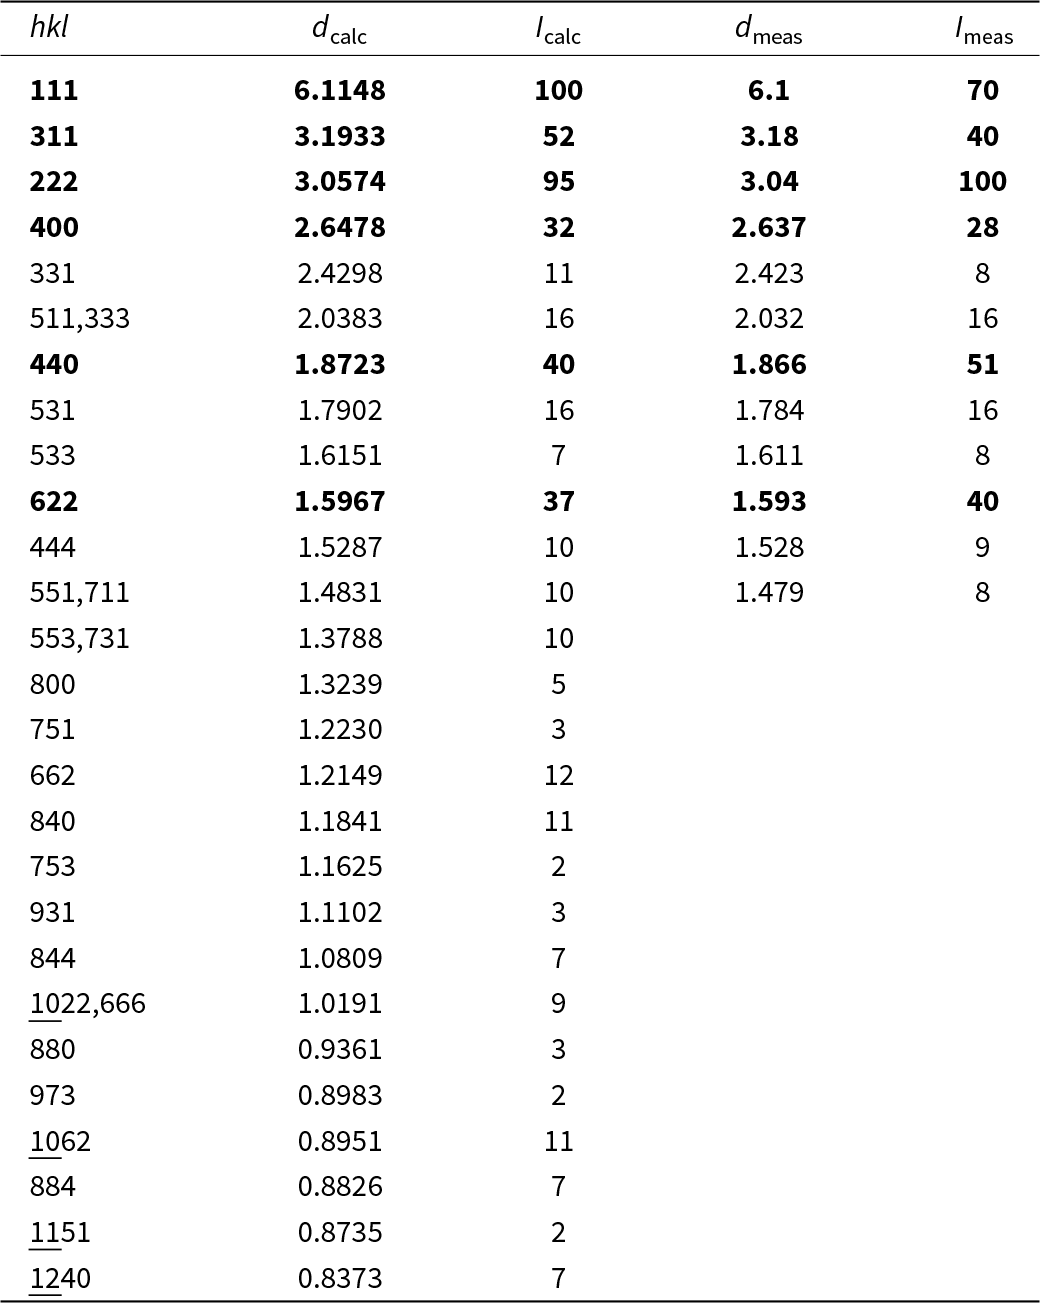
Powder X-ray diffraction data were collected using a Gandolfi-like experiment on KM, using CuKα radiation (λ = 1.54178 Å). Unit-cell parameters refined from powder data (space group  $Fd\bar 3m$) are a = 10.5628(3) Å and V = 1178.52(10) Å3. A comparison of the measured powder diffraction data and those calculated from the structural model is given in Table 7.
Powder X-ray diffraction data (d in Å) for kenomicrolite, sample KM
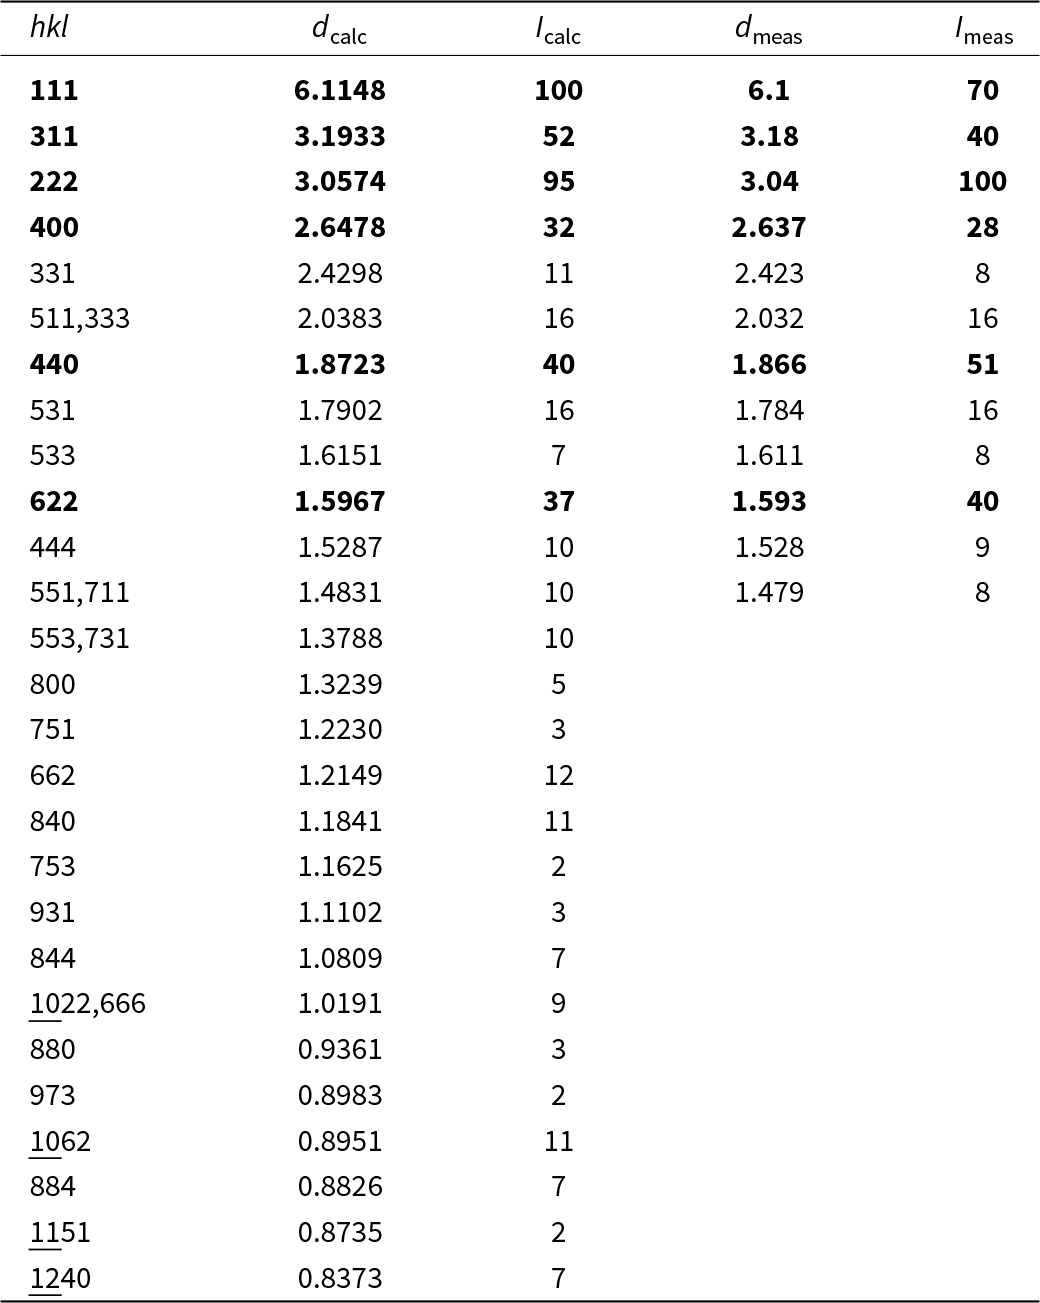
Table 7 Long description
The table presents powder X-ray diffraction data for kenomicrolite sample KM, comparing calculated and measured d values and intensities for various hkl indices. The strongest lines are in order d, I, hkl: 6.1, 70, 111; 3.18, 40, 311; 3.04, 100, 222; 2.637, 28, 400; 1.866, 51, 440; 1.593, 40, 622.
Notes: Calculated d values were obtained using XPOW (Downs et al., Reference Downs, Bartelmehs, Gibbs and Boisen1993) using the atomic coordinates and site occupancies reported in Table 3 (KM line). The strongest lines are given in bold.
Infrared spectroscopy
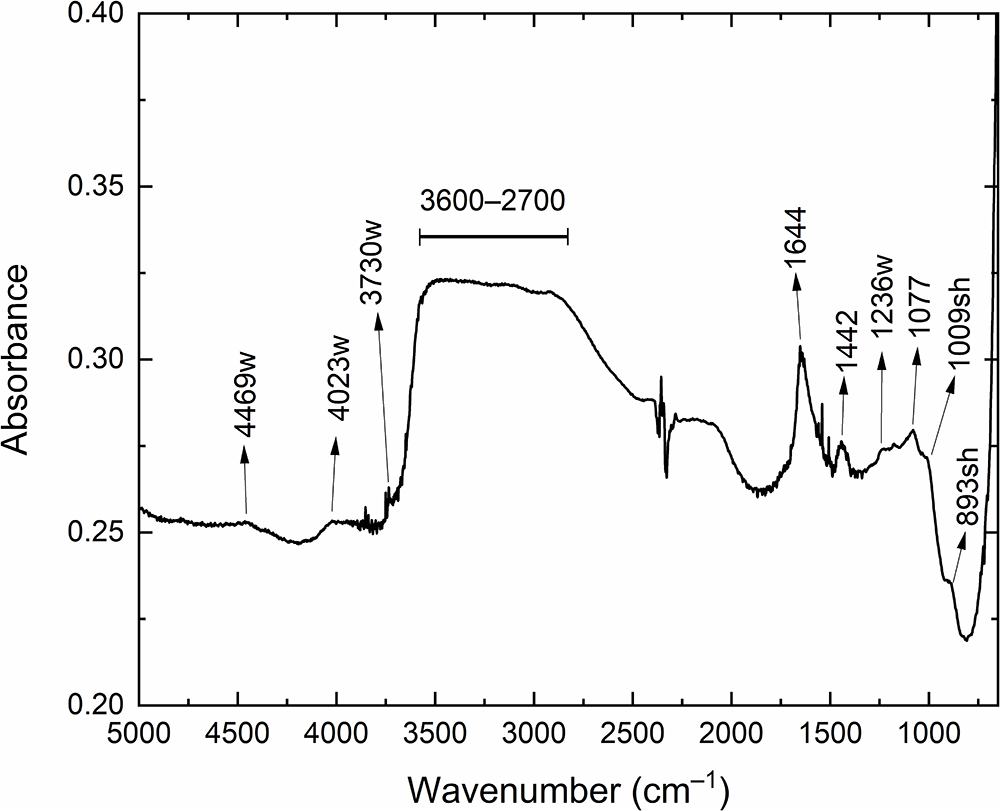
Fourier-transform infrared spectroscopy (FTIR) data were collected in transmission mode by placing the KM crystal on an IR-transparent BaF2 plate. The analyses were carried out by means of a Nicolet RaptIR microscope attached to a Nicolet iS50 FTIR spectrometer (Thermo Fisher), equipped with a Polaris IR source, KBr beam splitter and a LN2 MCT detector. The spectrum (Fig. 2) was collected adjusting the aperture size to that of the crystal; sixty-four scans were averaged, with a spectral range between 5000 and 650 cm–1 and a resolution of 4 cm–1.
Transmission FTIR spectrum of kenomicrolite with labelled bands and strengths (w = weak; sh = shoulder).

Figure 2 Long description
The graph displays bands with labels: 4469 w, 4023 w, 3730 w, a broad range from 3600 to 2700, 1644, 1442, 1236 w, 1077, 1009 sh and 893 sh. The absorbance values range from 0.20 to 0.40. w = weak, sh = shoulder.
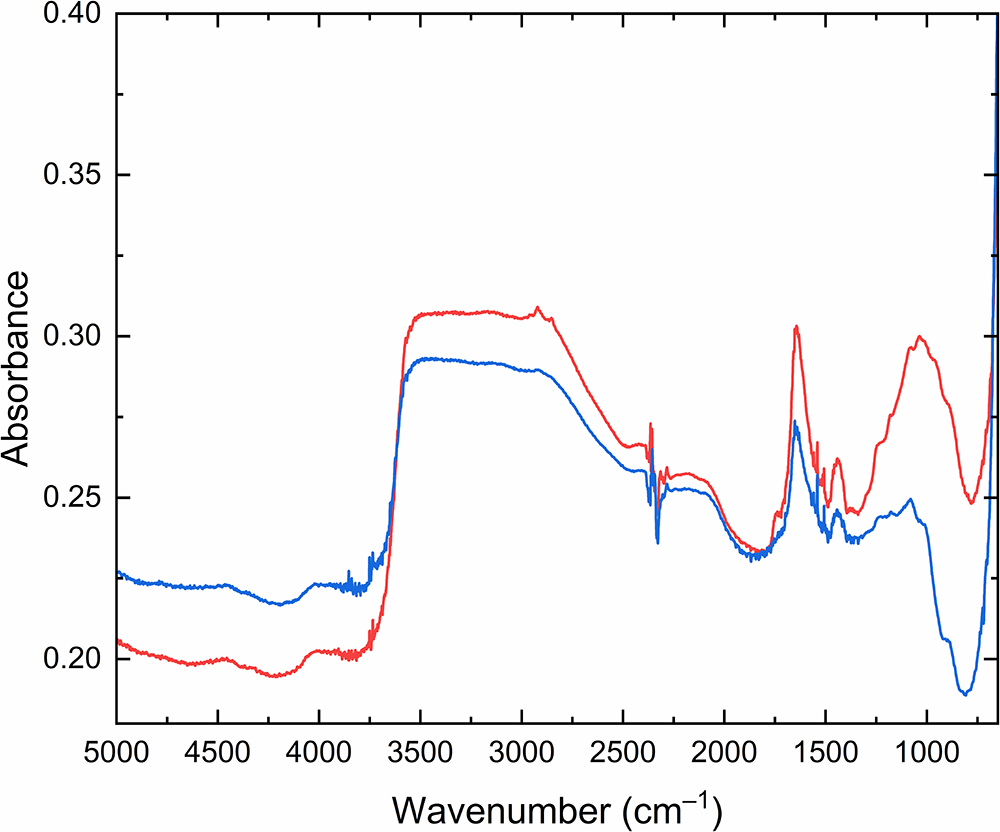
Spectral features are observed at 893sh, 1009sh, 1077, 1236w, 1442, 1644, ∼2700 to ∼3600, 3730w, 4023w, 4469w cm–1. The large band occurring between 2700 and 3600 cm–1 and the small peak at 3730 cm–1 can be interpreted as due to O–H stretching vibrations, while H–O–H bending vibrations can be observed at 1644 cm–1. A comparison with the spectrum of a hydrokenomicrolite single crystal (Fig. 3), collected under identical instrumental conditions, shows a weaker H2O bending mode band in kenomicrolite. This agrees with the lower amount of H2O groups in kenomicrolite compared to hydrokenomicrolite. Bands between 840 and 1240 cm–1 are probably related to Ta…O–H bending vibrations (Andrade et al., Reference Andrade, Atencio, Chukanov and Ellena2013a). Lastly, the weak bands above 4000 cm–1 can be ascribed to H2O combination modes.
Comparison between the FTIR spectra of kenomicrolite (blue) and hydrokenomicrolite (red).

Figure 3 Long description
The graph shows a comparison between FTIR spectra of two kenomicrolite and hydrokenmicrolite, represented by two curves. The red curve for kenomicrolite shows two major peaks around 1000 and 1500 then a broad shoudler between 2500 and 3500 when there is a dip. The blue curve for kenomicrolite follows a similar pattern but has slightly lower absrobance in the 1000 to 3500 range but higher in the >3500 range
Imbibition experiments in a Tl+-rich solution
KM2 was soaked for 5 days in a thallium(I) formate-deionised water solution having a concentration of 1M Tl+. SC-XRD data were collected before and after the imbibition experiment (Tables 2–3) as described above.
Discussion
Crystal chemistry of kenomicrolite
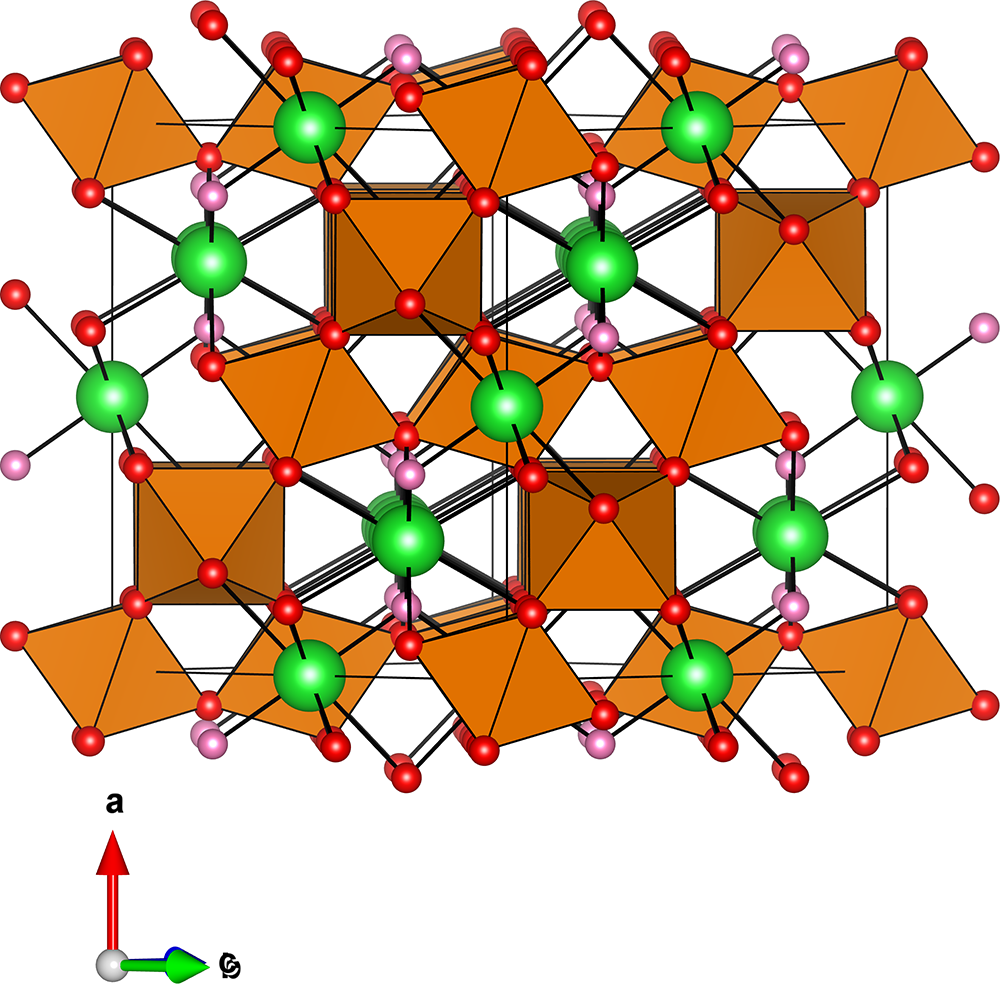
The crystal structure of kenomicrolite (Fig. 4) is topologically identical to that of other pyrochlore minerals crystallising in the space group type  $Fd\bar 3m$, showing a framework of corner-linked BX 6 octahedra that forms tunnels running parallel to [110]. The tunnels host the interstitial A and Y sites. In kenomicrolite, Ta is dominant at the B site, along with minor Nb, Sn, Si, Al and Ti. The A site has been found mainly vacant, having Ba as the most abundant cation (0.29 atoms per formula unit) accompanied by minor (≤ 0.03 apfu) Ce, U4+, Pb2+, Mn2+ and Sr. The total cationic population at this site is 0.39 apfu. In both crystals (KM and KM2), no H2O groups were observed at A, as the refined electron number (11.0 e – and 10.8 e –, respectively) matches well that calculated from microprobe data (11.5 e –), even without additional water. The Y site was also found to be dominated by structural vacancy: the number of electrons refined at this site was 3.6 e – for KM. Taking into account the contribution of minor F + K (∼0.8 e –), the remaining 2.8 e – were assigned to O, corresponding to 0.35 H2O pfu (the presence of which was confirmed by infrared spectroscopic analyses). For KM2, the number of electrons refined at Y was even lower, 1.8 e –, yielding 0.13 H2O pfu; this discrepancy can be explained considering the slight difference in totals for the different spots, ranging from 96.24 wt.% up to 99.08 wt.% (mean 97.84 wt.%). KM2 was handpicked in a part of the fragment particularly depleted in aqueous species. Potassium was assumed at Y due to the relatively large ionic radius and low charge (see Ercit et al., Reference Ercit, Černy and Hawthorne1993, Reference Ercit, Hawthorne and Černy1994). Finally, the charge balance was achieved by replacing O for (OH)– at the X site [O4.65(OH)1.35]Σ6.00.
Kenomicrolite crystal structure approximately down [110]. Symbols: orange octahedra = B; green spheres = A; red spheres = X; pink spheres = Y. The drawing was computed using VESTA (Momma and Izumi, Reference Momma and Izumi2011).

Figure 4 Long description
The octahedra are in space group Fd-3m with a framework of corner-linked BX6 octahedra. Ta fills the B site in the octahedra. The octahedra are arranged such that they create tunnels running parallel to [110] which host the insterstitial sites A and Y. The larger green spheres are in the tunnels, are site A, mostly vacant or with Ba. The smaller red spheres are linked to the octahedra and the A site. The smaller pink spheres are site Y, are linked to the green spheres and contain vacancies See text for full description.
Kenomicrolite displays a larger a parameter (10.5911(6) Å) than other zero-valent-dominant microlite-group minerals, e.g. hydroxykenomicrolite (a = 10.526(5) Å, formerly known as ‘cesstibtantite’; Ercit et al., Reference Ercit, Černy and Hawthorne1993; Atencio et al., Reference Atencio, Andrade, Christy, Gieré and Kartashov2010) or hydrokenomicrolite (a = 10.454(1) Å; Andrade et al., Reference Andrade, Atencio, Chukanov and Ellena2013a). The latter, however, shows a unit-cell parameter refined from powder XRD data much closer to that of kenomicrolite, namely 10.5733(9) Å; furthermore, a Pb-bearing microlite mineral with the A site dominated by H2O or vacancy was described by Zoppi (Reference Zoppi2004), having an a parameter of 10.569(1) Å. Among the hydrous pyrochlore-group minerals (thus having dominant Nb at B), the closest values are those of hydroxykenopyrochlore (a = 10.590(5) Å; Miyawaki et al., Reference Miyawaki, Momma, Matsubara, Sano, Shigeoka and Horiuchi2021) and hydropyrochlore (a = 10.54–10.60 Å; van Wambeke, Reference van Wambeke1978; Ercit et al., Reference Ercit, Hawthorne and Černy1994; Philippo et al., Reference Philippo, Naud, Declercq and Feneau-Dupont1995; Taddei et al., Reference Taddei, Bindi, Lepore, Skogby and Bonazzi2024). The numerous data available for hydropyrochlore (formerly named ‘kalipyrochlore’) make evident a marked variability of the unit cell in samples from the same locality, or even from the same fragment, possibly due to a certain degree of variability in composition. This could justify the slight difference observed between the unit-cell parameter of KM and that of KM2, which are reasonably similar anyway.
Small deviations in the crystal structure among different pyrochlore mineral species usually occur due to positional disorder at the tunnel sites, which could give rise to split sites located in the vicinity of the ideal A (½, ½, ½) and Y (⅜, ⅜, ⅜) positions. The comparison between the kenomicrolite structure and that of hydrokenomicrolite (Andrade et al., Reference Andrade, Atencio, Chukanov and Ellena2013a), fairly similar in composition, highlights one of the aforementioned differences: hydrokenomicrolite, containing relatively large amounts of H2O at both tunnel sites, shows a partially occupied site near Y (Y′, 32e). This slight displacement from the ideal Y position is, in principle, necessary to maintain a physically sound distance between the oxygens when H2O groups are simultaneously present at both A and Y (Ercit et al., Reference Ercit, Hawthorne and Černy1994). The distance between the two ideal positions is indeed ∼2.3 Å, too short for acceptable O–O separations. In kenomicrolite this displacement does not occur, consistent with the absence of H2O groups at A.
Ion-exchange properties of kenomicrolite
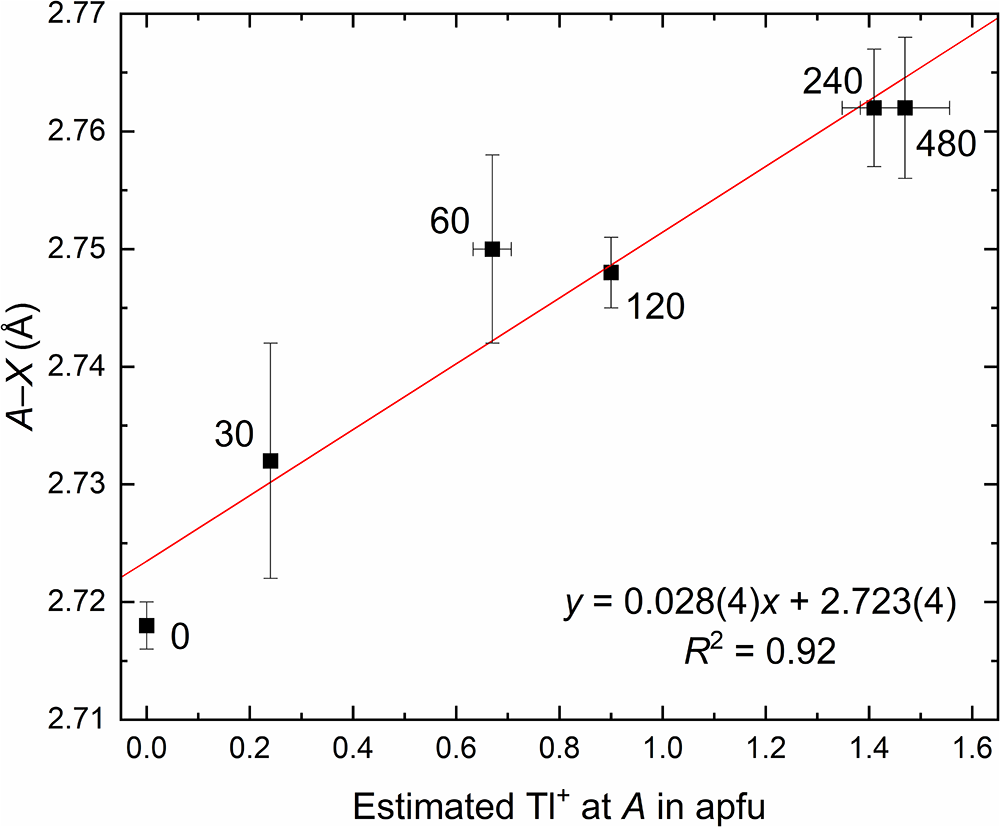
Pyrochlore minerals that host leachable cations (e.g. Na+, K+, etc.) or aqueous species (H2O, H3O+) at the tunnel sites, can usually show enhanced ion-exchange capacity, especially for large-radius, low-charge cations (e.g. Tl+). Taddei et al. (Reference Taddei, Bindi, Lepore, Skogby and Bonazzi2024) pointed out two possible Tl+ incorporation mechanisms, involving either (H2O + OH–) or H3O+. In kenomicrolite, none of the cations hosted at A and Y is monovalent (except a very minor amount of K+ at Y) and the water content in the structure is small and limited to the Y site; therefore, a poor ion-exchange capacity is expected for this mineral. Indeed, after the imbibition experiment in a Tl-rich solution, only a slight increase in electron density was observed at both the A (17.9 e–) and Y (2.9 e–) sites, corresponding to an incorporation of ∼0.16 Tl+ pfu at A and ∼0.03 Tl+ pfu at Y. Considering the ion-exchange mechanisms proposed by Taddei et al. (Reference Taddei, Bindi, Lepore, Skogby and Bonazzi2024), these values are consistent – within analytical error – with the total amount of H2O + K+ calculated for KM2, namely 0.14 apfu. Nevertheless, no substantial structural changes occur, in contrast with hydropyrochlore crystals subjected to the same imbibition experiments (Taddei et al., Reference Taddei, Bindi, Lepore, Skogby and Bonazzi2024). In hydropyrochlore, Tl+ incorporation induces an expansion of the unit cell due to the increase of the A–X distances, as Tl preferentially orders at the A site. However, hydropyrochlore can ideally host up to 1.75 apfu of water at both tunnel sites (Ercit et al., Reference Ercit, Hawthorne and Černy1994), making its ion-exchange capacity significantly greater; in fact, the amount of incorporated Tl+ can reach up to 1.40 apfu. The very small quantity of Tl+ incorporated in kenomicrolite is probably insufficient to produce measurable structural effects such as an increase of the A–X bond distances, as the observation of finer details would require better data quality (which is quite poor for these crystals, especially for KM2). Taddei and Bindi (Reference Taddei and Bindi2025) carried out a study on the kinetics of the Tl+ incorporation reaction in hydrokenopyrochlore, highlighting an almost linear correlation between the estimated incorporated Tl at A and the A–X distance (Fig. 5). Given that the A–X bond length of KM2 before the treatment is shorter than that of the hydrokenopyrochlore sample studied by Taddei and Bindi (Reference Taddei and Bindi2025), it was not possible to calculate how long the A–X bond should be after the incorporation of ∼0.16 Tl pfu at A using directly the equation in Fig. 5 [y = 0.028(4)x + 2.723(4)]. However, the extent of the lengthening of A–X consequent to the incorporation of the same amount of Tl for hydrokenopyrochlore (∼2‰) would correspond, considering the starting distance in KM2 (2.707 Å), to an expansion up to 2.712 Å, well within the error on the A–X bond length observed for KM2_Tl (Table 4).
Linear correlation between the estimated amount of Tl+ at the A site and the A–X distance, calculated using data from the hydrokenopyrochlore sample Hkpcl in Taddei and Bindi (Reference Taddei and Bindi2025). The numbers near the symbols indicate the duration (not cumulative) of the imbibition experiment in minutes; error bars that are not visible are contained within the data symbols.

Figure 5 Long description
Data points are plotted with error bars between 0 to 1.6 apfu. The A–X distance axis ranges from 2.71 to 2.77 angstroms. A red linear trend line is drawn with the equation y equals 0.028 times x plus 2.723 and R squared equals 0.92. The durations for each experiment are listed next to the datapoints. In order of increasing apfu and A-X distance, roughly following the best fit line, the data points are for durations of 0, 30, 60, 120, 240 and 480 minutes.
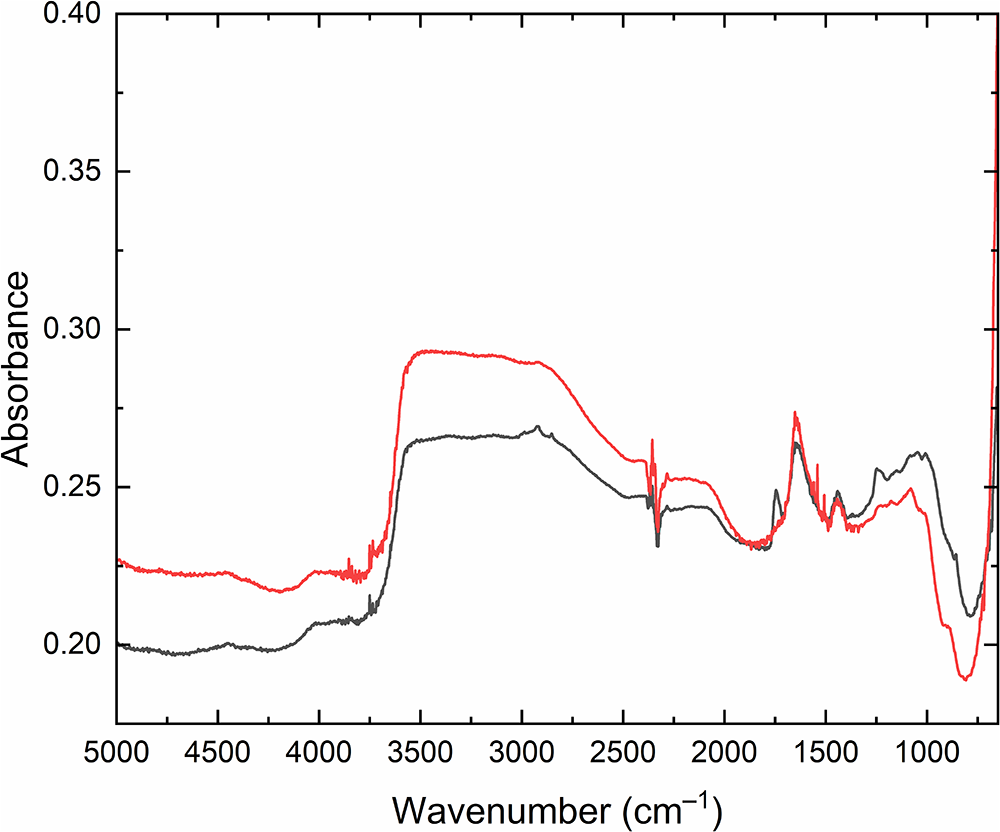
The hypothesis of a third reaction, based on the deprotonation of hydroxyl groups at X without water loss at Y (ATl+ + XO2– → A□ + XOH–), cannot be ruled out. In hydropyrochlore, water loss is necessary due to stereochemical constraints; conversely, in kenomicrolite, which has almost-empty tunnel sites, there are no such constraints and water is not required to exit the structure to accommodate Tl+. This mechanism appears to be supported by FTIR data collected on KM2 after the imbibition experiment (Fig. 6). The H2O bending-mode peak weakens slightly but remains visible, while the broad O–H stretching band decreases more significantly. The peak at 3730 cm–1, possibly attributable to the stretching of OH groups at X, weakens considerably and becomes barely distinguishable from background noise.
Comparison between the FTIR spectra of untreated kenomicrolite (red) and Tl-treated kenomicrolite (black).

Figure 6 Long description
The x-axis is labelled 'Wavenumber' in cm-1 , ranging from 5000 to 1000. The y-axis is labelled 'Absorbance', ranging from 0.20 to 0.40. Two curves are present: one in red representing untreated kenomicrolite and one in black representing Tl-treated kenomicrolite. The red curve shows higher absorbance at several points compared to the black curve, particularly around 3500 cm-1 and 1500 cm-1 but the overall trend is very similar for both.
In this scenario, the reaction should not be limited by the amount of OH–, as it occurs at X in much greater amounts than the Tl+ incorporated. The limited efficiency of this process, compared to those described by Taddei et al. (Reference Taddei, Bindi, Lepore, Skogby and Bonazzi2024), may be due to other factors such as the pH of the solution, P-T conditions, or even the absence of water, which could facilitate H+ loss. As for the latter factor, it seems that in pyrochlore-like structures, when hydrogen is present both as tunnel-site water and as OH groups at X, an intratunnel reaction may occur with an equilibrium of the type BM–XOH + A +YH2O ⇆ BM–O– + H3O+ (Slade et al., Reference Slade, Hall, Ramanan and Prince1996), potentially making H+ exchange easier in highly hydrated pyrochlore minerals, where both molecular water and hydroxyl groups are largely present.
Supplementary material
The supplementary material for this article can be found at https://doi.org/10.1180/mgm.2025.10144.
Acknowledgements
The authors acknowledge CRIST, Centro di Studi per la Cristallografia Strutturale, and LaMA, Laboratorio di MicroAnalisi, both pertaining to Università degli Studi di Firenze (Italy), for X-ray diffraction and electron microprobe measurements, respectively. Two anonymous referees are thanked for their insightful comments, which improved the manuscript. DA acknowledges FAPESP (Fundação de Amparo à Pesquisa do Estado de São Paulo) for financial support (process 2024/02850-6) and CNPq (Conselho Nacional de Desenvolvimento Científico e Tecnológico) for a research productivity scholarship (process 305656/2023-6).
Competing interests
The authors declare none.


 Open access

