

I. INTRODUCTION
Peterson et al. (Reference Peterson, Locock and Luth1995) observed unusual and large anisotropic displacement parameters for the O atom on a single position for morimotoite garnet from Ice River. So, they modeled a split position for the O atom and used isotropic displacement parameters. The reason for these unusual displacement parameters was attributed to different size Si and Fe atoms on the tetrahedral site. Attempts were made to show that the SiO4 and the O4H4 tetrahedra in hydrogarnets have different sizes by also using a “split O-atom position” model, which was also used to explain the unusual anisotropic displacement ellipsoid of the O atom that elongate along the “Si–O” bond instead of right angles to this bond direction (e.g. Figure 2 in Armbruster, Reference Armbruster1995; Figure 2 in Ferro et al., Reference Ferro, Galli, Papp, Quartieri, Szakall and Vezzalini2003). These unusual features of the O-atom displacement ellipsoid may be the result of multi-phase intergrowths and are investigated in this study with regard to morimotoite and have implications for hydrogarnets.
Recently, we proposed that a multi-phase intergrowth of two or three cubic phases with slightly different structural (and chemical) parameters gives rise to strain arising from structural mismatch, and that this strain is the cause of the anisotropy in cubic garnets (Antao, Reference Antao2013a, Reference Antao2013b, Reference Antao2013c; Antao and Klincker, Reference Antao and Klincker2013a, Reference Antao and Klincker2013b; Antao and Round, Reference Antao and Round2014). This explanation is tested further in this study for morimotoite because Ti-rich andradites are known to be birefringent, but their structures were refined in the cubic space group (e.g. Armbruster et al., Reference Armbruster, Birrer, Libowitzky and Beran1998).
The crystal structure of many members of the garnet group have been refined (e.g. Novak and Gibbs, Reference Novak and Gibbs1971; Lager et al., Reference Lager, Armbruster, Rotella and Rossman1989; Armbruster and Geiger, Reference Armbruster and Geiger1993). The general formula for garnet is [8]X3
[6]Y2
[4]Z3
[4]O12, Z=8, space group $Ia\overline 3 d$
, where the eight-coordinated dodecahedral X site contains Mg2+, Ca2+, Mn2+, or Fe2+ cations, the six-coordinated octahedral Y site contains Al3+, Cr3+, Fe3+, Ti4+, or Zr4+ cations, and the four-coordinated tetrahedral Z site contains Si4+, Fe3+, or Al3+ cations, or (O4H4) (e.g. Armbruster et al., Reference Armbruster, Birrer, Libowitzky and Beran1998). The structure of garnet consists of alternating ZO4 tetrahedra and YO6 octahedra with X atoms filling cavities to form XO8 dodecahedra. The eight O atoms in the XO8 dodecahedron occur at the corners of a distorted cube.
$Ia\overline 3 d$
, where the eight-coordinated dodecahedral X site contains Mg2+, Ca2+, Mn2+, or Fe2+ cations, the six-coordinated octahedral Y site contains Al3+, Cr3+, Fe3+, Ti4+, or Zr4+ cations, and the four-coordinated tetrahedral Z site contains Si4+, Fe3+, or Al3+ cations, or (O4H4) (e.g. Armbruster et al., Reference Armbruster, Birrer, Libowitzky and Beran1998). The structure of garnet consists of alternating ZO4 tetrahedra and YO6 octahedra with X atoms filling cavities to form XO8 dodecahedra. The eight O atoms in the XO8 dodecahedron occur at the corners of a distorted cube.
This study examines the crystal structure of a morimotoite, {Ca2.91Mg0.05Mn2+ 0.03}Σ3[Ti1.09Fe3+ 0.46Fe2+ 0.37Mg0.08]Σ2(Si2.36Fe3+ 0.51Al0.14)Σ3O12, from Ice River using high-resolution powder X-ray diffraction (HRPXRD) data that show a two-phase intergrowth that causes strain, which gives rise to low optical anisotropy. Moreover, a refinement of a single-phase model with anisotropic displacement parameters shows no unusual features for the O atom that requires a “split O-atom position” model.
II. EXPERIMENTAL
A. Sample characterization and electron-microprobe analysis (EMPA)
The black morimotoite sample is from the Ice River alkaline intrusive complex, Yoho National Park, British Columbia, Canada. The same sample was studied by Locock et al. (Reference Locock, Luth, Cavell, Smith and Duke1995) and Peterson et al. (Reference Peterson, Locock and Luth1995). A thin section of the sample shows weak optical anisotropy under cross-polarized light.
The morimotoite sample was analyzed with a JEOL JXA-8200 wavelength-dispersive (WD)–ED electron-microprobe analyzer. The JEOL operating program on a Solaris platform was used for ZAF (atomic number, absorption, fluorescence) correction and data reduction. The WD operating conditions were 15 kV, 20 nA, 5 μm beam diameter, and using various standards [almandine-pyrope (MgKα), grossular (CaKα), almandine (FeKα, AlKα, SiKα), rutile (TiKα), spessartine (MnKα), and chromite (CrKα)]. The sample appeared homogeneous based on optical observations and EMPA results of eight spots from different areas of a crystal with a diameter of about 2 mm. The EMPA data were analyzed using the spreadsheet developed by Locock (Reference Locock2008) and the average chemical composition is given (Table I).
EMPA results for morimotoite.
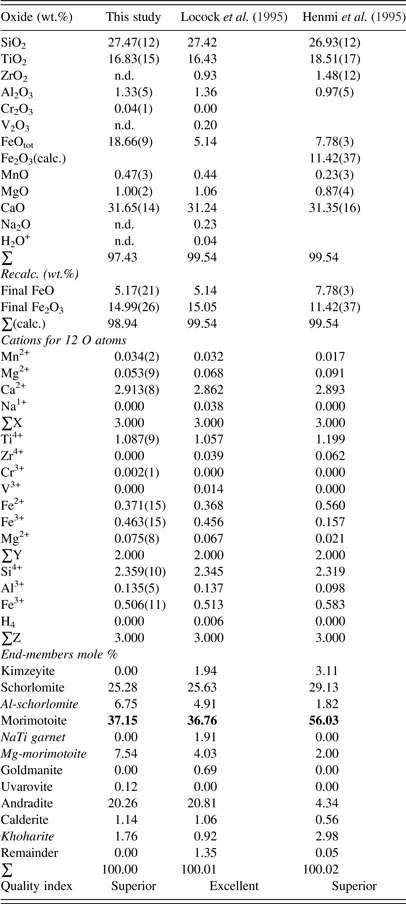
Numbers in bold indicate the dominant end-member morimotoite, ideally Ca3(Ti4+Fe2+)Si3O12, so all three samples are called morimotoite.
B. Synchrotron HRPXRD
The morimotoite sample was studied by HRPXRD that was performed at beamline 11-BM, Advanced Photon Source, Argonne National Laboratory. A small fragment (about 2 mm in diameter) of the sample was crushed to a fine powder using an agate mortar and pestle. The crushed sample was loaded into a Kapton capillary (0.8 mm internal diameter) and rotated during the experiment at a rate of 90 rotations per second. The data were collected at 23 °C to a maximum 2θ of about 50 with a step size of 0.001° and a step time of 0.1 s per step. The HRPXRD trace was collected with 12 silicon (111) crystal analyzers that reduce the angular range to be scanned and allow rapid acquisition of data. A silicon (NIST 640c) and alumina (NIST 676a) standard (ratio of ⅓ Si:⅔ Al2O3 by weight) was used to calibrate the instrument and refine the monochromatic wavelength used in the experiment (see Table II). Additional details of the experimental setup are given elsewhere (Antao et al., Reference Antao, Hassan, Wang, Lee and Toby2008; Lee et al., Reference Lee, Shu, Ramanathan, Preissner, Wang, Beno, Von Dreele, Ribaud, Kurtz, Antao, Jiao and Toby2008; Wang et al., Reference Wang, Toby, Lee, Ribaud, Antao, Kurtz, Ramanathan, Von Dreele and Beno2008).
HRPXRD data and Rietveld refinement statistics for morimotoite.
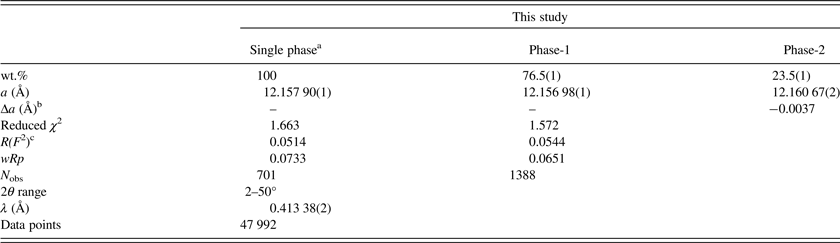
aBased on anisotropic displacement parameters.
bThe strain and birefringence are proportional to Δa = (a dominant phase−a minor phase) (Kitamura and Komatsu, Reference Kitamura and Komatsu1978).
c R(F 2) = overall R-structure factor based on observed and calculated structure amplitudes = [∑(F o 2 −F c 2)/∑(F o 2)]1/2.
C. Rietveld structure refinements
The HRPXRD data were analyzed by the Rietveld (Reference Rietveld1969) method, as implemented in the GSAS program (Larson and Von Dreele, Reference Larson and Von Dreele2000), and using the EXPGUI interface (Toby, Reference Toby2001). Scattering curves for neutral atoms were used. The starting atom coordinates, cell parameter, and space group, $Ia\overline 3 d$
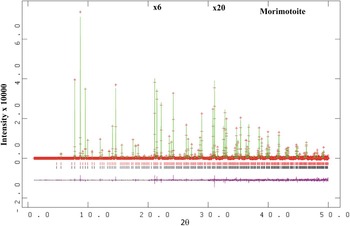
, were taken from Peterson et al. (Reference Peterson, Locock and Luth1995). The background was modeled using a Chebyschev polynomial (eight terms). The reflection-peak profiles were fitted using type-3 profile in the GSAS program. A full-matrix least-squares refinement was carried out by varying the parameters in the following sequence: a scale factor, unit-cell parameter, atom coordinates, and isotropic displacement parameters. Examination of the HRPXRD trace for morimotoite shows the presence of two separate phases with slightly different unit-cell parameters (Figures 1 and 2). Both the HRPXRD trace and the Rietveld refinement statistics indicate that the two-phase model is preferred over the single-phase model (Table II). The two separate phases were refined together with the site occupancy factors (sofs) in terms of the dominant Ca, Ti, and Si atoms in the corresponding X, Y, and Z sites. Toward the end of the refinement, all the parameters were allowed to vary simultaneously, and the refinement proceeded to convergence. A single-phase model was also refined using anisotropic displacement parameters to check for unusual O-atom features that were reported by Peterson et al. (Reference Peterson, Locock and Luth1995).
$Ia\overline 3 d$
, were taken from Peterson et al. (Reference Peterson, Locock and Luth1995). The background was modeled using a Chebyschev polynomial (eight terms). The reflection-peak profiles were fitted using type-3 profile in the GSAS program. A full-matrix least-squares refinement was carried out by varying the parameters in the following sequence: a scale factor, unit-cell parameter, atom coordinates, and isotropic displacement parameters. Examination of the HRPXRD trace for morimotoite shows the presence of two separate phases with slightly different unit-cell parameters (Figures 1 and 2). Both the HRPXRD trace and the Rietveld refinement statistics indicate that the two-phase model is preferred over the single-phase model (Table II). The two separate phases were refined together with the site occupancy factors (sofs) in terms of the dominant Ca, Ti, and Si atoms in the corresponding X, Y, and Z sites. Toward the end of the refinement, all the parameters were allowed to vary simultaneously, and the refinement proceeded to convergence. A single-phase model was also refined using anisotropic displacement parameters to check for unusual O-atom features that were reported by Peterson et al. (Reference Peterson, Locock and Luth1995).
(Color online) HRPXRD trace for morimotoite (two-phase model) together with the calculated (continuous line) and observed (crosses) profiles. The difference curve (I obs −I calc) is shown at the bottom. The short vertical lines indicate allowed reflection positions. The intensities for the trace and difference curve that are above 20° and 30° 2θ are multiplied by factors of 6 and 20, respectively.
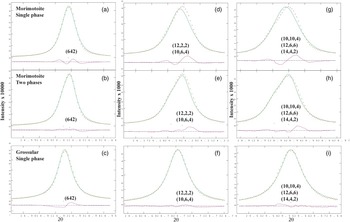
(Color online) A comparison of the same reflections in morimotoite and grossular. Parts (a), (d), and (g) are morimotoite data fitted using a single phase. Parts (b), (e), and (h) are morimotoite data fitted using two phases. Parts (c), (f), and (i) are grossular data fitted using a single phase for comparison (Antao, Reference Antao2013a). The two phases for morimotoite fit the data best and matches the left shoulder on the high-angle peaks. The peaks in grossular are narrower than those in morimotoite.
The cell parameters and the Rietveld refinement statistics for the single- and two-phase models are listed in Table II. Atom coordinates, isotropic displacement parameters, and sofs are given in Table III. Anisotropic displacement parameters for the single-phase model are given in Table IV. Bond distances are given in Table V.
Atom coordinates a , isotropic displacement parameters (U, Å2 ) b , and sofs for morimotoite.
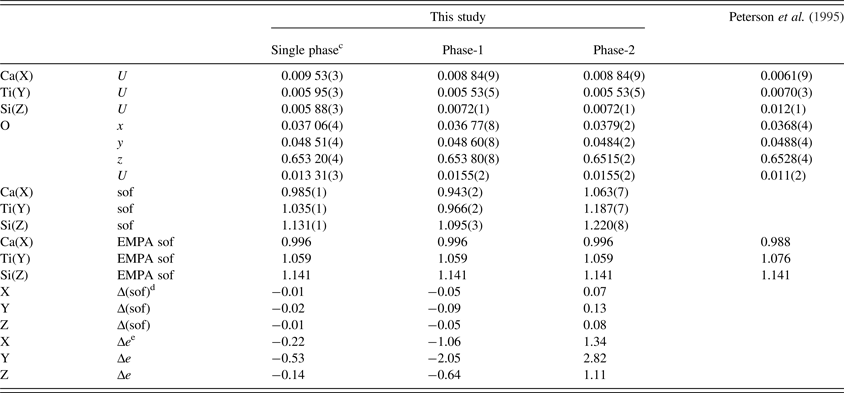
a X at (0, ¼, ⅛), Y at (0, 0, 0), and Z at (⅜, 0, ¼). The O(sof) = 1 in all cases.
b U parameter for the same site in phases 1 and 2 were constrained to be equal.
cData are from a refinement using isotropic displacement parameters.
dΔ(sof) = sof (HRPXRD refinement)−sof (EMPA).
eΔe = electrons (HRPXRD refinement)−electrons (EMPA).
Anisotropic displacement parameters (Å2) for single-phase morimotoite.

Selected distances (Å) and angle (°) for morimotoite.
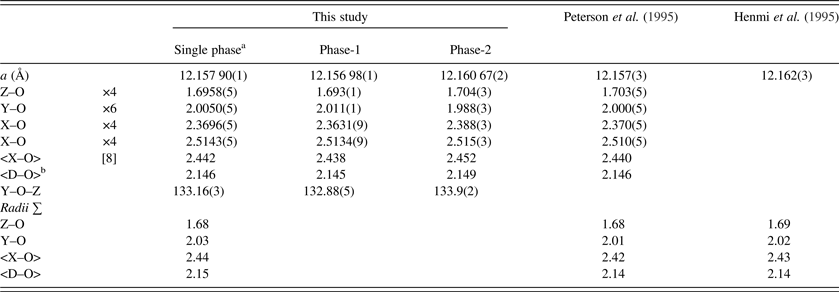
aData are from a refinement using isotropic displacement parameters.
b<D–O> = {(Z–O) + (Y–O) + (X–O) + (X′–O)}/4. For the calculated bond distances, the following radii from Shannon (Reference Shannon1976) were used (X site: Mn2+ = 0.96, Mg2+ = 0.89 Å; Y site: Ti4+ = 0.605, Cr3+ = 0.615, Fe2+ = 0.78, Fe3+ = 0.645, Mg2+ = 0.72 Å; Z site: Si4+ = 0.26, Al3+ = 0.39, Fe3+ = 0.49 Å). Ca2+ = 1.06 Å instead of 1.12 Å; this gives more realistic <X–O> distances.
III. RESULTS AND DISCUSSION
The composition for the Ice River sample, {Ca2.91Mg0.05Mn2+ 0.03}Σ3[Ti1.09Fe3+ 0.46Fe2+ 0.37Mg0.08]Σ2(Si2.36Fe3+ 0.51Al0.14)Σ3O12, shows the distribution of the atoms in the three cation sites indicated by the general formula [8]X3 [6]Y2 [4]Z3 [4]O12 (Table I). Using the data from Locock et al. (Reference Locock, Luth, Cavell, Smith and Duke1995) and recalculating the cation content using the spreadsheet from Locock (Reference Locock2008), their composition, {Ca2.86Mg0.07Na0.04Mn2+ 0.03}Σ3[Ti1.06Fe3+ 0.46Fe2+ 0.37Mg0.07Zr0.04V0.01]Σ2(Si2.35Fe3+ 0.51Al0.14)Σ3O12, is similar to that obtained in this study, as expected (Table I). Similarly, the composition, {Ca2.89Mg0.09Mn2+ 0.02}Σ3[Ti1.20Fe3+ 0.16Fe2+ 0.56Mg0.02Zr0.06]Σ2(Si2.32Fe3+ 0.58Al0.10)Σ3O12, was obtained for the type material from Japan (Henmi et al., Reference Henmi, Kusachi and Henmi1995). The ideal end-member formula for morimotoite is Ca3(Ti4+Fe2+)Si3O12, which is the dominant component in the chemical analysis, so all three samples are called morimotoite (Table I). The Ice River sample was previously called schorlomite (Peterson et al., Reference Peterson, Locock and Luth1995; Locock, Reference Locock2008). However, the dominant component in Table I is morimotoite, which is the name used in this study and in Grew et al. (Reference Grew, Locock, Mills, Galuskina, Galuskin and Hålenius2013).
The reduced χ 2 and overall R(F 2) Rietveld refinement values are 1.572 and 0.0544, respectively, for the two-phase model and they are similar to those for the single-phase model (Table II). The sofs obtained from the refinement are similar to those calculated from the EMPA results (Table III). The bond distances calculated from the atom radii are similar to those obtained from the Rietveld structure refinements (Table V).
The unit-cell parameter for the Ice River sample [a = 12.157 90(1) Å] is smaller than a = 12.162(3) (Å) for the type-material morimotoite from Japan (Henmi et al., Reference Henmi, Kusachi and Henmi1995), for which no structural data are available. However, the bond distances calculated from the atom radii are similar to the other samples (Table V). The reason for the larger cell for the type material seems to be the larger amount of Fe2+ in the Y site and the slightly longer cation–O distances (Table V).
The single-crystal results from Peterson et al. (Reference Peterson, Locock and Luth1995) using one O-atom position for the same morimotoite sample matches the single-phase HRPXRD results from this study (Table V). However, Peterson et al. (Reference Peterson, Locock and Luth1995) observed unusual displacement parameters for the O atom with its displacement ellipsoid elongated along the “Si–O” bond. So, they modeled a split position for the O atom. Attempts were also made to show that the SiO4 and the O4H4 tetrahedra in hydrogarnets have different sizes by using a “split O-atom position” model, which was used to explain the unusual displacement ellipsoid of the O atom that also elongates along the “Si–O” bond (e.g. Lager et al., Reference Lager, Armbruster and Faber1987; Armbruster and Lager, Reference Armbruster and Lager1989; Ferro et al., Reference Ferro, Galli, Papp, Quartieri, Szakall and Vezzalini2003).
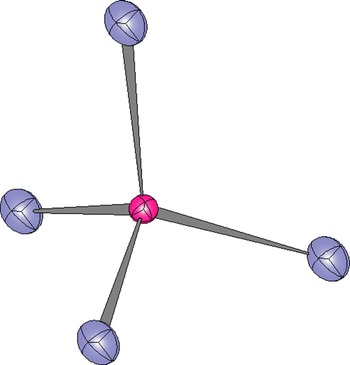
A single-phase model for the Ice River sample was refined using anisotropic displacement parameters to test the “split O-atom position” hypothesis (Table IV). No unusual O-atom features were observed, as shown by the tetrahedral coordination of the Z site by O atoms (Figure 3). The displacement parameter for the Z site is about the same as that for the Y site and both are smaller than that for the X site (Table III). However, Peterson et al. (Reference Peterson, Locock and Luth1995) obtained displacement parameters for the Z site that are larger than those of the X and Y sites, which is usual (Table III). It is possible that multi-phase intergrowths may give rise to unusual ellipsoids for the O atom, if the unit-cell parameters for the phases are quite different from each other (e.g. Koritnig et al., Reference Koritnig, Rösch, Schneider and Seifert1978; Antao, Reference Antao2013c), which is not the case in this study.
(Color online) Tetrahedral coordination of the Z site showing that the O atoms are not elongated along the “Si–O” bond direction, as was found by Peterson et al. (Reference Peterson, Locock and Luth1995).
The sample used in this study may contain a two-phase intergrowth instead of a single phase. The same reflections are compared for: (1) a single-phase [Figures 2(a), 2(d), and 2(g)]; (2) a two-phase [Figures 2(b), 2(e), and 2(h)]; and (3) a single-phase grossular [Figures 2(c), 2(f), and 2(i); data from Antao, Reference Antao2013a]. No significant differences are observed for the low-angle peak near 14.9°. However, from the two high-angle peaks [near 24° and 29° 2θ in Figures 2(e) and 2(h)], it appears that the Ice River sample is a two-phase intergrowth. The trace for grossular contains only one peak for each reflection [Figures 2(c), 2(f), and 2(i)]. The two phases in morimotoite have slightly different unit-cell parameters: a = 12.156 98(1) for phase-1 and a = 12.160 67(2) for phase-2. Although splitting of the reflections is difficult to observe in this study, they are easily observed in other studies (e.g. Koritnig et al., Reference Koritnig, Rösch, Schneider and Seifert1978; Antao, Reference Antao2013c). The residuals in the difference curves probably indicate a small amount of a third morimotoite phase with a slightly smaller unit-cell parameter, which was not modeled (Figure 2).
Because the two phases are quite similar to each other, there are some correlations between the structural parameters in the two-phase refinement. Therefore, the isotropic displacement parameters for atoms in the same site were constrained to be equal to each other, and the profile parameters for both phases were also constrained to be the same. Because of the profile constraint, sample size and strain information could not be obtained for this sample. However, in other garnet samples, such information was obtained (Antao, Reference Antao2013a, Reference Antao2013c).
The crystal structure of morimotoite can be rationalized using bond-valence sums (BVS) calculated in valence units (v.u.) (Wills and Brown, Reference Wills and Brown1999). For the isotropic refinement using a single phase (Table V), the BVS for the Ca atom at the X site is 2.26 v.u., so the Ca atom is a bit large for the X site. For Ti4+ at the Y site, the BVS is 3.59 v.u. and this site also contains Fe3+ and Fe2+ cations. The BVS for Si atom at the Z site is 3.44 v.u., which is reasonable because there are some Al and Fe2+ cations in this site (Table I). The BVS for the O atom is 1.95 instead of 2 v.u., which is reasonable.
It is possible that formation of a two-phase intergrowth of morimotoite in Si-deficient rocks may be related to changes in oxygen fugacity (f O2), activity of SiO2 (a SiO2), etc., as the crystals grow at low temperature that prevents diffusion or homogenization of the cations. The two phases cause strain that arises from structural mismatch and gives rise to optical anisotropy, as was found in other garnets (Antao, Reference Antao2013a, Reference Antao2013b, Reference Antao2013c; Antao and Klincker, Reference Antao and Klincker2013a, Reference Antao and Klincker2013b; Antao and Round, Reference Antao and Round2014). The two-phase intergrowth in morimotoite may be similar to epitaxial intergrowths because of the similarity of the structural and chemical parameters (Kitamura and Komatsu, Reference Kitamura and Komatsu1978). However, the small differences between the two phases give rise to structural mismatch that results in strain and low optical anisotropy.
ACKNOWLEDGEMENTS
The Editor J. Kaduk and three anonymous reviewers are thanked for their helpful comments on this manuscript. A. Locock is thanked for providing the Ice River sample. R. Marr is thanked for his help with the EMPA data collection. The HRPXRD data were collected at the X-ray Operations and Research beamline 11-BM, Advanced Photon Source (APS), Argonne National Laboratory (ANL). Use of the APS was supported by the US Department of Energy, Office of Science, Office of Basic Energy Sciences, under contract number DE-AC02-06CH11357. This work was supported with a NSERC Discovery Grant.



